


A Review of Atmospheric Aerosols in Antarctica: From Characterization to Data Processing

 ,
, 
 ,
,  , , ,
, , , 
Abstract
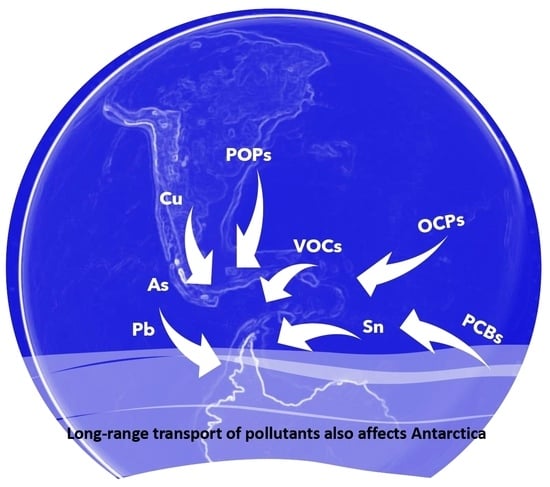
1. Introduction
2. Different Types of Aerosols Detected in Antarctica
2.1. Organic Compounds
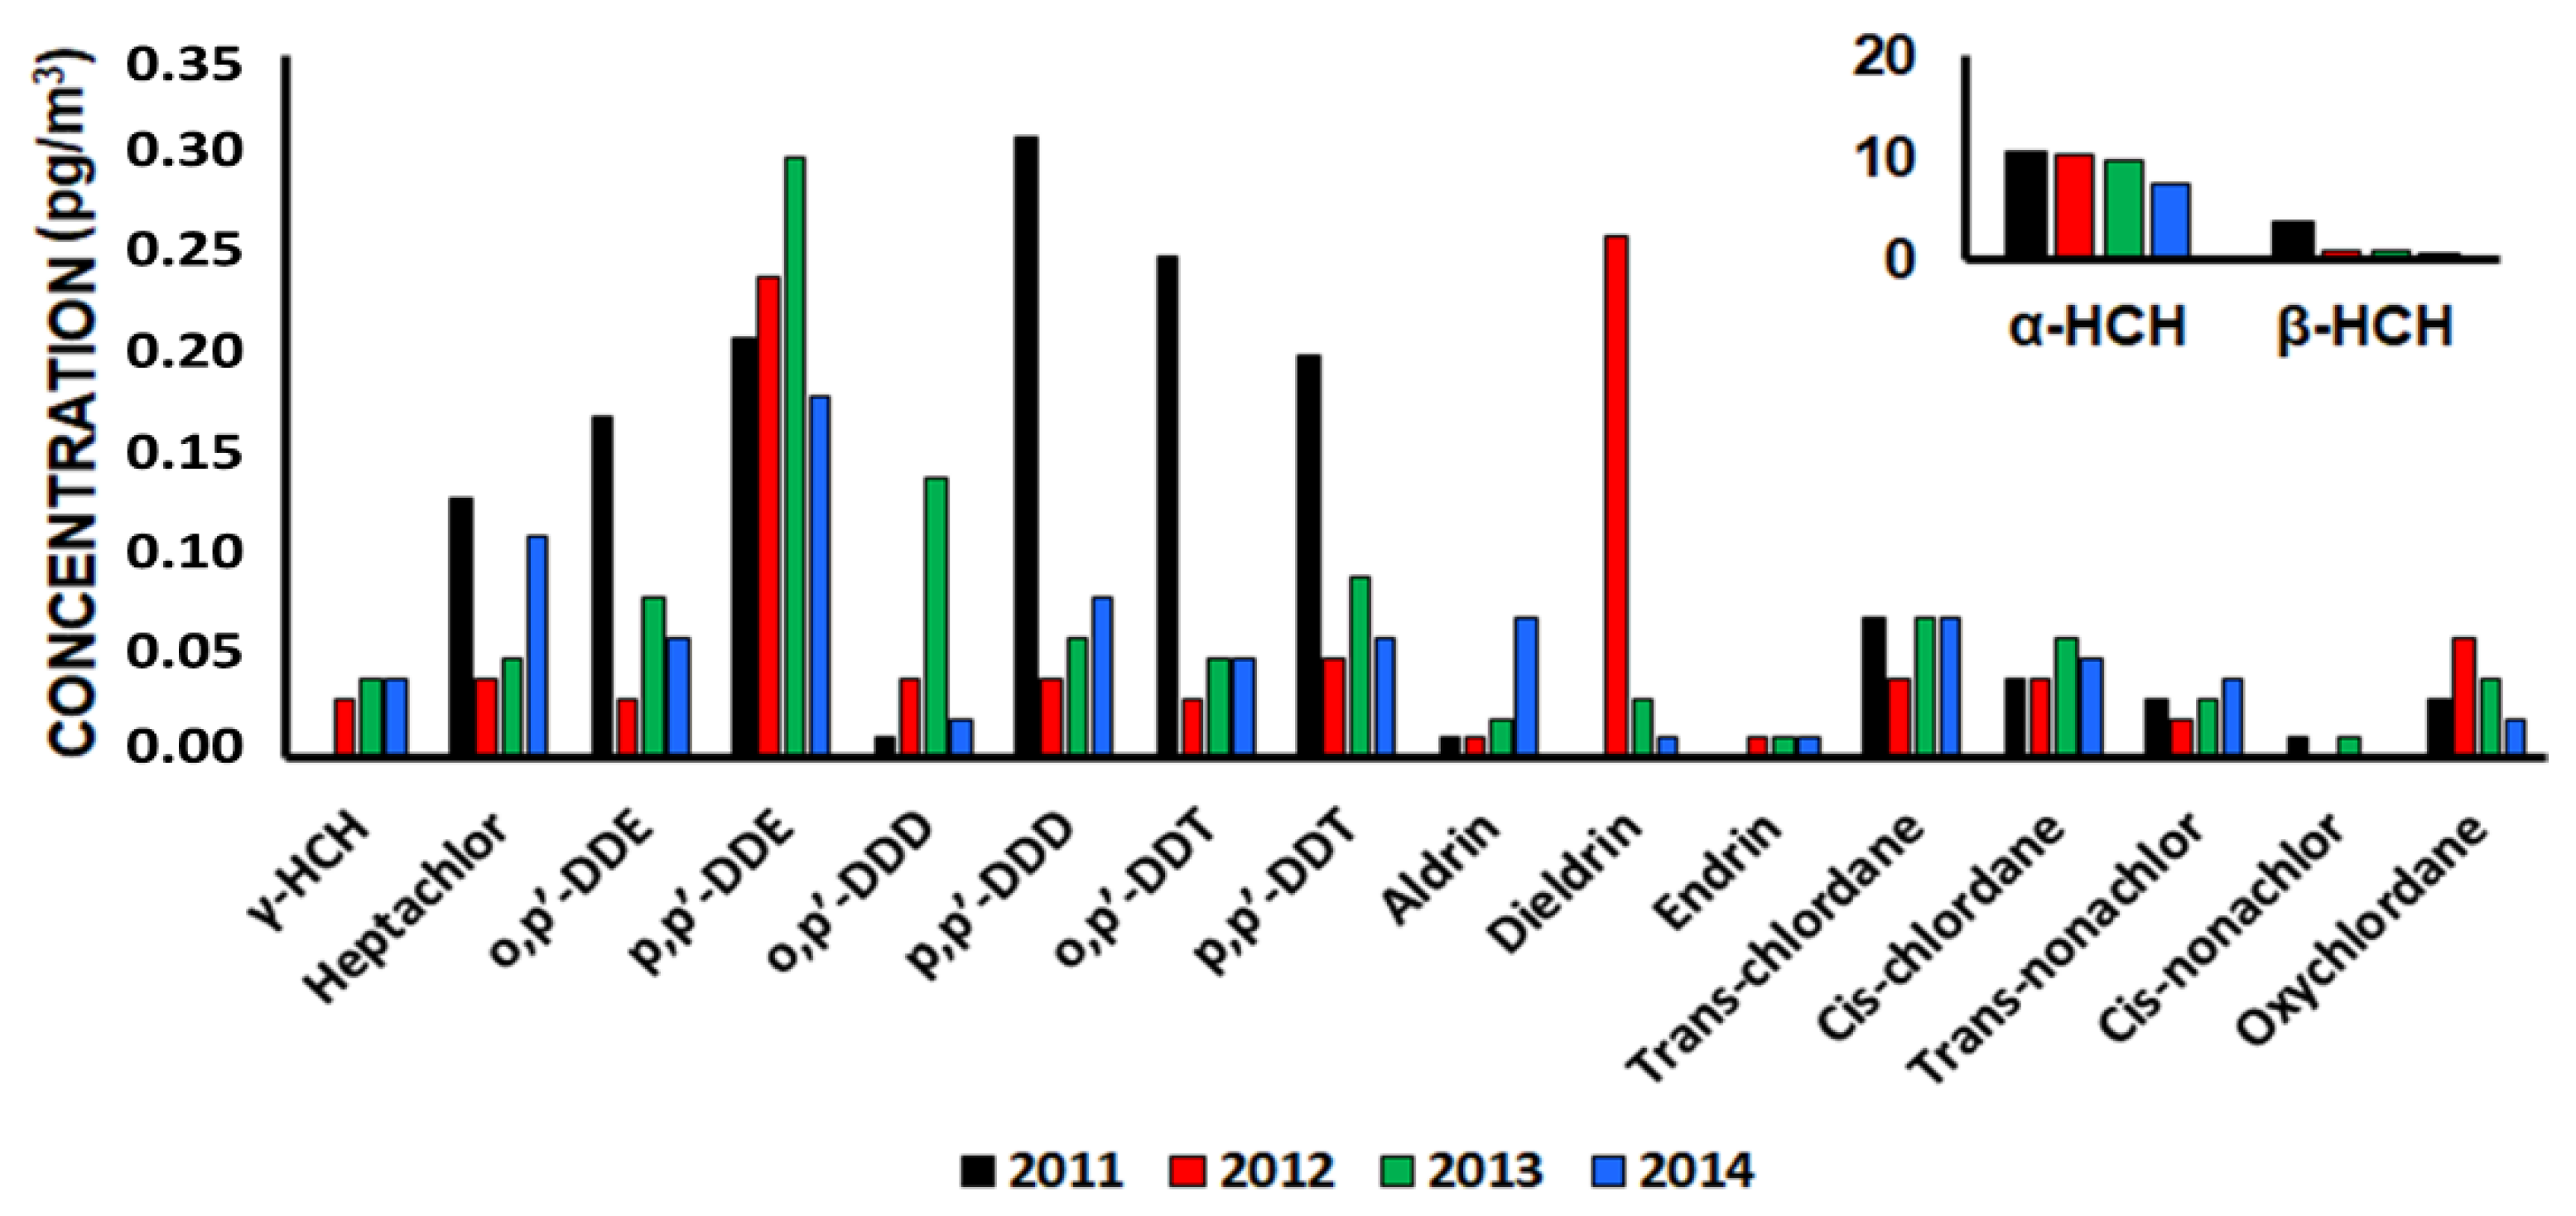
2.1.1. Organochlorine Pesticides (OCPs)
2.1.2. Polychlorinated Biphenyls (PCBs)
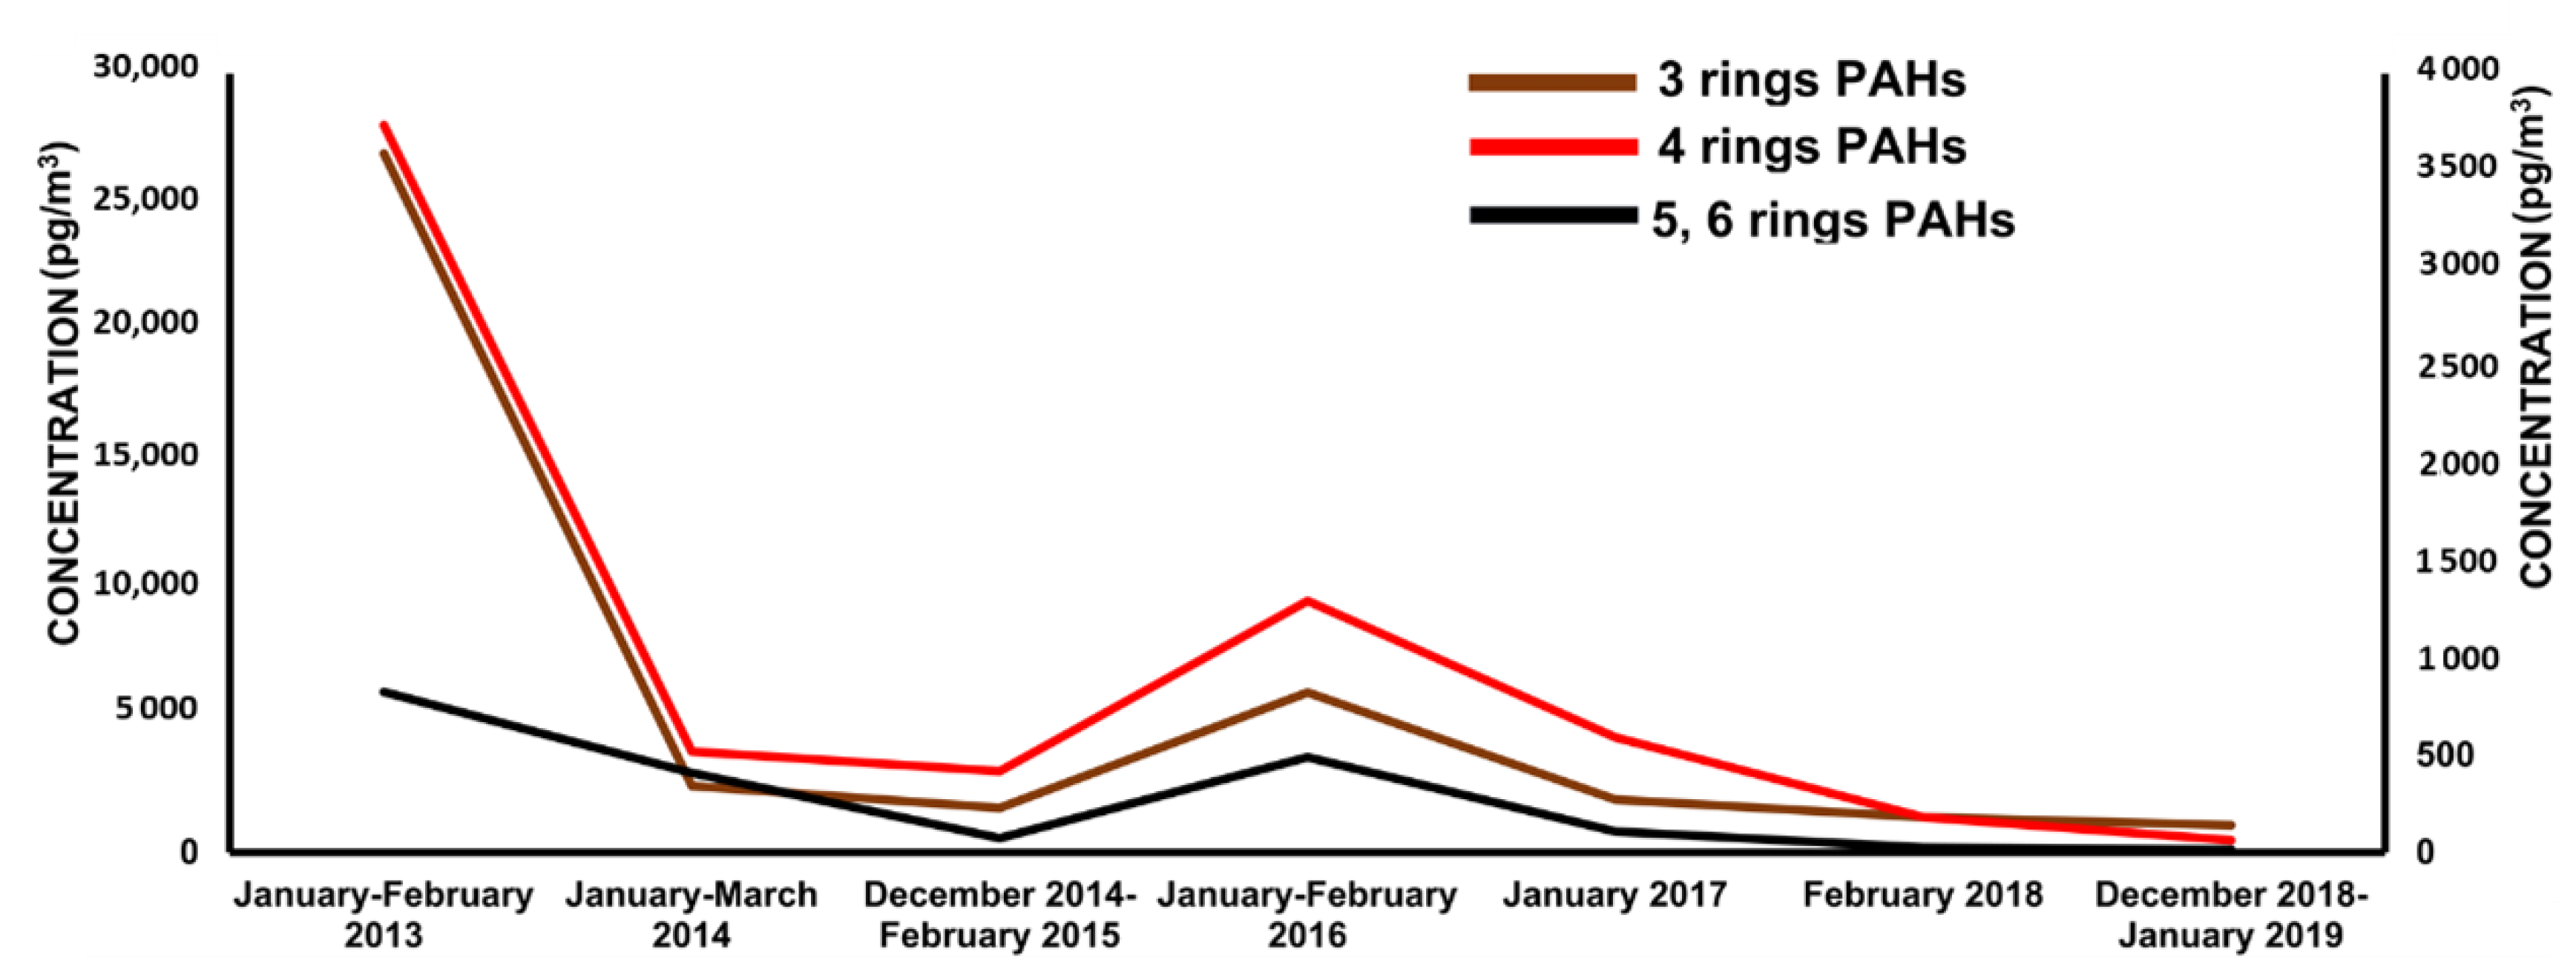
2.1.3. Polycyclic Aromatic Hydrocarbons (PAHs)
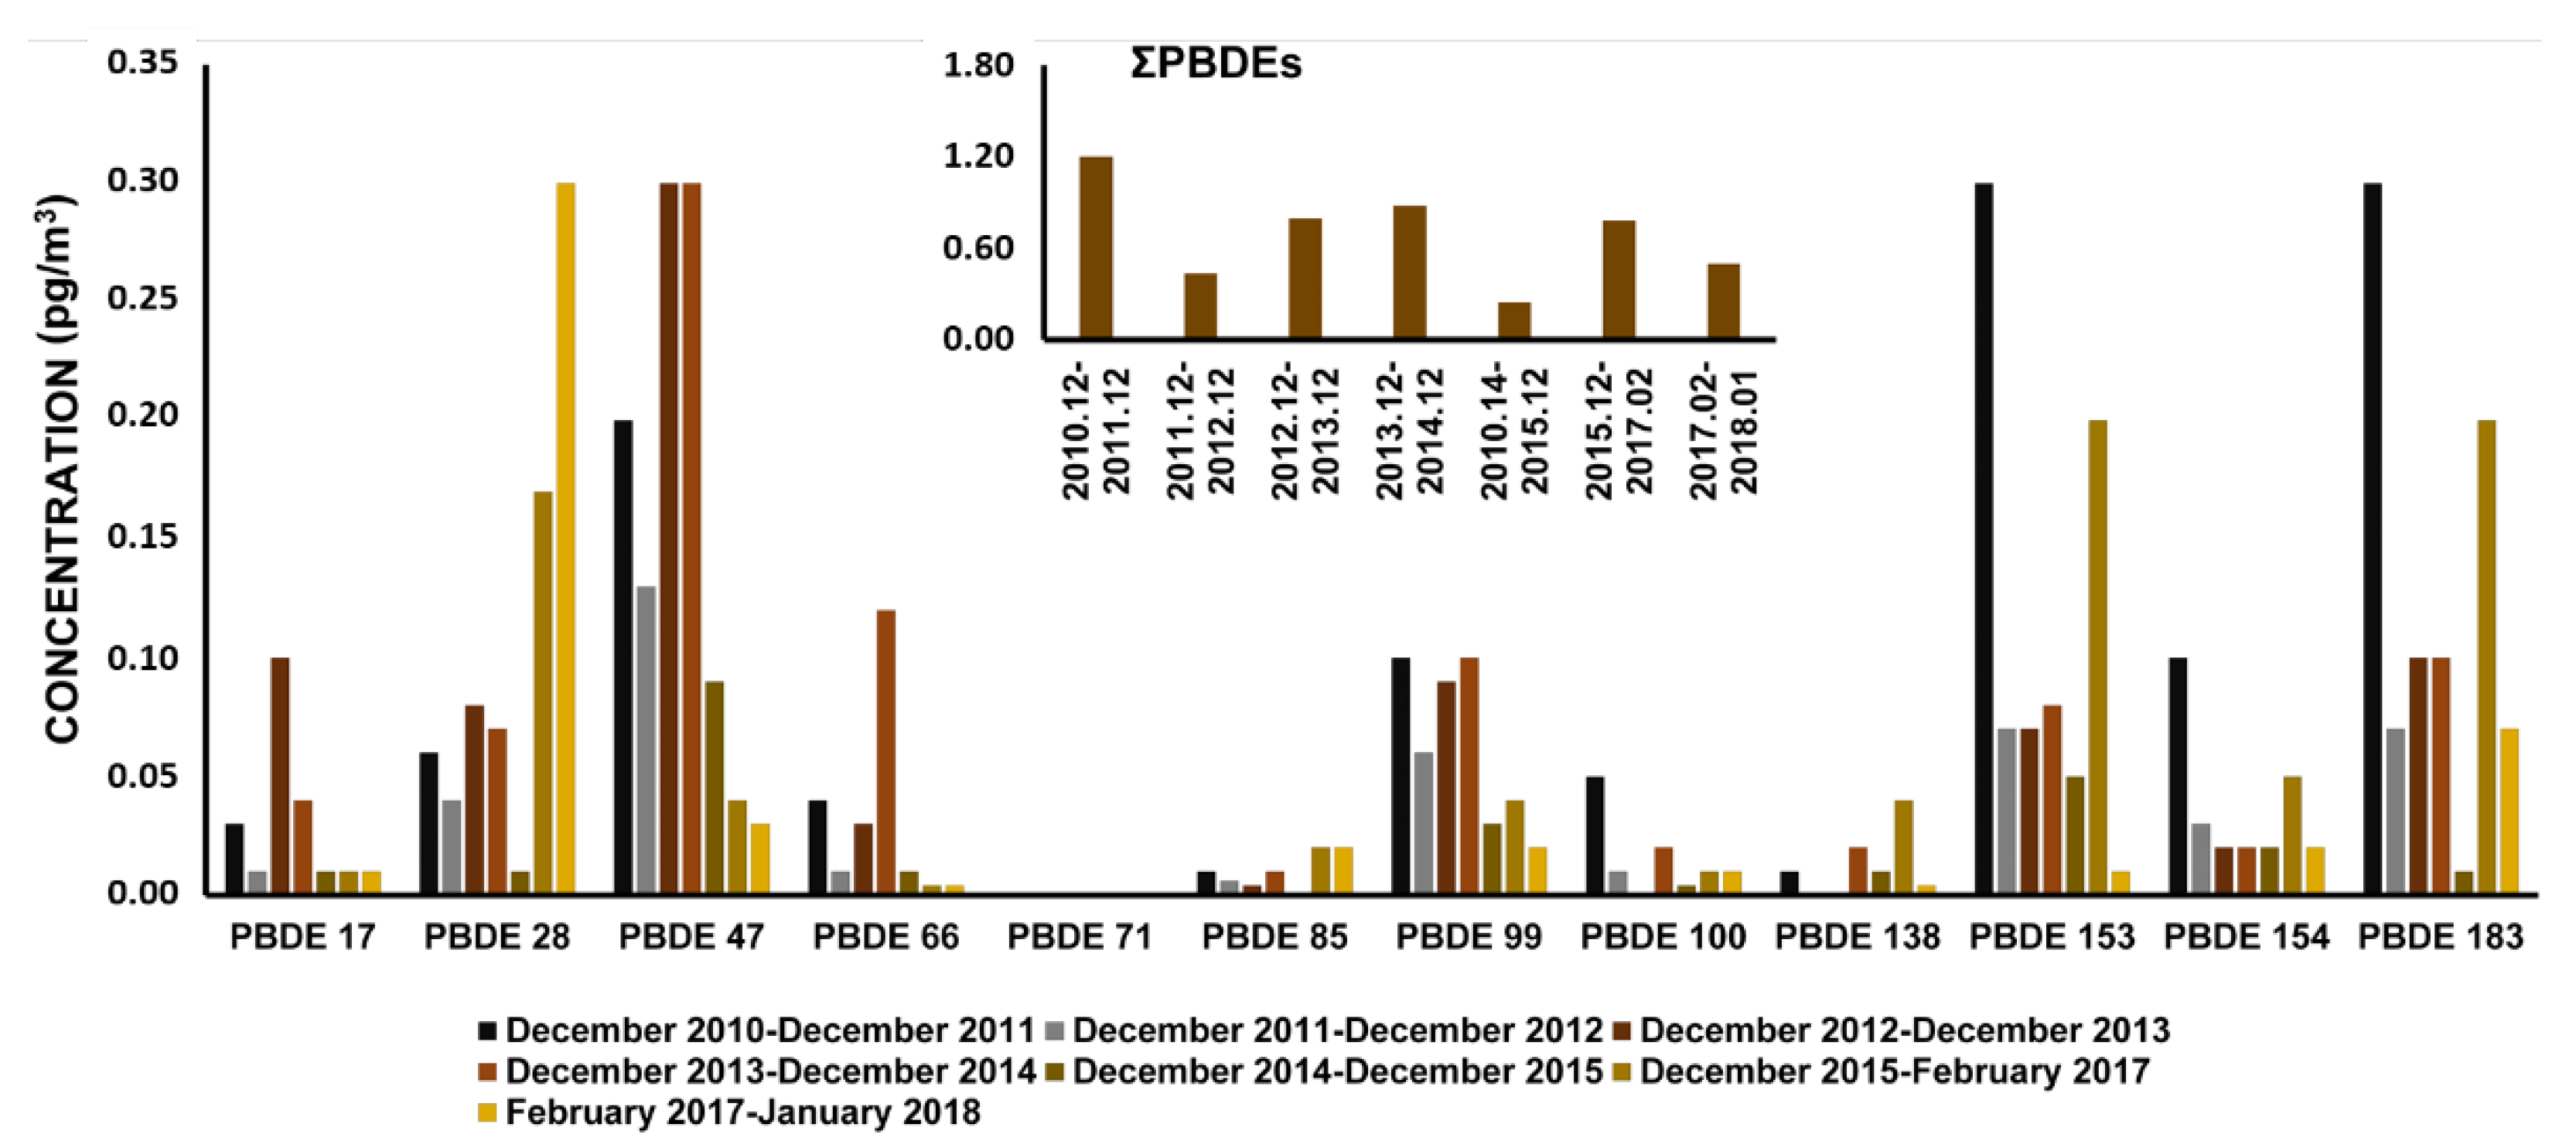
2.1.4. Polybrominated Diphenyl Ethers (PBDEs)
2.2. Bioaerosols
2.3. Inorganic Compounds
3. Analytical Techniques to Identify and Quantify Atmospheric Aerosols
3.1. Analytical Techniques for Organic Aerosols (OAs)
3.2. Analytical Techniques for Inorganic Aerosols
3.2.1. Analysis of Inorganic Compounds Using LIBS
3.2.2. Analysis of Inorganic Compounds Using ICP-MS and ICP-AES
3.2.3. Analysis of Inorganic Compounds Using Raman Spectroscopy and SEM-EDX
4. Modeling of Air Mass Back Trajectories

| Topic | Sampling Site | Trajectory or Dispersion Model | Ref. |
|---|---|---|---|
| Carbonaceous, water-soluble species and trace metals in PM10 aerosols | Bharati Station, East Antarctica. | HYSPLIT a | [160] |
| Submicron organic aerosols | Ship cruise round the Antarctic Peninsula, South Orkney Islands, and South Georgia Island. | HYSPLIT a | [155] |
| Biogenic organic aerosols | Palmer Station, Anvers Island, western Antarctic Peninsula. | HYSPLIT a | [156] |
| Record of near-surface ozone (O3) and O3 enhancement events | Kunlun Station, Dome A, East Antarctica | HYSPLIT a | [163] |
| Concentrations, particle size distributions, and dry deposition fluxes of aerosol trace elements | Palmer Station, Anvers Island, western Antarctic Peninsula | HYSPLIT a | [130] |
| Particle size distributions and solubility of aerosol iron (Fe) | Palmer Station, Anvers Island, western Antarctic Peninsula | HYSPLIT a | [164] |
| Photochemical reactions of aerosols | Criosfera 1 Research Module, West Antarctica | HYSPLIT a | [157] |
| Characterization of stratospheric smoke particles | Marambio Station, Marambio Island, Antarctic Peninsula | HYSPLIT a | [161] |
| Seasonal features and origins of carbonaceous aerosols | Syowa Station, Ongul Island, East Antarctica | HYSPLIT a | [165] |
| Characterization of aerosol number size distributions | Syowa Station, Ongul Island, East Antarctica | HYSPLIT a | [159] |
| Cloud condensation nuclei (CCN) measurements | Princess Elisabeth Station, Dronning Maud Land, East Antarctica | HYSPLIT a, NAME b | [166] |
| Ionic species concentrations in PM10 and PM2.5 aerosols | King Sejong Station, King George Island, Antarctic Peninsula | HYSPLIT a | [167] |
| Seasonal evolution of particulate mercury (Hg) in atmospheric aerosols | Faraglione Camp, Terra Nova Bay, East Antarctica | HYSPLIT a | [92] |
| Determination of cadmium (Cd), lead (Pb), and copper (Cu) in atmospheric aerosols | Concordia Station, Dome C, East Antarctica | HYSPLIT a | [41] |
| Observation of new particle formation events | King Sejong Station, King George Island, Antarctic Peninsula | HYSPLIT a | [158] |
| Annual variability of aerosol size distributions | Halley Station, Brunt Ice Shelf, East Antarctica | HYSPLIT a | [162] |
| Transport pathways of heavy metals in atmospheric aerosols | Gabriel de Castilla Station, Deception Island, Antarctic Peninsula | HYSPLIT a | [43] |
| Local and remote sources of airborne suspended particulate matter | Gabriel de Castilla Station, Deception Island, Antarctic Peninsula | HYSPLIT a | [23] |
| In situ measurements of tropospheric isoprene | Ship cruise around the Antarctic Peninsula | HYSPLIT a, NAME b | [168] |
| Study of aerosol–cloud interaction | Ship cruise all the way around Antarctica | LAGRANTO c | [35] |
| Summer aerosol measurements over the East Antarctic seasonal ice zone | Ship cruise from Australia to the East Antarctic seasonal sea ice zone | HYSPLIT a | [169] |
| Seasonal evolution of the chemical compositions of atmospheric aerosols | Faraglione Camp, Terra Nova kBay, East Antarctica | HYSPLIT a | [42] |
| Characterization of the chemical compositions of atmospheric aerosols | Zhongshan Station, Prydz Bay, East Antarctica | HYSPLIT a | [90] |
| Distributions of water-soluble ions in size-aggregated aerosols | Ship cruise from Australia to coastal Antarctica | HYSPLIT a | [170] |
| Characterization of marine aerosols | Ship cruise around the Antarctic Peninsula | HYSPLIT a | [171] |
5. Chemometrics and Data Processing Methods
| Name | Acronym | Function or Utility | Ref. |
|---|---|---|---|
| Principal Component Analysis | PCA | Pattern recognition, classification, and exploration of main pollution sources. Search for similarities between samples, sampling points, sampling days, etc. and, in general, data interpretation. | [94] [184] [185] [186] [23] [43] [181] [187] [182] [188] [179] [189] [180] |
| Cluster Analysis or Hierarchical Cluster Analysis | CA or HCA | Patter recognition and classification of samples, pollutants, sources, etc. Useful in chemical and physical characterization of airborne particles. | [190] [191] [192] [193] [183] [181] [182] [188] [179] [189] [180] |
| Correlation or Regression Analysis and Canonical Correlation Analysis | CCA | Search of relationships between pollutants and source exploration. | [190] [194] [23] [43] [183] |
| Partial Least Squares and Unfolded Partial Least Squares | PLS and U-PLS | Prediction and construction of mathematical predictive models. Especially useful when there are many factors with high collinearity. | [195] [186] [196] [189] [197] |
| Factor Analysis and Parallel Factor Analysis | FA and PARAFAC | Receptor modeling, searching of hidden patterns, and source apportionment. | [198] [195] [187] |
| Positive Matrix Factorization | PMF | Source identification of pollutants. | [199] [200] |
6. Conclusions
Author Contributions
Funding
Institutional Review Board Statement
Informed Consent Statement
Data Availability Statement
Acknowledgments
Conflicts of Interest
References
- Madruga, D.G.; Ubeda, R.M.; Terroba, J.M.; dos Santos, S.G.; García-Cambero, J.P. Particle-associated polycyclic aromatic hydrocarbons in a representative urban location (indoor-outdoor) from South Europe: Assessment of potential sources and cancer risk to humans. Indoor Air 2019, 29, 817–827. [Google Scholar] [CrossRef] [PubMed]
- Xue, Y.-h.; Wu, J.-h.; Feng, Y.-c.; Dai, L.; Bi, X.-h.; Li, X.; Zhu, T.; Tang, S.-b.; Chen, M.-f. Source Characterization and Apportionment of PM10 in Panzhihua, China. Aerosol Air Qual. Res. 2010, 10, 367–377. [Google Scholar] [CrossRef]
- Cheung, K.; Daher, N.; Kam, W.; Shafer, M.M.; Ning, Z.; Schauer, J.J.; Sioutas, C. Spatial and temporal variation of chemical composition and mass closure of ambient coarse particulate matter (PM10–2.5) in the Los Angeles area. Atmos. Environ. 2011, 45, 2651–2662. [Google Scholar] [CrossRef]
- Kansal, A. Sources and reactivity of NMHCs and VOCs in the atmosphere: A review. J. Hazard. Mater. 2009, 166, 17–26. [Google Scholar] [CrossRef] [PubMed]
- Kopaczyk, J.M.; Warguła, J.; Jelonek, T. The variability of terpenes in conifers under developmental and environmental stimuli. Environ. Exp. Bot. 2020, 180, 104197. [Google Scholar] [CrossRef]
- Atkinson, R. Atmospheric chemistry of VOCs and NOx. Atmos. Environ. 2000, 34, 2063–2101. [Google Scholar] [CrossRef]
- Hallquist, M.; Wenger, J.C.; Baltensperger, U.; Rudich, Y.; Simpson, D.; Claeys, M.; Dommen, J.; Donahue, N.M.; George, C.; Goldstein, A.H.; et al. The formation, properties and impact of secondary organic aerosol: Current and emerging issues. Atmos. Chem. Phys. 2009, 9, 5155–5236. [Google Scholar] [CrossRef]
- Nair, A.T.; Senthilnathan, J.; Nagendra, S.M.S. Emerging perspectives on VOC emissions from landfill sites: Impact on tropospheric chemistry and local air quality. Process Saf. Environ. Prot. 2019, 121, 143–154. [Google Scholar] [CrossRef]
- Qing Li, Q.; Loganath, A.; Seng Chong, Y.; Tan, J.; Philip Obbard, J. Persistent Organic Pollutants and Adverse Health Effects in Humans. J. Toxicol. Environ. Health Part A 2006, 69, 1987–2005. [Google Scholar] [CrossRef] [PubMed]
- Fitzgerald, L.; Wikoff, D.S. Persistent Organic Pollutants. In Encyclopedia of Toxicology, 3rd ed.; Wexler, P., Ed.; Academic Press: Oxford, UK, 2014; pp. 820–825. [Google Scholar]
- Simpson, W.R.; Brown, S.S.; Saiz-Lopez, A.; Thornton, J.A.; Glasow, R. Tropospheric halogen chemistry: Sources, cycling, and impacts. Chem. Rev. 2015, 115, 4035–4062. [Google Scholar] [CrossRef] [PubMed]
- McFiggans, G.; Cox, R.A.; Mössinger, J.C.; Allan, B.J.; Plane, J.M.C. Active chlorine release from marine aerosols: Roles for reactive iodine and nitrogen species. J. Geophys. Res. Atmos. 2002, 107, ACH 10-11–ACH 10-13. [Google Scholar] [CrossRef]
- Papanastasiou, D.K.; Carlon, N.R.; Neuman, J.A.; Fleming, E.L.; Jackman, C.H.; Burkholder, J.B. Revised UV absorption spectra, ozone depletion potentials, and global warming potentials for the ozone-depleting substances CF2Br2, CF2ClBr, and CF2BrCF2Br. Geophys. Res. Lett. 2013, 40, 464–469. [Google Scholar] [CrossRef]
- Watts, S.F. The mass budgets of carbonyl sulfide, dimethyl sulfide, carbon disulfide and hydrogen sulfide. Atmos. Environ. 2000, 34, 761–779. [Google Scholar] [CrossRef]
- Stern, D.I. Global sulfur emissions from 1850 to 2000. Chemosphere 2005, 58, 163–175. [Google Scholar] [CrossRef]
- von Glasow, R.; Bobrowski, N.; Kern, C. The effects of volcanic eruptions on atmospheric chemistry. Chem. Geol. 2009, 263, 131–142. [Google Scholar] [CrossRef]
- Vestreng, V.; Myhre, G.; Fagerli, H.; Reis, S.; Tarrasón, L. Twenty-five years of continuous sulphur dioxide emission reduction in Europe. Atmos. Chem. Phys. 2007, 7, 3663–3681. [Google Scholar] [CrossRef]
- Park, J.; Ryu, J.; Kim, D.; Yeo, J.; Lee, H. Long-Range Transport of SO2 from Continental Asia to Northeast Asia and the Northwest Pacific Ocean: Flow Rate Estimation Using OMI Data, Surface in Situ Data, and the HYSPLIT Model. Atmosphere 2016, 7, 53. [Google Scholar] [CrossRef]
- Chu, W.-L.; Dang, N.-L.; Kok, Y.-Y.; Ivan Yap, K.-S.; Phang, S.-M.; Convey, P. Heavy metal pollution in Antarctica and its potential impacts on algae. Polar Sci. 2019, 20, 75–83. [Google Scholar] [CrossRef]
- Englert, N. Fine particles and human health—A review of epidemiological studies. Toxicol. Lett. 2004, 149, 235–242. [Google Scholar] [CrossRef]
- Briffa, J.; Sinagra, E.; Blundell, R. Heavy metal pollution in the environment and their toxicological effects on humans. Heliyon 2020, 6, e04691. [Google Scholar] [CrossRef]
- Wang, Y.-F.; Huang, K.-L.; Li, C.-T.; Mi, H.-H.; Luo, J.-H.; Tsai, P.-J. Emissions of fuel metals content from a diesel vehicle engine. Atmos. Environ. 2003, 37, 4637–4643. [Google Scholar] [CrossRef]
- Marina-Montes, C.; Pérez-Arribas, L.V.; Anzano, J.; Cáceres, J.O. Local and Remote Sources of Airborne Suspended Particulate Matter in the Antarctic Region. Atmosphere 2020, 11, 373. [Google Scholar] [CrossRef]
- Goodsite, M.E.; Hertel, O. Urban Air Qualityurbanair quality: Sourcesurbanair qualitysourcesand Concentrationsurbanair qualityconcentrations. In Encyclopedia of Sustainability Science and Technology; Meyers, R.A., Ed.; Springer: New York, NY, USA, 2012; pp. 11291–11311. [Google Scholar]
- Sharma, M.; Kaskaoutis, D.G.; Singh, R.P.; Singh, S. Seasonal Variability of Atmospheric Aerosol Parameters over Greater Noida Using Ground Sunphotometer Observations. Aerosol Air Qual. Res. 2014, 14, 608–622. [Google Scholar] [CrossRef]
- Barbaro, E.; Padoan, S.; Kirchgeorg, T.; Zangrando, R.; Toscano, G.; Barbante, C.; Gambaro, A. Particle size distribution of inorganic and organic ions in coastal and inland Antarctic aerosol. Environ. Sci. Pollut. Res. Int. 2017, 24, 2724–2733. [Google Scholar] [CrossRef]
- Di Carmine, C.; Campanelli, M.; Nakajima, T.; Tomasi, C.; Vitale, V. Retrievals of Antarctic aerosol characteristics using a Sun-sky radiometer during the 2001–2002 austral summer campaign. J. Geophys. Res. Atmos. 2005, 110. [Google Scholar] [CrossRef]
- Yang, Y.; Zhao, C.; Wang, Q.; Cong, Z.; Yang, X.; Fan, H. Aerosol characteristics at the three poles of the Earth as characterized by Cloud-Aerosol Lidar and Infrared Pathfinder Satellite Observations. Atmos. Chem. Phys. 2021, 21, 4849–4868. [Google Scholar] [CrossRef]
- Kallenborn, R.; Hung, H.; Brorström-Lundén, E. Chapter 13—Atmospheric Long-Range Transport of Persistent Organic Pollutants (POPs) into Polar Regions. In Comprehensive Analytical Chemistry; Zeng, E.Y., Ed.; Elsevier: Amsterdam, The Netherlands, 2015; Volume 67, pp. 411–432. [Google Scholar]
- De Kok, L.J.; Durenkamp, M.; Yang, L.; Stulen, I. Atmospheric sulfur. In Sulfur in Plants an Ecological Perspective; Hawkesford, M.J., De Kok, L.J., Eds.; Springer: Dordrecht, The Netherlands, 2007; pp. 91–106. [Google Scholar]
- Solomon, S. Stratospheric ozone depletion: A review of concepts and history. Rev. Geophys. 1999, 37, 275–316. [Google Scholar] [CrossRef]
- Sherwen, T.; Evans, M.J.; Sommariva, R.; Hollis, L.D.J.; Ball, S.M.; Monks, P.S.; Reed, C.; Carpenter, L.J.; Lee, J.D.; Forster, G.; et al. Effects of halogens on European air-quality. Faraday Discuss. 2017, 200, 75–100. [Google Scholar] [CrossRef]
- Haigh, J.D.; Roscoe, H.K. The Final Warming Date of the Antarctic Polar Vortex and Influences on its Interannual Variability. J. Clim. 2009, 22, 5809–5819. [Google Scholar] [CrossRef]
- Solomon, S.; Haskins, J.; Ivy, D.J.; Min, F. Fundamental differences between Arctic and Antarctic ozone depletion. Proc. Natl. Acad. Sci. USA 2014, 111, 6220–6225. [Google Scholar] [CrossRef]
- Schmale, J.; Baccarini, A.; Thurnherr, I.; Henning, S.; Efraim, A.; Regayre, L.; Bolas, C.; Hartmann, M.; Welti, A.; Lehtipalo, K.; et al. Overview of the Antarctic Circumnavigation Expedition: Study of Preindustrial-like Aerosols and Their Climate Effects (ACE-SPACE). Bull. Am. Meteorol. Soc. 2019, 100, 2260–2283. [Google Scholar] [CrossRef]
- Parish, T.R.; Cassano, J.J. The Role of Katabatic Winds on the Antarctic Surface Wind Regime. Mon. Weather Rev. 2003, 131, 317–333. [Google Scholar] [CrossRef]
- Uotila, P.; Pezza, A.B.; Cassano, J.J.; Keay, K.; Lynch, A.H. A comparison of low pressure system statistics derived from a high-resolution NWP output and three reanalysis products over the Southern Ocean. J. Geophys. Res. Atmos. 2009, 114. [Google Scholar] [CrossRef]
- Zhang, Q.; Chen, Z.; Li, Y.; Wang, P.; Zhu, C.; Gao, G.; Xiao, K.; Sun, H.; Zheng, S.; Liang, Y.; et al. Occurrence of organochlorine pesticides in the environmental matrices from King George Island, west Antarctica. Environ. Pollut. 2015, 206, 142–149. [Google Scholar] [CrossRef]
- Corsolini, S.; Baroni, D.; Martellini, T.; Pala, N.; Cincinelli, A. PBDEs and PCBs in terrestrial ecosystems of the Victoria Land, Antarctica. Chemosphere 2019, 231, 233–239. [Google Scholar] [CrossRef]
- Potapowicz, J.; Szumińska, D.; Szopińska, M.; Polkowska, Ż. The influence of global climate change on the environmental fate of anthropogenic pollution released from the permafrost: Part I. Case study of Antarctica. Sci. Total Environ. 2019, 651, 1534–1548. [Google Scholar] [CrossRef]
- Illuminati, S.; Annibaldi, A.; Truzzi, C.; Mantini, C.; Conca, E.; Malandrino, M.; Giglione, G.; Fanelli, M.; Scarponi, G. Determination of Cd, Pb, and Cu in the Atmospheric Aerosol of Central East Antarctica at Dome C (Concordia Station). Molecules 2021, 26, 1997. [Google Scholar] [CrossRef]
- Vagnoni, F.; Illuminati, S.; Annibaldi, A.; Memmola, F.; Giglione, G.; Falgiani, A.M.; Girolametti, F.; Fanelli, M.; Scarponi, G.; Truzzi, C. Seasonal Evolution of the Chemical Composition of Atmospheric Aerosol in Terra Nova Bay (Antarctica). Atmosphere 2021, 12, 1030. [Google Scholar] [CrossRef]
- Marina-Montes, C.; Pérez-Arribas, L.V.; Escudero, M.; Anzano, J.; Cáceres, J.O. Heavy metal transport and evolution of atmospheric aerosols in the Antarctic region. Sci. Total Environ. 2020, 721, 137702. [Google Scholar] [CrossRef]
- Mishra, V.K.; Kim, K.-H.; Hong, S.; Lee, K. Aerosol composition and its sources at the King Sejong Station, Antarctic peninsula. Atmos. Environ. 2004, 38, 4069–4084. [Google Scholar] [CrossRef]
- Barbante, C.; Turetta, C.; Gambaro, A.; Capodaglio, G.; Scarponi, G. Sources and origins of aerosols reaching Antarctica as revealed by lead concentration profiles in shallow snow. Ann. Glaciol. 1998, 27, 674–678. [Google Scholar] [CrossRef]
- Kallenborn, R.; Oehme, M.; Wynn-Williams, D.D.; Schlabach, M.; Harris, J. Ambient air levels and atmospheric long-range transport of persistent organochlorines to Signy Island, Antarctica. Sci. Total Environ. 1998, 220, 167–180. [Google Scholar] [CrossRef]
- Choi, S.-D.; Baek, S.-Y.; Chang, Y.-S.; Wania, F.; Ikonomou, M.G.; Yoon, Y.-J.; Park, B.-K.; Hong, S. Passive Air Sampling of Polychlorinated Biphenyls and Organochlorine Pesticides at the Korean Arctic and Antarctic Research Stations: Implications for Long-Range Transport and Local Pollution. Environ. Sci. Technol. 2008, 42, 7125–7131. [Google Scholar] [CrossRef] [PubMed]
- Cincinelli, A.; Martellini, T.; Del Bubba, M.; Lepri, L.; Corsolini, S.; Borghesi, N.; King, M.D.; Dickhut, R.M. Organochlorine pesticide air–water exchange and bioconcentration in krill in the Ross Sea. Environ. Pollut. 2009, 157, 2153–2158. [Google Scholar] [CrossRef] [PubMed]
- Zoccolillo, L.; Amendola, L.; Insogna, S. Comparison of atmosphere/aquatic environment concentration ratio of volatile chlorinated hydrocarbons between temperate regions and Antarctica. Chemosphere 2009, 76, 1525–1532. [Google Scholar] [CrossRef]
- Baek, S.-Y.; Choi, S.-D.; Chang, Y.-S. Three-Year Atmospheric Monitoring of Organochlorine Pesticides and Polychlorinated Biphenyls in Polar Regions and the South Pacific. Environ. Sci. Technol. 2011, 45, 4475–4482. [Google Scholar] [CrossRef]
- Li, Y.; Geng, D.; Liu, F.; Wang, T.; Wang, P.; Zhang, Q.; Jiang, G. Study of PCBs and PBDEs in King George Island, Antarctica, using PUF passive air sampling. Atmos. Environ. 2012, 51, 140–145. [Google Scholar] [CrossRef]
- Piazza, R.; Gambaro, A.; Argiriadis, E.; Vecchiato, M.; Zambon, S.; Cescon, P.; Barbante, C. Development of a method for simultaneous analysis of PCDDs, PCDFs, PCBs, PBDEs, PCNs and PAHs in Antarctic air. Anal. Bioanal. Chem. 2013, 405, 917–932. [Google Scholar] [CrossRef]
- Ma, X.; Zhang, H.; Zhou, H.; Na, G.; Wang, Z.; Chen, C.; Chen, J.; Chen, J. Occurrence and gas/particle partitioning of short- and medium-chain chlorinated paraffins in the atmosphere of Fildes Peninsula of Antarctica. Atmos. Environ. 2014, 90, 10–15. [Google Scholar] [CrossRef]
- Khairy, M.A.; Luek, J.L.; Dickhut, R.; Lohmann, R. Levels, sources and chemical fate of persistent organic pollutants in the atmosphere and snow along the western Antarctic Peninsula. Environ. Pollut. 2016, 216, 304–313. [Google Scholar] [CrossRef]
- Pozo, K.; Martellini, T.; Corsolini, S.; Harner, T.; Estellano, V.; Kukučka, P.; Mulder, M.D.; Lammel, G.; Cincinelli, A. Persistent organic pollutants (POPs) in the atmosphere of coastal areas of the Ross Sea, Antarctica: Indications for long-term downward trends. Chemosphere 2017, 178, 458–465. [Google Scholar] [CrossRef] [PubMed]
- Wang, P.; Li, Y.; Zhang, Q.; Yang, Q.; Zhang, L.; Liu, F.; Fu, J.; Meng, W.; Wang, D.; Sun, H.; et al. Three-year monitoring of atmospheric PCBs and PBDEs at the Chinese Great Wall Station, West Antarctica: Levels, chiral signature, environmental behaviors and source implication. Atmos. Environ. 2017, 150, 407–416. [Google Scholar] [CrossRef]
- Cao, S.; Na, G.; Li, R.; Ge, L.; Gao, H.; Jin, S.; Hou, C.; Gao, Y.; Zhang, Z. Fate and deposition of polycyclic aromatic hydrocarbons in the Bransfield Strait, Antarctica. Mar. Pollut. Bull. 2018, 137, 533–541. [Google Scholar] [CrossRef] [PubMed]
- Casal, P.; Cabrerizo, A.; Vila-Costa, M.; Pizarro, M.; Jiménez, B.; Dachs, J. Pivotal Role of Snow Deposition and Melting Driving Fluxes of Polycyclic Aromatic Hydrocarbons at Coastal Livingston Island (Antarctica). Environ. Sci. Technol. 2018, 52, 12327–12337. [Google Scholar] [CrossRef]
- Pagel, É.C.; Reis, N.C.; de Alvarez, C.E.; Santos, J.M.; Beghi, S.P.; Boechat, J.L.; Nishikawa, M.M.; Antunes, P.W.P.; Cassini, S.T. Indoor air quality in an Antarctic Research Station: Fungi, particles and aldehyde concentrations associated with building materials and architectural design. Indoor Built Environ. 2017, 27, 1322–1340. [Google Scholar] [CrossRef]
- Wang, P.; Meng, W.; Li, Y.; Zhang, Q.; Zhang, L.; Fu, J.; Yang, R.; Jiang, G. Temporal variation (2011–2014) of atmospheric OCPs at King George Island, west Antarctica. Atmos. Environ. 2018, 191, 432–439. [Google Scholar] [CrossRef]
- Hao, Y.; Li, Y.; Han, X.; Wang, T.; Yang, R.; Wang, P.; Xiao, K.; Li, W.; Lu, H.; Fu, J.; et al. Air monitoring of polychlorinated biphenyls, polybrominated diphenyl ethers and organochlorine pesticides in West Antarctica during 2011–2017: Concentrations, temporal trends and potential sources. Environ. Pollut. 2019, 249, 381–389. [Google Scholar] [CrossRef]
- Na, G.; Gao, Y.; Li, R.; Gao, H.; Hou, C.; Ye, J.; Jin, S.; Zhang, Z. Occurrence and sources of polycyclic aromatic hydrocarbons in atmosphere and soil from 2013 to 2019 in the Fildes Peninsula, Antarctica. Mar. Pollut. Bull. 2020, 156, 111173. [Google Scholar] [CrossRef]
- Zhao, J.; Wang, P.; Wang, C.; Fu, M.; Li, Y.; Yang, R.; Fu, J.; Hao, Y.; Matsiko, J.; Zhang, Q.; et al. Novel brominated flame retardants in West Antarctic atmosphere (2011–2018): Temporal trends, sources and chiral signature. Sci. Total Environ. 2020, 720, 137557. [Google Scholar] [CrossRef]
- Bengtson Nash, S.M.; Wild, S.; Broomhall, S.; Bohlin-Nizzetto, P. Brominated Flame Retardants in Antarctic Air in the Vicinity of Two All-Year Research Stations. Atmosphere 2021, 12, 668. [Google Scholar] [CrossRef]
- Jiang, L.; Gao, W.; Ma, X.; Wang, Y.; Wang, C.; Li, Y.; Yang, R.; Fu, J.; Shi, J.; Zhang, Q.; et al. Long-Term Investigation of the Temporal Trends and Gas/Particle Partitioning of Short- and Medium-Chain Chlorinated Paraffins in Ambient Air of King George Island, Antarctica. Environ. Sci. Technol. 2021, 55, 230–239. [Google Scholar] [CrossRef] [PubMed]
- Verma, P.K.; Sah, D.; Kumari, K.M.; Lakhani, A. Atmospheric concentrations and gas–particle partitioning of polycyclic aromatic hydrocarbons (PAHs) and nitro-PAHs at Indo-Gangetic sites. Environ. Sci. Process. Impacts 2017, 19, 1051–1060. [Google Scholar] [CrossRef] [PubMed]
- Fröhlich-Nowoisky, J.; Kampf, C.J.; Weber, B.; Huffman, J.A.; Pöhlker, C.; Andreae, M.O.; Lang-Yona, N.; Burrows, S.M.; Gunthe, S.S.; Elbert, W.; et al. Bioaerosols in the Earth system: Climate, health, and ecosystem interactions. Atmos. Res. 2016, 182, 346–376. [Google Scholar] [CrossRef]
- Möhler, O.; DeMott, P.J.; Vali, G.; Levin, Z. Microbiology and atmospheric processes: The role of biological particles in cloud physics. Biogeosciences 2007, 4, 1059–1071. [Google Scholar] [CrossRef]
- Vaïtilingom, M.; Deguillaume, L.; Vinatier, V.; Sancelme, M.; Amato, P.; Chaumerliac, N.; Delort, A.M. Potential impact of microbial activity on the oxidant capacity and organic carbon budget in clouds. Proc. Natl. Acad. Sci. USA 2013, 110, 559–564. [Google Scholar] [CrossRef]
- Jones, S.E.; Newton, R.J.; McMahon, K.D. Potential for atmospheric deposition of bacteria to influence bacterioplankton communities. FEMS Microbiol. Ecol. 2008, 64, 388–394. [Google Scholar] [CrossRef]
- Bottos, E.M.; Woo, A.C.; Zawar-Reza, P.; Pointing, S.B.; Cary, S.C. Airborne bacterial populations above desert soils of the McMurdo Dry Valleys, Antarctica. Microb. Ecol. 2014, 67, 120–128. [Google Scholar] [CrossRef]
- Grammatika, M.; Zimmerman, W.B. Microhydrodynamics of flotation processes in the sea surface layer. Dyn. Atmos. Ocean. 2001, 34, 327–348. [Google Scholar] [CrossRef]
- Aller, J.Y.; Kuznetsova, M.R.; Jahns, C.J.; Kemp, P.F. The sea surface microlayer as a source of viral and bacterial enrichment in marine aerosols. J. Aerosol Sci. 2005, 36, 801–812. [Google Scholar] [CrossRef]
- Burrows, S.M.; Butler, T.; Jöckel, P.; Tost, H.; Kerkweg, A.; Pöschl, U.; Lawrence, M.G. Bacteria in the global atmosphere—Part 2: Modeling of emissions and transport between different ecosystems. Atmos. Chem. Phys. 2009, 9, 9281–9297. [Google Scholar] [CrossRef]
- Archer, S.D.J.; Lee, K.C.; Caruso, T.; Maki, T.; Lee, C.K.; Cary, S.C.; Cowan, D.A.; Maestre, F.T.; Pointing, S.B. Airborne microbial transport limitation to isolated Antarctic soil habitats. Nat. Microbiol. 2019, 4, 925–932. [Google Scholar] [CrossRef]
- Cox, F.; Newsham, K.K.; Bol, R.; Dungait, J.A.J.; Robinson, C.H. Not poles apart: Antarctic soil fungal communities show similarities to those of the distant Arctic. Ecol. Lett. 2016, 19, 528–536. [Google Scholar] [CrossRef] [PubMed]
- Després, V.; Huffman, J.A.; Burrows, S.M.; Hoose, C.; Safatov, A.; Buryak, G.; Fröhlich-Nowoisky, J.; Elbert, W.; Andreae, M.; Pöschl, U.; et al. Primary biological aerosol particles in the atmosphere: A review. Tellus B: Chem. Phys. Meteorol. 2012, 64, 15598. [Google Scholar] [CrossRef]
- Müller-Germann, I.; Vogel, B.; Vogel, H.; Pauling, A.; Fröhlich-Nowoisky, J.; Pöschl, U.; Després, V.R. Quantitative DNA Analyses for Airborne Birch Pollen. PLoS ONE 2015, 10, e0140949. [Google Scholar] [CrossRef] [PubMed]
- DeLeon-Rodriguez, N.; Lathem, T.L.; Rodriguez-R, L.M.; Barazesh, J.M.; Anderson, B.E.; Beyersdorf, A.J.; Ziemba, L.D.; Bergin, M.; Nenes, A.; Konstantinidis, K.T. Microbiome of the upper troposphere: Species composition and prevalence, effects of tropical storms, and atmospheric implications. Proc. Natl. Acad. Sci. USA 2013, 110, 2575. [Google Scholar] [CrossRef] [PubMed]
- Pöhlker, C.; Huffman, J.A.; Pöschl, U. Autofluorescence of atmospheric bioaerosols–fluorescent biomolecules and potential interferences. Atmos. Meas. Tech. 2012, 5, 37–71. [Google Scholar] [CrossRef]
- Mão de Ferro, A.; Mota, A.M.; Canário, J. Pathways and speciation of mercury in the environmental compartments of Deception Island, Antarctica. Chemosphere 2014, 95, 227–233. [Google Scholar] [CrossRef]
- Cossa, D.; Heimbürger, L.-E.; Lannuzel, D.; Rintoul, S.R.; Butler, E.C.V.; Bowie, A.R.; Averty, B.; Watson, R.J.; Remenyi, T. Mercury in the Southern Ocean. Geochim. Et Cosmochim. Acta 2011, 75, 4037–4052. [Google Scholar] [CrossRef]
- Pacyna, J.M.; Pacyna, E.G. An assessment of global and regional emissions of trace metals to the atmosphere from anthropogenic sources worldwide. Environ. Rev. 2001, 9, 269–298. [Google Scholar] [CrossRef]
- Tchounwou, P.B.; Yedjou, C.G.; Patlolla, A.K.; Sutton, D.J. Heavy metal toxicity and the environment. In Molecular, Clinical and Environmental Toxicology; Experientia Supplementum; Springer: Basel, Switzerland, 2012; Volume 101, pp. 133–164. [Google Scholar] [CrossRef]
- Bargagli, R. Environmental contamination in Antarctic ecosystems. Sci. Total Environ. 2008, 400, 212–226. [Google Scholar] [CrossRef] [PubMed]
- Annibaldi, A.; Truzzi, C.; Illuminati, S.; Bassotti, E.; Scarponi, G. Determination of water-soluble and insoluble (dilute-HCl-extractable) fractions of Cd, Pb and Cu in Antarctic aerosol by square wave anodic stripping voltammetry: Distribution and summer seasonal evolution at Terra Nova Bay (Victoria Land). Anal. Bioanal. Chem. 2007, 387, 977–998. [Google Scholar] [CrossRef] [PubMed]
- Mazzera, D.M.; Lowenthal, D.H.; Chow, J.C.; Watson, J.G.; Grubĭsíc, V. PM10 measurements at McMurdo Station, Antarctica. Atmos. Environ. 2001, 35, 1891–1902. [Google Scholar] [CrossRef]
- Toscano, G.; Gambaro, A.; Moret, I.; Capodaglio, G.; Turetta, C.; Cescon, P. Trace metals in aerosol at Terra Nova Bay, Antarctica. J. Environ. Monit. 2005, 7, 1275–1280. [Google Scholar] [CrossRef] [PubMed]
- Illuminati, S.; Annibaldi, A.; Truzzi, C.; Libani, G.; Mantini, C.; Scarponi, G. Determination of water-soluble, acid-extractable and inert fractions of Cd, Pb and Cu in Antarctic aerosol by square wave anodic stripping voltammetry after sequential extraction and microwave digestion. J. Electroanal. Chem. 2015, 755, 182–196. [Google Scholar] [CrossRef]
- Xu, G.; Chen, L.; Zhang, M.; Zhang, Y.; Wang, J.; Lin, Q. Year-round records of bulk aerosol composition over the Zhongshan Station, Coastal East Antarctica. Air Qual. Atmos. Health 2019, 12, 271–288. [Google Scholar] [CrossRef]
- Budhavant, K.; Safai, P.D.; Rao, P.S.P. Sources and elemental composition of summer aerosols in the Larsemann Hills (Antarctica). Environ. Sci. Pollut. Res. 2015, 22, 2041–2050. [Google Scholar] [CrossRef] [PubMed]
- Illuminati, S.; Annibaldi, A.; Bau, S.; Scarchilli, C.; Ciardini, V.; Grigioni, P.; Girolametti, F.; Vagnoni, F.; Scarponi, G.; Truzzi, C. Seasonal Evolution of Size-Segregated Particulate Mercury in the Atmospheric Aerosol over Terra Nova Bay, Antarctica. Molecules 2020, 25, 3971. [Google Scholar] [CrossRef] [PubMed]
- Bazzano, A.; Soggia, F.; Grotti, M. Source identification of atmospheric particle-bound metals at Terra Nova Bay, Antarctica. Environ. Chem. 2015, 12, 245–252. [Google Scholar] [CrossRef]
- Cáceres, J.O.; Sanz-Mangas, D.; Manzoor, S.; Pérez-Arribas, L.V.; Anzano, J. Quantification of particulate matter, tracking the origin and relationship between elements for the environmental monitoring of the Antarctic region. Sci. Total Environ. 2019, 665, 125–132. [Google Scholar] [CrossRef]
- Weller, R.; Wöltjen, J.; Piel, C.; Resenberg, R.; Wagenbach, D.; König-Langlo, G.; Kriews, M. Seasonal variability of crustal and marine trace elements in the aerosol at Neumayer station, Antarctica. Tellus B: Chem. Phys. Meteorol. 2008, 60, 742–752. [Google Scholar] [CrossRef]
- Martin, B.; Bytnerowicz, A.; Thorstenson, Y.R. Effects of Air Pollutants on the Composition of Stable Carbon Isotopes, deltaC, of Leaves and Wood, and on Leaf Injury. Plant Physiol. 1988, 88, 218–223. [Google Scholar] [CrossRef] [PubMed]
- Batts, J.E.; Calder, L.J.; Batts, B.D. Utilizing stable isotope abundances of lichens to monitor environmental change. Chemical Geology 2004, 204, 345–368. [Google Scholar] [CrossRef]
- Ehleringer, J.R.; Rundel, P.W. Stable Isotopes: History, Units, and Instrumentation. In Stable Isotopes in Ecological Research; Ecological Studies; Springer: New York, NY, USA, 1989; Volume 68, pp. 1–15. [Google Scholar] [CrossRef]
- IPCC. Climate Change 2013: The Physical Science Basis. Contribution of Working Group I to the Fifth Assessment Report of the Intergovernmental Panel on Climate Change; Stocker, T.F., Qin, D., Plattner, G.-K., Tignor, M., Allen, S.K., Boschung, J., Nauels, A., Xia, Y., Bex, V., Midgley, P.M., Eds.; Cambridge University Press: Cambridge, UK; New York, NY, USA, 2013; p. 1535. [Google Scholar]
- Wang, M.; Zheng, N.; Zhao, D.; Shang, J.; Zhu, T. Using Micro-Raman Spectroscopy to Investigate Chemical Composition, Mixing States, and Heterogeneous Reactions of Individual Atmospheric Particles. Environ. Sci. Technol. 2021, 55, 10243–10254. [Google Scholar] [CrossRef] [PubMed]
- Valavanidis, A.; Fiotakis, K.; Vlachogianni, T. Airborne Particulate Matter and Human Health: Toxicological Assessment and Importance of Size and Composition of Particles for Oxidative Damage and Carcinogenic Mechanisms. J. Environ. Sci. Health Part C 2008, 26, 339–362. [Google Scholar] [CrossRef]
- Hamilton, J.F.; Webb, P.J.; Lewis, A.C.; Hopkins, J.R.; Smith, S.; Davy, P. Partially oxidised organic components in urban aerosol using GCXGC-TOF/MS. Atmos. Chem. Phys. 2004, 4, 1279–1290. [Google Scholar] [CrossRef]
- Fraser, M.P.; Cass, G.R.; Simoneit, B.R.T.; Rasmussen, R.A. Air Quality Model Evaluation Data for Organics. 4. C2–C36 Non-Aromatic Hydrocarbons. Environ. Sci. Technol. 1997, 31, 2356–2367. [Google Scholar] [CrossRef]
- Blumberg, L.M.; David, F.; Klee, M.S.; Sandra, P. Comparison of one-dimensional and comprehensive two-dimensional separations by gas chromatography. J. Chromatogr. A 2008, 1188, 2–16. [Google Scholar] [CrossRef]
- Dallüge, J.; Beens, J.; Brinkman, U.A.T. Comprehensive two-dimensional gas chromatography: A powerful and versatile analytical tool. J. Chromatogr. A 2003, 1000, 69–108. [Google Scholar] [CrossRef]
- Lin, L.; Lee, M.L.; Eatough, D.J. Gas chromatographic analysis of organic marker compounds in fine particulate matter using solid-phase microextraction. J. Air Waste Manag. Assoc. 2007, 57, 53–58. [Google Scholar] [CrossRef] [PubMed][Green Version]
- Jacobson, M.C.; Hansson, H.-C.; Noone, K.J.; Charlson, R.J. Organic atmospheric aerosols: Review and state of the science. Rev. Geophys. 2000, 38, 267–294. [Google Scholar] [CrossRef]
- Lintelmann, J.; Fischer, K.; Karg, E.; Schröppel, A. Determination of selected polycyclic aromatic hydrocarbons and oxygenated polycyclic aromatic hydrocarbons in aerosol samples by high-performance liquid chromatography and liquid chromatography-tandem mass spectrometry. Anal. Bioanal. Chem. 2005, 381, 508–519. [Google Scholar] [CrossRef]
- Shimmo, M.; Anttila, P.; Hartonen, K.; Hyötyläinen, T.; Paatero, J.; Kulmala, M.; Riekkola, M.-L. Identification of organic compounds in atmospheric aerosol particles by on-line supercritical fluid extraction–liquid chromatography–gas chromatography–mass spectrometry. J. Chromatogr. A 2004, 1022, 151–159. [Google Scholar] [CrossRef]
- Canagaratna, M.R.; Jayne, J.T.; Jimenez, J.L.; Allan, J.D.; Alfarra, M.R.; Zhang, Q.; Onasch, T.B.; Drewnick, F.; Coe, H.; Middlebrook, A.; et al. Chemical and microphysical characterization of ambient aerosols with the aerodyne aerosol mass spectrometer. Mass Spectrom. Rev. 2007, 26, 185–222. [Google Scholar] [CrossRef]
- Brostrøm, A.; Kling, K.I.; Hougaard, K.S.; Mølhave, K. Complex Aerosol Characterization by Scanning Electron Microscopy Coupled with Energy Dispersive X-ray Spectroscopy. Sci. Rep. 2020, 10, 9150. [Google Scholar] [CrossRef] [PubMed]
- Marina-Montes, C.; Pérez-Arribas, L.V.; Anzano, J.; de Vallejuelo, S.F.-O.; Aramendia, J.; Gómez-Nubla, L.; de Diego, A.; Manuel Madariaga, J.; Cáceres, J.O. Characterization of atmospheric aerosols in the Antarctic region using Raman Spectroscopy and Scanning Electron Microscopy. Spectrochim. Acta Part A: Mol. Biomol. Spectrosc. 2022, 266, 120452. [Google Scholar] [CrossRef] [PubMed]
- Marina-Montes, C.; Motto-Ros, V.; Pérez-Arribas, L.V.; Anzano, J.; Millán-Martínez, M.; Cáceres, J.O. Aerosol analysis by micro laser-induced breakdown spectroscopy: A new protocol for particulate matter characterization in filters. Anal. Chim. Acta 2021, 1181, 338947. [Google Scholar] [CrossRef] [PubMed]
- Miziolek, A.W.; Palleschi, V.; Schechter, I. Laser Induced Breakdown Spectroscopy (LIBS), 1st ed.; Cambridge University Press: New York, NY, USA, 2006. [Google Scholar]
- Motto-Ros, V.; Sancey, L.; Wang, X.C.; Ma, Q.L.; Lux, F.; Bai, X.S.; Panczer, G.; Tillement, O.; Yu, J. Mapping nanoparticles injected into a biological tissue using laser-induced breakdown spectroscopy. Spectrochim. Acta B 2013, 87, 168–174. [Google Scholar] [CrossRef]
- Fabre, C. Advances in Laser-Induced Breakdown Spectroscopy analysis for geology: A critical review. Spectrochim. Acta B 2020, 166, 105799. [Google Scholar] [CrossRef]
- Anzano, J.M.; Cruz-Conesa, A.; Lasheras, R.J.; Marina-Montes, C.; Pérez-Arribas, L.V.; Cáceres, J.O.; Velásquez, A.I.; Palleschi, V. Multielemental analysis of Antarctic soils using calibration free laser-induced breakdown spectroscopy. Spectrochim. Acta B 2021, 180, 106191. [Google Scholar] [CrossRef]
- Caceres, J.O.; Moncayo, S.; Rosales, J.D.; de Villena, F.J.M.; Alvira, F.C.; Bilmes, G.M. Application of Laser-Induced Breakdown Spectroscopy (LIBS) and Neural Networks to Olive Oils Analysis. Appl. Spectrosc. 2013, 67, 1064–1072. [Google Scholar] [CrossRef] [PubMed]
- Moncayo, S.; Manzoor, S.; Rosales, J.D.; Anzano, J.; Caceres, J.O. Qualitative and quantitative analysis of milk for the detection of adulteration by Laser Induced Breakdown Spectroscopy (LIBS). Food Chem. 2017, 232, 322–328. [Google Scholar] [CrossRef] [PubMed]
- Cáceres, J.O.; Pelascini, F.; Motto-Ros, V.; Moncayo, S.; Trichard, F.; Panczer, G.; Marín-Roldán, A.; Cruz, J.A.; Coronado, I.; Martín-Chivelet, J. Megapixel multi-elemental imaging by Laser-Induced Breakdown Spectroscopy, a technology with considerable potential for paleoclimate studies. Sci. Rep. 2017, 7, 5080. [Google Scholar] [CrossRef] [PubMed]
- Rusak, D.A.; Marsico, R.M.; Taroli, B.L. Using laser-induced breakdown spectroscopy to assess preservation quality of archaeological bones by measurement of calcium-to-fluorine ratios. Appl. Spectrosc. 2011, 65, 1193–1196. [Google Scholar] [CrossRef]
- Wiens, R.C.; Wan, X.; Lasue, J.; Maurice, S. Chapter 20—Laser-induced breakdown spectroscopy in planetary science. In Laser-Induced Breakdown Spectroscopy, 2nd ed.; Singh, J.P., Thakur, S.N., Eds.; Elsevier: Amsterdam, The Netherlands, 2020; pp. 441–471. [Google Scholar]
- Cremers, D.A.; Radziemski, L.J. Handbook of Laser-Induced Breakdown Spectroscopy, 2nd ed.; Wiley-Blackwell: Oxford, UK, 2013. [Google Scholar]
- Ji, H.; Ding, Y.; Zhang, L.; Hu, Y.; Zhong, X. Review of aerosol analysis by laser-induced breakdown spectroscopy. Appl. Spectrosc. Rev. 2021, 56, 193–220. [Google Scholar] [CrossRef]
- Abás, E.; Marina-Montes, C.; Laguna, M.; Lasheras, R.; Rivas, P.; Peribáñez, P.; del Valle, J.; Escudero, M.; Velásquez, A.; Cáceres, J.O.; et al. Evidence of human impact in Antarctic region by studying atmospheric aerosols. Chemosphere 2022, 307, 135706. [Google Scholar] [CrossRef]
- Solomon, P.A.; Fraser, M.P.; Herckes, P. Methods for Chemical Analysis of Atmospheric Aerosols. In Aerosol Measurement: Principles, Techniques, and Applications, 3rd ed.; John Wiley & Sons: Hoboken, NJ, USA, 2011; pp. 153–177. [Google Scholar]
- Karar, K.; Gupta, A.K.; Kumar, A.; Biswas, A.K. Characterization and Identification of the Sources of Chromium, Zinc, Lead, Cadmium, Nickel, Manganese and Iron in PM10 Particulates at the Two Sites of Kolkata, India. Environ. Monit Assess. 2006, 120, 347–360. [Google Scholar] [CrossRef]
- Querol, X.; Alastuey, A.; Rodriguez, S.; Plana, F.; Ruiz, C.R.; Cots, N.; Massagué, G.; Puig, O. PM10 and PM2.5 source apportionment in the Barcelona Metropolitan area, Catalonia, Spain. Atmos. Environ. 2001, 35, 6407–6419. [Google Scholar] [CrossRef]
- Xu, G.; Gao, Y. Atmospheric trace elements in aerosols observed over the Southern Ocean and coastal East Antarctica. Polar Res. 2014, 33, 23973. [Google Scholar] [CrossRef]
- Fan, S.; Gao, Y.; Sherrell, R.M.; Yu, S.; Bu, K. Concentrations, particle-size distributions, and dry deposition fluxes of aerosol trace elements over the Antarctic Peninsula in austral summer. Atmos. Chem. Phys. 2021, 21, 2105–2124. [Google Scholar] [CrossRef]
- Gupta, D.; Eom, H.J.; Cho, H.R.; Ro, C.U. Hygroscopic behavior of NaCl–MgCl2 mixture particles as nascent sea-spray aerosol surrogates and observation of efflorescence during humidification. Atmos. Chem. Phys. 2015, 15, 11273–11290. [Google Scholar] [CrossRef]
- Sobanska, S.; Falgayrac, G.; Rimetz-Planchon, J.; Perdrix, E.; Brémard, C.; Barbillat, J. Resolving the internal structure of individual atmospheric aerosol particle by the combination of Atomic Force Microscopy, ESEM–EDX, Raman and ToF–SIMS imaging. Microchem. J. 2014, 114, 89–98. [Google Scholar] [CrossRef]
- Zhao, D.; Zhu, T.; Chen, Q.; Liu, Y.; Zhang, Z. Raman micro-spectrometry as a technique for investigating heterogeneous reactions on individual atmospheric particles. Sci. China Chem. 2011, 54, 154–160. [Google Scholar] [CrossRef]
- Lee, A.K.Y.; Chan, C.K. Single particle Raman spectroscopy for investigating atmospheric heterogeneous reactions of organic aerosols. Atmos. Environ. 2007, 41, 4611–4621. [Google Scholar] [CrossRef]
- Fletcher, R.A.; Ritchie, N.W.M.; Anderson, I.M.; Small, J.A. Microscopy and Microanalysis of Individual Collected Particles. In Aerosol Measurement: Principles, Techniques, and Applications, 3rd ed.; John Wiley & Sons: Hoboken, NJ, USA, 2011; pp. 179–232. [Google Scholar] [CrossRef]
- Signorell, R.; Reid, J.P. Fundamentals and Applications in Aerosol Spectroscopy; CRC press: Boca Raton, FL, USA, 2010. [Google Scholar]
- Cardell, C.; Guerra, I. An overview of emerging hyphenated SEM-EDX and Raman spectroscopy systems: Applications in life, environmental and materials sciences. TrAC Trends Anal. Chem. 2016, 77, 156–166. [Google Scholar] [CrossRef]
- Goldstein, J.I.; Newbury, D.E.; Echlin, P.; Joy, D.C.; Lyman, C.E.; Lifshin, E.; Michael, J.R. Scanning Electron Microscopy and X-ray Microanalysis, 3rd ed.; Springer: New York, NY, USA, 2003. [Google Scholar] [CrossRef]
- Fleming, Z.L.; Monks, P.S.; Manning, A.J. Review: Untangling the influence of air-mass history in interpreting observed atmospheric composition. Atmos. Res. 2012, 104–105, 1–39. [Google Scholar] [CrossRef]
- Pisso, I.; Sollum, E.; Grythe, H.; Kristiansen, N.I.; Cassiani, M.; Eckhardt, S.; Arnold, D.; Morton, D.; Thompson, R.L.; Groot Zwaaftink, C.D.; et al. The Lagrangian particle dispersion model FLEXPART version 10.4. Geosci. Model Dev. 2019, 12, 4955–4997. [Google Scholar] [CrossRef]
- Stein, A.F.; Draxler, R.R.; Rolph, G.D.; Stunder, B.J.B.; Cohen, M.D.; Ngan, F. NOAA’s HYSPLIT atmospheric transport and dispersion modeling system. Bull. Am. Meteorol. Soc. 2015, 96, 2059–2077. [Google Scholar] [CrossRef]
- Sprenger, M.; Wernli, H. The LAGRANTO Lagrangian analysis tool—Version 2.0. Geosci. Model Dev. 2015, 8, 2569–2586. [Google Scholar] [CrossRef]
- Jones, A.; Thomson, D.; Hort, M.; Devenish, B. The U.K. Met Office’s Next-Generation Atmospheric Dispersion Model, NAME III. In Air Pollution Modeling and Its Application XVII; Springer: Boston, MA, USA, 2007; pp. 580–589. [Google Scholar] [CrossRef]
- Bowman, K.P.; Lin, J.C.; Stohl, A.; Draxler, R.; Konopka, P.; Andrews, A.; Brunner, D. Input Data Requirements for Lagrangian Trajectory Models. Bull. Am. Meteorol. Soc. 2013, 94, 1051–1058. [Google Scholar] [CrossRef]
- Draxler, R.; Hess, G. An overview of the HYSPLIT_4 modeling system for trajectories, dispersion, and deposition. Aust. Meteorol. Mag. 1998, 47, 295–308. [Google Scholar]
- Stohl, A.; Eckhardt, S.; Forster, C.; James, P.; Spichtinger, N.; Seibert, P. A replacement for simple back trajectory calculations in the interpretation of atmospheric trace substance measurements. Atmos. Environ. 2002, 36, 4635–4648. [Google Scholar] [CrossRef]
- Freud, E.; Krejci, R.; Tunved, P.; Leaitch, R.; Nguyen, Q.T.; Massling, A.; Skov, H.; Barrie, L. Pan-Arctic aerosol number size distributions: Seasonality and transport patterns. Atmos. Chem. Phys. 2017, 17, 8101–8128. [Google Scholar] [CrossRef]
- Griffith, S.M.; Huang, W.S.; Lin, C.C.; Chen, Y.C.; Chang, K.E.; Lin, T.H.; Wang, S.H.; Lin, N.H. Long-range air pollution transport in East Asia during the first week of the COVID-19 lockdown in China. Sci. Total Environ. 2020, 741, 140214. [Google Scholar] [CrossRef]
- Innocente, E.; Squizzato, S.; Visin, F.; Facca, C.; Rampazzo, G.; Bertolini, V.; Gandolfi, I.; Franzetti, A.; Ambrosini, R.; Bestetti, G. Influence of seasonality, air mass origin and particulate matter chemical composition on airborne bacterial community structure in the Po Valley, Italy. Sci. Total Environ. 2017, 593–594, 677–687. [Google Scholar] [CrossRef] [PubMed]
- Liu, T.; Marlier, M.E.; DeFries, R.S.; Westervelt, D.M.; Xia, K.R.; Fiore, A.M.; Mickley, L.J.; Cusworth, D.H.; Milly, G. Seasonal impact of regional outdoor biomass burning on air pollution in three Indian cities: Delhi, Bengaluru, and Pune. Atmos. Environ. 2018, 172, 83–92. [Google Scholar] [CrossRef]
- Masiol, M.; Hopke, P.K.; Felton, H.D.; Frank, B.P.; Rattigan, O.V.; Wurth, M.J.; LaDuke, G.H. Analysis of major air pollutants and submicron particles in New York City and Long Island. Atmos. Environ. 2017, 148, 203–214. [Google Scholar] [CrossRef]
- Mendez-Espinosa, J.F.; Belalcazar, L.C.; Morales Betancourt, R. Regional air quality impact of northern South America biomass burning emissions. Atmos. Environ. 2019, 203, 131–140. [Google Scholar] [CrossRef]
- Sanchez, K.J.; Roberts, G.C.; Saliba, G.; Russell, L.M.; Twohy, C.; Reeves, M.J.; Humphries, R.S.; Keywood, M.D.; Ward, J.P.; McRobert, I.M. Measurement report: Cloud processes and the transport of biological emissions affect Southern Ocean particle and cloud condensation nuclei concentrations. Atmos. Chem. Phys. 2021, 21, 3427–3446. [Google Scholar] [CrossRef]
- Talbi, A.; Kerchich, Y.; Kerbachi, R.; Boughedaoui, M. Assessment of annual air pollution levels with PM1, PM2.5, PM10 and associated heavy metals in Algiers, Algeria. Environ. Pollut. 2018, 232, 252–263. [Google Scholar] [CrossRef]
- Decesari, S.; Paglione, M.; Rinaldi, M.; Dall’Osto, M.; Simo, R.; Zanca, N.; Volpi, F.; Facchini, M.; Hoffmann, T.; Gotz, S.; et al. Shipborne measurements of Antarctic submicron organic aerosols: An NMR perspective linking multiple sources and bioregions. Atmos. Chem. Phys. 2020, 20, 4193–4207. [Google Scholar] [CrossRef]
- Deng, J.; Gao, Y.; Zhu, J.; Li, L.; Yu, S.; Kawamura, K.; Fu, P. Molecularmarkers for fungal spores and biogenic SOA over the Antarctic Peninsula: Field measurements and modeling results. Sci. Total Environ. 2021, 762, 143089. [Google Scholar] [CrossRef] [PubMed]
- Goncalves, S.; Weis, J.; China, S.; Evangelista, H.; Harder, T.; Muller, S.; Sampaio, M.; Laskin, A.; Gilles, M.; Godoi, R. Photochemical reactions on aerosols at West Antarctica: A molecular case-study of nitrate formation among sea salt aerosols. Sci. Total Environ. 2021, 758, 143586. [Google Scholar] [CrossRef] [PubMed]
- Jang, E.; Park, K.; Yoon, Y.; Kim, T.; Hong, S.; Becagli, S.; Traversi, R.; Kim, J.; Gim, Y. New particle formation events observed at the King Sejong Station, Antarctic Peninsula—Part 2: Link with the oceanic biological activities. Atmos. Chem. Phys. 2019, 19, 7595–7608. [Google Scholar] [CrossRef]
- Hara, K.; Nishita-Hara, C.; Osada, K.; Yabuki, M.; Yamanouchi, T. Characterization of aerosol number size distributions and their effect on cloud properties at Syowa Station, Antarctica. Atmos. Chem. Phys. 2021, 21, 12155–12172. [Google Scholar] [CrossRef]
- Boreddy, S.; Hegde, P.; Aswini, A.; Girach, I.; Koushik, N.; Nalini, K. Impact of ice -free oases on particulate matter over the East Antarctic: Inferences from the carbonaceous, water-soluble species and trace metals Cheok u ales. Polar Sci. 2020, 24, 100520. [Google Scholar] [CrossRef]
- Gonzalez, R.; Toledano, C.; Roman, R.; Mateos, D.; Asmi, E.; Rodriguez, E.; Lau, I.; Ferrara, J.; D’Elia, R.; Antuna-Sanchez, J.; et al. Characterization of Stratospheric Smoke Particles over the Antarctica by Remote Sensing Instruments. Remote Sens. 2020, 12, 3769. [Google Scholar] [CrossRef]
- Lachlan-Cope, T.; Beddows, D.; Brough, N.; Jones, A.; Harrison, R.; Lupi, A.; Yoon, Y.; Virkkula, A.; Dall’Osto, M. On the annual variability of Antarctic aerosol size distributions at Halley Research Station. Atmos. Chem. Phys. 2020, 20, 4461–4476. [Google Scholar] [CrossRef]
- Ding, M.; Tian, B.; Ashley, M.; Putero, D.; Zhu, Z.; Wang, L.; Yang, S.; Li, C.; Xiao, C. Year-round record of near-surface ozone and O3 enhancement events (OEEs) at Dome A, East Antarctica. Earth Syst. Sci. Data 2020, 12, 3529–3544. [Google Scholar] [CrossRef]
- Gao, Y.; Yu, S.; Sherrell, R.; Fan, S.; Bu, K.; Anderson, J. Particle-Size Distributions and Solubility of Aerosol Iron Over the Antarctic Peninsula During Austral Summer. J. Geophys. Res. -Atmos. 2020, 125, e2019JD032082. [Google Scholar] [CrossRef]
- Hara, K.; Sudo, K.; Ohnishi, T.; Osada, K.; Yabuki, M.; Shiobara, M.; Yamanouchi, T. Seasonal features and origins of carbonaceous aerosols at Syowa Station, coastal Antarctica. Atmos. Chem. Phys. 2019, 19, 7817–7837. [Google Scholar] [CrossRef]
- Herenz, P.; Wex, H.; Mangold, A.; Laffineur, Q.; Gorodetskaya, I.V.; Fleming, Z.L.; Panagi, M.; Stratmann, F. CCN measurements at the Princess Elisabeth Antarctica research station during three austral summers. Atmos. Chem. Phys. 2019, 19, 275–294. [Google Scholar] [CrossRef]
- Hong, S.; Yoon, Y.; Becagli, S.; Gim, Y.; Chambers, S.; Park, K.; Park, S.; Traversi, R.; Severi, M.; Vitale, V.; et al. Seasonality of aerosol chemical composition at King Sejong Station (Antarctic Peninsula) in 2013. Atmos. Environ. 2020, 223, 117185. [Google Scholar] [CrossRef]
- Nadzir, M.; Cain, M.; Robinson, A.; Bolas, C.; Harris, N.; Parnikoza, I.; Salimun, E.; Mustafa, E.; Alhasa, K.; Zainuddin, M.; et al. Isoprene hotspots at the Western Coast of Antarctic Peninsula during MASEC’16. Polar Sci. 2019, 20, 63–74. [Google Scholar] [CrossRef]
- Simmons, J.B.; Humphries, R.S.; Wilson, S.R.; Chambers, S.D.; Williams, A.G.; Griffiths, A.D.; McRobert, I.M.; Ward, J.P.; Keywood, M.D.; Gribben, S. Summer aerosol measurements over the East Antarctic seasonal ice zone. Atmos. Chem. Phys. 2021, 21, 9497–9513. [Google Scholar] [CrossRef]
- Xu, G.; Chen, L.; Xu, T.; He, S.; Gao, Y. Distributions of water-soluble ions in size-aggregated aerosols over the Southern Ocean and coastal Antarctica. Environ. Sci. -Process. Impacts 2021, 23, 1316–1327. [Google Scholar] [CrossRef]
- Zeppenfeld, S.; van Pinxteren, M.; van Pinxteren, D.; Wex, H.; Berdalet, E.; Vaqué, D.; Dall’Osto, M.; Herrmann, H. Aerosol Marine Primary Carbohydrates and Atmospheric Transformation in the Western Antarctic Peninsula. ACS Earth Space Chem. 2021, 5, 1032–1047. [Google Scholar] [CrossRef]
- Dupont, M.F.; Elbourne, A.; Cozzolino, D.; Chapman, J.; Truong, V.K.; Crawford, R.J.; Latham, K. Chemometrics for environmental monitoring: A review. Anal. Methods 2020, 12, 4597–4620. [Google Scholar] [CrossRef]
- Mostert, M.M.R.; Ayoko, G.A.; Kokot, S. Application of chemometrics to analysis of soil pollutants. Trac-Trends Anal. Chem. 2010, 29, 430–445. [Google Scholar] [CrossRef]
- Mas, S.; de Juan, A.; Tauler, R.; Olivieri, A.C.; Escandar, G.M. Application of chemometric methods to environmental analysis of organic pollutants: A review. Talanta 2010, 80, 1052–1067. [Google Scholar] [CrossRef]
- Hopke, P.K. Chemometrics applied to environmental systems. Chemom. Intell. Lab. Syst. 2015, 149, 205–214. [Google Scholar] [CrossRef]
- Gredilla, A.; de Vallejuelo, S.F.O.; Elejoste, N.; de Diego, A.; Madariaga, J.M. Non-destructive Spectroscopy combined with chemometrics as a tool for Green Chemical Analysis of environmental samples: A review. Trac-Trends Anal. Chem. 2016, 76, 30–39. [Google Scholar] [CrossRef]
- Wu, Q.; Marina-Montes, C.; Cáceres, J.O.; Anzano, J.; Motto-Ros, V.; Duponchel, L. Interesting features finder (IFF): Another way to explore spectroscopic imaging data sets giving minor compounds and traces a chance to express themselves. Spectrochim. Acta Part B: At. Spectrosc. 2022, 195, 106508. [Google Scholar] [CrossRef]
- Pérez-Arribas, L.; León-Gonzalez, M.E.; Rosales-Conrado, N. Learning Principal Component Analysis by Using Data from Air Quality Networks. Journa Chem. Educ. 2017, 94, 458–464. [Google Scholar] [CrossRef]
- Siepka, D.; Uzu, G.; Stefaniak, E.A.; Sobanska, S. Combining Raman microspectrometry and chemometrics for determining quantitative molecular composition and mixing state of atmospheric aerosol particles. Microchem. J. 2018, 137, 119–130. [Google Scholar] [CrossRef]
- Yotova, G.I.; Tsitouridou, R.; Tsakovski, S.L.; Simeonov, V.D. Urban air quality assessment using monitoring data of fractionized aerosol samples, chemometrics and meteorological conditions. J. Environ. Sci. Health Part A-Toxic/Hazard. Subst. Environ. Eng. 2016, 51, 544–552. [Google Scholar] [CrossRef]
- Nunez-Alonso, D.; Perez-Arribas, L.V.; Manzoor, S.; Caceres, J.O. Statistical Tools for Air Pollution Assessment: Multivariate and Spatial Analysis Studies in the Madrid Region. J. Anal. Methods Chem. 2019, 2019, 9753927. [Google Scholar] [CrossRef]
- Pires, J.C.M.; Sousa, S.I.V.; Pereira, M.C.; Alvim-Ferraz, M.C.M.; Martins, F.G. Management of air quality monitoring using principal component and cluster analysis—Part I: SO2 and PM10. Atmos. Environ. 2008, 42, 1249–1260. [Google Scholar] [CrossRef]
- Morozzi, P.; Ballarin, B.; Arcozzi, S.; Brattich, E.; Lucarelli, F.; Nava, S.; Gomez-Cascales, P.J.; Orza, J.A.G.; Tositti, L. Ultraviolet-Visible Diffuse Reflectance Spectroscopy (UV-Vis DRS), a rapid and non-destructive analytical tool for the identification of Saharan dust events in particulate matter filters. Atmos. Environ. 2021, 252, 118297. [Google Scholar] [CrossRef]
- Dadashi, M.; Abdollahi, H.; Tauler, R. Application of maximum likelihood multivariate curve resolution to noisy data sets. J. Chemom. 2013, 27, 34–41. [Google Scholar] [CrossRef]
- Galán-Madruga, D.; García-Cambero, J.P. An optimized approach for estimating benzene in ambient air within an air quality monitoring network. J. Environ. Sci. 2022, 111, 164–174. [Google Scholar] [CrossRef]
- Elcoroaristizabal, S.; Amigo, J.M. Near infrared hyperspectral imaging as a tool for quantifying atmospheric carbonaceous aerosol. Microchem. J. 2021, 160, 105619. [Google Scholar] [CrossRef]
- Perez-Rial, D.; Lopez-Mahia, P.; Tauler, R. Investigation of the source composition and temporal distribution of volatile organic compounds (VOCs) in a suburban area of the northwest of Spain using chemometric methods. Atmos. Environ. 2010, 44, 5122–5132. [Google Scholar] [CrossRef]
- Rovira, J.; Domingo, J.L.; Schuhmacher, M. Air quality, health impacts and burden of disease due to air pollution (PM10, PM2.5, NO2 and O3): Application of AirQ plus model to the Camp de Tarragona County (Catalonia, Spain). Sci. Total Environ. 2020, 703, 135538. [Google Scholar] [CrossRef] [PubMed]
- Wyche, K.P.; Monks, P.S.; Smallbone, K.L.; Hamilton, J.F.; Alfarra, M.R.; Rickard, A.R.; McFiggans, G.B.; Jenkin, M.E.; Bloss, W.J.; Ryan, A.C.; et al. Mapping gas-phase organic reactivity and concomitant secondary organic aerosol formation: Chemometric dimension reduction techniques for the deconvolution of complex atmospheric data sets. Atmos. Chem. Phys. 2015, 15, 8077–8100. [Google Scholar] [CrossRef]
- Binaku, K.; Schmeling, M. Multivariate statistical analyses of air pollutants and meteorology in Chicago during summers 2010-2012. Air Qual. Atmos. Health 2017, 10, 1227–1236. [Google Scholar] [CrossRef]
- Galán Madruga, D.; Fernández Patier, R.; Sintes Puertas, M.A.; Romero García, M.D.; Cristóbal López, A. Characterization and Local Emission Sources for Ammonia in an Urban Environment. Bull. Environ. Contam. Toxicol. 2018, 100, 593–599. [Google Scholar] [CrossRef]
- Galán-Madruga, D.; Terroba, J.M.; dos Santos, S.G.; Úbeda, R.M.; García-Cambero, J.P. Indoor and Outdoor PM10-Bound PAHs in an Urban Environment. Similarity of Mixtures and Source Attribution. Bull. Environ. Contam. Toxicol. 2020, 105, 951–957. [Google Scholar] [CrossRef]
- Marc, M.; Bielawska, M.; Simeonov, V.; Namiesnik, J.; Zabiegala, B. The effect of anthropogenic activity on BTEX, NO2, SO2, and CO concentrations in urban air of the spa city of Sopot and medium-industrialized city of Tczew located in North Poland. Environ. Res. 2016, 147, 513–524. [Google Scholar] [CrossRef]
- Galán-Madruga, D. A methodological framework for improving air quality monitoring network layout. Applications to environment management. J. Environ. Sci. 2021, 102, 138–147. [Google Scholar] [CrossRef]
- Elcoroaristizabal, S.; de Juan, A.; Garcia, J.A.; Elorduy, I.; Durana, N.; Alonso, L. Chemometric determination of PAHs in aerosol samples by fluorescence spectroscopy and second-order data analysis algorithms. J. Chemom. 2014, 28, 260–271. [Google Scholar] [CrossRef]
- Takahama, S.; Dillner, A.M. Model selection for partial least squares calibration and implications for analysis of atmospheric organic aerosol samples with mid-infrared spectroscopy. J. Chemom. 2015, 29, 659–668. [Google Scholar] [CrossRef]
- Yadav, S.; Praveen, O.D.; Satsangi, P.G. The effect of climate and meteorological changes on particulate matter in Pune, India. Environ. Monit. Assess. 2015, 187, 402. [Google Scholar] [CrossRef] [PubMed]
- Astel, A.; Simeonov, V.; Bauer, H.; Puxbaum, H. Multidimensional modeling of aerosol monitoring data. Environ. Pollut. 2010, 158, 3201–3208. [Google Scholar] [CrossRef] [PubMed]
- Emami, F.; Hopke, P.K. Effect of adding variables on rotational ambiguity in positive matrix factorization solutions. Chemom. Intell. Lab. Syst. 2017, 162, 198–202. [Google Scholar] [CrossRef]
- Masiol, M.; Squizzato, S.; Rampazzo, G.; Pavoni, B. Source apportionment of PM2.5 at multiple sites in Venice (Italy): Spatial variability and the role of weather. Atmos. Environ. 2014, 98, 78–88. [Google Scholar] [CrossRef]
- Wilks, D.S. Statistical Methods in the Atmospheric Sciences; Academic Press: New York, NY, USA, 2011. [Google Scholar]
- Mehmood, T.; Ahmed, B. The diversity in the applications of partial least squares: An overview. J. Chemom. 2016, 30, 4–17. [Google Scholar] [CrossRef]
- Paatero, P.; Tapper, U. Positive matrix factorization: A non-negative factor model with optimal utilization of error estimates of data values. Environmetrics 1994, 5, 111–126. [Google Scholar] [CrossRef]
- Sun, X.; Wang, H.; Guo, Z.; Lu, P.; Song, F.; Liu, L.; Liu, J.; Rose, N.L.; Wang, F. Positive matrix factorization on source apportionment for typical pollutants in different environmental media: A review. Environ. Sci. Process. Impacts 2020, 22, 239–255. [Google Scholar] [CrossRef]


| Sampling Location (within the Antarctic Region) | Study Period | Collected Phase | Sampling System | Target Compound Groups | Analysis Techniques | Reference |
|---|---|---|---|---|---|---|
| Signy Island, Antarctica (research station of the British Antarctic Survey) | From 5 December 1994 to 2 April 1995 (17 weeks) | Particulate matter Gaseous | Particles: high-volume sampler (glass fiber filter of 142 mm) Gas: PUF 1 (diameter: 100 mm, thickness: 50 mm, and 25 kg/m3 density) | OCPs 2 and PCBs 3 | LRMS or HRMS 4 | [46] |
| King George Island | From 18 December 2004 to 5 December 2005 | Gaseous | XAD resin-based passive air samplers | PCBs and OCPs | GC/MS | [47] |
| Northern Victoria Land (Terra Nova Bay) | From 4 November 2003 to 30 January 2004 | Particulate matter Gaseous | Particles: high-volume active air sampler (quartz fiber filter) Gas: PUF (65-mm diameter and 75-mm height) | OCPs | GC/ECD 5 | [48] |
| Ross Sea Region (Northern Victoria Land) | Not defined (several Italian Antarctic Expeditions) | Gaseous | Modified diaphragm pump system and canisters | VCHCs 6 | CTI-GC–MS 7 | [49] |
| Three sites on the Barton Peninsula, King Sejong Station (King George Island) | August 2005–August 2006 (site 1), August 2006–August 2007 (site 2), and June 2008–June 2009 (site3) | Gaseous | XAD-2 resin-based passive air samplers | PCBs and OCPs | GC/HRMS | [50] |
| King George Island | From 8 December 2009 to 7 February 2010 (Austral summer) | Gaseous | PUF-based passive air samplers. Parameters: diameter of 14 cm, thickness of 1.35 cm, surface area of 365 cm2, volume of 207 cm | PCBs and PBDEs 8 | HRMS | [51] |
| Terra Nova Bay | Austral summer 2009–2010 | Particulate matter Gaseous | Particles: high-volume sampler (quartz fiber filter of 102 mm, porosity of 1 µm) Gas: PUF (65-mm diameter, 75-mm height) | PCDD/Fs 9, PCBs, PCNs 10, PBDEs, and PAHs 11 | GC/MS 12 (single quadrupole) | [52] |
| King George Island, Fildes Peninsula of Antarctica | From 16 January to 8 February 2013 | Particulate matter Gaseous | Particles: high-volume sampler (glass fiber filter) Gas: PUF | CPs 13 | GC-MS/MS (triple quadrupole) | [53] |
| Palmer Peninsula (Palmer Station) | From 19 October to 11 November 2010 | Particulate matter Gaseous | Particles: high-volume air sampler (glass fiber filter, 8 in × 10 in) Gas: PUF (7.8-cm diameter × 7.5 cm thick) | PCBs, OCPs and PBDEs | GC-MS/MS (triple quadrupole) | [54] |
| Terra Nova Bay (Mario Zucchelli Station) | From December 2010 to January 2011 | Gaseous | PUF disk (14-cm diameter, 1.35 cm thick, surface area of 365 cm2, mass of 4.40 g, volume of 207 cm3, density of 21.3 mg/cm3) | PCBs and OCPs | GC/MS | [55] |
| King George Island (Chinese Great Wall Station) | From January 2011 to January 2014 | Particulate matter Gaseous | Particles: high-volume air sampler (glass fiber filter) Gas: PUF | PCBs and PBDEs | HRGC/HRMS 14 | [56] |
| Bransfield Strait | Austral summer of 2014 | Particulate matter Gaseous | Particles: high-volume air sampler (glass fiber filter, rectangular, 250 × 200 mm) Gas: PUF (95-mm diameter and 50-mm height) | PAHs | GC/MS | [57] |
| Livingston Island (South Shetlands Archipelago) | From 1 December 2014 to March 1 2015 | Gaseous | PUF (10 × 2 cm) | PAHs | GC/MS | [58] |
| Brazilian Comandante Ferraz Antarctic Station | Antarctic summer in 2012 | Gaseous | Radiello passive samplers (impregnated with 2,4-dinitrophenyhydrazones) | Aldehydes | HPLC/UV 15 | [59] |
| King George Island (Chinese Great Wall Station) | From January 2011 to January 2014 | Particulate matter Gaseous | Particles: high-volume air sampler (glass fiber filter) Gas: PUF | OCPs | HRMS | [60] |
| Fildes Peninsula (King George Island) | From December 2010 to January 2018 | Gaseous | XAD-2 resin passive air samplers | PCBs, PBDEs and OCPs | HRGC-HRMS | [61] |
| Fildes Peninsula (King George Island) | Summers of 2013–2019 | Particulate matter Gaseous | Particles: active high-volume sampler (glass fiber filter, rectangular, 250 × 200 mm) Gas: PUF (95-mm diameter and 50-mm height) | PAHs | GC/MS | [62] |
| King George Island (Chinese Great Wall Station) | From 2011 to 2018 | Particulate matter Gaseous | Particles: high-volume active air sampler (glass fiber filter) Gas: PUF | NBFRs 16 | GC/MS | [63] |
| Wilkes Land (Casey Station)Dronning Maud Land (Troll Station) | From 2010 to 2015 Throughout 2013 | Gaseous (Casey) Particulate matter and gaseous (Troll) | Gas: High flow-through passive air sampler (PUF, Casey) Particles: high-volume active sampling (glass fiber filters) Gas: PUF (Troll) | PBDEs | HRMS | [64] |
| King George Island (Chinese Great Wall Station) | From 2014 to 2018 | Particulate matter Gaseous | Particles: active high-volume sampler (glass fiber filter, diameter: 102 mm) Gas: PUF (diameter: 2.5 in; 3 in high) | CPs | GC-MS/MS (QTOF, quadrupole time of flying) | [65] |
| Sampling Location (within the Antarctic Region) | Study Period | Collected Phase | Sampling System | Target Compound Groups | Analysis Techniques | Ref. |
|---|---|---|---|---|---|---|
| Terra Nova Bay | 2000–2001 austral summer | Particulate Matter PM10 | Cellulose filters | Cd, Pb, and Cu | SWASV 1 | [86] |
| McMurdo Station | 1995–1996 and 1996–1997 austral summers | Particulate Matter PM10 | Quartz fiber filter and Teflon filters | Pb and Zn | XRF 2 | [87] |
| King George Island | From January 2000 to December 2001 | Particulate Matter PM10 | TFE Teflon filter | Bi, Cd, Co, Cr, Cu, Ni, V, and Zn | ICP-MS 3 | [44] |
| Terra Nova Bay | From November 2000 to February 2001 and from November 2001 to February 2002 | Particulate Matter PM10 | Cellulose filters | Li, Pb, Cd, U, Ba, Bi, Cs, Rb, Tl, Sr, Al, V, Fe, Cu, Mn, Zn, Co, and Ag | ICP-SFMS 4 | [88] |
| Terra Nova Bay | From mid-November 2000 to mid-February 2001 | Particulate Matter PM10 | Cellulose filters | Cd, Pb, and Cu | SWASV | [89] |
| Chinese Zhongshan Station | From February 2005 to November 2008 | Particulate Matter PM10 | Paper filters | Al, V, Cr, Fe, Cu, Zn, and Pb | ICP-MS | [90] |
| Deception Island | From December 2016 to February 2017 | Particulate Matter PM10 | Quartz microfiber filter papers | Hf, Zr, V, As, Ti, Mn, Cu, Sn, Zn, and Pb | ICP-MS | [43] |
| Larsemann Hills | From December 2009 to February 2010 | PM10 and PM2.5 | Glass microfiber filter and Teflon microfiber filters | Na, K, Ca, Mg, Fe, Al, Sr, Sb, Zn, Mn, Cu, and Pb | AAS 5 | [91] |
| Terra Nova Bay | From November 2017 to January 2018 | Particulate Matter PM10 | Cellulose filters | Hg | Direct Mercury Analyzer® | [92] |
| Dome C (Concordia Station) | From December 2005 to 14 January 2006 | Particulate Matter PM10 | Cellulose filters | Cd, Pb, and Cu | Voltammetric determinations | [41] |
| Terra Nova Bay | From 29 November 2010 to 23 January 2011 | Particulate Matter PM10 | Cellulose filters | Cr, Cu, Mo, and Pb | ICP-AES 6 ICP-MS | [93] |
| Deception Island | From December 2016 to February 2017 | Particulate Matter PM10 | Quartz microfiber filters | Al, Ca, Fe, K, Mg, Na, P, S, Cu, Pb, Sr, Ti, Zn, Hf, Zr, V, As, Ti, Mn, Sn, and Cr | ICP-AES ICP-MS | [23] |
| Deception Island | From December 2016 to February 2017 | Particulate Matter PM10 | Quartz microfiber filters | Al, Ca, Fe, K, Mg, Na, P, S, Cu, Pb, Sr, Ti, Zn, and Cr | ICP-AES ICP-MS | [94] |
| Neumayer station | From March 1999 to December 2003 | Aerosol | Cellulose filters | Li, Na, K, Mg, Ca, Sr, Al, La, Ce, Nd, and Se | ICP-QMS 7 | [95] |
| H | C | N | O | Mg | S | Cl | K | Ca | Fe | Cu | Zn |
|---|---|---|---|---|---|---|---|---|---|---|---|
| 1H (99.985) | 12C (98.89) | 14N (99.63) | 16O 99.759) | 24Mg (78.70) | 32S (95.02) | 35Cl (75.53) | 39K (93.10) | 40Ca (96.97) | 54Fe (5.82) | 63Cu (69.09) | 64Zn (48.89) |
| 2H (0.015) | 13C (1.11) | 15N (0.37) | 17O (0.037) | 25Mg (1.13) | 33S (0.75) | 37Cl (24.47) | 40K (0.0118) | 42Ca (0.64) | 56Fe (91.66) | 65Cu (30.91) | 66Zn (27.81) |
| 26Mg (11.17) | 34S (4.21) | 41K (6.88) | 43Ca (0.145) | 57Fe (2.19) | 67Zn (4.11) | ||||||
| 36S (0.02) | 44Ca (2.06) | 58Fe (0.33) | 68Zn (18.57) | ||||||||
| 46Ca (0.033) | 70Zn (0.62) | ||||||||||
| 48Ca (0.18) |
Publisher’s Note: MDPI stays neutral with regard to jurisdictional claims in published maps and institutional affiliations. |
© 2022 by the authors. Licensee MDPI, Basel, Switzerland. This article is an open access article distributed under the terms and conditions of the Creative Commons Attribution (CC BY) license (https://creativecommons.org/licenses/by/4.0/).
Share and Cite
Anzano, J.; Abás, E.; Marina-Montes, C.; del Valle, J.; Galán-Madruga, D.; Laguna, M.; Cabredo, S.; Pérez-Arribas, L.-V.; Cáceres, J.; Anwar, J. A Review of Atmospheric Aerosols in Antarctica: From Characterization to Data Processing. Atmosphere 2022, 13, 1621. https://doi.org/10.3390/atmos13101621
Anzano J, Abás E, Marina-Montes C, del Valle J, Galán-Madruga D, Laguna M, Cabredo S, Pérez-Arribas L-V, Cáceres J, Anwar J. A Review of Atmospheric Aerosols in Antarctica: From Characterization to Data Processing. Atmosphere. 2022; 13(10):1621. https://doi.org/10.3390/atmos13101621
Chicago/Turabian StyleAnzano, Jesús, Elisa Abás, César Marina-Montes, Javier del Valle, David Galán-Madruga, Mariano Laguna, Susana Cabredo, Luis-Vicente Pérez-Arribas, Jorge Cáceres, and Jamil Anwar. 2022. "A Review of Atmospheric Aerosols in Antarctica: From Characterization to Data Processing" Atmosphere 13, no. 10: 1621. https://doi.org/10.3390/atmos13101621
APA StyleAnzano, J., Abás, E., Marina-Montes, C., del Valle, J., Galán-Madruga, D., Laguna, M., Cabredo, S., Pérez-Arribas, L.-V., Cáceres, J., & Anwar, J. (2022). A Review of Atmospheric Aerosols in Antarctica: From Characterization to Data Processing. Atmosphere, 13(10), 1621. https://doi.org/10.3390/atmos13101621