Article

Longitudinal Ambient PM2.5 Measurement at Fifteen Locations in Eight Sub-Saharan African Countries Using Low-Cost Sensors

by
Babatunde Awokola
1,2,*,
Gabriel Okello
3,4,
Olatunji Johnson
5,
Ruaraidh Dobson
6,
Abdoul Risgou Ouédraogo
7,
Bakary Dibba
2,
Mbatchou Ngahane
8,
Chizalu Ndukwu
9,
Chuka Agunwa
10,
Diana Marangu
11,
Herve Lawin
12,
Ifeoma Ogugua
10,
Joy Eze
10,
Nnamdi Nwosu
10,
Ogochukwu Ofiaeli
9,
Peter Ubuane
13,
Rashid Osman
14,
Endurance Awokola
15,
Annette Erhart
2,
Kevin Mortimer
1,16,17,
Christopher Jewell
18 and
Sean Semple
6
add Show full author list remove Hide full author list
1
Department of Clinical Sciences, Liverpool School of Tropical Medicine, Liverpool L3 5QA, UK
2
Medical Research Council The Gambia Unit, London School of Hygiene and Tropical Medicine, Fajara 220, The Gambia
3
Institute for Leadership Sustainability, University of Cambridge, Cambridge CB2 1GG, UK
4
African Centre for Clean Air, Kampala 00256, Uganda
5
Department of Mathematics, University of Manchester, Manchester M13 9PL, UK
6
Institute for Social Marketing and Health, University of Stirling, Scotland FK9 4LA, UK
7
Health Training & Research Unit, Joseph KI-ZERBO University, Ouagadougou 6614, Burkina Faso
8
Department of Internal Medicine, Douala General Hospital, Douala 4108, Cameroon
9
Department of Paediatrics, Nnamdi Azikiwe University, Anambra 420007, Nigeria
10
Paediatrics Department, Public Health Department, Internal Medicine Department, University of Nigeria Teaching Hospital, Ituku-Ozalla, Enugu 400001, Nigeria
11
Department of Paediatrics & Child Health, University of Nairobi, Nairobi 00100, Kenya
12
Occupational Health Unit, University of Abomey Calavi, Godomey BP 526, Benin
13
Department of Paediatrics, Lagos State University Teaching Hospital, Bariga, Lagos 100223, Nigeria
14
Department of Lung Health, Epidemiological Laboratory (Epi-Lab), Khartoum 11111, Sudan
15
College of Nursing Science, American International University West Africa, Serrekunda 220, The Gambia
16
Department of Medicine, University of Cambridge, Cambridge CB2 0AW, UK
17
Liverpool University Hospitals NHS Foundation Trust, Liverpool, Merseyside L7 8XP, UK
18
Centre for Health Informatics, Computing & Statistics (CHICAS), Lancaster University, Lancaster LA1 4YW, UK
*
Author to whom correspondence should be addressed.
Atmosphere 2022, 13(10), 1593; https://doi.org/10.3390/atmos13101593
Submission received: 29 August 2022 / Revised: 20 September 2022 / Accepted: 24 September 2022 / Published: 29 September 2022

Abstract

:
Air pollution is a major global public health issue causing considerable morbidity and mortality. Measuring levels of air pollutants and facilitating access to the data has been identified as a pathway to raise awareness and initiate dialogue between relevant stakeholders. Low-and middle-income countries (LMICs) urgently need simple, low-cost approaches to generate such data, especially in settings with no or unreliable data. We established a network of easy-to-use low-cost air quality sensors (PurpleAir-II-SD) to monitor fine particulate matter (PM2.5) concentrations at 15 sites, in 11 cities across eight sub-Saharan Africa (sSA) countries between February 2020 and January 2021. Annual PM2.5 concentrations, seasonal and temporal variability were determined. Time trends were modelled using harmonic regression. Annual PM2.5 concentrations ranged between 10 and 116 µg/m3 across study sites, exceeding the current WHO annual mean guideline level of 5 µg/m3. The largest degree of seasonal variation was seen in Nigeria, where seven sites showed higher PM2.5 levels during the dry than during the wet season. Other countries with less pronounced dry/wet season variations were Benin (20 µg/m3 versus 5 µg/m3), Uganda (50 µg/m3 versus 45 µg/m3), Sukuta (Gambia) (20 µg/m3 versus 15 µg/m3) and Kenya (30 µg/m3 versus 25 µg/m3). Diurnal variation was observed across all sites, with two daily PM2.5 peaks at about 06:00 and 18:00 local time. We identified high levels of air pollution in the 11 African cities included in this study. This calls for effective control measures to protect the health of African urban populations. The PM2.5 peaks around ‘rush hour’ suggest traffic-related emissions should be a particular area for attention.

1. Introduction

Globally, air pollution is responsible for seven million premature deaths annually, making it a public health issue of a magnitude comparable to tobacco smoking, unhealthy diet, and climate change [1,2]. Ambient or outdoor air pollution causes approximately 4.9 million premature deaths per year worldwide [3]. The fine particles (PM2.5) in polluted air that penetrate the lungs and cardiovascular system increase the risk of many diseases including lung cancer, chronic obstructive pulmonary disease (COPD), pneumonia, stroke, and heart disease [4,5,6,7].
Industrial expansion and rapid population growth has contributed to progressively worsening ambient air pollution in major cities in sub-Saharan Africa (sSA), as confirmed by the high PM2.5 concentrations measured in several countries [8,9]. Indeed, measurements from the pilot phase of the Measuring Air Pollution for Advocacy in Africa (MA3) project showed that PM2.5 concentrations in sSA cities like Kampala (Uganda), Lagos (Nigeria), Nnewi (Anambra, Nigeria) ranged between 50 µg/m3 and 90 µg/m3: considerably higher than the <20 µg/m3 concentrations typically recorded in many North American and European cities [8,10].
Based on the 2021 WHO guidelines, about 90% of the world’s population is thought to breathe polluted air [11,12]. Although local solutions to high air pollutant concentrations will vary from place to place [13,14,15,16], continuous monitoring of air pollution can help identify the “pollution hotspots” and map temporal and spatial variations over time. This can additionally assist in identifying local sources of air pollution.
Making data on air pollutant concentrations available is a key prerequisite to initiate a health dialogue around clean air [17]. This dialogue encompasses exposure scientists, citizen scientists, clinicians, decision makers, public health experts and global health organizations/watchdogs such as WHO [18,19]. Continuous air-quality monitoring (AQM) is unavailable in many sSA cities and previous attempts to establish measurement networks have failed after a short period of time—often due to the high costs of maintaining equipment [20].
In a recent publication, we reported results of a low-cost sensor use for longitudinal ambient PM2.5 measurement in seven countries [10]. Data showed a median data recovery rate of 94% (range: 72–100%) using PurpleAir-II-SD devices, a mean 24-h PM2.5 concentration of 38 µg/m3 (range 15–91 µg/m3), the longest periods with PM2.5 concentrations >250 µg/m3 being found in Kampala, Uganda and Nnewi, Nigeria. This pilot study highlighted important operational issues related to power supply, memory cards, internet connectivity and device security. Following the pilot phase, we now report on the longitudinal PM2.5 data collected in a network of air-quality sensors using PurpleAir-II-SD sensors for one year in 15 sites with the aim of utilizing the results for advocacy and policy.

2. Materials and Methods

2.1. Study Sites

This study prospectively monitored air pollution continuously for one year—starting from February 2020, at 15 sites in 11 cities in eight countries across sub-Saharan Africa, using low-cost sensors. The selection of sites was performed following the International Multi-disciplinary Programme to Address Lung Health & TB in Africa (IMPALA) conference and the Pan African Thoracic Society Method in Epidemiologic, Clinical and Operational Research (PATS MECOR) course held in Tanzania in 2019. Fifteen sSA-based healthcare professionals who attended the events were trained in air pollution measurement and provided with PurpleAir II SD® sensors (PurpleAir, Draper, UT, USA) and Anker® battery packs [Anker Innovations, Changsha, China] [21] to implement the study in their respective urban locations.

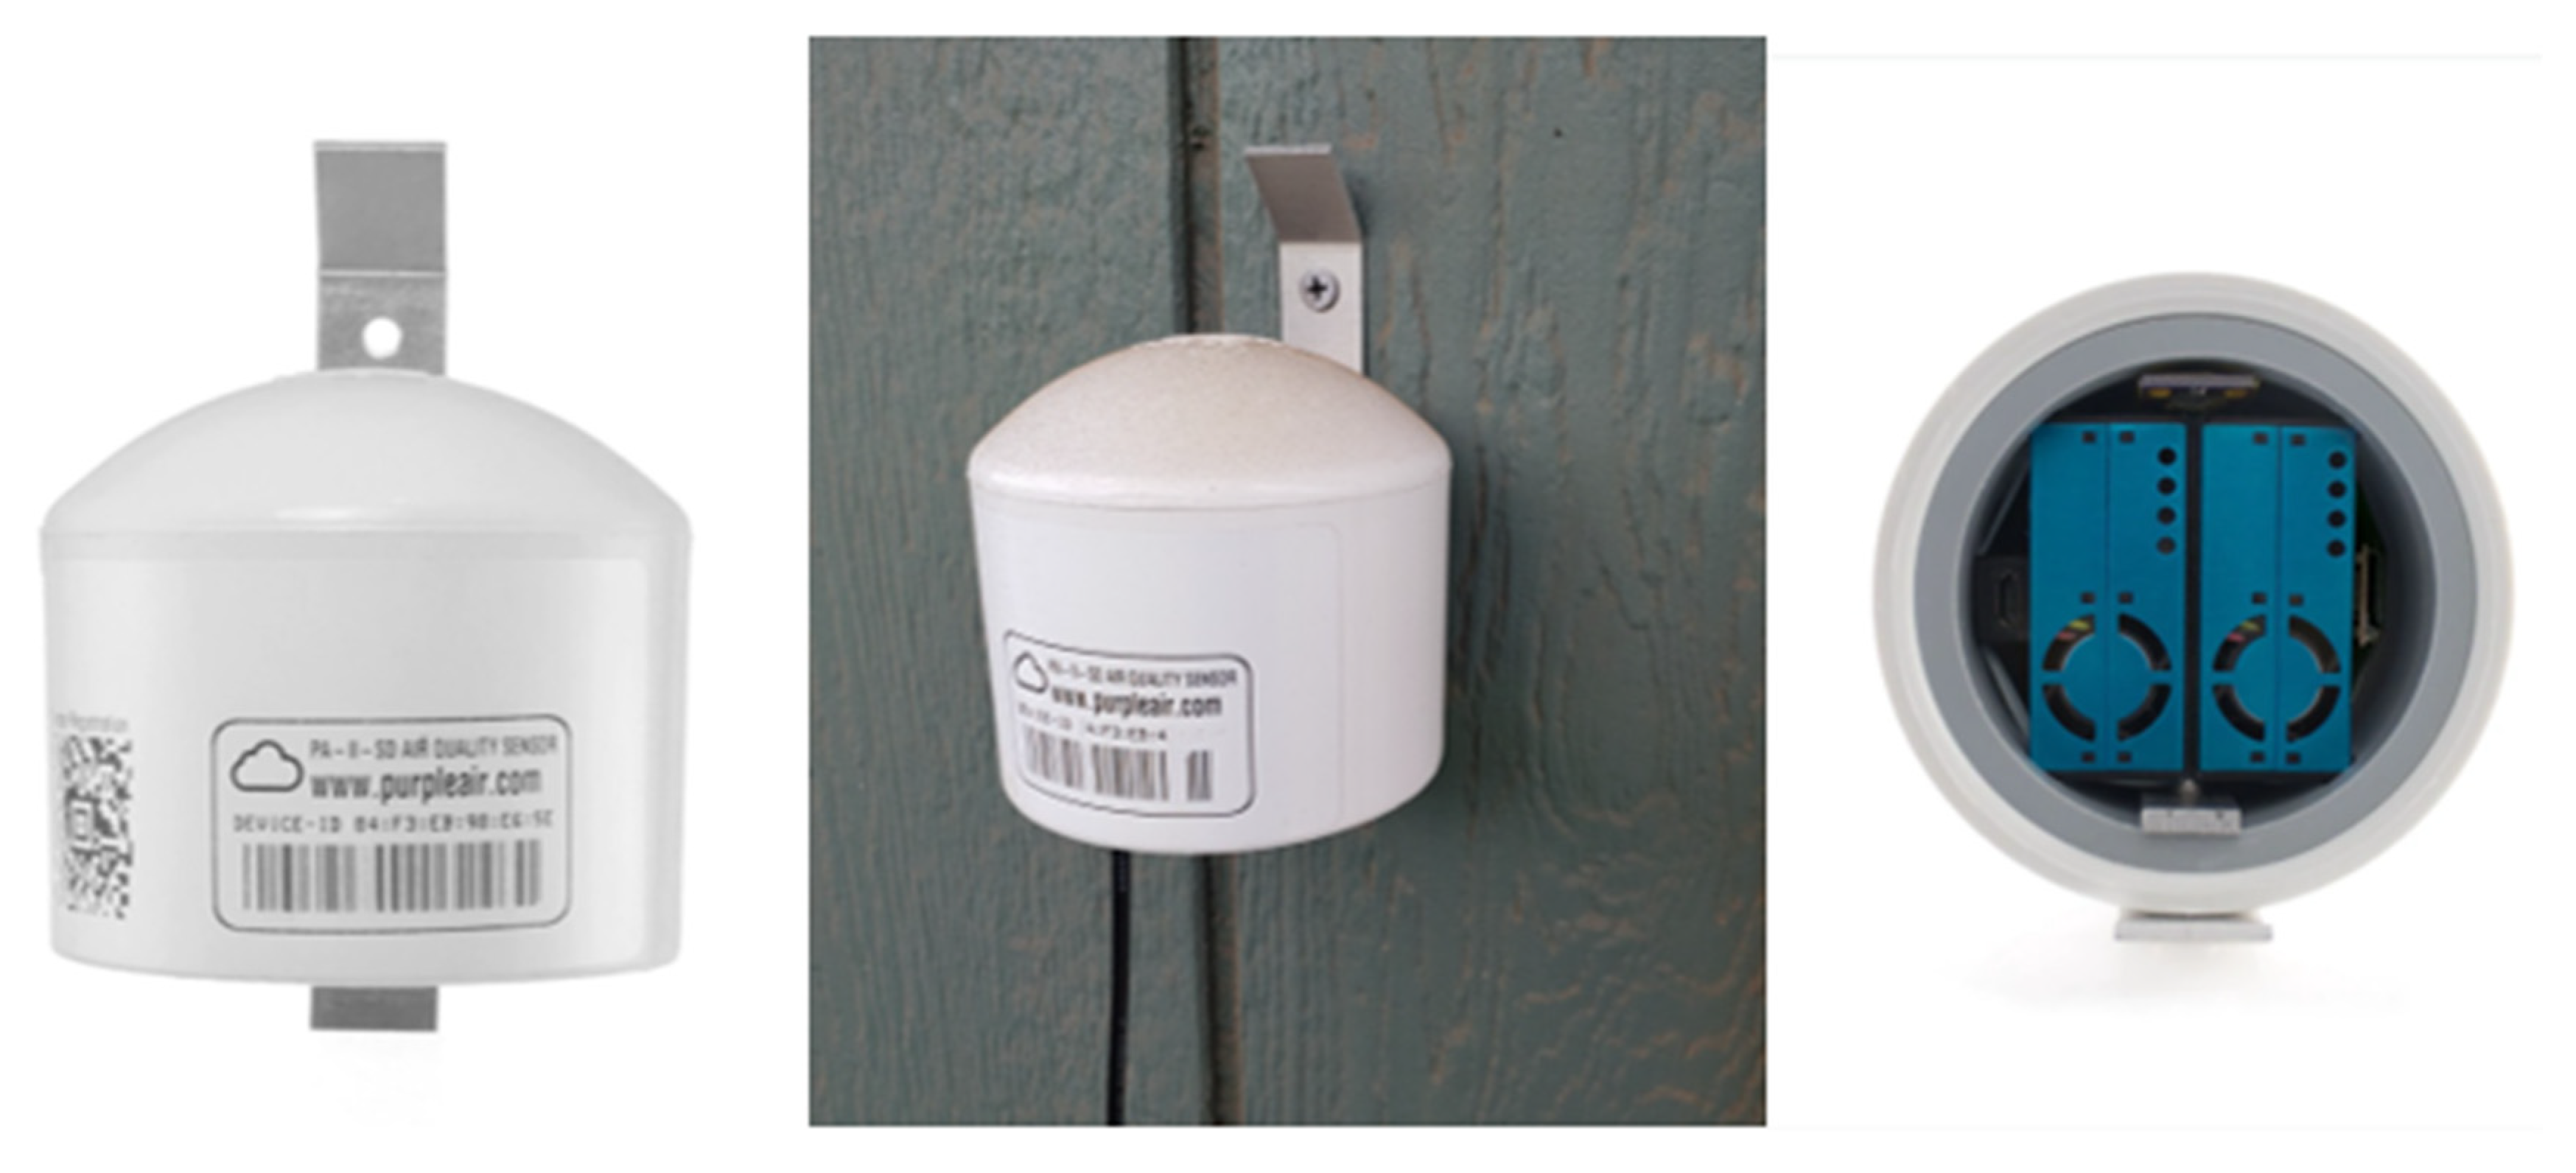
2.2. Continuous Ambient Air-Quality Monitoring (Data Collection)

We ordered and procured pre-calibrated PurpleAir-II-SD sensors. Asides from measuring reliably well at both low and high pollutant exposure, each device has a SD memory card in situ, thus making the data available locally. Setting up air-quality monitoring networks is easily achievable with low-cost sensors such as PurpleAir-II-SD. PurpleAir-II-SD sensors are also very easy to use and maintain without much technical knowhow. One other very important advantage this device has over others is that it is relatively cheap, thus making largescale longitudinal studies at multiple sites very feasible. A unit cost of the device is relatively lower ($259) compared to reference grade optical particle counter instruments such as Alphasense Portable Aerosol Spectrometer PAS-1.108, which costs $15,000 per unit [22].
Investigators were remotely supported to set up the sensors to measure ambient PM2.5 following pre-defined conditions for the siting of the sensors after checking for time drift. Some of these conditions were: placing at 6 feet above the ground, ensuring the device is at least 100 m away from a heavily plied road, being placed away from domestic pollutant sources such as grills, air conditioner vents and incinerators to mention a few [10,22]. The researchers had continuous online support and supervision by the principal investigator (PI), who coordinated the simultaneous collection of data in the 15 study sites. Data acquired within the first month after set-up (July 2019-pilot phase) were analysed and feasibility issues were identified, as reported in a previous publication [10]. The lessons from the pilot phase were incorporated into the main MA3 study that took place between February 2020 and January 2021.
Data from the sensors’ memory cards were downloaded monthly at each site and transferred to the PI for processing, data cleaning and analysis. Only two sites i.e., The Gambia and Nairobi, Kenya had continuous Wi-Fi connection; in all remaining 13 sites, data download was done via SD memory card (Table 1). For each PurpleAir-II-SD device, the internal agreement between the two instrument sensors (A & B) was determined by calculating the period average PM2.5 measured by sensor A and sensor B, and comparing these averages with themselves. This agreement is the degree to which plantower sensors A and B in each device agree with one another regarding the PM measurements. The image of the PurpleAir-II-SD sensor is in Figure 1.

2.3. Data Management

Firstly, downloaded Comma Separated Value (csv) files were checked for errors, sensor-booting files and absent titles for data columns, and these were cleaned. We excluded records with missing values. Afterwards, five-minute averages were computed to normalise the effect of the varying interval of logging of the differing versions of the PurpleAir-II-SD devices used: indeed, firmware version 3 logged every 80 s, whereas version 4 logged every 120 s [10]. Given that there were 365 days of data collection, a maximum of 105,408 five-minute periods was generated. In line with conventional exposure science practice, the daily measurement threshold for this study was set to coverage of 22 h out of 24 h, which translates to approximately 92% coverage [10]. The resulting clean data were then analysed using R studio® software [23]

2.4. Data Analysis

R studio® (23) was used to analyse the data for period PM2.5 patterns, site-to-site average comparison and harmonic regression analyses. The main outcome variable was mean PM2.5 concentration per site. Secondary outcomes included data coverage by location, agreement between the two instrument sensors within each device at each site, seasonal variation, and diurnal variation of PM2.5. The projected seasons with dates were adopted from the Weather Atlas website [24], and information regarding the dates of implementing and lifting COVID lockdowns and the nature of lockdown measures were obtained for each monitoring site.
The PM2.5 data from the PurpleAir-II-SD devices in Kampala (Uganda) and Khartoum (Sudan) were also compared to the freely available MET One Beta Attenuated Monitor (BAM-1020) readings, reported by the USA embassies in these cities through the AirNow® initiative [25,26,27].
In further analyses, a linear regression model of PM2.5 as a function of time was developed as a prelude to a harmonic regression to explain the diurnal (circadian) variations observed in the one-year long PM2.5 data at every site. We chose to apply harmonic regression to the PM2.5 data due to its inherent ability to highlight temporal changes in the occurrence of a phenomenon and also generate useful plots specific to time series data
PM 2.5 =   α   +   β t +   ε ,
where PM2.5 is the concentration expressed in µg/m3, t is time in minutes, α is the intercept, β (regression coefficient) is the slope of the line and ε is the random error term. To stabilise the data, a log transformation of the data was also undertaken, such that the model became:
l o g   PM 2.5 =   α   +   β t +   ε .
Finally, harmonic regression was applied to the time-series data to capture the sinusoidal pattern in the series. For each 24-h PM2.5 cycle, 1440 one-minute periods were analysed. A daily harmonic regression model was then fitted, and the predicted and observed values plotted.
The harmonic regression model was:
log P M 2.5 = β 1 + β 2   t + β 3   C o s   ( ω t ) + β 4   S i n   ( ω t ) + β 5   C o s   ( 2 ω t ) + β 6   S i n ( 2 ω t ) + ε
where ω ( = 2 π 1440 ) representing the daily cycle, PM2.5 is the Particulate Matter 2.5 mm, t is time in minutes, β denotes the regression coefficients and ε is the random error term.
Autocorrelation models generated along the process of computing the harmonic models are shown in Appendix A (Figure A1).

2.5. Ethical Considerations

An ethical waiver was granted by the Liverpool School of Tropical Medicine for the study since it did not involve human participants.

3. Results

3.1. Study Sites

The study was conducted across 15 locations in eight sSA countries based on the location of the collaborating investigators, i.e., in West Africa—Benin Republic, Burkina Faso, Nigeria and The Gambia; Cameroun in Central Africa, Sudan in North-Eastern Africa—and in East Africa—Kenya and Uganda (Figure 2).

3.2. Data Coverage

Regarding data completeness, the five-minute periods coverage ranged from 8% total number of expected 5-min period within the 12-month period (Douala, Cameroon) to 95% (Goshen, Enugu, Nigeria). All sites achieved between 32–89% day coverage except in Awka, Nigeria (where only 4% of days met the 92% coverage threshold) and Douala, Cameroon (where only 7% of days met the threshold). The two sensors (A and B) in each appliance achieved close levels of agreement of at least 92%, except in the Benin and Cameroon sensors, where sensors B developed a fault and stopped recording particulate matter levels during the study (Table 1).

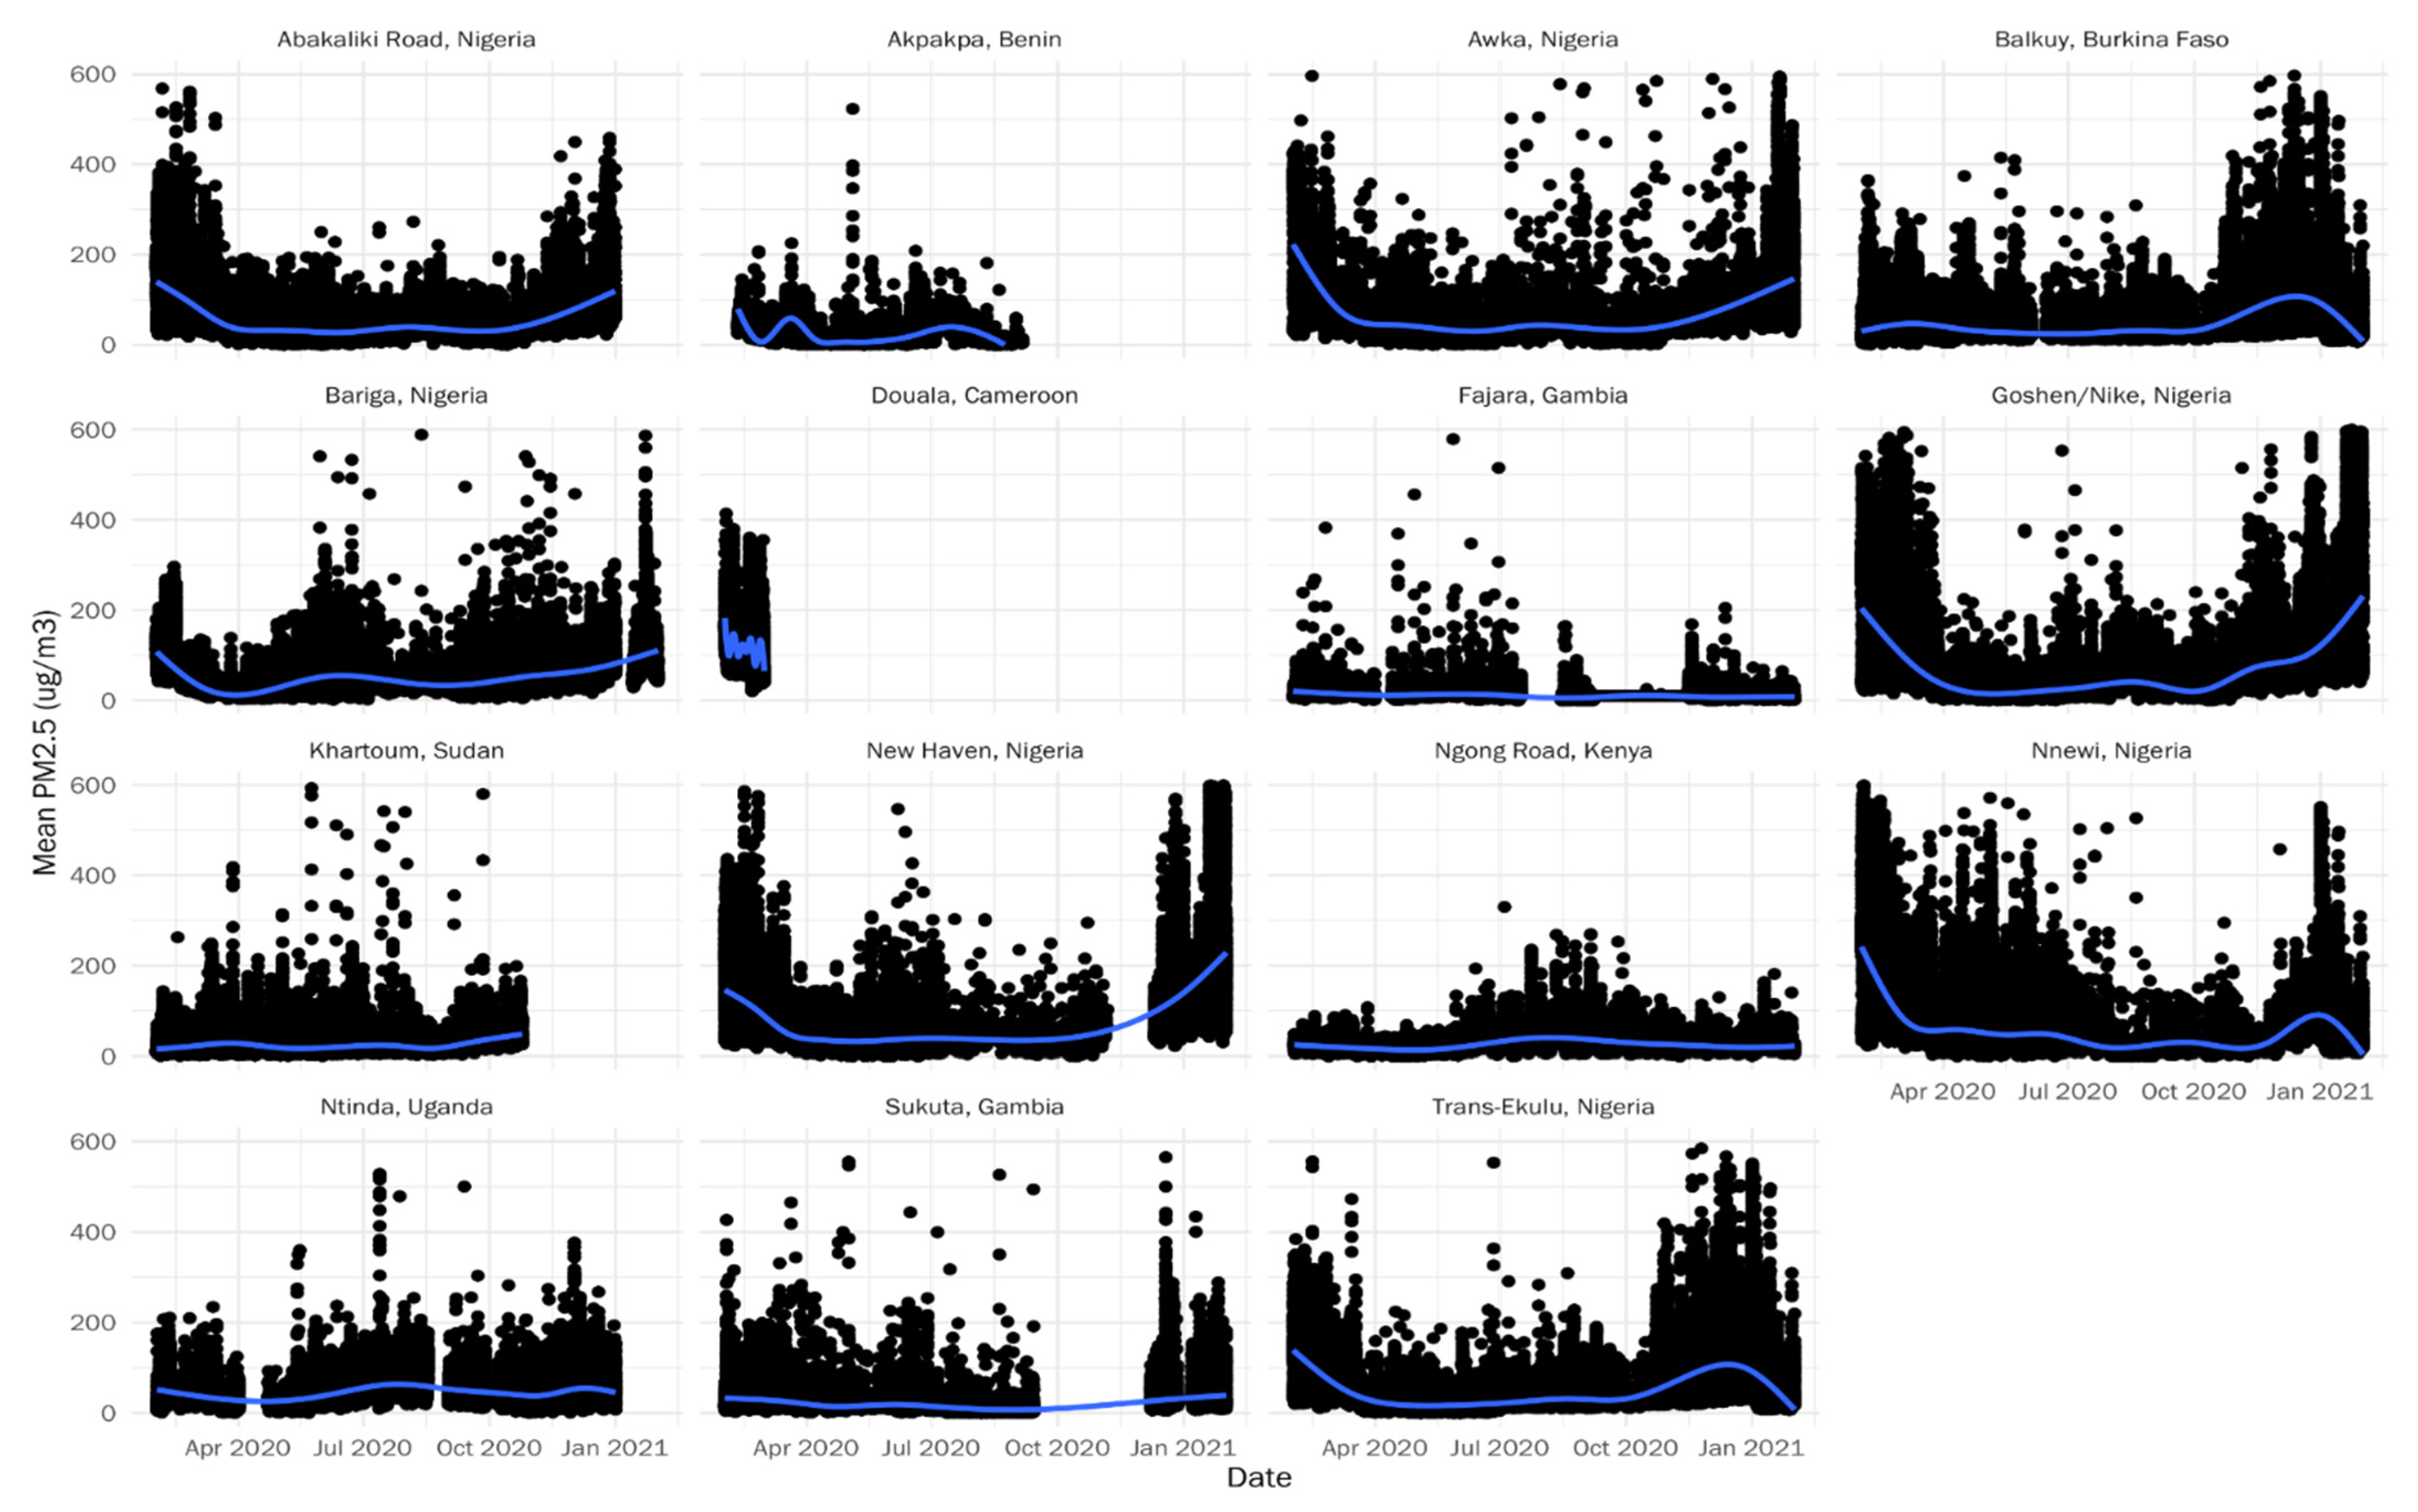
3.3. Annual Mean Concentrations by Site

Mean PM2.5 concentrations by site over the entire study period ranged from 10 µg/m3 (Fajara, Gambia) to 116 µg/m3 (Douala, Cameroon) (Table 2), hence exceeding systematically the WHO annual guidance limit of 5 µg/m3 [12]. Monthly variations in PM2.5 showed three different trends: (i) higher levels in February, March, December 2020, and January 2021 compared to other months in 5 Nigerian sites (Abakaliki Rd., Awka- Goshen, New Haven and Bariga); (ii) elevated PM2.5 levels in February, March 2020 followed by a reduction in December 2020 and January 2021 in four other sites (Balkuy-Burkina Faso, Cotonou-Benin, Nnewi and TransEkulu in Nigeria); (iii) constant PM2.5 levels all year round in the two Gambian sites, as well as in the Khartoum, Sudan and East African sites in Kenya and Uganda (Figure 3).

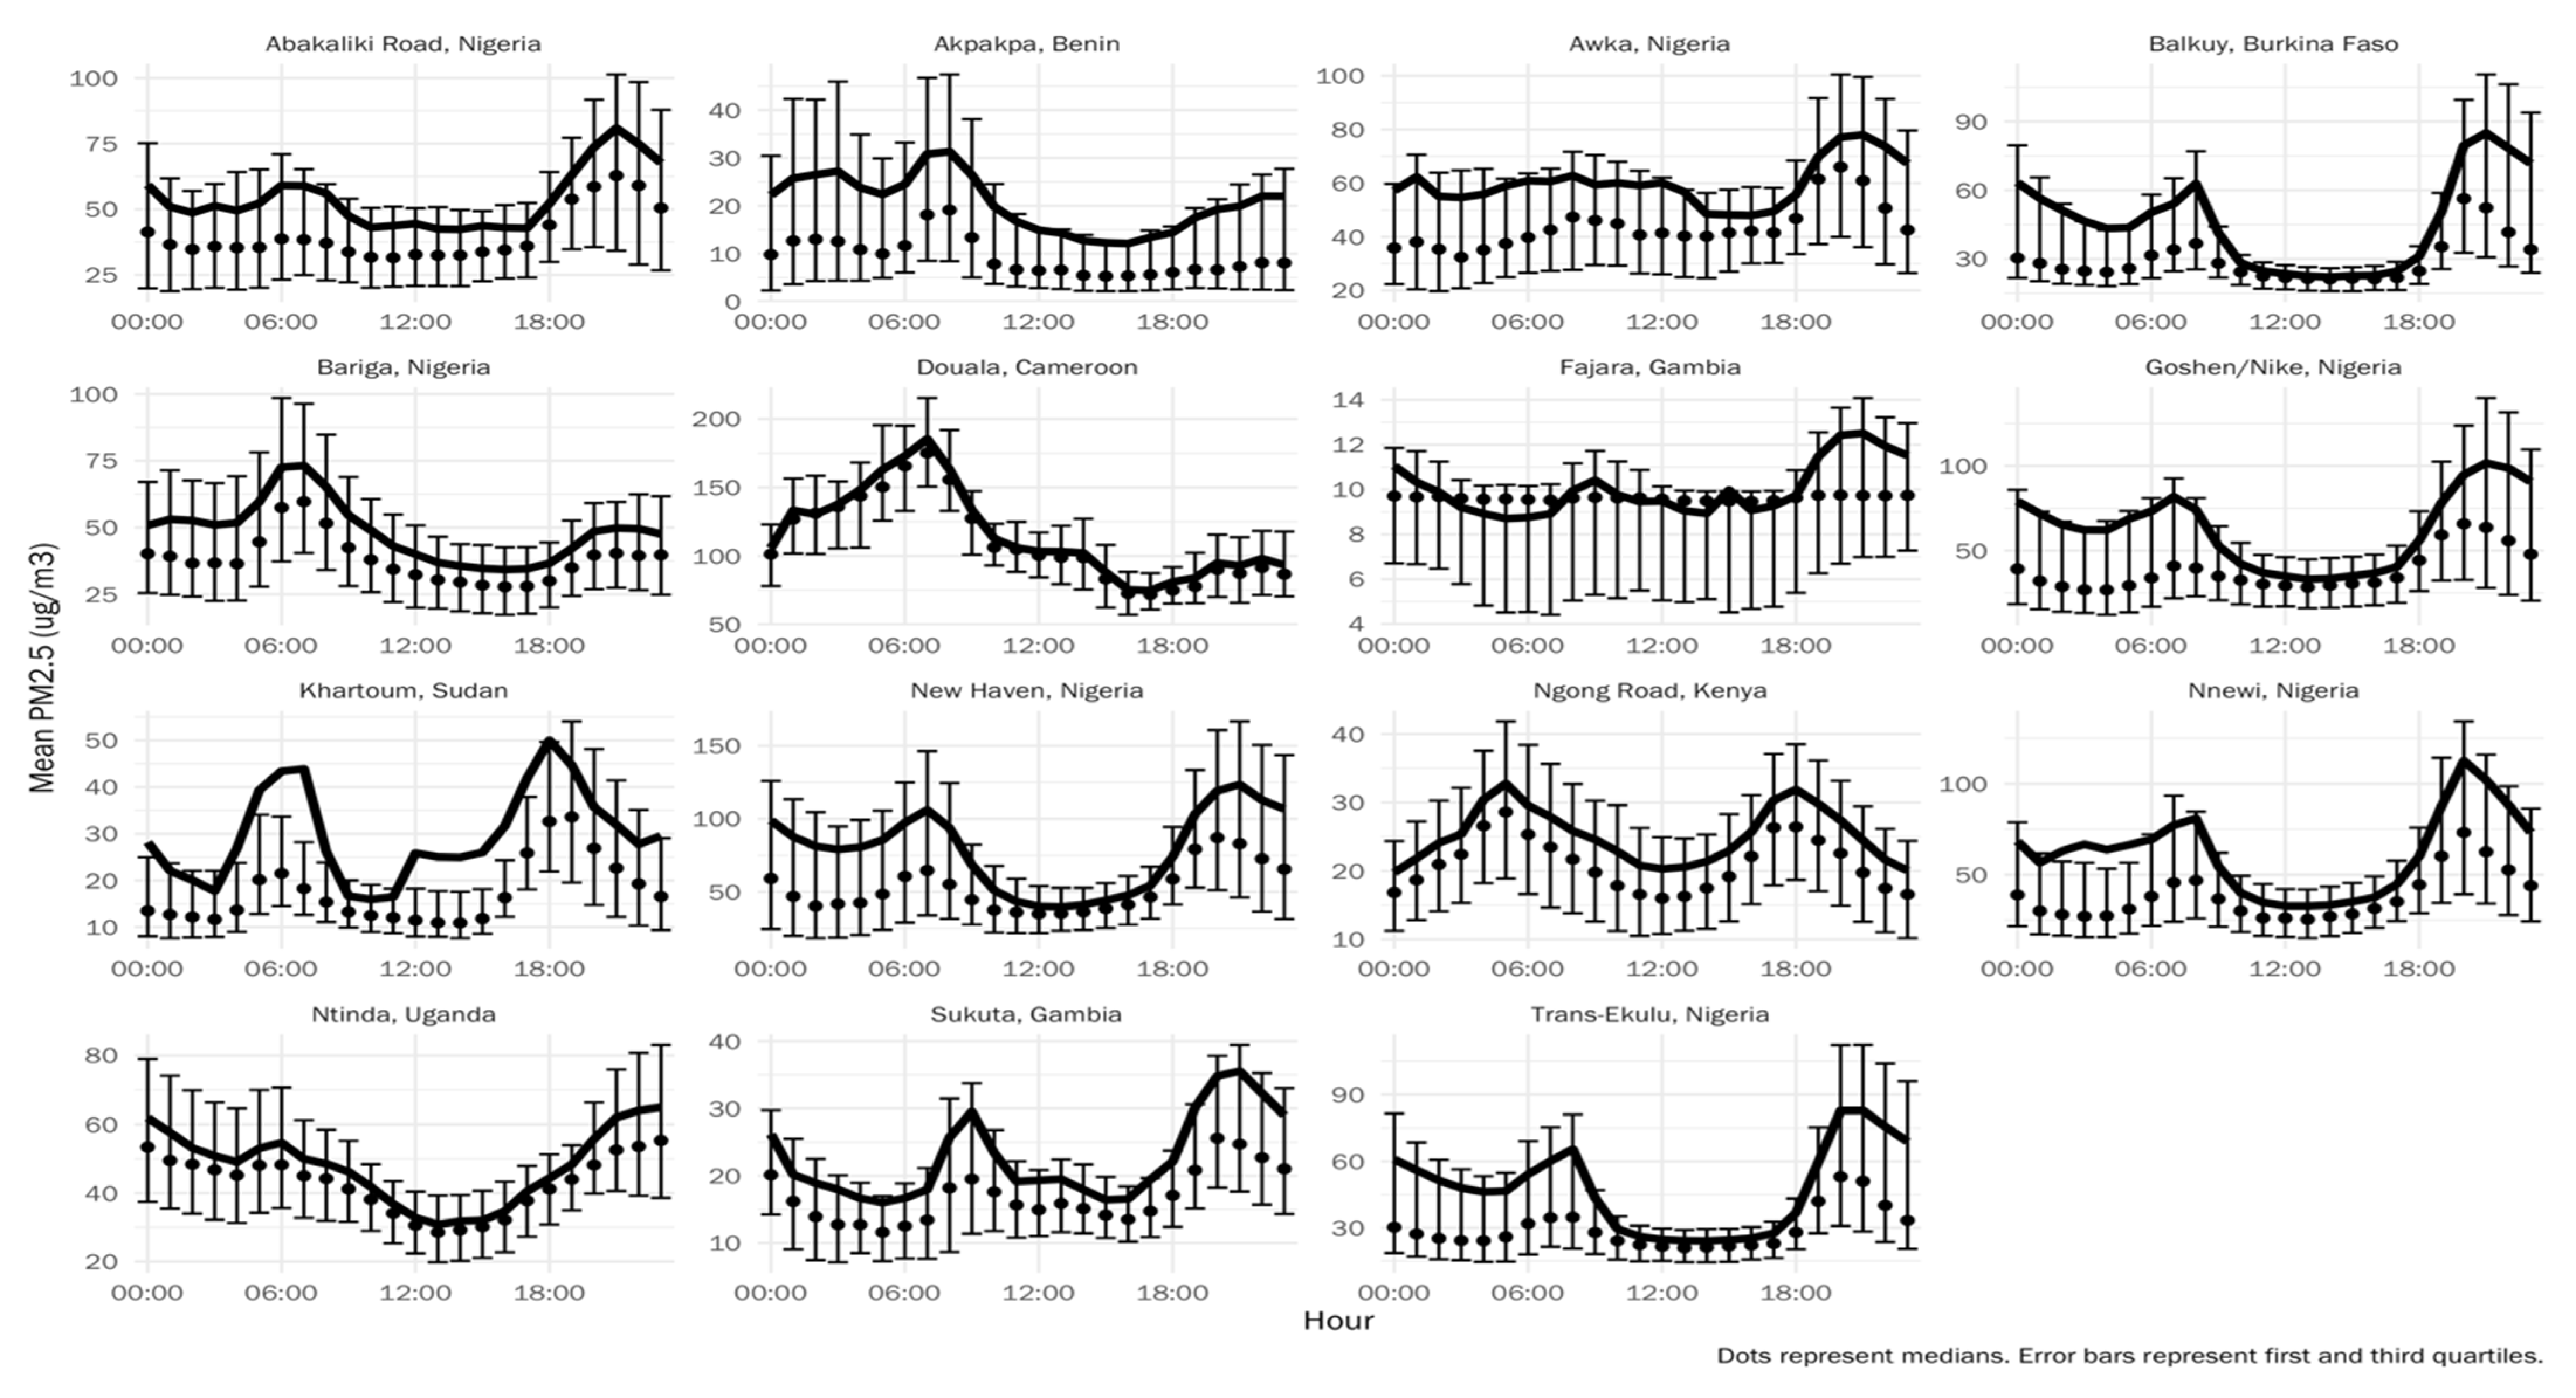
3.4. Seasonal and Diurnal Variation

Seven sites in Nigeria showed marked seasonal variation in PM2.5 levels between dry and wet season (Figure 4). Beninese, Ugandan, Gambian (Sukuta) and Kenyan sites also showed slight seasonal variations. Furthermore, mean circadian variations showed peaks generally observed early in the morning (06:00 to 08:00) and later in the evening (19:00 onwards—Figure 5). Harmonic regression confirmed this trend by showing that at most sites, there were twice-daily PM2.5 cycles in the mornings and the evenings (Figure 6). Autocorrelation models also showed that all dependents between data points were captured (Appendix A).

3.5. Comparison with US Embassy Beta Attenuated Monitor or BAM Monitor

The data from our low-cost sensors in Kampala, Uganda and Khartoum, Sudan compared fairly well to the expensive reference BAMs utilised by the American embassies in Uganda and Sudan respectively (Figure 7). The correlation between the output of our sensor in Kampala and the BAM yielded an R of 0.72 (p < 0.05) (Figure 8). Figure 9 details the Bland Altman’s test of agreement plots for the Kampala, Uganda and Khartoum, Sudan pairs of devices. In the Kampala plot, the measurement points clusters around the zero line (with some outliers) and the constructed limits of agreement are within the acceptable differences. This means there is good level of agreement, and the two methods can be used interchangeably (Figure 9, left). The Khartoum plot showed a much-dispersed measurement points, pointing to a lesser favourable level of agreement (Figure 9, right).

4. Discussion

Our study represents a unique collection of recent longitudinal ambient PM2.5 data collected in 15 sites across eight sSA countries using low-cost sensors. The main result shows that ambient air pollution was high in all study sites, the mean PM2.5 being way above the WHO recommended maximum annual average of 5 µg/m3. Fajara, The Gambia had the lowest-(10 µg/m3) while Douala, Cameroon had the highest period average of 116 µg/m3, although this was based on a limited dataset. Of the sites with complete data, New Haven (Enugu, Nigeria) had the highest fine particulate annual average. There was a tendency towards high ambient PM2.5 levels during the dry season in Nigeria, Uganda, and Cameroon. Importantly, a diurnal variation of the ambient air pollution was observed in all sites with two daily peaks at about 06:00 and 18:00 local time.
The annual averages measured in our study using a network of low-cost sensors (10–116 µg/m3) are consistent with those reported in previous studies in sub-Saharan African cities using limited numbers of high-cost sensors in ground monitoring station networks and BAM-calibrated low-cost sensors in one study [28,29,30,31]. Katoto et al. reported in their systematic review on ambient air pollution and health in Africa that utilising high-cost sensors, the annual PM2.5 concentrations in Cameroon, Kenya, Madagascar, Mauritius, Nigeria, Senegal, South Africa, Uganda, and Tanzania were found to be between 19 µg/m3 and 170 µg/m3 [29]. Furthermore, three East African countries (Uganda, Ethiopia, Kenya) were evaluated and found to have urban ambient air pollution annual averages above the WHO limits, with Kampala having the highest values −55.7 ± 20.3 µg/m3 (100% above the WHO limits) [31]. In another review of eight studies of ambient air pollution in African cities (covering seven countries: Algeria, Egypt, Ethiopia, Mali, Morocco, Nigeria & Zimbabwe), PM2.5 concentrations varied between 40 and 260 µg/m3 [32], compared to an annual average of 13 µg/m3 in urban Europe [33] and 9 µg/m3 in urban United States [34] in 2019.
Seasonal variation was less pronounced in some of our study sites except in Benin, Kenya, Uganda, The Gambia (Sukuta) and seven sites in Nigeria that recorded higher pollutant levels in dry season compared to wet season. It is however noteworthy that in spite of this, African countries and other LMICs record more noticeable seasonal variation than high-income countries [35]. As in our study, higher PM2.5 concentrations have also been reported in the dry season compared to the wet or rainy season by other studies [25,36,37]. This is likely due to a direct effect of rain during the wet season. Another possible explanation is PM2.5 being blown by wind during the dry season, with the dry season also having higher wind speeds and gusty winds compared with the wet season [38].
We observed a twice-daily cycle coinciding with the morning and evening “rush hours” that are associated with increased human activities viz. domestic-, commercial- and transportation related-activity. Diurnal variation in pollutant concentration has also been reported in other studies [35,39,40,41]. The latter utilised Dylos DC 1700, BAMs and TEOMs while, we used PurpleAir-II-SD sensors as mentioned earlier. In Bangladesh, 779 homes had PM2.5 measured, and ambient PM2.5 data from 25 US embassy monitoring stations in 16 LMICs were measured in 2018. These revealed a greater PM concentration at night, and a diurnal temporal pattern and an annual daily mean PM2.5 of 290 µg/m3 [35]. The main environmental reason for this observed diurnal variation is the rising and falling of air temperature, leading to changes of the transboundary layer in the atmosphere [42,43]. This transboundary layer, also known as the planetary boundary layer (PBL), is the lowest layer of the troposphere where conditions are significantly affected by the earth’s surface. PM mixes with the PBL, dispersing in all directions. With prevailing conditions, especially solar radiation and wind, the height of the PBL changes with topography, assuming levels as low as 50–100 m during cool, still periods at night and high levels like 5 km in very hot conditions. These changes occur seasonally and during the day. As PBL height rises, PM is dispersed at a potentially higher volume. When the PBL height falls, PM in the atmosphere is effectively compressed into a smaller volume [35,44].
COVID-19-related lockdown periods at some of the measurement sites disrupted the quality control (QC) checks, affected the frequency of scheduled battery-level checks (leading to frequent power-down periods) and reduced routine device maintenance. Overall, this is reflected in the level of data recovery from some of the sensors. Due to the absence of ambient longitudinal PM2.5 readings in the preceding and/or succeeding years, drawing reliable inferences on the effect of COVID-19 lockdowns on PM levels was not feasible.
We acknowledge the limitations of our study. We desired to perform a field calibration of each device, but due to the reality of the funds available for the study and the logistical difficulties of sending devices to a central point for calibration, we had to settle for initial factory calibration and limited sensor comparison with BAMs at two of the cities (Sudan and Uganda). The latter were located at 8 km and 25 kms respectively to our MA3 PurpleAir-II-SD devices and so the validity of the comparisons is weak. BAM devices were unfortunately not available at the other sites where our PurpleAir sensors were located. We document this as a notable weakness of this study as there is possible device drift from factory calibration over the 12-month period of use [10]. Also, we initially aimed at having a low-cost sensor network in each of the cities, but eventually could only afford one sensor per city except for Enugu city, Nigeria (4 sensors) and Greater Banjul, The Gambia (2 sensors). The results are thus interpreted with these in mind, and the generalization is also restricted to the areas where the sampling was done.
Our study also had several strengths. We utilised ground-level ambient air pollution data in previously unmonitored places in sSA, thus giving a better estimation of PM2.5 concentrations that people are exposed to daily, devoid of cloud cover that mars the utilization of satellite-generated estimates of air pollutant levels. This was done in near real time, with the option of a local data download from SD memory cards, potentially making the data widely available for use by interested stakeholders within the area. We also compared the performance of our MA3 sensors to the US embassy BAMs, which are much more sophisticated than the PurpleAir II SD sensor and can serve as an external quality control tool for the PurpleAir [45]. Extrapolating from a PurpleAir-II-SD sensor co-located with a BAM in Kinshasha Democratic Republic of Congo, with a correlation factor (R2) of 0.88 or 88% [25], our sensor in Kampala, Uganda achieved a R value of 0.72 at 8 km from the BAM. Furthermore, the Bland–Altman test showed a good level of agreement for the Kampala devices and a weak level of agreement between the Khartoum devices. The latter can however be explained by the distance between the devices-25 km between the Khartoum US embassy BAM and the MA3 PurpleAir-II-SD device in Khartoum. In addition, it is worth considering that the cost of a MET One BAM device of approximately $7500 with further frequent servicing and consumable costs could purchase more than the 15 PurpleAir devices that we used for this study given the unit cost of PurpleAir-II-SD of $259 [46].
Based on the inferences from our research so far, a lot remains to be gained if all stakeholders can substantially scale up this network of low cost PM2.5 monitors across sSA for exposure science research and advocacy for change in urban and rural air quality. This invariably provides comprehensive and truly representative air-quality data which serves as a credible tool for engaging policy makers and facilitating advocacy towards the desired enforcement of clean air laws. There is thus need for concerted efforts to ensure cleaner air in our communities. While our study did not investigate the likely sources of urban air pollution, potential sources of such pollution need to be adequately addressed. Domestic fuel used for cooking, lighting and heat generation must be clean, indiscriminate refuse burning must be prohibited, commercial fuel use must be regulated and clean, importation of old cars with inefficient engines banned and factories situated far away from areas of human habitation.

5. Conclusions

Ambient fine particulate matter levels in all the eleven sSA cities sampled were higher than the recommended WHO annual PM2.5 threshold (5 µg/m3), ranging from double to above twenty-fold. This confirms the pollution of ambient air in many urban sSA countries. Furthermore, a twice-daily peaking of particulate matter level was observed, and the morning and evening traffic of urban commute has been suggested to play a role in this. Cities in sSA thus needs to take a serious look into environment friendly means of transportation such as electricity-driven buses/trams/trains, electric vehicles, and solar-driven vehicles. People should also be encouraged to utilise these highlighted public transportation means, rather than to drive. In a situation where the above are unavailable, all cars with old, worn, and ineffective engines should be banned, with newer engines given pass to ply the roads. Seasonal trends affect fine particulate matter, with higher levels found in the dry season versus the rainy season. The protection of individuals’ health, especially during the dry season, can be facilitated by warning systems that can help limit exposure based on continuous measurement of fine particulate matter.

Author Contributions

Conceptualization, B.A., G.O., K.M., C.J. and S.S.; Data curation, B.A., G.O., O.J., R.D., A.R.O., B.D., M.N., C.N., C.A., D.M., H.L., I.O., J.E., N.N., O.O., P.U., R.O., E.A., C.J. and S.S.; Formal analysis, B.A., G.O., O.J., R.D., C.J. and S.S.; Funding acquisition, B.A., K.M. and S.S.; Investigation, B.A., A.R.O., M.N., C.N., C.A., D.M., H.L., I.O., J.E., N.N., O.O., P.U., R.O., E.A., A.E., K.M. and S.S.; Methodology, B.A., G.O., O.J., A.R.O., B.D., C.A., E.A., A.E., K.M., C.J. and S.S.; Project administration, B.A., G.O., B.D., M.N., C.N., C.A., D.M., H.L., I.O., J.E., N.N., O.O., P.U., R.O., E.A., K.M. and S.S.; Resources, A.R.O., M.N., C.N., D.M., J.E., N.N., E.A., K.M. and S.S.; Software, O.J., R.D. and C.J.; Supervision, A.E., K.M., C.J. and S.S.; Visualization, B.A. and R.D.; Writing—original draft, B.A., G.O., R.D., B.D., A.E., K.M. and S.S.; Writing—review & editing, B.A., G.O., O.J., R.D., A.R.O., B.D., M.N., C.N., C.A., D.M., H.L., I.O., J.E., N.N., O.O., P.U., R.O., E.A., A.E., K.M., C.J. and S.S. All authors have read and agreed to the published version of the manuscript.

Funding

This research was funded with PhD bench fees from a Medical Research Council Doctoral Training Program scholarship. This scholarship is complemented by an additional contribution from Aldama Foundation. We also thank the NIHR Global Health Research Unit on Lung Health and TB in Africa at LSTM— “IMPALA” for helping to make this work possible. In relation to IMPALA (project reference 16/136/35) specifically: IMPALA was funded by the National Institute for Health Research (NIHR) using UK aid from the UK Government to support global health research. The views expressed in this publication are those of the author(s) and not necessarily those of the NIHR or the UK Department of Health and Social Care.

Informed Consent Statement

Not applicable. Ethical waiver was given considering the absence of human or animal subjects (LSTM REC Number 19-061).

Data Availability Statement

Data available on request due to their robustness and restrictions on public sharing.

Conflicts of Interest

The authors declare no conflict of interest.

Appendix A

Figure A1. Correlation between the daily mean outputs of the US Embassy BAM and the Purple Air device in Khartoum, Sudan.
Atmosphere 13 01593 g0a1

References

  1. WHO. Air Pollution Causes 7 Million Premature Deaths a Year. Available online: https://www.dw.com/en/who-air-pollution-causes-7-million-premature-deaths-a-year/a-59264198 (accessed on 24 January 2022).
  2. WHO. New WHO Global Air Quality Guidelines Aim to Save Millions of Lives from Air Pollution. 2021. Available online: https://www.who.int/news/item/22-09-2021-new-who-global-air-quality-guidelines-aim-to-save-millions-of-lives-from-air-pollution (accessed on 12 December 2021).
  3. Health Effects Institute. State of Global Air 2019. 2020. Available online: https://www.stateofglobalair.org/report (accessed on 26 August 2021).
  4. WHO. 2018. Available online: https://www.who.int/news-room/detail/02-05-2018-9-out-of-10-people-worldwide-breathe-polluted-air-but-more-countries-are-taking-action (accessed on 28 February 2022).
  5. Awokola, B.I.; Amusa, G.A.; Jewell, C.P.; Okello, G.; Stolbrink, M.; Finney, L.J.; Mohammed, N.; Erhart, A.; Mortimer, K.J. Chronic obstructive pulmonary disease in sub-Saharan Africa. Int. J. Tuberc. Lung Dis. 2022, 26, 232–242. [Google Scholar] [CrossRef] [PubMed]
  6. Schraufnagel, D.E.; Balmes, J.; Cowl, C.T.; De Matteis, S.; Jung, S.H.; Mortimer, K.; Perez-Padilla, R.; Rice, M.B.; Riojas-Rodroguez, H.; Sood, A.; et al. Air Pollution and Non-Communicable Diseases: A review by the Forum of International Respiratory Societies’ Environmental Committee. Part 2: Air pollution and organ systems. Chest 2018, 155, 417–426. [Google Scholar] [CrossRef] [PubMed]
  7. Schraufnagel, D.E.; Balmes, J.; Cowl, C.T.; De Matteis, S.; Jung, S.H.; Mortimer, K.; Perez-Padilla, R.; Rice, M.B.; Riojas-Rodroguez, H.; Sood, A.; et al. Air Pollution and Non-Communicable Diseases: A Review by the Forum of International Respiratory Societies’ Environmental Committee, Part 1: The damaging effects of air pollution. Chest 2018, 155, 409–416. [Google Scholar] [CrossRef] [PubMed]
  8. Amegah, A.K.; Dakun, G.; Mudu, P.; Jaakkola, J.J.K. Particulate matter pollution at traffic hotspots of Accra, Ghana: Levels, experiences of Street traders, and associated respiratory and cardiovascular symptoms. J. Expo. Sci. Environ. Epidemiol. 2022, 32, 333–342. [Google Scholar] [CrossRef]
  9. Amegah, A.K.; Agyei-Mensah, S. Urban air pollution in sub-Saharan Africa: Time for Action. Environ. Pollut. 2017, 220, 738–743. [Google Scholar] [CrossRef]
  10. Awokola, B.I.; Okello, G.; Mortimer, K.J.; Jewell, C.P.; Erhart, A.; Semple, S. Measuring Air Quality for Advocacy in Africa (MA3): Feasibility & Practicality of Longitudinal Ambient PM2.5 measurement using low-cost sensors. Int. J. Environ. Res. Public Health 2020, 17, 7243. [Google Scholar] [CrossRef]
  11. World Health Organization. WHO Global Air Quality Guidelines: Particulate Matter (PM2.5 and PM10), Ozone, Nitrogen Dioxide, Sulfur Dioxide and Carbon Monoxide. October 2021. Available online: https://apps.who.int/iris/handle/10665/345329 (accessed on 2 January 2022).
  12. Balakrishnan, K. Virtual Briefing on WHO’s New Air Quality Guidelines. Inspire. 2021. Available online: https://www.inspirecleanair.org/resources (accessed on 29 December 2021).
  13. Environmental Protection Department. Air Pollution Control Strategies. Available online: https://www.epd.gov.hk/epd/English/environmentinhk/air/prob_solutions/strategies-apc.html (accessed on 14 September 2022).
  14. Ramirez, S.A.; Ramondt, S.; Bogart, K.V.; Zuniga, R.P. Public awareness of air pollution and health threaths: Challenges and opportunities for communication strategies to improve environmental health literacy. J. Health Commun. 2019, 24, 75–83. [Google Scholar] [CrossRef]
  15. Landrigan, P.J.; Fuller, R.; Acosta, N.J.R.; Adeyi, O.; Arnold, R.; Basu, N.N.; Baldé, A.B.; Bertollini, R.; Bose-O’Reilly, S.; Zhong, M.; et al. The Lancet Commission on pollution and health. Lancet 2018, 391, 462–512. [Google Scholar] [CrossRef]
  16. Felix, L. How China Is Winning Its Battle against Air Pollution. Available online: https://www.earth.org/how-china-is-winning-its-battle-against-air-pollution/ (accessed on 14 September 2022).
  17. McCarron, A.; Semple, S.; Braban, C.F.; Swanson, V.; Gillespie, C.; Price, H.D. Public engagement with air quality data: Using health behaviour change theory to support exposure-minimising behaviours. J. Expo. Sci. Environ. Epidemiol. 2022. [CrossRef]
  18. Hoffman, B.; Boogaard, H.; de Nazelle, A.; Andersen, Z.J.; Abramson, M.; Brauer, M.; Brunekreef, B.; Forastiere, F.; Hwang, W.; Kan, H.; et al. WHO Air quality guidelines 2021-Aiming for healthier air for all: A joint statement by medical, public health, scientific societies as patient representative organizations. Int. J. Public Health 2021, 66, 1604465. [Google Scholar] [CrossRef]
  19. Schluger, N.W. Advocacy for Clean Air: Key Strategies and Messages. Inspire. Available online: https://youtu.be/ttq-rXlI_Pw (accessed on 2 May 2022).
  20. United States Environment Protection Agency. Managing Air Quality-Control Strategies to Achieve Air Pollution Reduction. Available online: https://www.epa.gov/air-quality-management-process/managing-air-quality-control-strategies-achieve-air-pollution (accessed on 29 July 2022).
  21. Air Quality Measurement Workshop Presentation at the IMPALA Scientific Meeting, Dar es Salaam, Tanzania. June 2019. Available online: http://africancentreforcleanair.org/aqm-at-the-pan-african-thoracic-society-methods-in-epidemiologic-clinical-and-operation-research-pats-mecor (accessed on 14 September 2022).
  22. Measuring Air Quality for Advocacy in Africa (MA3): Feasibility and Practicality of Longitudinal Ambient PM2.5 Measurement Using Low-Cost Sensors-Supplementary Files. Available online: https://www.zenodo.org/record/3989620#.Ykr8j8nP2Uk (accessed on 22 October 2021).
  23. RStudio Team. RStudio: Integrated Development for R. RStudio, PBC, Boston, MA URL. 2020. Available online: http://www.rstudio.com (accessed on 22 September 2021).
  24. Weather Atlas. Available online: https://www.weather-atlas.com (accessed on 28 January 2022).
  25. McFarlane, C.; Isevulambire, P.K.; Lumbuenamo, R.S.; Ndinga, A.M.E.; Dhammapala, R.; Jin, X.; McNeill, V.F.; Malings, C.; Subramanian, R.; Westervelt, D.M. First Measurements of Ambient PM2.5 in Kinshasa, Democratic Republic of Congo and Brazzaville, Republic of Congo Using Field-calibrated Low-cost Sensors. Aerosol. Air Qual. Res. 2021, 21, 200619. [Google Scholar] [CrossRef]
  26. AirNow Department of State: Kampala, Uganda. Available online: https://www.airnow.gov/international/us-embassies-and-consulates/#Uganda$Kampala (accessed on 29 July 2022).
  27. AirNow Department of State: Khartoum, Sudan. Available online: https://www.airnow.gov/international/us-embassies-and-consulates/#Sudan$Khartoum_Embassy (accessed on 29 July 2022).
  28. OECD. Exposure to PM2.5 in Countries and Regions. Available online: https://stats.oecd.org/Index.aspx?DataSetCode=EXP_PM2_5 (accessed on 16 February 2022).
  29. Katoto, P.D.M.C.; Byamungu, L.; Brand, A.S.; Mokaya, J.; Strijdom, H.; Goswani, N.; De Boever, P.; Nawrot, T.S.; Nemery, B. Ambient air pollution and health in sub-Saharan Africa: Current evidence, perspectives and a call to action. Environ. Res. 2019, 173, 174–188. [Google Scholar] [CrossRef] [PubMed]
  30. Bali, K.; Dey, S.; Ganguly, D. Diurnal Patterns in Ambient PM2.5 over India Using MERRA-2 Reanalysis Data. Atmos. Environ. 2021, 248, 118180. [Google Scholar] [CrossRef]
  31. Singh, A.; Ng’ang’a, D.; Gatari, M.J.; Kidane, A.W.; Alemu, Z.A.; Derrick, N.; Webster, M.J.; Bartington, S.E.; Thomas, G.N.; Avis, W.; et al. Air quality assessment in three East African cities using calibrated low-cost sensors with a focus on road-based hotspots. Environ. Res. Commun. 2021, 3, 075007. [Google Scholar] [CrossRef]
  32. Naidja, L.; Ali-Khodja, H.; Khardi, S. Particulate matter from road traffic in Africa. J. Earth Sci. Geotech. Eng. 2017, 7, 289–304. [Google Scholar]
  33. European Environment Agency. Urban Air Quality. 2017. Available online: https://www.eea.europa.eu/themes/air/urban-air-quality (accessed on 29 July 2022).
  34. IQAir. 2019 World Air Quality Report: Region & City PM2.5 Ranking; IQAir: Goldach, Switzerland, 2020. [Google Scholar]
  35. Dobson, R.; Siddiqi, K.; Ferdous, T.; Huque, R.; Lesosky, M.; Balmes, J.; Semple, S. Diurnal variability of fine-particulate pollution concentration data from 14 low-and-middle-income countries. Int. J. Tuberc. Lung Dis. 2021, 25, 206–214. [Google Scholar] [CrossRef]
  36. Subramanian, R.; Kagabo, A.S.; Baharane, V.; Guhirwa, S.; Sindayigaya, C.; Malings, C.; Williams, N.J.; Kalisa, E.; Li, H.; Adams, P.; et al. Air pollution in Kigali, Rwanda: Spatial and temporal variability, source contributions, and the impact of car-free Sundays. Clean Air J. 2022, 30, 1–15. [Google Scholar] [CrossRef]
  37. Masiol, M.; Agostinelli, C.; Formenton, G.; Tarabotti, E.; Pavoni, B. Thirteen years of air pollution hourly monitoring in a large city: Potential sources, trends, cycles and effects of car-free days. Sci. Total Environ. 2014, 494–495, 84–96. [Google Scholar] [CrossRef]
  38. Elemo, E.O.; Ogobor, E.A.; Alagbe, G.A.; Ayantunji, B.G.; Mangete, O.E.; Tomori, O.S.; Doherty, K.B.; Onuh, B.O. Statistical analysis of the average wind speeds and maximum wind speed (gust winds) at a location in Abuja, Nigeria. Open Access Libr. J. 2021, 8, 1–22. [Google Scholar] [CrossRef]
  39. Pitz, M.; Schmid, O.; Heinrich, J.; Birmili, W.; Maguhn, J.; Zimmermann, R.; Wichmann, H.-E.; Peters, A.; Cyrys, J. Seasonal and Diurnal Variation of PM2.5 Apparent Particle Density in Urban Air in Augsburg, Germany. Environ. Sci. Technol. 2008, 42, 5087–5093. [Google Scholar] [CrossRef]
  40. Kendrick, C.M.; Koonce, P.; George, L.A. Diurnal and seasonal variations of NO, NO2 and PM2.5 mass as a function of traffic volumes alongside an urban arterial. Atmos. Environ. 2015, 122, 133–141. [Google Scholar] [CrossRef] [Green Version]
  41. Zhao, X.; Zhang, X.; Xu, X.; Xu, J.; Meng, W.; Pu, W. Seasonal and diurnal variations of ambient PM2.5 concentration in urban and rural environments in Beijing. Atmos. Environ. 2009, 43, 2893–2900. [Google Scholar] [CrossRef]
  42. Liu, Z.; Hu, B.; Wang, L.; Wu, F.; Gao, W.; Wang, Y. Seasonal and diurnal variation in particulate matter (PM10 and PM2.5) at an urban site of Beijing: Analyses from a 9-year study. Environ. Sci. Pollut. Res. 2014, 22, 627–642. [Google Scholar] [CrossRef] [PubMed]
  43. Nieuwstadt, F.T.M. The atmospheric boundary layer. In Environmental Stratified Flows; Armenio, V., Sarkar, S., Eds.; Springer: Vienna, Austria, 2005; pp. 179–232. [Google Scholar]
  44. Dhammapala, R. Analysis of fine particle pollution data measured at 29 diplomatic posts worldwide. Atmos. Environ. 2019, 213, 367–376. [Google Scholar] [CrossRef]
  45. Hagler, G.; Hanley, T.; Hassett-Sipple, B.; Vanderpool, R.; Smith, M.; Wilbur, J.; Wilbur, T.; Oliver, T.; Shand, D.; Vidacek, V.; et al. Evaluation of two collocated federal equivalent method PM2.5 instruments over a wide range of concentrations in Sarajevo, Bosnia and Herzegovina. Atmos. Pollut. Res. 2022, 13, 101374. [Google Scholar] [CrossRef]
  46. PurpleAir-II-SD Device. Available online: https://www2.purpleair.com/products/purpleair-pa-ii (accessed on 2 August 2022).
Figure 1. Close-up images of the PurpleAir-II-SD device. (Source: https://www2.purpleair.com/products/purpleair-pa-ii-sd, accessed on 2 August 2022. Permission given by Purple Air management).
Atmosphere 13 01593 g001
Figure 2. Countries involved in the one-year prospective ambient fine particulate matter measurement.
Atmosphere 13 01593 g002
Figure 3. Five-minute periods mean concentrations for each site over the measurement period. Smoothed blue line depicts PM2.5 average trend over time.
Atmosphere 13 01593 g003
Figure 4. Seasonal PM2.5 means, medians and quartiles by site.
Atmosphere 13 01593 g004
Figure 5. Diurnal variation at each study site.
Atmosphere 13 01593 g005
Figure 6. Harmonic regression tracings for each study site. Harmonic regression plots showing the temporal changes in PM2.5 pollution spikes and throughs at all sampling sites (ao). X-axis bears the time in minutes while the Y-axis shows the predicted PM2.5 values.
Atmosphere 13 01593 g006aAtmosphere 13 01593 g006b
Figure 7. Comparison of one day plots showing the performance of the PurpleAir II SDs vs. the US Embassy BAMs at Kampala (Uganda) (left) and Khartoum (Sudan) (right). The top figures are the Embassy BAMs, while the bottom ones are the nearby PurpleAir devices.
Atmosphere 13 01593 g007
Figure 8. Correlation between the daily mean outputs of the US Embassy BAM and the Purple Air device in Kampala, Uganda.
Atmosphere 13 01593 g008
Figure 9. Bland–Altman test of agreement plot between US MET One BAM and MA3 PurpleAir Device in Kampala, Uganda (left) and in Khartoum, Sudan (right).
Atmosphere 13 01593 g009
Table 1. Data coverage by location for the Measuring Air Pollution for Advocacy in Africa (MA3).
No.CountryTown & CityWi-Fi ConnectionFive-Minute
Periods Covered (%)
# Days Meeting > 22 h Threshold (%)Median Sensor Agreement % (IQR)
1NigeriaTrans-Ekulu, EnuguNo98,407 (93)315 (86)88% (15–97)
2NigeriaGoshen, EnuguNo100,040 (95)324 (89)98% (90–99)
3NigeriaAwka, AnambraNo63,310 (60)16 (4)99% (97–100)
4NigeriaBariga, Lagos $No83,401 (79)194 (53)99% (93–99)
5SudanKhartoum North, KhartoumNo69,328 (66)222 (61)97% (96–99)
6Burkina FasoBalkuy, OuagadougouNo96,307 (91)317 (87)96% (87–99)
7NigeriaNnewi, AnambraNo77,209 (73)151 (41)98% (97–99)
8The GambiaSukuta, KanifingNo63,002 (60)244 (67)92% (86–95)
9NigeriaAbakaliki Rd, EnuguNo66,468 (63)117 (32)98% (97–99)
10Benin RepublicAkpakpa, CotonouNo43,351 (41)127 (35)0
11NigeriaNew Haven, EnuguNo55,296 (52)136 (37)99% (98–9)
12Cameroon #Douala, DoualaNo8233 (8)27 (7)0
13 *The GambiaFajara, KomboYes81,437 (77)244 (67)93% (85–97)
14UgandaNtinda, KampalaNo61,344 (58)125 (34)92 (84–96)
15 *KenyaNgong Road, NairobiYes95,467 (91)299 (82)98% (97–99)
* Data can be downloaded directly from the Purple Air Website; # Purple Air Device became faulty during the project; $ SD card-related issues; data were from SD card manual download, except in Fajara, The Gambia and Ngong Road, Nairobi, Kenya, where data download was via Wi-Fi.
Table 2. Mean and median PM2.5 for each site between February 2020 and January 2021.
CountryTown & CityMean PM2.5 (±SD) µg/m3Median PM2.5 (IQR) µg/m3
NigeriaTrans-Ekulu, Enugu48(±60)27 (18–51)
NigeriaGoshen, Enugu63 (±82)36 (19–69)
NigeriaAwka, Anambra60 (±60)43 (27–70)
NigeriaBariga, Lagos48 (±39)37 (24–62)
SudanKhartoum North, Khartoum30 (±125)16 (10–28)
Burkina FasoBalkuy, Ouagadougou46 (±54)10 (3–27)
NigeriaNnewi, Anambra62 (±120)36 (21–66)
The GambiaSukuta, Kanifing22 (±26)16 (11–25)
NigeriaAbakaliki Rd, Enugu52 (±49)37 (23–62)
Benin RepublicAkpakpa, Cotonou21 (±27)10 (3–27)
NigeriaNew Haven, Enugu78 (±87)49 (27–91)
CameroonDouala, Douala116 (±52)106 (79–142)
The GambiaFajara, Kombo10 (±10)10 (6–11)
UgandaNtinda, Kampala47 (±29)42 (29–57)
KenyaNgong Road, Nairobi25 (±27)21 (13–31)
Annual mean PM2.5 for all cities was above the WHO Annual recommended Guidance Limit for PM2.5 (5 µg/m3).
Publisher’s Note: MDPI stays neutral with regard to jurisdictional claims in published maps and institutional affiliations.

