Article

Uncovering the Fresh Snowfall Microbiome and Its Chemical Characteristics with Backward Trajectories in Daejeon, the Republic of Korea

1
Group for Biometrology, Korea Research Institute of Standards and Science (KRISS), Daejeon 34113, Korea
2
Convergent Research Center for Emerging Virus Infection, Korea Research Institute of Chemical Technology (KRICT), Daejeon 34114, Korea
3
Department of Bio-Analysis Science, University of Science & Technology (UST), Daejeon 34113, Korea
4
Gas Metrology Group, Korea Research Institute of Standards and Science (KRISS), Daejeon 34113, Korea
5
Department of Biological Science, College of Bioscience and Biotechnology, Chungnam National University, Daejeon 34134, Korea
*
Authors to whom correspondence should be addressed.
These authors contributed equally to this work.
Current affiliation: Department of Earth and Environmental Sciences, Jeonbuk National University, Jeonju 54896, Korea.
§
Current affiliation: Theragen Bio Co., Ltd., Suwon 16229, Gyeonggi-do, Korea.
Atmosphere 2022, 13(10), 1590; https://doi.org/10.3390/atmos13101590
Submission received: 27 July 2022 / Revised: 21 September 2022 / Accepted: 21 September 2022 / Published: 28 September 2022
(This article belongs to the Section Biosphere/Hydrosphere/Land–Atmosphere Interactions)

Abstract

:
Snow covers a large surface area of the Earth and provides a surface for the exchange of biological and chemical components. However, the microbial composition and chemical components of snow are poorly understood. We assessed the bacterial and fungal diversity and chemical characteristics in freshly deposited snowfall samples collected from a sub-urban site in Daejeon, the Republic of Korea. We analyzed the snow samples using DNA amplification followed by Illumina MiSeq Sequencing for the microbiome, ion chromatography for the cations (Na+, Ca2+, Mg2+, and NH4+) and anions (SO42−, NO3−, and Cl), and a water-soluble organic carbon (WSOC) and water-soluble nitrogen (WSTN) analyzer for WSOC and WSTN. NO3−, Actinobacteria (bacteria), and Ascomycota (fungi) were the most abundant components in the fresh snowfall samples. The air mass backward trajectories arrived mostly at this site from the northwest direction during this study period, which included the regions belonging to Russia, China, Mongolia, the Gobi Desert, the Yellow Sea, and South Korea. Principal component analysis suggested that the snow components were associated with sources belonging to secondary chemical compounds, dust, and sea salt during the study period.

1. Introduction

Snow directly affects climate change [1,2]. It covers almost 35% of the Earth’s surface during different periods throughout the year [3]. Snow may contain diverse microbial communities, antibiotic resistance genes (ARGs), mobile gene elements (MGEs) [4,5,6], and various chemical components [7]. Snowfall is pervasive throughout all the regions of the globe, from temperate to polar regions [8], which may provide a relatively large surface area for the exchange of biological and chemical components [5]. In recent times, biological alterations in the snow have been reported [9,10,11]. Additionally, volatile organic compounds in the Artic snow, photolysis, and adsorption have been studied [12]. However, understanding the role of the chemical components and biological species in the formation of aerosol and ice nucleation is still less understood. The initial site for atmospheric water to condense into raindrops and/or snow flacks is an airborne particulate matter [13], for which severe environmental conditions, including low temperatures, decreased humidity, less availability of water, and increased radiation, have a role in the formation of the snow ecosystem [14]. Climate change is also connected with the alterations in snow and ice patterns occurring in different regions [15].
Dust, wastewater treatment facilities, and waste incineration may all introduce microorganisms and biological pollutants into the atmosphere, which then accumulate on biological aerosols [5,16,17]. These aerosols are carried back to the surface of the Earth by snow and rain. Snowfall appears to be more effective than rainfall in this scenario; as a result, it precipitates materials in ice nuclei over a vast region. Rain, on the other hand, precipitates particles beneath the clouds, which is a much more limited occurrence [18]. Different atmospheric transport events probably initiate the long-distance transfer of biological components, such as dust storms, having a vital role in the long-range transport of microbial and chemical communities [19]. At −38°, clean water droplets uniformly freeze in the atmosphere. Different objects such as dust from mineral sources, smoke, and biological entities presumably act as ice nuclei, which increase the freezing [20,21]. Moreover, the chemical properties of frost flowers have gained attention because of the role that the sea salt mobilization of aerosols [22] and bromine concentrations play in ozone depletion events [23].
Although snowfall is a major meteorological episode, its biological and chemical compositions have not been well-studied. Such a study can yield valuable information on aerosol–biome–snow interactions.
To understand the microbial composition and diversity and chemical composition, fresh snowfall samples were collected in Daejeon, the Republic of Korea, in the winter of 2021. The microbial community structure, origin, and chemical characteristics were assessed. Additionally, the potential relationship with the chemical components of atmospheric aerosols was also explored.

2. Materials and Methods

2.1. Sample Collection and Processing

Five fresh snowfall samples were collected from the rooftop of the chemistry building at the Korea Research Institute of Standards and Science (KRISS), Daejeon (36°23′19″ N, 127°22′21″ E) (Table 1). The snowfall samples were collected on a clean aluminum-foil-covered tray and transported to the lab in pre-sterilized conical tubes in a sealed bag placed in a wet icebox the same day. The snowfall samples were used for the microbial community and chemical analyses. To this end, the samples were thawed in the conical tubes at room temperature for around 15 min before DNA extraction. The metagenomic DNA of each sample was obtained from 1 mL of the thawed samples using a PowerMax Soil DNA Extraction Kit (MoBio, Carlsbad, CA, USA), according to the manufacturer’s instructions.

2.2. The 16S rRNA Gene and ITS Gene Amplification and Sequencing

For compatibility with the Illumina index and sequencing adapters, the DNA was PCR-amplified with fusion primers targeting the V3 to V4 regions of the 16S rRNA gene and ITS2 region. For the bacterial and fungal amplification, the Illumina overhang adapter primers were used (Table 2).
PCRs were performed in a 25 µL total PCR reaction volume with a Q5® High-Fidelity DNA Polymerase kit (New England Biolabs, Ipswich, MA, USA). The reaction volume contained 1X Q5Reaction Buffer, 0.5 µM primers, 200 µM dNTPs, 1X Q5 High GC Enhancer, 0.2 U/µL Q5 HF DNA Polymerase, and 10 ng of the template DNA. Amplification was performed under the following thermal cycling protocol: first, denaturation at 98 °C (30 s), followed by 30 cycles of denaturation at 98 °C (10 s), annealing at 55 °C (20 s), extension at 72 °C (30 s), with a final extension at 72 °C (4 min). A PCR product with a concentration ≥ 20 ng/uL was used for further processing. CleanPCR (CleanNA) was used to eliminate the short fragments (non-target products) from a pool of purified products of equal quantities. A DNA 7500 chip was used to examine the quality and size of the products using a bioanalyzer (Agilent, Palo Alto, CA, USA). The amplicons were used to prepare a sequencing library, and paired-end sequencing runs were carried out with an Illumina MiSeq Sequencing system at Chunlab, Inc. (Seoul, Korea), following the manufacturer’s instructions.

2.3. Sequence Data Analysis

The sequence reads of the 16S rRNA genes and ITS2 regions were normalized to 10,000 and 20,000 reads, respectively. The sequence reads of each sample type (bacteria/fungi) were normalized based on the minimum sequence read numbers of each sample type (DJS-2 and DJS-2-E) (Table S1 of Supplementary Materials). The normalized reads were evaluated using the EzBioCloud bioinformatics library tool for microbiome research, utilizing microbiome taxonomic profiling based on 16S rRNA (https://www.ezbiocloud.net (accessed on 15 August 2022)). Raw read processing began with a quality check and the use of Trimmomatic ver. 0.32 to filter out low-quality (Q25) reads [24]. After the QC pass, the fastq merge pairs tool of VSEARCH version 2.13.4 was used to combine the paired-end sequence data [25]. The alignment algorithm of Myers and Miller [26] was then used to trim the primers at a similarity cut-off of 0.8. The non-specific amplicons that did not encode 16S rRNA were detected using “nhmmer” in the HMMER software package ver. 3.2.1 with hmm profiles [27]. By using the “derep fulllength” command of VSEARCH, the unique reads were extracted, and the redundant reads were clustered with the unique reads [25]. The EzBioCloud 16S rRNA and ITS database [28] was used for a taxonomic assignment using the “usearch_global” command of VSEARCH 2 [25], followed by a more precise pairwise alignment [26]. Chimeric reads were filtered on the reads with 97% similarity, using the UCHIME algorithm for reference-based chimeric detection [29]. After chimeric filtering, the reads in the EzBioCloud database that are not species-level identifiable (with 97% similarity) were combined, and “cluster fast command2” was used to perform de novo clustering to produce more OTUs. The OTUs with a single read were subsequently excluded from further analysis (singletons). ChunLab’s bioinformatics cloud platform, EzBioCloud 16S-based MTP, was used for all of the aforementioned analyses. EzBioCloud DB has high DB coverage at the species/phylotype and subspecies level; the EzBioCloud database has 66,303 rRNA gene sequences.

2.4. Water-Soluble Organic Carbon (WSOC) and Inorganic Ion Analyses

The melting of the snow samples was achieved at room temperature for the analysis of chemical components. A Millipore Millex-GV 0.45 µm syringe filter was used to filter the melted solution. After the filtration, the solution was kept at 4 °C until the chemical analysis. The details of the cation and anion analysis are given elsewhere [30]. Briefly, an ion chromatograph equipped with Dionex ICS-5000 built by Thermo Fisher Scientific, USA, was used to quantify water-soluble cations such as Na+, Ca2+, Mg2+, and NH4+. The water-soluble cations were separated with a flow rate of 1.0 mL min−1, using an IonPac CS-12A column from Thermo Fisher Scientific, USA, with 20 mM methanesulfonic acid as an eluent. Anions (SO42−, NO3, and Cl) were separated with an IonPac AS-15 column from Thermo Fisher Scientific, USA, with 40 mM KOH as the eluent at a flow rate of 1.2 mL min−1. The detection limits for NO3, SO42−, and NH4+ were 0.01, 0.01, and 0.03 µg m−3, respectively [30].
The details of the total organic carbon (TOC) analysis are given elsewhere [31]. Briefly, a part of the snowfall-melted water sample was filtered with a syringe filter (Pall Corp., 0.4 μm PTFE membrane) for the total organic carbon (TOC) analysis using a TOC analyzer (TOC-LCSH/CSN, Shimadzu, Japan). The water extract was acidified using hydrochloric acid with pure N2 gas purging to remove any carbonate carbon. Afterward, the organic components in the water extract were combusted at 680 °C with a platinum catalyst to form CO2, which was then detected and quantified with a non-dispersive infrared detector. The instrument was calibrated using a potassium hydrogen phthalate (C6H4(COOK)COOH) standard solution. The potassium hydrogen phthalate (C6H4(COOK)COOH) solution was used to calibrate the TOC analyzer.

2.5. Air Mass Backward Trajectory Analysis

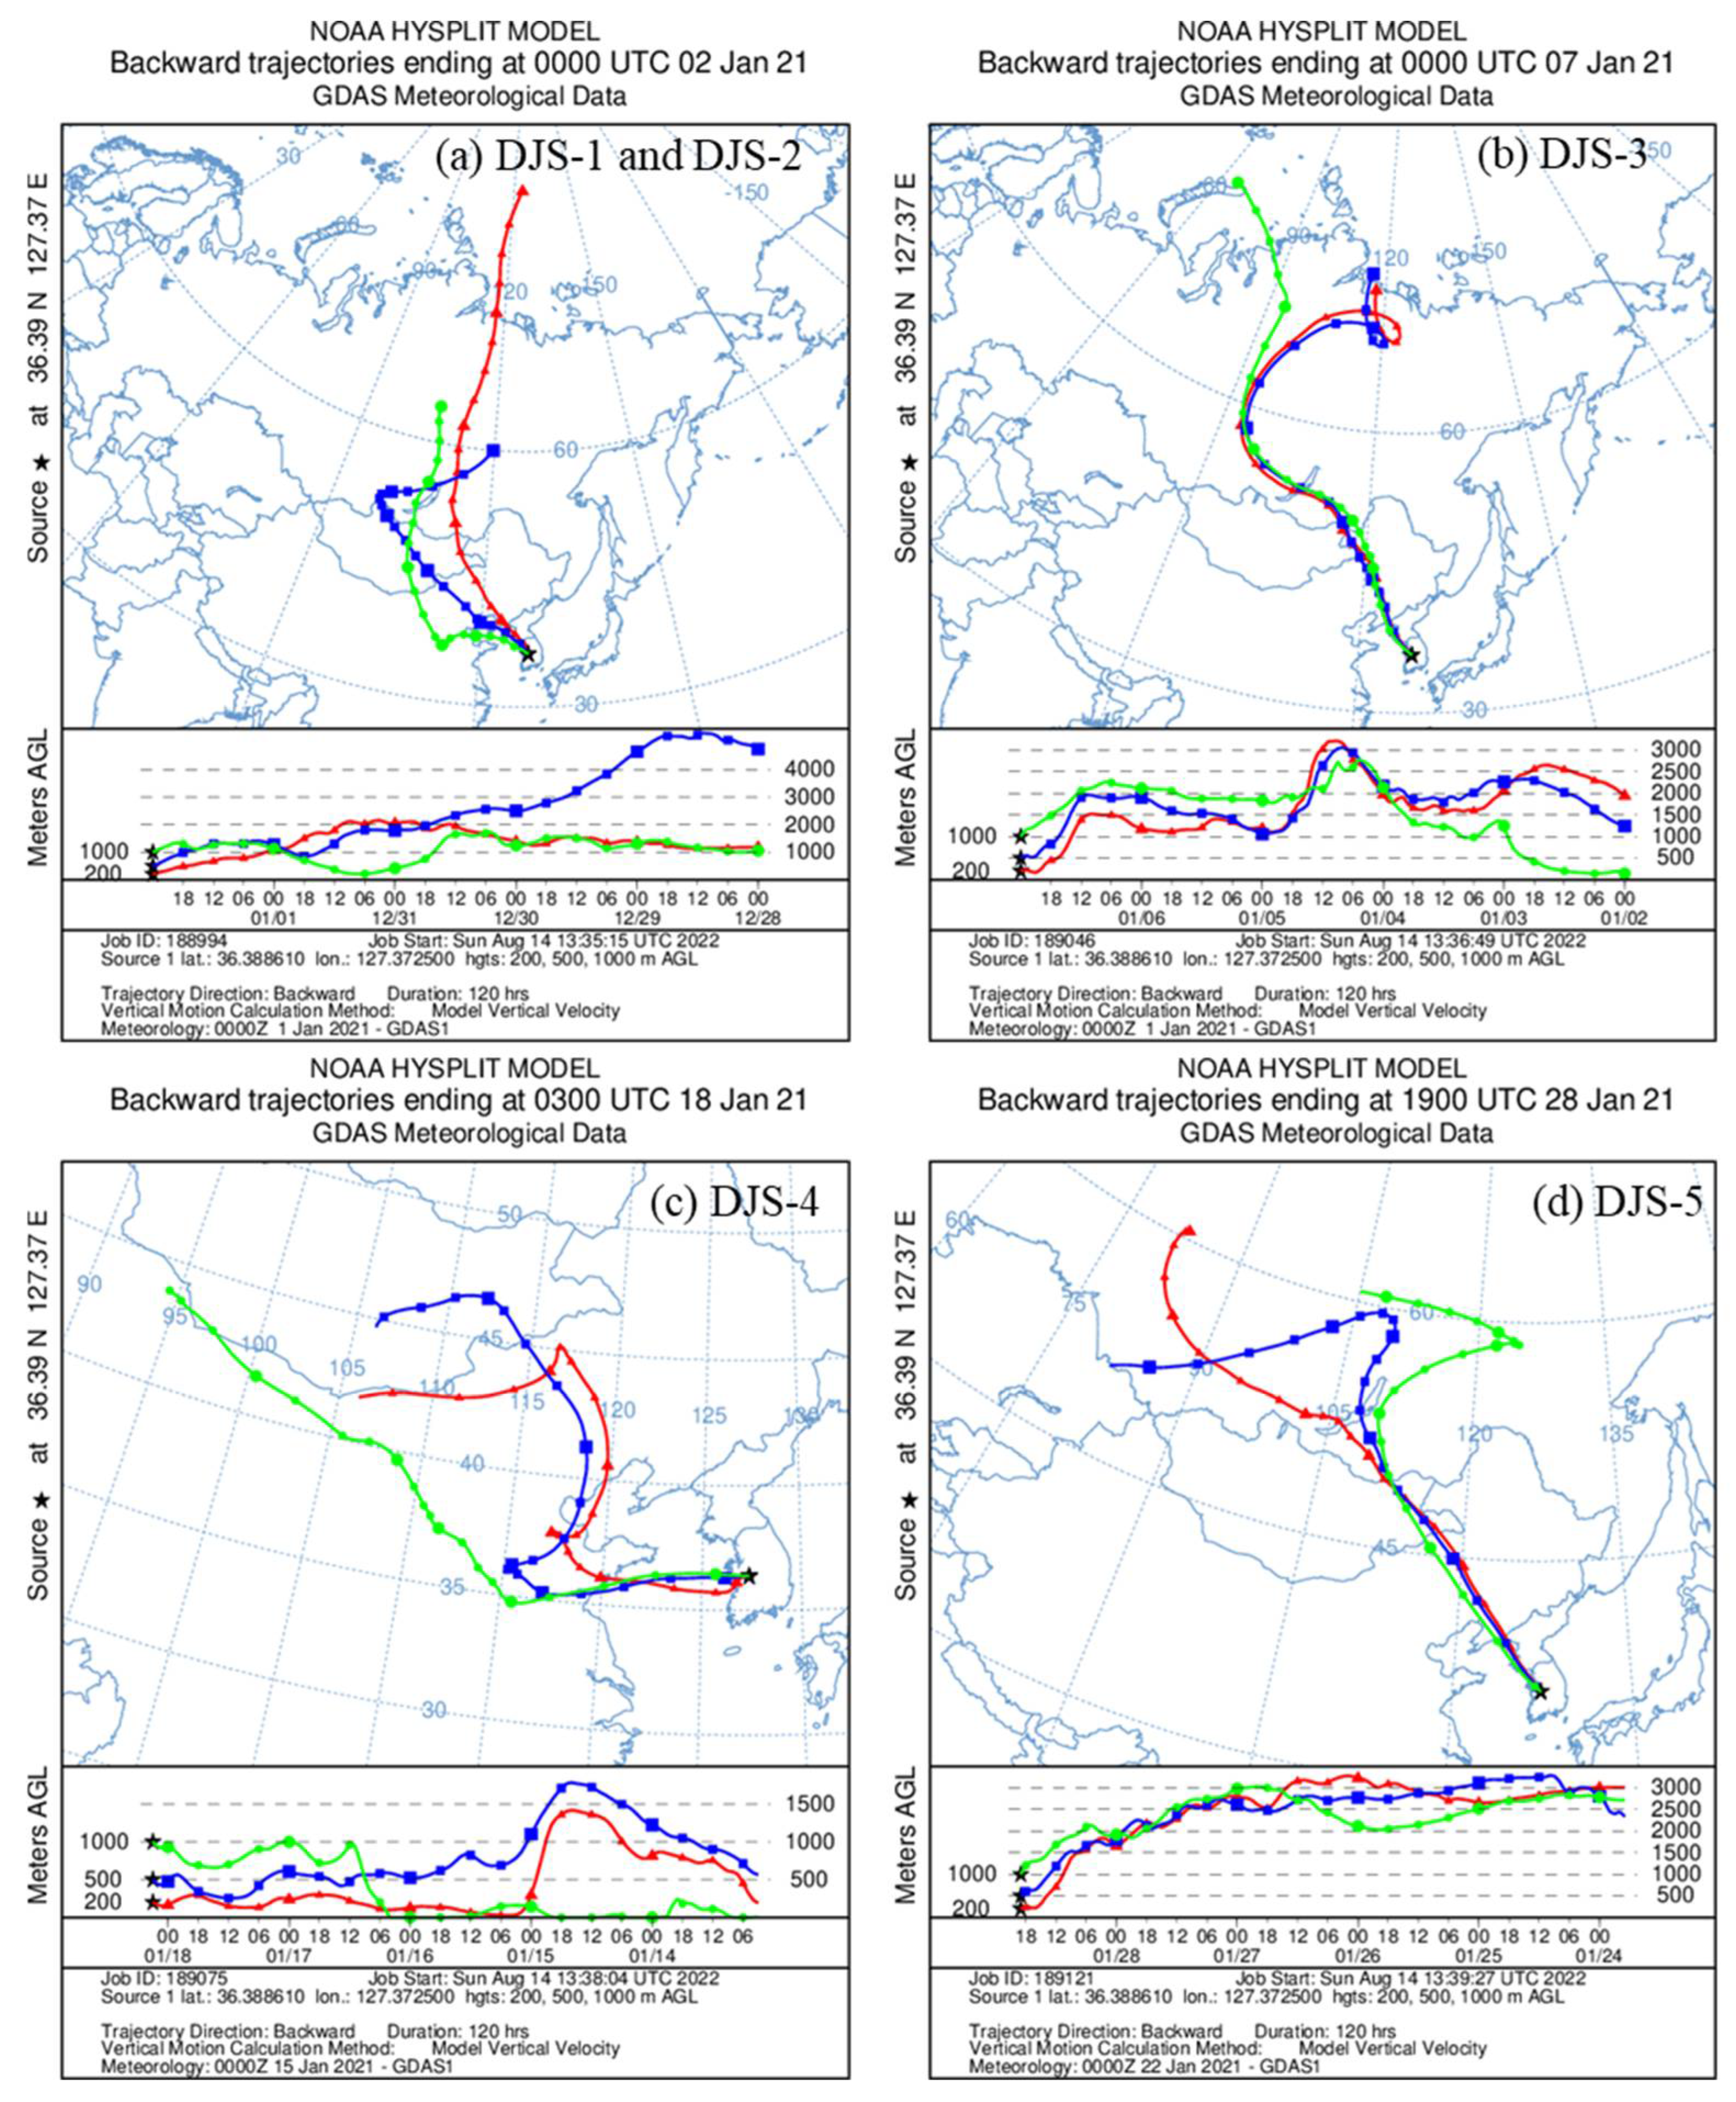
A total of 120 h air mass backward trajectories were estimated and plotted using the Hybrid Single Particle Lagrangian Integrated Trajectory model (HYSPLIT, introduced by The National Oceanic and Atmospheric Administration (NOAA); http://www.arl.noaa.gov/HYSPLIT.php (accessed on 15 August 2022) to monitor the transport paths of atmospheric circulation. The air mass trajectories (backward) with altitudes (meter) of 3000, 1000, and 500 above ground level (AGL) were plotted for this site (36°23′19″ N, 127°22′21″ E).

3. Results

3.1. Bacterial Compositions and Diversity

The dominant bacteria in the fresh snowfall samples in Daejeon, South Korea, were Actinobacteria, Firmicutes, Proteobacteria, Bacteroidetes, Cyanobacteria, and a low abundance of Acidobacteria, as shown in Figure 1. These phyla mainly contribute to the bacterial structure found in the snow and temperate wetlands in different regions [4,8,32]. The distribution of these bacteria showed a difference in the relative abundance between the early season snowfall and the late season samples. The principal coordinate analysis (PCoA) plot in Figure S1 of Supplementary Materials shows a close cluster of the same-day-sampled DJS-1 and DJS-2, while other samples were dispersed separately. The samples DJS-1 and DJS-2 were dominated by Firmicutes, with more than half of the total relative abundance (63% and 55.68%, respectively), followed by Actinobacteria with abundance values of 31% and 30%, respectively. However, Actinobacteria emerged as the largest bacterial phylum in samples DJS-3, DJS-4, and DJS-5 with relative abundance values of 38.5%, 39.7%, and 53.5%, respectively. Proteobacteria was the second most abundant phylum in DJS-4 and DJS-5 (Table S2). The highest abundance of Cyanobacteria was in DJS-5 with a relative abundance of 10.36% (Table S2), which was collected in high wind and a dusty environment. The higher abundance of Cyanobacteria in a wind-pack snow environment was also reported in a previous study in Alaska, USA [5].
At the genus level, the sequences represent 133 different genera in the fresh snowfall samples, which are presented in Table S2. In the Actinobacteria sequences, relative abundance values of 18.8% and 8.9% (of the total genera abundance) were observed for Bifidobacterium and Corynebacterium, respectively. Moreover, Cutibacterium at 4.1% and Lawsonella at 2.5% were also observed in the Actinobacteria phylum, as shown in Figure 1. Proteobacteria were dominated by Sphingomonas at 3.6%, Brevundimonas at 1.7%, and Escherichia at 1.3%, which are shown in Figure 1. Meanwhile, Lactobacillus was the most abundant in the Firmicutes phylum, with a relative abundance of 13.9%, followed by Streptococcus at 9.3% and Staphylococcus at 5.6%. Chryseobacterium in the Bacteroidetes phylum was the most dominant, with a 9.18% relative abundance. Chryseobacterium and Corynebacterium were prominent in the sample DJS-4, while Bifidobacterium, Lactobacillus, and Streptococcus were mainly present in the early snowfall samples DJS-1 and DJS-2, as shown in Figure S2. The relative abundance of all the genera reported in this study is presented in Table S2. Similar genera were also reported in the snow of the Tateyama Mountains in Japan [9].
The maximum number of OTUs was present in the sample DJS-2 and the lowest in DJS-4 (Table S3). The alpha diversity indices showed the highest diversity in DJS-5, while the lowest was observed in DJS-1, shown in Figure S3, while the species richness estimators (ACE, CHA1, and Jackknife) were the lowest in DJS-4 (Table S1). In the case of DJS-5, although the species richness estimators were lower than those of DJS-2 and DJS-3, the values related to species evenness (the Shannon and Simpson diversity indices) were higher in DJS-5.
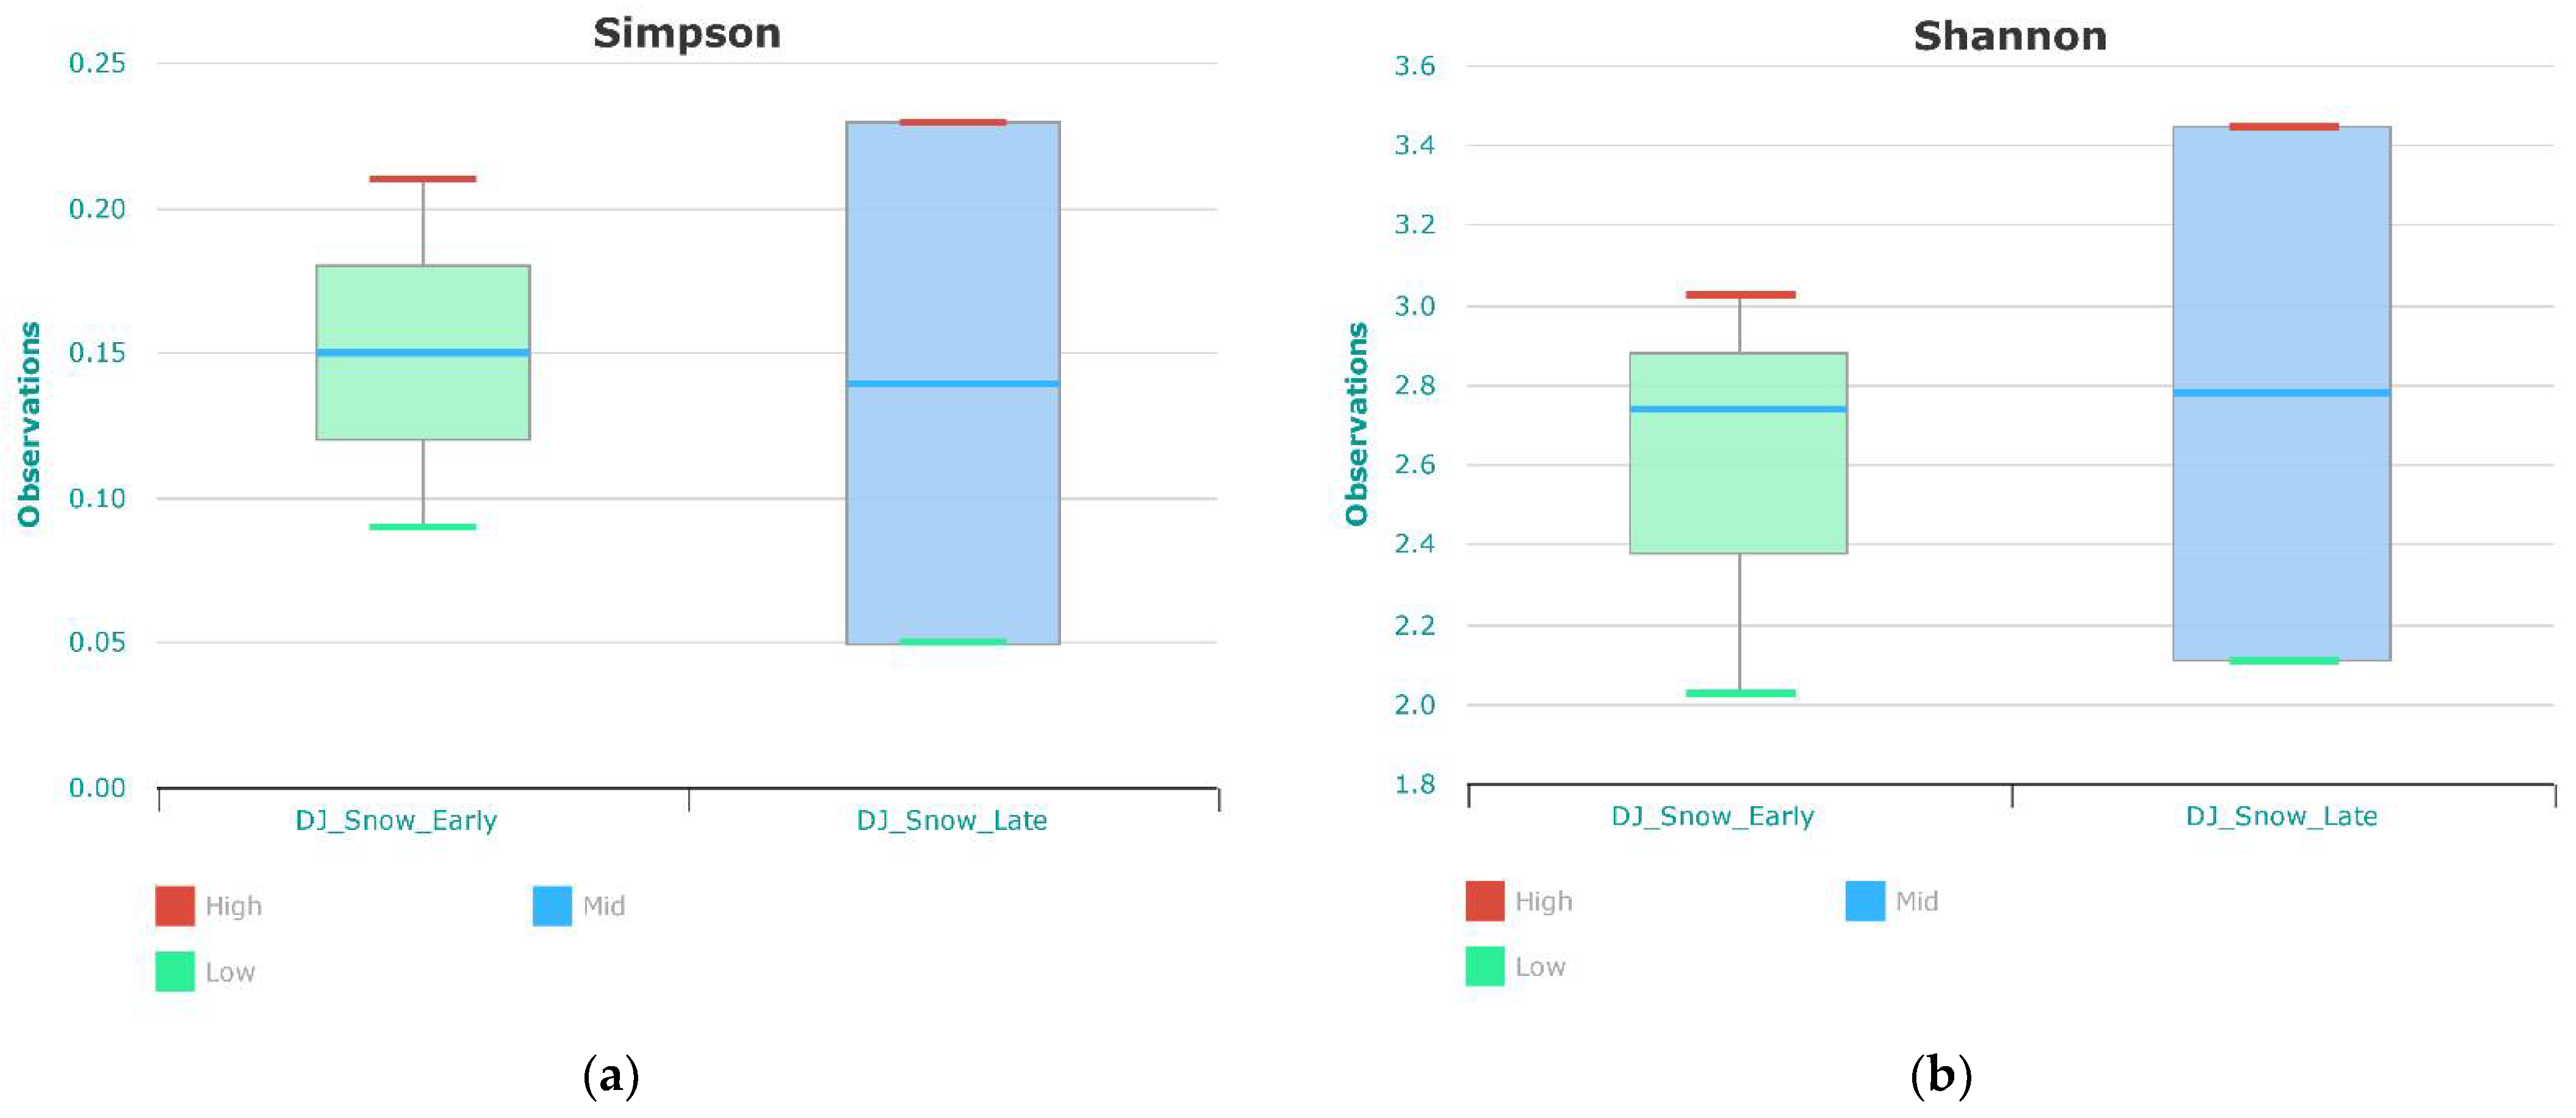
PCoA showed that the samples DJS-1 and DJS-2 are closely related to each other, while the other samples are dispersed, as shown in Figure S1. We tried to evaluate any significant differences in the diversity between the early snowfall samples DJS-1, DJS-2, and DJS-3 and late season snowfall samples DJS-4 and DJS-5 but concluded that there were no significant differences present between the early season and late season samples (Table S3 and Figure 2).
The sequences for the bacterial relative abundance at the phylum level were Actinobacteria>Firmicutes>Proteobacteria>Bacteriodetes>Acidobacteria>Planctomycetes>Gemmatimonadetes in this study (Figure 1). Proteobacteria, Firmicutes, Bacteroidetes, Actinobacteria, and Acidobacteria were observed as the major contributing bacteria to snowfall samples at the phylum level in southern Italy [33].

3.2. Fungal Compositions and Diversity

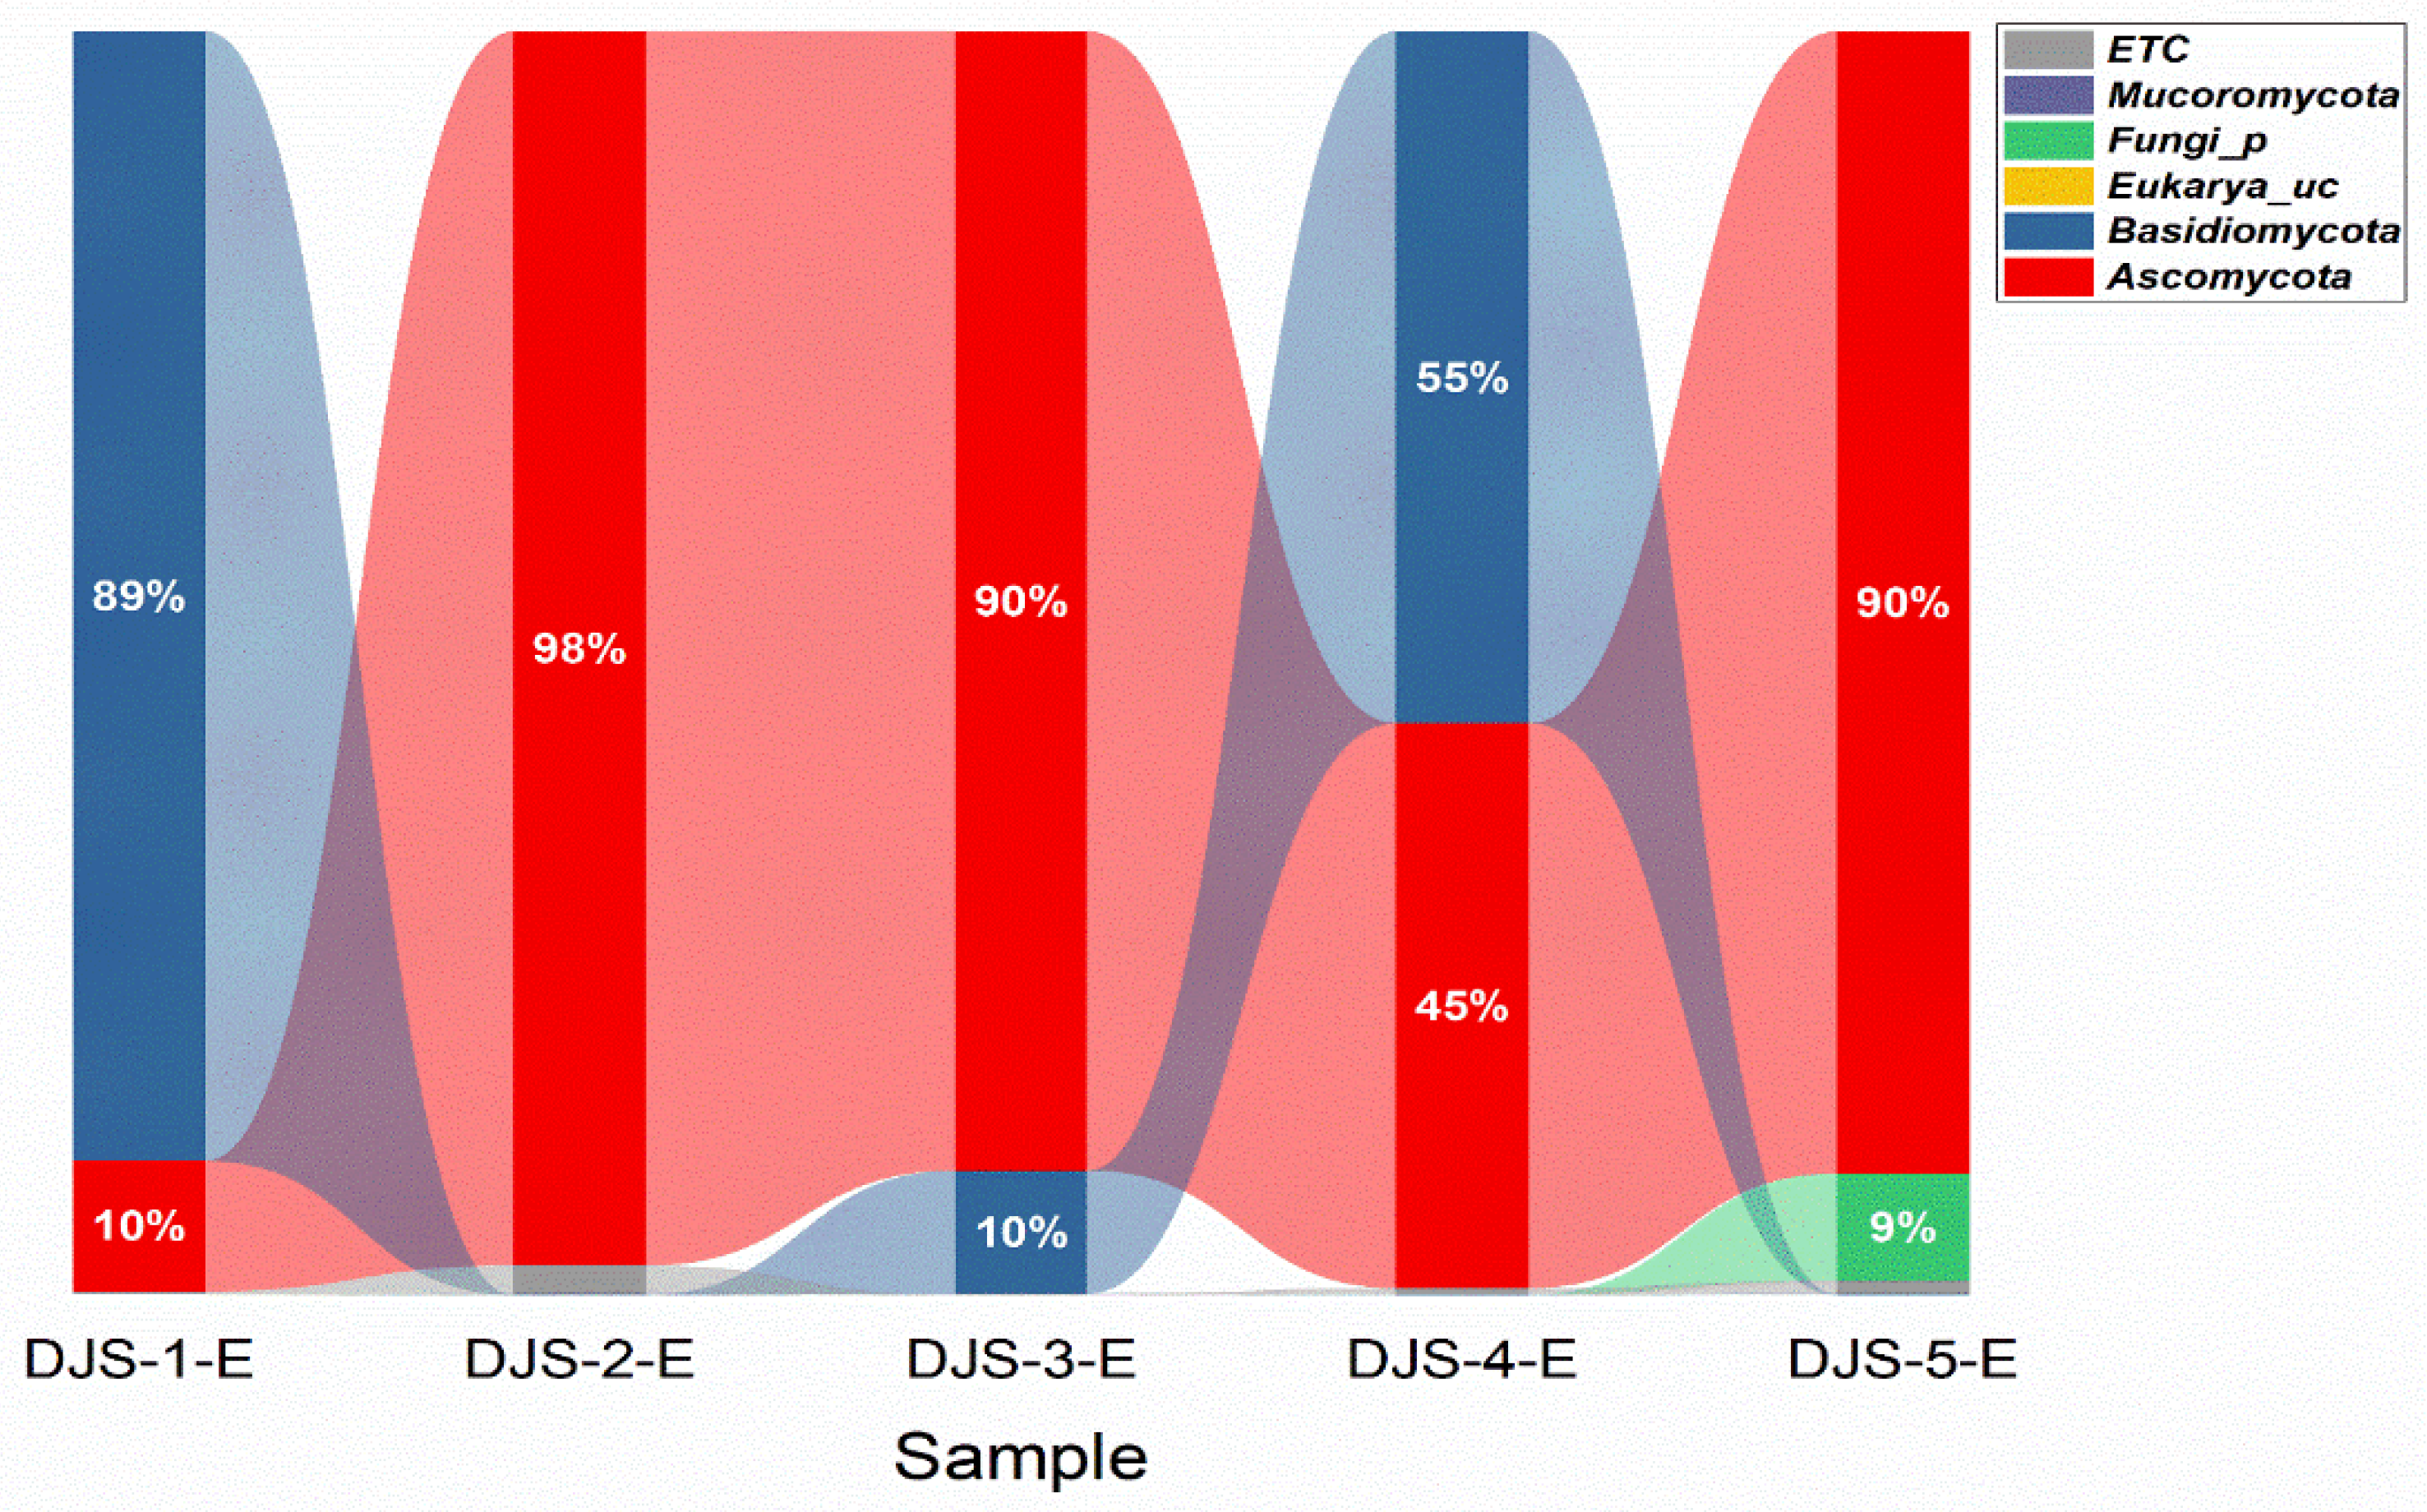
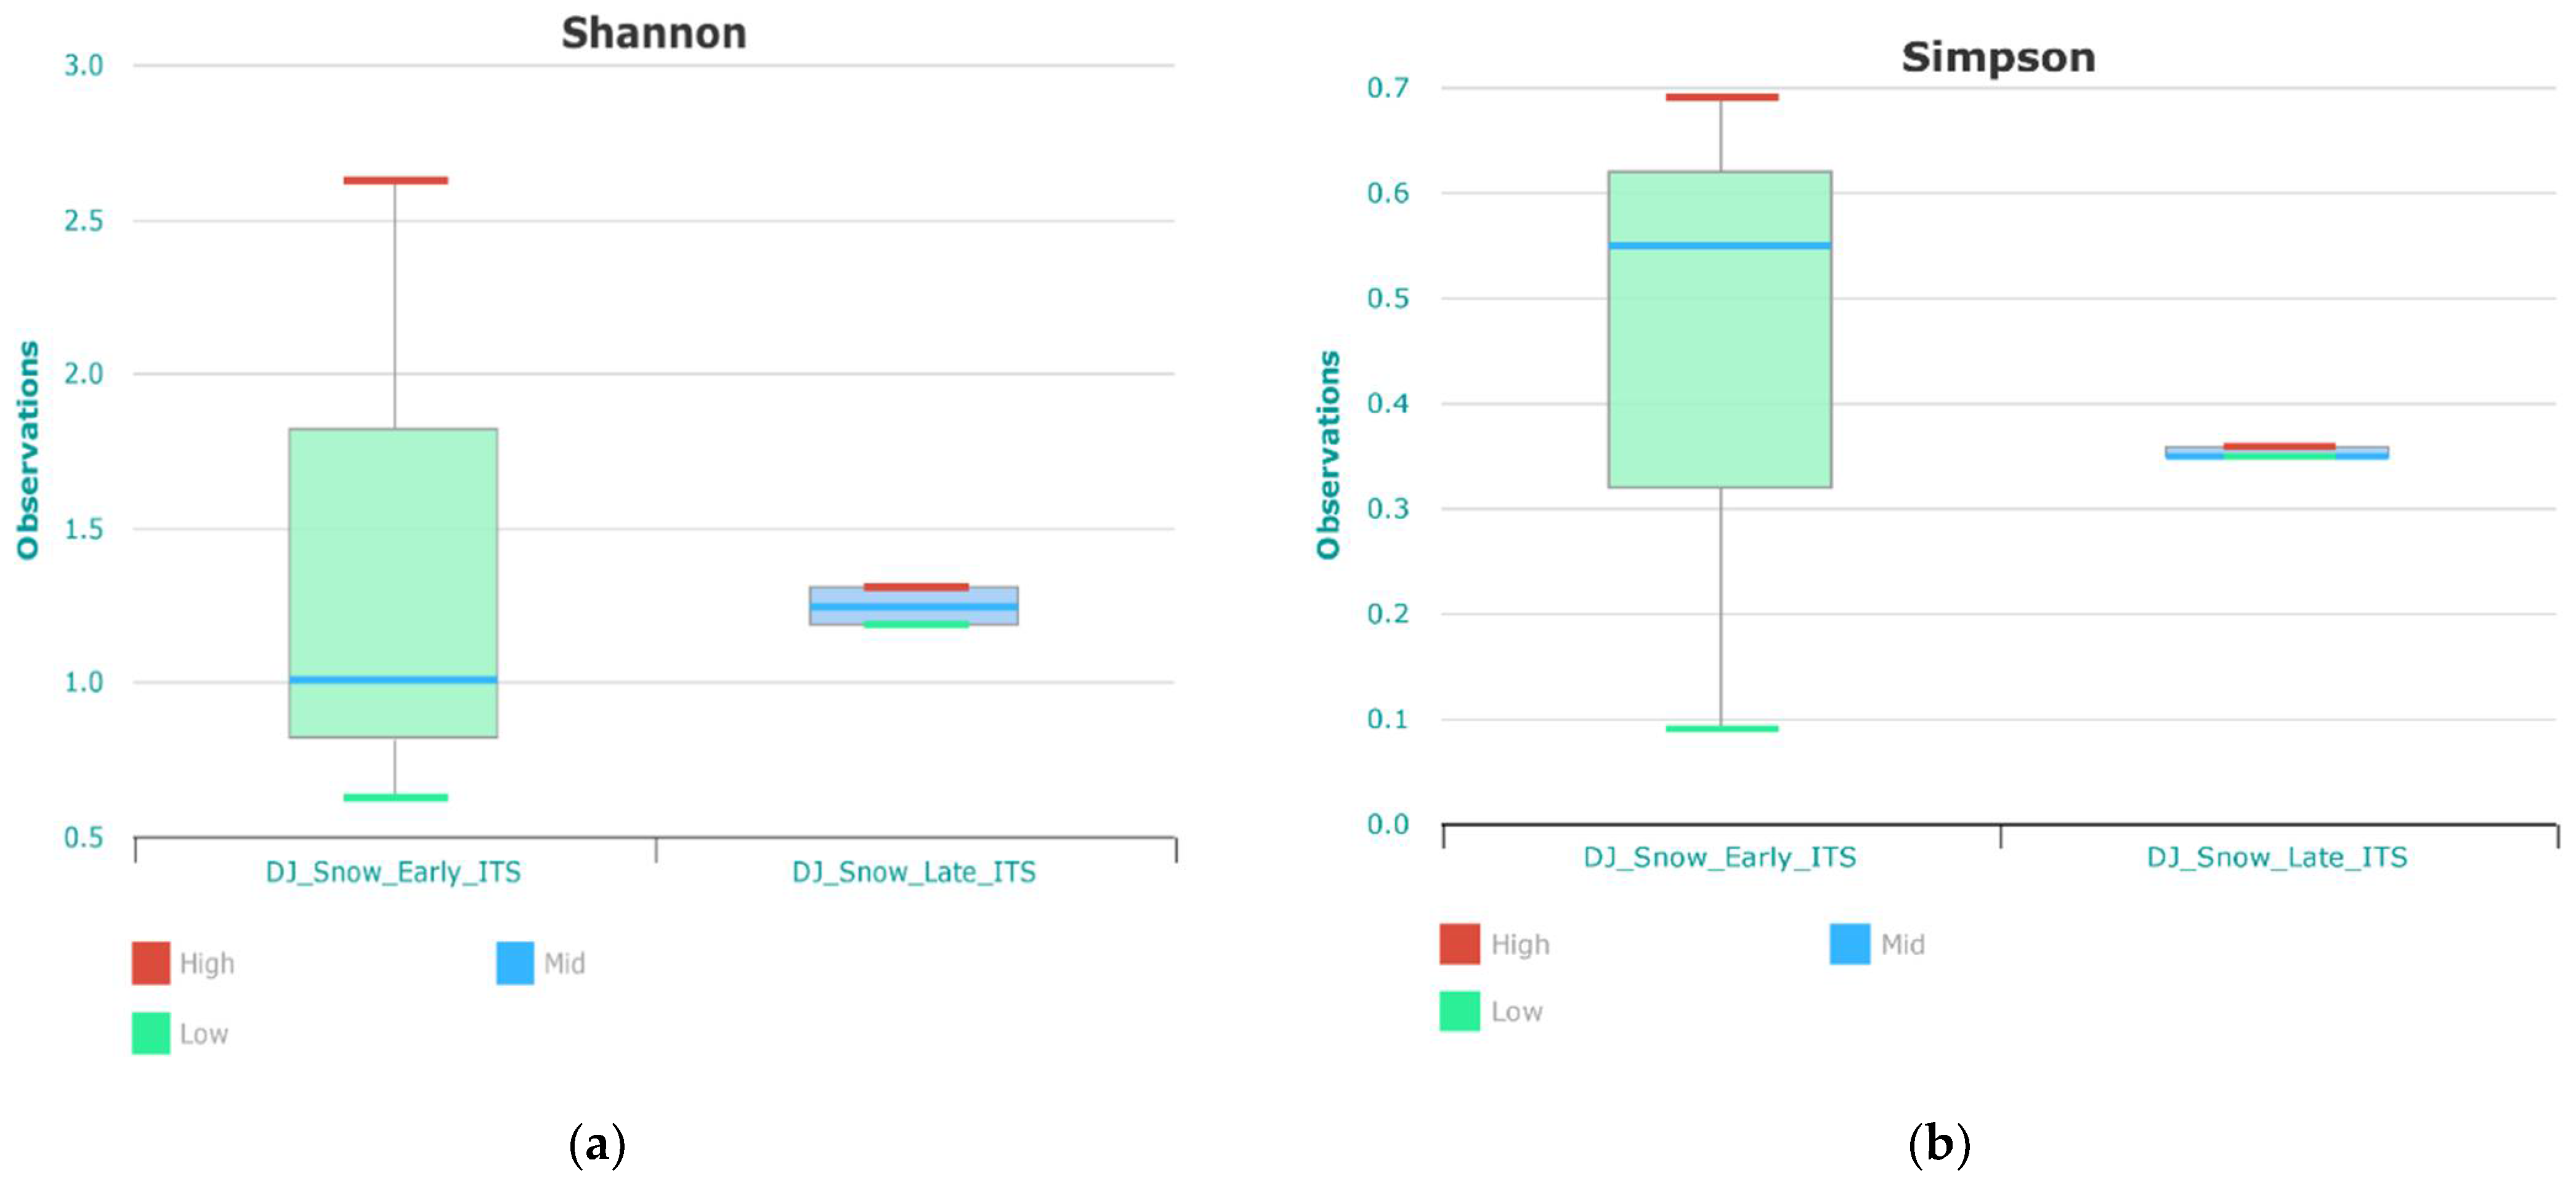
Two major fungal phyla Ascomycota and Basidiomycota were observed in the fresh snowfall samples. The average relative abundance of Ascomycota was 66.6%, while Basidiomycota comprised 30.7% of the total fungal phyla. A high abundance of Ascomycota was present in the samples DJS-2, DJS-3, and DJS-5, while Basidiomycota was more prevalent in DJS-1 and DJS-4, as shown in Figure 3. Moreover, the plant-associated fungi_p was also present, with an 8.5% abundance in the DJS-5 sample presented in Table S3. The major fungal classes were Saccharomycetes at 36.6%, Agaricomycetes at 30%, Dothideomycetes at 13.2%, and Eurotiomycetes at 9.5%, which are presented in Table S3. These fungal taxa have also been reported in the snow of Mount Sonnblick in Austria [34]. Candida was the most abundant genus in the fresh snowfall samples, with an average relative abundance of 36.6%, followed by Mycena, with an average abundance of 14.6% (only prominent in DJS-2, with almost 73.4% of the relative abundance), as presented in Table S3. Resinicium was observed in DJS-4 at 37.24% and was absent in all the other samples. Similarly, Aspergillus was dominant in DJS-5 at 34.9% but almost non-existent in all the other samples, as shown in Table S3 and Figure S4. DJS-3 had the highest diversity, while DJS-2 exhibited the lowest diversity among the samples, as shown in Figure S5. However, no significant difference was observed between the early season and late season ITS sequences, as shown in Figure 4.
The diversity indices regarding the ITS region sequencing from the fresh snowfall samples are presented in Table S3. There was no significant difference in the diversity observed in the ITS sequencing in the early season samples and late season samples presented in Table S3.
The dominant proportions of Ascomycota, Basidiomycota, and Mucoromycota were observed in the snow samples collected from Livingston Island in Antarctica [35]. Ascomycota and Basidiomycota both were also previously found in both Asian dust and marine and desert atmospheric aerosol samples [36,37], which can possibly be scavenged by snow during snow formation. Ascomycota and Basidiomycota are in the spore-forming fungal group actively discharging into the atmosphere and have been detected in aerosol samples [36].

3.3. Chemical Characteristics of the Snowfall Samples

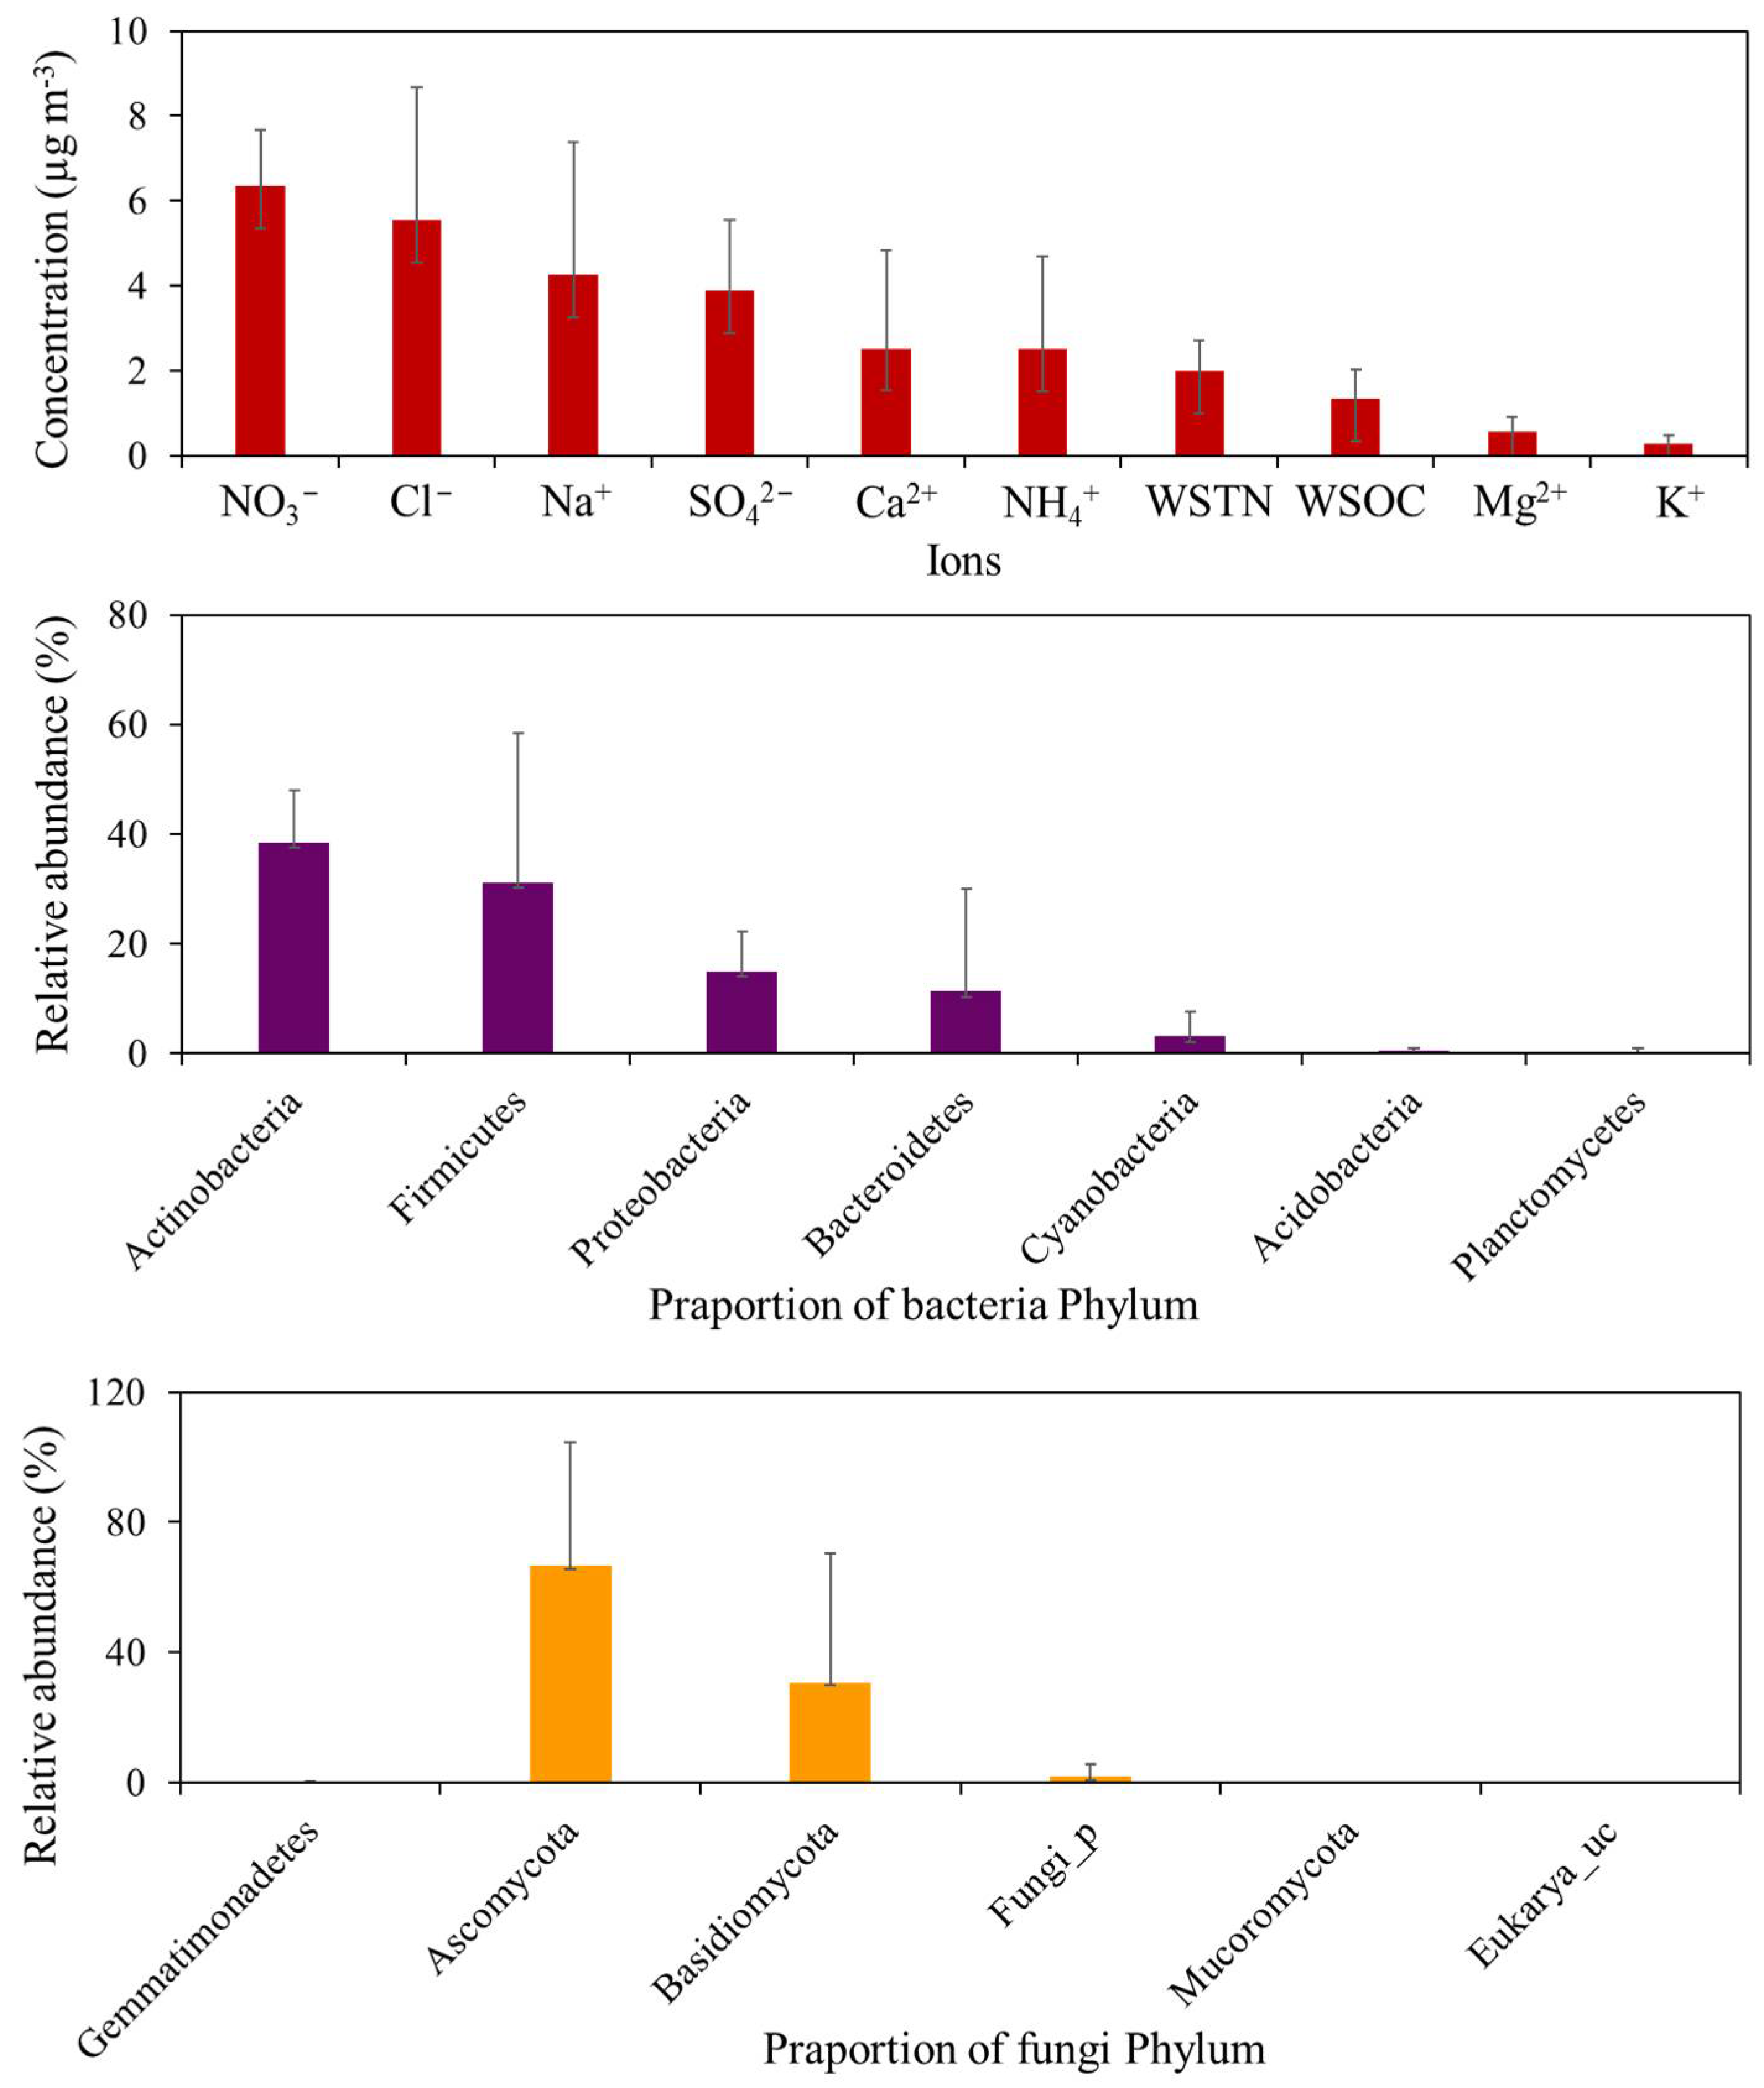
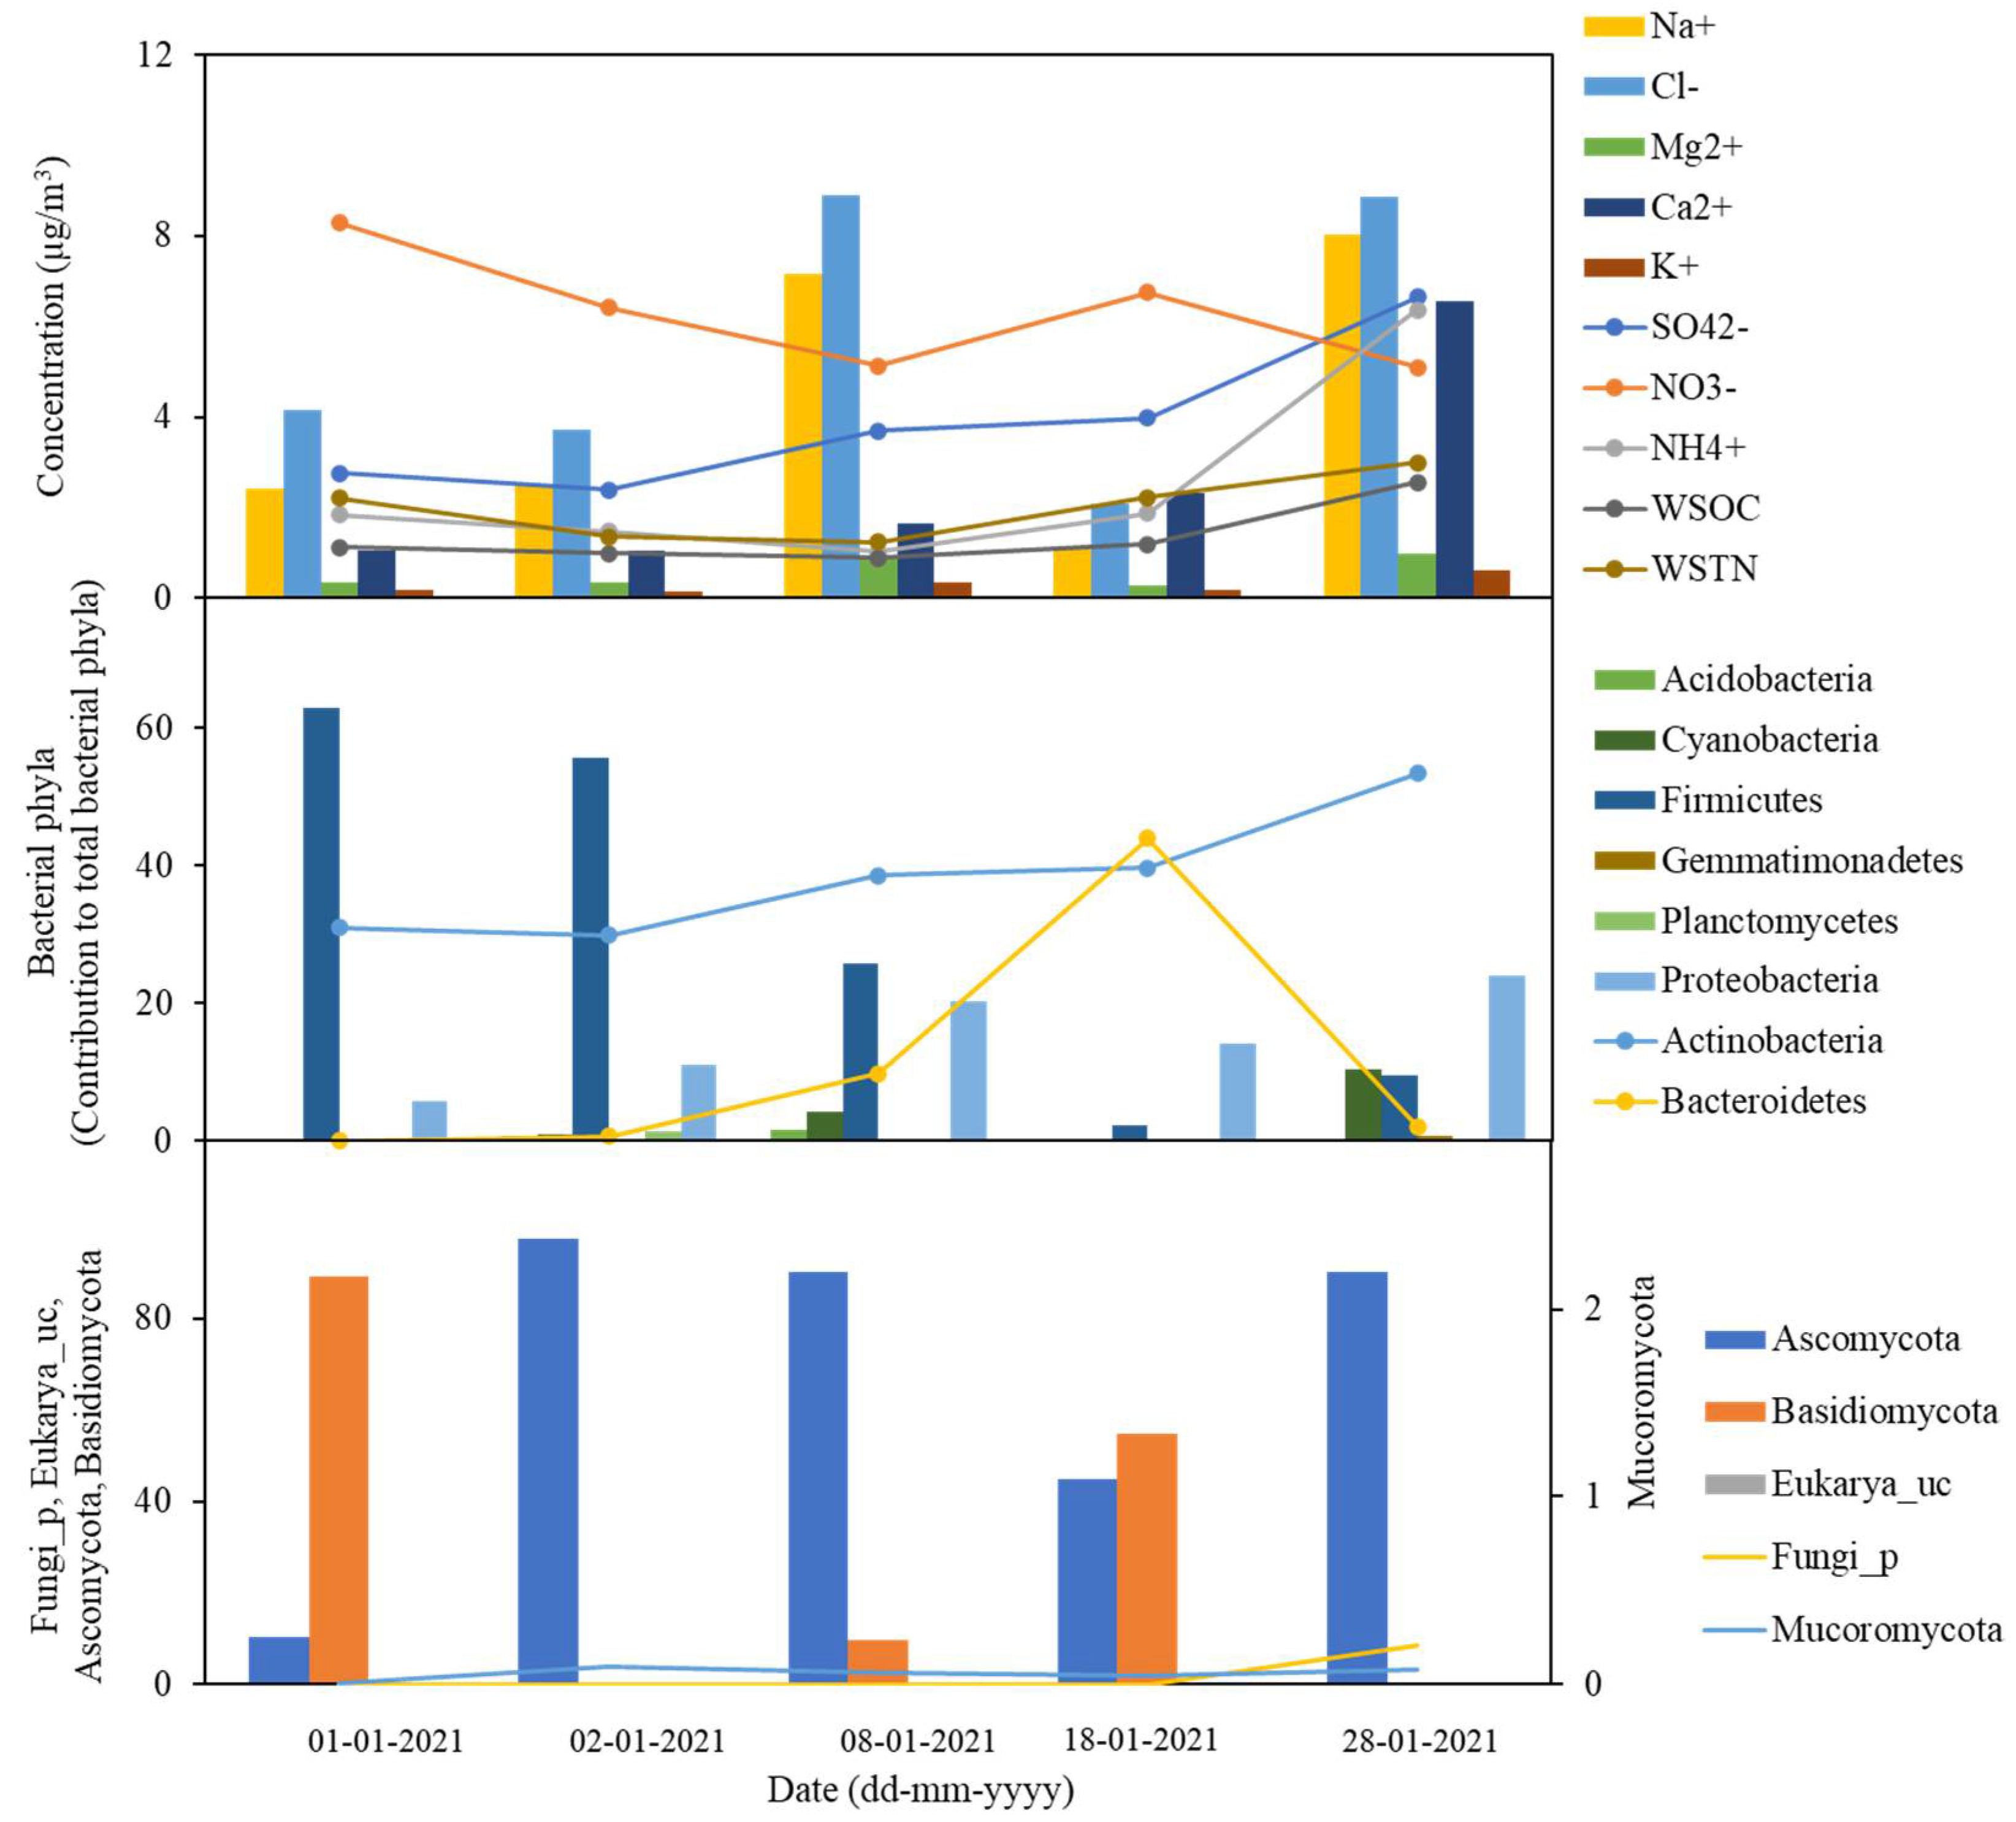
The mean concentrations of the chemical components (µg m−3) and the relative contributions of each bacterium to the total bacteria and each fungus to the total fungi at the phylum level are given in Figure 5. A previous study showed a high concentration of NO3 compared with other chemical components in Arctic snow samples [38]. The high concentration of NO3 might be due to the scavenging of gaseous nitrate compounds from the atmosphere during snowfall. It has been reported that there is a high concentration of NO3 in the snow because it is the end product of various nitrogen oxides (NOx = NO + NO2, etc.) and is relatively more stable than the other oxides [39,40]. The high level of Na+ and Cl suggested that the snowfall components of this site were influenced by marine emissions during the study period (Figure 5). Na+ and Cl are well-known as sea salt components observed in snow samples [41]. High concentrations of Na+ and Cl were observed in the fresh snow samples collected from the Marinelli Glacier in Chile [41].

3.4. Temporal Variability of the Snowfall Components

The temporal variabilities of Cl, Na+, SO42−, Ca2+, NH4+, WSOC, WSTN, bacterial phyla (including Actinobacteria, Cyanobacteria, Gemmatimonadetes, and Proteobacteria), and fungal phyla (including Ascomycota, and Fungi_p) were similar on 28 January 2021 (Figure 6). This may be due to the similar sources and/or formation pathways of these snow components in the sample collected on 28 January 2021. Five-day air mass backward trajectories were retrieved from the Hybrid Single-Particle Lagrangian Integrated Trajectory (HYSPLIT) [42] to investigate the air mass transport towards the sampling site during the study period. On 28 January, the air mass arrived mostly from the northwest direction after passing over the regions of the Mongolian Desert, the Yellow Sea, and northeastern China, Russia, and Mongolia, which may influence the level of snow components, including Na+, Cl, SO42−, and Ca2+ (Figure 6). In the research area, the wind speed varied from 0.1 to 6 m/s on the 28th, and the PM2.5 concentration was 19.3 (12–19 µg/m3). In comparison, the different variability of NO3- compared with the remaining chemical and microbial components might be due to a different source and/or formation characteristics. NO3 is known as an anthropogenic pollutant, and its high concentration showed that the nearby anthropogenic activities influenced the chemistry inside the snowfall samples (Figure 6). Basidiomycota had the highest concentrations and relative proportions (Figure 6).

3.5. Potential Sources

Principal component analysis (PCA) with varimax rotation was applied to the chemical components and bacterial and fungal phyla to investigate their potential sources (Table 3). Four factors were obtained after the PCA of the data. The secondary inorganic components of the atmosphere include NH4+ and SO42− [43]. Sea salt tracers for airborne particles are Na+ and Cl [44]. Ca2+ is used as a tracer for airborne dust particles [45,46]. Water-soluble K+ is used as a tracer for biomass combustion [46]. The characteristics of these ions are used to identify the sources of snowfall components using PCA. Actinobacteria, Cyanobacteria, Gemmatimonadetes, and Fungi_p were among the high-loading bacterial phyla found in F1, along with secondary components (SO42− and NH4+) and airborne dust traces (Ca2+), which may be related to the particles of the secondary components and airborne dust (Table 3). Acidobacteria, Proteobacteria, and Ascomycota, as well as sea salt tracers (Na+ and Cl-), correlated well with F2, possibly due to their relationship with sea salt (Table 3). Planctomycetes and Ascomycota had a strong correlation with F3, indicating that F3 was related to fungi (Table 3). In F4, only Bacteroidetes showed strong loading, which may be associated with the bacterial group (Table 3). In Xi’an, China, microbial activity was substantially associated with airborne Na+, Mg2+, and Ca2+ [47]. According to the research conducted in a location in eastern China, Actinobacteria, Proteobacteria, Firmicutes, Cyanobacteria, and Bacteroidetes are the major bacteria, while Ascomycota is the most prevalent fungus [48]. PCA suggested that the components of the snowfall samples of this site mainly belonged to the sources associated with secondary aerosols, dust, sea salt, and fungal and bacterial groups.

4. Discussion

In both subtropical and arctic parts of the planet, snowfall is indigenous to the climate system. This type of precipitation is important to both confined and worldwide hydrologic systems because it contributes to water reservoirs. The air circulation and deposition bring an allochthonous influx of marine microbes and other particulate organic materials. This study represents one of the few studies related to the microbiome analysis of a fresh snowfall event and its relevance to different chemical characteristics that took place in Daejeon, South Korea, in 2021. Fresh snowfall microbial communities were assessed by using NGS with 16S rRNA and ITS2 regions and by analyzing the chemical characteristics using ion chromatography for cations (Na+, Ca2+, Mg2+, and NH4+), and anions (SO42−, NO3, and Cl), as well as a water-soluble organic carbon (WSOC) and water-soluble nitrogen (WSTN) analyzer for WSOC and WSTN.
Our findings demonstrate that microorganisms in the snow come from a variety of sources, with community representatives commonly recovered from soil and aquatic habitats and generalists collected from a variety of settings. The dominant bacteria in the fresh snowfall samples in Daejeon, South Korea, were Actinobacteria, Firmicutes, Proteobacteria, Bacteroidetes, and Cyanobacteria, from which Actinobacteria, Cyanobacteria, Gemmatimonadetes, and Proteobacteria might be associated with the secondary chemical components and dust sources such as SO42, NH4+, and Ca2+. This association might be attributed to the suburban area of the sampling surrounded by an agricultural area, which is similar to a previous study demonstrating the association of Cyanobacteria with a nitrogen source in a forest ecosystem [49] and the relationship of Proteobacteria with sulfur [50]. Meanwhile, in the ITS analysis, Ascomycota and unclassified_Fungi were mainly associated with the secondary chemical components and dust sources.
Overall, the makeup of the bacterial community in fresh snow at Daejeon, South Korea, was identical to that seen in glaciers, snow, lake ice, sea ice, and atmospheric clouds [51]. The sample DJS-5 collected on 28 January 2021 showed the highest bacterial diversity among all the collected samples. The reason behind the higher diversity in DJS-5 might be due to the high wind speed and dusty atmosphere during the sampling. The dust particles from various regions can be the potential source of various microorganisms. The HYSPLIT analysis showed that on 28 January 2021, the air mass arrived mostly from the northwest direction, after passing over the regions of the Mongolian Desert, the Yellow Sea, and northeastern China, Russia, and Mongolia, which may influence the level of the snow components, including Na+, Cl, SO42, and Ca2+ (Figure 6). However, a similar increase in fungal diversity was not observed with DJS-5. It is not clear why the fungal diversity was not high. One of the possible explanations can be the size difference between the bacterial and fungal cells. Due to this size difference, the wind influences the movement of bacteria and fungi differently.
In general, the NGS analysis showed an abundance of bacterial and fungal genera suited to flourish at low temperatures, namely Bifidobacterium, Cutibacterium, Chryseobacterium, and Corynebacterium in the 16S and Saccharomycetes, Agaricomycetes, Dothideomycetes, and Eurotiomycetes in the ITS. These observed microbial taxa were previously reported in snow samples [9,34]. The higher concentrations of Na+ and Cl suggested that the snowfall components of this site were influenced by marine emissions during the study period. Na+ and Cl are well-known as sea salt components observed in snow samples [41]. Despite the fact that the location is far from the sea, a considerable effect from the marine environment appears to exist, with Proteobacteria dominating, followed by Bacteroidetes and Cyanobacteria [52]. Due to their tiny size and tolerance to environmental challenges, free-living microorganisms have high dispersion rates and may be carried over extremely long distances. However, we cannot rule out the possibility that a minuscule portion of bacteria might be associated with humans [53,54].
On 1 January 2021, NO3, Firmicutes, and Basidiomycota had the highest concentrations and relative proportions (Figure 6). On this day, the air mass backward trajectories arrived at this site from the northwest direction, which included the regions belonging to Russia, China, Mongolia, the Gobi Desert, the Yellow Sea, and South Korea (Figure 7). Similar to this site, Beijing, North China, has been reported to have a high abundance of Firmicutes and Basidiomycota species in airborne particles [47]. During the remaining days, the air mass backward trajectories primarily arrived at this site after passing over the Northeast Asian nations (including China and Mongolia), the Gobi Desert, and the Yellow Sea (Figure 7).
The elevated NO3 concentration may have resulted from snowfall scavenging gaseous nitrate molecules from the environment. As NO3 is a nitrogen oxide byproduct that is generally more persistent than other nitrogen oxides (NOx = NO + NO2, etc.) and has a large concentration in snow, it is also recorded [39,40]. Additionally, it was shown that microbes in dry polar snow were actively exchanging reactive nitrogen species with the environment, contributing to biogeochemical cycling at low temperatures [10,55].
Overall, the biochemical investigations and subsequent statistical analysis showed an association between the chemical sources and the distribution of microbial communities. This study also demonstrated the differences in terms of microbial diversity and the compositions in the fresh snowfall samples. The results described in this study are relevant to the biogeochemical associations in snow, which probably have an impact far beyond Daejeon, South Korea. This study may open the discussions to the potentially broad issues on the influence of snowfall-deposited microorganisms on both public health and ecological function. Based on our research, we believe that snowfall (and the meteoric deposition of any sort, such as rain, snow, ice, fog, and maybe even general humidity) can be regarded as a significant transporter of microbial biomass with potential public health implications. As a result, our experimental approach and findings can be utilized as a foundation for additional research on fresh snowfall to address a number of issues about the microbial ecology of these unusual habitats.

Supplementary Materials

The following are available online at https://www.mdpi.com/article/10.3390/atmos13101590/s1, Table S1: Diversity indices; Table S2: Bacterial composition in fresh snowfall samples; Table S3: Fungal composition in fresh snowfall samples. Figure S1: Principal Coordinate Analysis (PCoA) of fresh snowfall samples; Figure S2: Average composition of bacterial phylum and genera in double pie chart; Figure S3: Alpha diversity indices of the 16S in fresh snowfall samples; Figure S4: Average composition of fungal phylum and genera presented in double pie chart; Figure S5: Alpha diversity indices of the ITS in fresh snowfall samples.

Author Contributions

Conceptualization, methodology, validation, formal analysis, investigation, resources, data curation, writing—original draft preparation, Z.U.H.; conceptualization, methodology, validation, formal analysis, investigation, resources, data curation, writing—original draft preparation, J.N.; resources, writing—original draft preparation, D.P.; conceptualization, resources, writing—review and editing, supervision, project administration, J.J.; conceptualization, resources, writing—review and editing, supervision, project administration, funding acquisition, S.K. All authors have read and agreed to the published version of the manuscript.

Funding

This work was supported by the “Microbial community anaylsis of particulated matter” (GP2022-0008-05) issued from the Korea Research Institute of Standards and Science (KRISS) under the Basic R&D Project. This work was also supported by the “Establishment of measurement standards for microbiology” (GP2022-0005-08) and the UST Young Scientist Research Program (2020YS26), funded by the Korea Research Institute of Standards and Science and University of Science and Technology, respectively.

Institutional Review Board Statement

Not applicable.

Informed Consent Statement

Not applicable.

Data Availability Statement

The data generated in this study can be provided by the corresponding authors by request ([email protected] and [email protected]).

Acknowledgments

All authors thankfully acknowledge the provision of the HYSPLIT transport and dispersion model through the NOAA Air Resources Laboratory (http://www.arl.noaa.gov/ready.html, (accessed on 17 August 2019)) operated by the National Aeronautics and Space Administration (NASA), US (https://firms.modaps.eosdis.nasa.gov/alerts (accessed on 15 August 2022)).

Conflicts of Interest

All authors declare that they have no conflict of interest.

References

  1. Hinkler, J.; Hansen, B.U.; Tamstorf, M.P.; Sigsgaard, C.; Petersen, D. Snow and Snow-Cover in Central Northeast Greenland. Adv. Ecol. Res. 2008, 40, 175–195. [Google Scholar]
  2. Madan, N.J. Snow Ecology: An Interdisciplinary Examination of Snow-covered Ecosystems. J. Ecol. 2001, 89, 1097–1098. [Google Scholar] [CrossRef]
  3. Lopatina, A.; Medvedeva, S.; Shmakov, S.; Logacheva, M.D.; Krylenkov, V.; Severinov, K. Metagenomic analysis of bacterial communities of antarctic surface snow. Front. Microbiol. 2016, 7, 398. [Google Scholar] [CrossRef] [PubMed]
  4. Woo, C.; Yamamoto, N. Falling bacterial communities from the atmosphere. Environ. Microbiome 2020, 15, 22. [Google Scholar] [CrossRef]
  5. Mortazavi, R.; Attiya, S.; Ariya, P.A. Arctic microbial and next-generation sequencing approach for bacteria in snow and frost flowers: Selected identification, abundance and freezing nucleation. Atmos. Chem. Phys. 2015, 15, 6183–6204. [Google Scholar] [CrossRef]
  6. Zhu, G.; Wang, X.; Yang, T.; Su, J.; Qin, Y.; Wang, S.; Gillings, M.; Wang, C.; Ju, F.; Lan, B.; et al. Air pollution could drive global dissemination of antibiotic resistance genes. ISME J. 2020, 15, 270–281. [Google Scholar] [CrossRef]
  7. Després, V.; Huffman, J.A.; Burrows, S.M.; Hoose, C.; Safatov, A.; Buryak, G.; Fröhlich-Nowoisky, J.; Elbert, W.; Andreae, M.; Pöschl, U.; et al. Primary biological aerosol particles in the atmosphere: A review. Tellus B Chem. Phys. Meteorol. 2012, 64, 15598. [Google Scholar] [CrossRef]
  8. Honeyman, A.S.; Day, M.L.; Spear, J.R. Regional fresh snowfall microbiology and chemistry are driven by geography in storm-tracked events, Colorado, USA. PeerJ 2018, 6, e5961. [Google Scholar] [CrossRef]
  9. Segawa, T.; Miyamoto, K.; Ushida, K.; Agata, K.; Okada, N.; Kohshima, S. Seasonal change in bacterial flora and biomass in mountain snow from the Tateyama Mountains, Japan, analyzed by 16S rRNA gene sequencing and real-time PCR. Appl. Environ. Microbiol. 2005, 71, 123–130. [Google Scholar] [CrossRef]
  10. Amoroso, A.; Domine, F.; Esposito, G.; Morin, S.; Savarino, J.; Nardino, M.; Montagnoli, M.; Bonneville, J.-M.; Clement, J.-C.; Ianniello, A.; et al. Microorganisms in Dry Polar Snow Are Involved in the Exchanges of Reactive Nitrogen Species with the Atmosphere. Environ. Sci. Technol. 2009, 44, 714–719. [Google Scholar] [CrossRef]
  11. Fujii, M.; Takano, Y.; Kojima, H.; Hoshino, T.; Tanaka, R.; Fukui, M. Microbial Community Structure, Pigment Composition, and Nitrogen Source of Red Snow in Antarctica. Microb. Ecol. 2009, 59, 466–475. [Google Scholar] [CrossRef] [PubMed] [Green Version]
  12. Kos, G.; Kanthasami, V.; Adechina, N.; Ariya, P.A. Volatile organic compounds in Arctic snow: Concentrations and implications for atmospheric processes. Environ. Sci. Process. Impacts 2014, 16, 2592–2603. [Google Scholar] [CrossRef] [PubMed]
  13. Nakaya, U. An Electron Microscope Study of Snow Crystal Nuclei. J. Glaciol. 1953, 2, 176–180. [Google Scholar] [CrossRef]
  14. Cowan, D.A.; Tow, L.A. Endangered Antarctic Environments. Annu. Rev. Microbiol. 2004, 58, 649–690. [Google Scholar] [CrossRef] [PubMed]
  15. Hanesiak, J.M.; Yackel, J.J.; Barber, D.G. Effect of Melt Ponds on First-Year Sea Ice Ablation—Integration of RADARSAT-1 and Thermodynamic Modelling. Can. J. Remote Sens. 2014, 27, 433–442. [Google Scholar] [CrossRef]
  16. Xie, J.; Jin, L.; Luo, X.; Zhao, Z.; Li, X. Seasonal Disparities in Airborne Bacteria and Associated Antibiotic Resistance Genes in PM2.5 between Urban and Rural Sites. Environ. Sci. Technol. Lett. 2018, 5, 74–79. [Google Scholar] [CrossRef]
  17. Odabasi, M.; Dumanoglu, Y.; Ozgunerge Falay, E.; Tuna, G.; Altiok, H.; Kara, M.; Bayram, A.; Tolunay, D.; Elbir, T. Investigation of spatial distributions and sources of persistent organic pollutants (POPs) in a heavily polluted industrial region using tree components. Chemosphere 2016, 160, 114–125. [Google Scholar] [CrossRef]
  18. Saleeby, S.M.; Cotton, W.R.; Lowenthal, D.; Borys, R.D.; Wetzel, M.A. Influence of cloud condensation nuclei on orographic snowfall. J. Appl. Meteorol. Climatol. 2009, 48, 903–922. [Google Scholar] [CrossRef]
  19. Zhang, S.; Hou, S.; Wu, Y.; Qin, D. Bacteria in Himalayan glacial ice and its relationship to dust. Biogeosciences 2008, 5, 1741–1750. [Google Scholar] [CrossRef]
  20. Möhler, O.; Georgakopoulos, D.G.; Morris, C.E.; Benz, S.; Ebert, V.; Hunsmann, S.; Saathoff, H.; Schnaiter, M.; Wagner, R. Heterogeneous ice nucleation activity of bacteria: New laboratory experiments at simulated cloud conditions. Biogeosciences 2008, 5, 1425–1435. [Google Scholar] [CrossRef]
  21. DeMott, P.J.; Cziczo, D.J.; Prenni, A.J.; Murphy, D.M.; Kreidenweis, S.M.; Thomson, D.S.; Borys, R.; Rogers, D.C. Measurements of the concentration and composition of nuclei for cirrus formation. Proc. Natl. Acad. Sci. USA 2003, 100, 14655–14660. [Google Scholar] [CrossRef] [Green Version]
  22. Obbard, R.W.; Roscoe, H.K.; Wolff, E.W.; Atkinson, H.M. Frost flower surface area and chemistry as a function of salinity and temperature. J. Geophys. Res. Atmos. 2009, 114, 20305. [Google Scholar] [CrossRef]
  23. Kaleschke, L.; Richter, A.; Burrows, J.; Afe, O.; Heygster, G.; Notholt, J.; Rankin, A.M.; Roscoe, H.K.; Hollwedel, J.; Wagner, T.; et al. Frost flowers on sea ice as a source of sea salt and their influence on tropospheric halogen chemistry. Geophys. Res. Lett. 2004, 31. [Google Scholar] [CrossRef]
  24. Bolger, A.M.; Lohse, M.; Usadel, B. Trimmomatic: A flexible trimmer for Illumina sequence data. Bioinformatics 2014, 30, 2114–2120. [Google Scholar] [CrossRef] [PubMed]
  25. Rognes, T.; Flouri, T.; Nichols, B.; Quince, C.; Mahé, F. VSEARCH: A versatile open source tool for metagenomics. PeerJ 2016, 2016, e2584. [Google Scholar] [CrossRef]
  26. Myers, E.W.; Miller, W. Optimal alignments in linear space. Bioinformatics 1988, 4, 11–17. [Google Scholar] [CrossRef] [PubMed]
  27. Wheeler, T.J.; Eddy, S.R. nhmmer: DNA homology search with profile HMMs. Bioinformatics 2013, 29, 2487–2489. [Google Scholar] [CrossRef]
  28. Yoon, S.H.; Ha, S.M.; Kwon, S.; Lim, J.; Kim, Y.; Seo, H.; Chun, J. Introducing EzBioCloud: A taxonomically united database of 16S rRNA gene sequences and whole-genome assemblies. Int. J. Syst. Evol. Microbiol. 2017, 67, 1613–1617. [Google Scholar] [CrossRef]
  29. Edgar, R.C.; Haas, B.J.; Clemente, J.C.; Quince, C.; Knight, R. UCHIME improves sensitivity and speed of chimera detection. Bioinformatics 2011, 27, 2194–2200. [Google Scholar] [CrossRef]
  30. Jung, J.; Kim, Y.J. Tracking sources of severe haze episodes and their physicochemical and hygroscopic properties under Asian continental outflow: Long-range transport pollution, postharvest biomass burning, and Asian dust. J. Geophys. Res. Atmos. 2011, 116, 2206. [Google Scholar] [CrossRef]
  31. Kim, H.; Jung, J.; Lee, J.; Lee, S. Seasonal Characteristics of Organic Carbon and Elemental Carbon in PM2.5 in Daejeon. J. Korean Soc. Atmos. Environ. 2015, 31, 28–40. [Google Scholar] [CrossRef] [Green Version]
  32. Wang, X.; Bai, X.; Ma, L.; He, C.; Jiang, H.; Sheng, L.; Luo, W. Snow depths’ impact on soil microbial activities and carbon dioxide fluxes from a temperate wetland in Northeast China. Sci. Rep. 2020, 10, 8709. [Google Scholar] [CrossRef] [PubMed]
  33. Monaco, P.; Divino, F.; Naclerio, G.; Bucci, A. Microbial community analysis with a specific statistical approach after a record breaking snowfall in Southern Italy. Ann. Microbiol. 2020, 70, 63. [Google Scholar] [CrossRef]
  34. Els, N.; Greilinger, M.; Reisecker, M.; Tignat-Perrier, R.; Baumann-Stanzer, K.; Kasper-Giebl, A.; Sattler, B.; Larose, C. Comparison of Bacterial and Fungal Composition and Their Chemical Interaction in Free Tropospheric Air and Snow Over an Entire Winter Season at Mount Sonnblick, Austria. Front. Microbiol. 2020, 11, 980. [Google Scholar] [CrossRef] [PubMed]
  35. Rosa, L.H.; Pinto, O.H.B.; Šantl-Temkiv, T.; Convey, P.; Carvalho-Silva, M.; Rosa, C.A.; Câmara, P.E.A.S. DNA metabarcoding of fungal diversity in air and snow of Livingston Island, South Shetland Islands, Antarctica. Sci. Rep. 2020, 10, 21793. [Google Scholar] [CrossRef]
  36. Abd Aziz, A.; Lee, K.; Park, B.; Park, H.; Park, K.; Choi, I.G.; Chang, I.S. Comparative study of the airborne microbial communities and their functional composition in fine particulate matter (PM2.5) under non-extreme and extreme PM2.5 conditions. Atmos. Environ. 2018, 194, 82–92. [Google Scholar] [CrossRef]
  37. Boreson, J.; Dillner, A.M.; Peccia, J. Correlating bioaerosol load with PM2.5 and PM10cf concentrations: A comparison between natural desert and urban-fringe aerosols. Atmos. Environ. 2004, 38, 6029–6041. [Google Scholar] [CrossRef]
  38. Toom-Sauntry, D.; Barrie, L.A. Chemical composition of snowfall in the high Arctic: 1990–1994. Atmos. Environ. 2002, 36, 2683–2693. [Google Scholar] [CrossRef]
  39. Fibiger, D.L.; Dibb, J.E.; Chen, D.; Thomas, J.L.; Burkhart, J.F.; Huey, L.G.; Hastings, M.G. Analysis of nitrate in the snow and atmosphere at Summit, Greenland: Chemistry and transport. J. Geophys. Res. Atmos. 2016, 121, 5010–5030. [Google Scholar] [CrossRef]
  40. Legrand, M.R.; Delmas, R.J. Relative contributions of tropospheric and stratospheric sources to nitrate in Antarctic snow. Tellus B Chem. Phys. Meteorol. 1986, 388, 236249. [Google Scholar] [CrossRef]
  41. Møller, A.K.; Barkay, T.; Al-Soud, W.A.; Sørensen, S.J.; Skov, H.; Kroer, N. Diversity and characterization of mercury-resistant bacteria in snow, freshwater and sea-ice brine from the High Arctic. FEMS Microbiol. Ecol. 2011, 75, 390–401. [Google Scholar] [CrossRef] [PubMed] [Green Version]
  42. Stein, A.F.; Draxler, R.R.; Rolph, G.D.; Stunder, B.J.B.; Cohen, M.D.; Ngan, F. Noaa’s hysplit atmospheric transport and dispersion modeling system. Bull. Am. Meteorol. Soc. 2015, 96, 2059–2077. [Google Scholar] [CrossRef]
  43. Lai, S.C.; Zou, S.C.; Cao, J.J.; Lee, S.C.; Ho, K.F. Characterizing ionic species in PM2.5 and PM10 in four Pearl River Delta cities, South China. J. Environ. Sci. 2007, 19, 939–947. [Google Scholar] [CrossRef]
  44. Glavas, S.D.; Nikolakis, P.; Ambatzoglou, D.; Mihalopoulos, N. Factors affecting the seasonal variation of mass and ionic composition of PM2.5 at a central Mediterranean coastal site. Atmos. Environ. 2008, 42, 5365–5373. [Google Scholar] [CrossRef]
  45. Tyagi, P.; Kawamura, K.; Bikkina, S.; Mochizuki, T.; Aoki, K. Hydroxy fatty acids in snow pit samples from Mount Tateyama in central Japan: Implications for atmospheric transport of microorganisms and plant waxes associated with Asian dust. J. Geophys. Res. Atmos. 2016, 121, 13641–13660. [Google Scholar] [CrossRef]
  46. Tao, J.; Zhang, L.; Zhang, R.; Wu, Y.; Zhang, Z.; Zhang, X.; Tang, Y.; Cao, J.; Zhang, Y. Uncertainty assessment of source attribution of PM2.5 and its water-soluble organic carbon content using different biomass burning tracers in positive matrix factorization analysis—A case study in Beijing, China. Sci. Total Environ. 2016, 543, 326–335. [Google Scholar] [CrossRef]
  47. Wang, B.; Li, Y.; Xie, Z.; Du, S.; Zeng, X.; Hou, J.; Ma, T. Characteristics of microbial activity in atmospheric aerosols and its relationship to chemical composition of PM2.5 in Xi’an, China. J. Aerosol Sci. 2020, 146, 105572. [Google Scholar] [CrossRef]
  48. Du, P.; Du, R.; Ren, W.; Lu, Z.; Zhang, Y.; Fu, P. Variations of bacteria and fungi in PM2.5 in Beijing, China. Atmos. Environ. 2018, 172, 55–64. [Google Scholar] [CrossRef]
  49. Rousk, K.; Jones, D.L.; DeLuca, T.H. Moss-cyanobacteria associations as biogenic sources of nitrogen in boreal forest ecosystems. Front. Microbiol. 2013, 4, 150. [Google Scholar] [CrossRef]
  50. Murillo, A.A.; Ramírez-Flandes, S.; DeLong, E.F.; Ulloa, O. Enhanced metabolic versatility of planktonic sulfur-oxidizing γ-proteobacteria in an oxygen-deficient coastal ecosystem. Front. Mar. Sci. 2014, 1, 18. [Google Scholar] [CrossRef]
  51. Harding, T.; Jungblut, A.D.; Lovejoy, C.; Vincent, W.F. Microbes in High Arctic Snow and Implications for the Cold Biosphere. Appl. Environ. Microbiol. 2011, 77, 3234–3243. [Google Scholar] [CrossRef] [PubMed] [Green Version]
  52. Giovannoni, S.J.; Stingl, U. Molecular diversity and ecology of microbial plankton. Nature 2005, 437, 343–348. [Google Scholar] [CrossRef] [PubMed]
  53. Michaud, L.; Giudice, A.L.; Mysara, M.; Monsieurs, P.; Raffa, C.; Leys, N.; Amalfitano, S.; Van Houdt, R. Snow Surface Microbiome on the High Antarctic Plateau (DOME C). PLoS ONE 2014, 9, e104505. [Google Scholar] [CrossRef] [PubMed]
  54. Aller, J.Y.; Kuznetsova, M.R.; Jahns, C.J.; Kemp, P.F. The sea surface microlayer as a source of viral and bacterial enrichment in marine aerosols. J. Aerosol Sci. 2005, 36, 801–812. [Google Scholar] [CrossRef]
  55. Mochizuki, T.; Kawamura, K.; Aoki, K. Water-Soluble Organic Nitrogen in High Mountain Snow Samples from Central Japan. Aerosol Air Qual. Res. 2016, 16, 632–639. [Google Scholar] [CrossRef] [Green Version]
Figure 1. The average relative abundance of the major bacterial phyla in the fresh snowfall samples.
Atmosphere 13 01590 g001
Figure 2. Comparison of the diversity indices of 16S from early season fresh snowfall samples DJS-1, DJS-2, and DJS-3 with the late season samples DJS-4 and DJS-5. (a) shows the Simpson diversity index during early season and late season snowfall while (b) shows the Shannon diversity index during early season and late season snowfall.
Atmosphere 13 01590 g002
Figure 3. The average relative abundance of the major fungal phyla in the fresh snowfall samples.
Atmosphere 13 01590 g003
Figure 4. Comparison of diversity indices of ITS in the early season fresh snowfall samples DJS-1, DJS-2, and DJS-3 with the late season samples DJS-4 and DJS-5. (a) shows the Shannon diversity index during early season and late season snowfall while (b) shows the Simpson diversity index during early season and late season snowfall.
Atmosphere 13 01590 g004
Figure 5. Mean concentrations of the chemical components and proportions of bacterial and fungal phyla in the fresh snowfall samples collected from Daejeon, the Republic of Korea. The red bars in the graph show the concentration of ions, while the purple and orange bars show the relative abundance of the bacterial and fungal phyla, respectively.
Atmosphere 13 01590 g005
Figure 6. Temporal variation in the chemical composition (µg m−3), bacterial phyla, and fungal phyla in the fresh snowfall samples of Daejeon, the Republic of Korea.
Atmosphere 13 01590 g006
Figure 7. Five-day backward trajectories arriving during snowfall sample collection days at Daejeon, the Republic of Korea. The color lines indicate the arrival heights of the air mass trajectories: red, 200 m; blue, 500 m; and green, 600 m. (ad) DJS-1 through DJS-5 are the snow sample IDs shown in Table 1. The color lines represent the different heights of the air mass backward trajectories: red, 200 m; blue, 500 m; and green, 1000 m.
Atmosphere 13 01590 g007
Table 1. Fresh snowfall samples collection day and time. The samples were collected during the snow season at the beginning of 2021 at Daejeon, South Korea.
Starting DateEnd DateTime (Start)Time (End)Sample Code
1 January 20212 January 20216:00 p.m.9:00 a.m.DJS-1
1 January 20212 January 20216:00 p.m.9:00 a.m.DJS-2
6 January 20217 January 20216:00 p.m.9:00 a.m.DJS-3
18 January 202118 January 20219:00 a.m.12:00 p.m.DJS-4
28 January 202128 January 202111:30 a.m.3:30 a.m.DJS-5 *
* Remarks: Sample DJS-5 was collected during a speedy wind and dusty atmosphere.
Table 2. Primer information. Bolded primer sequences before the hyphen are the Illumina overhang adapter sequences. Primer sequences after the hyphen correspond to the locus-specific sequences.
NameSequence
16S Forward(5′ TCGTCGGCAGCGTCAGATGTGTATAAGAGACAG-CCTACGGGNGGCWGCAG 3′)
16S Reverse(5′ GTCTCGTGGGCTCGGAGATGTGTATAAGAGACAG-GACTACHVGGGTATCTAATCC 3’)
ITS forward(5′ AATGATACGGCGACCACCGAGATCTACAC-GCATCGATGAAGAACGCAGC 3′)
ITS Reverse(5′ CAAGCAGAAGACGGCATACGAGAT-TCCGCTTATTGATATGC 3′)
Table 3. Principal component analysis (PCA) with orthogonal rotation (Varimax) with Kaiser normalization of the components of the snowfall samples collected at Daejeon, South Korea.
Snowfall ComponentsFactor-1Factor-2Factor-3Factor-4
SO42−0.850.400.010.34
NO3−0.23−0.75−0.50−0.36
NH4+0.980.170.100.00
Na+0.410.910.10−0.06
Cl0.310.940.04−0.12
Mg2+0.370.920.060.05
Ca2+0.920.300.120.21
K+0.760.650.090.06
WSOC0.980.170.090.03
WSTN0.93−0.18−0.300.10
Acidobacteria−0.650.720.220.02
Actinobacteria0.800.430.030.41
Bacteroidetes−0.14-0.34−0.160.91
Cyanobacteria0.730.660.200.02
Firmicutes−0.41-0.23−0.03−0.88
Gemmatimonadetes0.950.280.05−0.10
Planctomycetes−0.30−0.320.82−0.37
Proteobacteria0.460.720.270.44
Ascomycota0.060.530.840.10
Basidiomycota−0.15−0.53−0.83−0.09
Eukarya_uc−0.05−0.30−0.73−0.62
Fungi_p0.940.310.16−0.01
Mucoromycota0.120.300.940.11
Publisher’s Note: MDPI stays neutral with regard to jurisdictional claims in published maps and institutional affiliations.