Article

Effect of Densification on Biomass Combustion and Particulate Matter Emission Characteristics

1
School of Energy and Power Engineering, Zhengzhou University of Light Industry, Zhengzhou 450002, China
2
School of Materials and Chemical Engineering, Zhengzhou University of Light Industry, Zhengzhou 450002, China
3
Department of Chemical Engineering, Mid Sweden University, 85170 Sundsvall, Sweden
4
State Key Laboratory of Coal Combustion, Huazhong University of Science and Technology, Wuhan 430074, China
*
Authors to whom correspondence should be addressed.
Atmosphere 2022, 13(10), 1582; https://doi.org/10.3390/atmos13101582
Submission received: 31 August 2022 / Revised: 21 September 2022 / Accepted: 24 September 2022 / Published: 28 September 2022
(This article belongs to the Special Issue Emissions, Control, and Utilization Technology of Particulate Matters)

Abstract

:
The effect of biomass densification on combustion characteristics and particulate matter (PM) emission was studied in this work by means of thermogravimetric, combustion kinetic, and PM analyses with respect to the size distribution and elementary composition. Cornstalk as a typical agricultural biomass residue and camphorwood as a woody biomass were used in the experiment for comparison. It can be concluded that the biomass densification increases the ignition, burnout, and composite combustion indexes, leading to a better performance of biomass combustion. The main reaction mechanism of cornstalk pellets can be well-expressed with the chemical reaction series model, whereas the diffusion mechanism and chemical reaction series models can be applied to the combustion of camphorwood pellets. The biomass densification has little effect on the composition of PM but significantly changes the yield of PM. The influence of biomass densification on PM emission is related to the biomass properties. The densification significantly reduces the PM emission for cornstalk but significantly increases the yield of particles of aerodynamic cutoff diameters less than 1μm (PM1) for camphorwood.

1. Introduction

In recent years, a strong development of renewable energy such as solar and wind powers has been taking place in many countries in order to overcome the energy shortage crisis and climate change. On the other hand, a huge amount of forest and agricultural biomass residues are available worldwide, which have not been well-utilized as a renewable energy. The total biomass residue resources in 2050 will reach 100–600 EJ and present a great potential to replace fossil fuels according to the estimate of the International Energy Agency [1]. However, the disadvantages of low mass and energy density increase the cost of biomass utilization and limit the development of biomass energy. Therefore, appropriate pretreatment methods are needed to overcome the drawback of biomass energy resources.
Densification can improve the quality of biomass, including density, hardness, water resistance, impact resistance, durability, and heating value. The biomass pellet from densification can be used in a variety of combustion devices such as residential stoves, power plant boilers, and industrial boilers for heat and electricity production. Inevitably, densification also increases the use cost of biomass. The cost of biomass pellets varies between countries and regions. For instance, Králík et al. [2] found that the cost of biomass pellets in the Czech Republic ranged from 7.85–8.55 EUR/GJ, which is higher than that of Czech brown coal (6.5–7.3 EUR/GJ), so that the development of the densification industry requires certain subsidies. However, in China, Zhou et al. [3] found that the price of biomass pellets was related to many factors, including the type of raw biomass, collection distance, transportation, packaging, regions, and coal price. Overall, the price is generally 400–850 CNY/ton. Compared with coal, it already has a price advantage. Furthermore, biomass pellets also have the advantages of causing low pollution and being renewable, so the development prospect is broad.
After the raw biomass densification, the internal structure of the biomass in the form of pellets has been changed, which then affects the biomass combustion characteristics. Mian et al. [4] analyzed the effect of densification on combustion characteristics through TGA and the distributed activation energy model and showed that densification reduced the activation energy of biomass volatilization but increased the activation energy of char combustion. Horvat et al. [5] reported a combustion experiment on wood and agricultural biomass and their pellets in domestic hot water boilers and found that the CO emission was reduced, and, thus, the combustion efficiency was improved from the pellet combustion. The above studies have identified some influences of densification on biomass combustion. However, the effect of densification on pollutant emission during combustion has not been reported in the literature.
Particulate matter (PM) emission from biomass combustion is an important factor limiting biomass utilization. Gao et al. [6] studied the PM emission from mallee wood combustion and found that the PM was composed of PM1 and PM1–10, and the main components were alkali metal compounds and alkaline earth metal compounds. Our previous research focused on the PM emission characteristics of agricultural biomass combustion and found that Si was also an important source of PM in addition to alkali metals and alkaline earth metals [7]. Wang et al. [8] studied the combustion of wood pellets in 25 kw boilers and found that the PM was mainly composed of PM1 with two distinctive modes. Our previous work investigated the effect of additives on PM emission during biomass pellet combustion and found that the reduction of PM could be achieved by adding diatomite [9]. Cheng et al. [10] modified kaolin with phosphoric acid to achieve low-level emission of PM0.2 during cornstalk pellet combustion, with the maximum emission reduction of 64.5%. Although many studies on the PM emission characteristics of biomass or biomass pellet combustion have been reported, the careful comparative test on the biomass and its pellet as well as the relevant comprehensive analysis of the two fuel feedstocks have not been reported.
Densification can affect the release of volatiles from biomass and the combustion of char, which will eventually affect the formation of PM. However, current studies, so far, have mainly focused on the effects of biomass types, combustion conditions, and other factors on PM emission. Little attention has been given to the mechanism of densification that changes the biomass combustion behavior, especially the PM generation. Thus, in this study, raw biomass and the pellets densified from the raw biomass were carefully prepared as fuels for a comparative combustion test under the same experimental conditions to clarify the influence of densification on the combustion characteristics and PM emission behaviors.

2. Materials and Methods

2.1. Biomass Fuel Property and Ash Composition

The biomass fuels used in this study were cornstalk and camphorwood, which were obtained from Wuhan, China. Before the experiment, all fuels were crushed and sieved to obtain samples with a particle size of less than 200 microns. The samples were then dried in an oven at 55 °C for at least 4 h and dedicatedly stored for the following experimental test. The bulk densities of cornstalk and camphorwood are 127.43 and 286.94 kg/m3, respectively. The results of proximate, ultimate analysis and the calorific value of the samples are given in Table 1. It can be seen from the table that the ash and fixed carbon contents of cornstalk are significantly higher than those of camphorwood, but with a low volatile matter content, whereas the carbon and hydrogen contents of camphorwood are higher than those of cornstalk, which leads to a higher calorific value of camphorwood of 17.56 MJ/kg compared with cornstalk of 13.49 MJ/kg. The S and Cl contents of cornstalk are significantly higher than those of camphorwood.
For the ash evaluation, the biomass samples were evenly spread into crucibles and placed in a muffle furnace at 823 K to burn for at least four hours. Subsequently, at least 1 g of ash was collected and analyzed for chemical components by X-ray fluorescence spectroscopy (XRF, JascoFP-6500, JASCO Inc., Tokyo, Japan) according to ASTM E1755-01 (Standard Test Method for Ash in Biomass, Philadelphia, The United States). The results are shown in Table 1. The contents of silicon, chlorine, and potassium in the cornstalk ash are significantly higher than those in the camphorwood ash. In contrast, the camphorwood ash is mainly composed of calcium oxide and magnesium oxide. In addition, the Si/(Mg + Ca) and (Si + P + K)/(Mg + Ca) molar ratios of cornstalk are greater than those of camphorwood.

2.2. Densification Process

The biomass samples were densified into biomass pellets by a universal material testing machine (CMT5205, MTS) including a temperature test chamber, molds, and data collection system. A more detailed introduction can be found in the previous literature [11]. Before densification, the biomass was dried in an oven at 105 °C for four hours. The dried biomass was then evenly mixed with 15 wt% deionized water. Then a 0.1 g sample was evenly placed into the mold and densified using the universal material testing machine. During the densification process, the piston stem moved at a rate of 10 mm/min, then stopped when the pressure reached 120 MPa, and was maintained for 3 min. Finally, demolding was carried out and biomass pellets were obtained. The biomass pellets are 6 mm in diameter and 3 mm in height. The densities of cornstalk and camphorwood pellets are 1349.75 and 1256.28 kg/m3, respectively.

2.3. Thermogravimetric Analysis (TG−DTG)

Thermogravimetric analysis (TGA) was carried out by means of a TGA apparatus (STA449F3, NETZSCH, Hanau, Germany). In the experiment, the combustion atmosphere was set as a mixture of 20%O2 and 80%N2 with the total gas flow of 100 mL/min. The reaction temperature was raised from room temperature to 900 °C at a rate of 10 °C/min. The biomass dosage was 5 mg. Meanwhile, the biomass pellet was cut into 2 mm cubes and then fed into TGA. The calculation method of the ignition temperature (Ti) and burnout temperature (Tb) was described in the previous literature [12]. The ignition index (Di) and burnout index (Db) are defined as follows [13]:
D i = D T G max t i × t p
D b = D T G max Δ t 1 / 2 × t i × t p
where DTGmax is the maximum weight loss rate, and tp is the time corresponding to the maximum burning rate. Δt1/2 is the corresponding time period when DTG/DTGmax = 1/2, with ti and tb the ignition and burnout times, respectively.
S is defined as the comprehensive combustion index, with the corresponding formula given as follows [12,14]:
S = D T G max × D T G m e a n T i × T i × T b
where DTGmean is the average weight loss rate.

2.4. Kinetic Analysis

In this paper, non-isothermal method was used to analyze the kinetic reaction process during biomass and biomass pellets combustion. According to the Arrhenius equation, the dynamic parameters were derived by the integral method proposed by Coats and Redfern [15]. The equation can be expressed as follows:
ln [ g ( α ) g ( α ) T 2 ] = ln [ A R β E ( 1 2 R T E ) ] E R T
where α is the mass conversion ratio equal to zero at the reaction start and 1 at complete conversion, g(α) is the reaction integral equation of the reaction, T is the thermodynamic temperature, A is the pre-exponential factor, R is the gas constant, β is the heating rate, and E is the activation energy.
The detailed derivation process can be found in the previous literature [16]. The physical models used in the analysis are shown in Table 2. The reaction kinetic model of combustion in different temperature segments may not be the same; therefore, piecewise fitting analysis is carried out according to the temperature. According to different expressions, the activation energy and pre-exponential factor under different reaction models can be calculated. Then the best reaction model is selected through the comparison of correlation coefficients, and the corresponding activation energy and pre-exponential factor are determined. When the correlation coefficients of several reaction models are relatively close, further analysis should be carried out by using the Malek method [13]. The conversion ratio ( α i ) at different combustion stages is substituted into Equation (5) below, and the relationship curve of y ( α ) α is regarded as the standard curve [17].
y ( α ) = f ( α ) g ( α ) f ( 0.5 ) g ( 0.5 )
where y ( α ) is the definition function; f ( α ) and g ( α ) are the differential and integrals form of the mechanism function, respectively; and f ( 0.5 ) and g ( 0.5 ) are the values of f ( α ) and g ( α ) when the conversion ratio is 0.5, respectively. The experimental values of α i , T i , and [ d α d t ] i are substituted into Equation (6), and the obtained relationship curve is the experimental curve.
y ( α ) = ( T i T 0.5 ) 2 [ d α / d t ] [ d α / d t ] 0.5
where T i and [ d α / d t ] are the corresponding reaction temperature and reaction rate when the conversion ratio is α i , respectively, and T 0.5 and [ d α / d t ] 0.5 are the reaction temperature and reaction rate when the conversion ratio is 0.5, respectively. The most probable mechanism function is determined by calculating the average square difference between the experimental and standard data. The mechanism function corresponding to the standard curve with the smallest average square difference is the most probable mechanism function.
The average square difference is calculated as follows:
η = ( y t y r ) 2 n
where y t is the y ( α ) value corresponding to the standard curve, y r is the value corresponding to the experimental curve, and n is the number of data points on the curve.

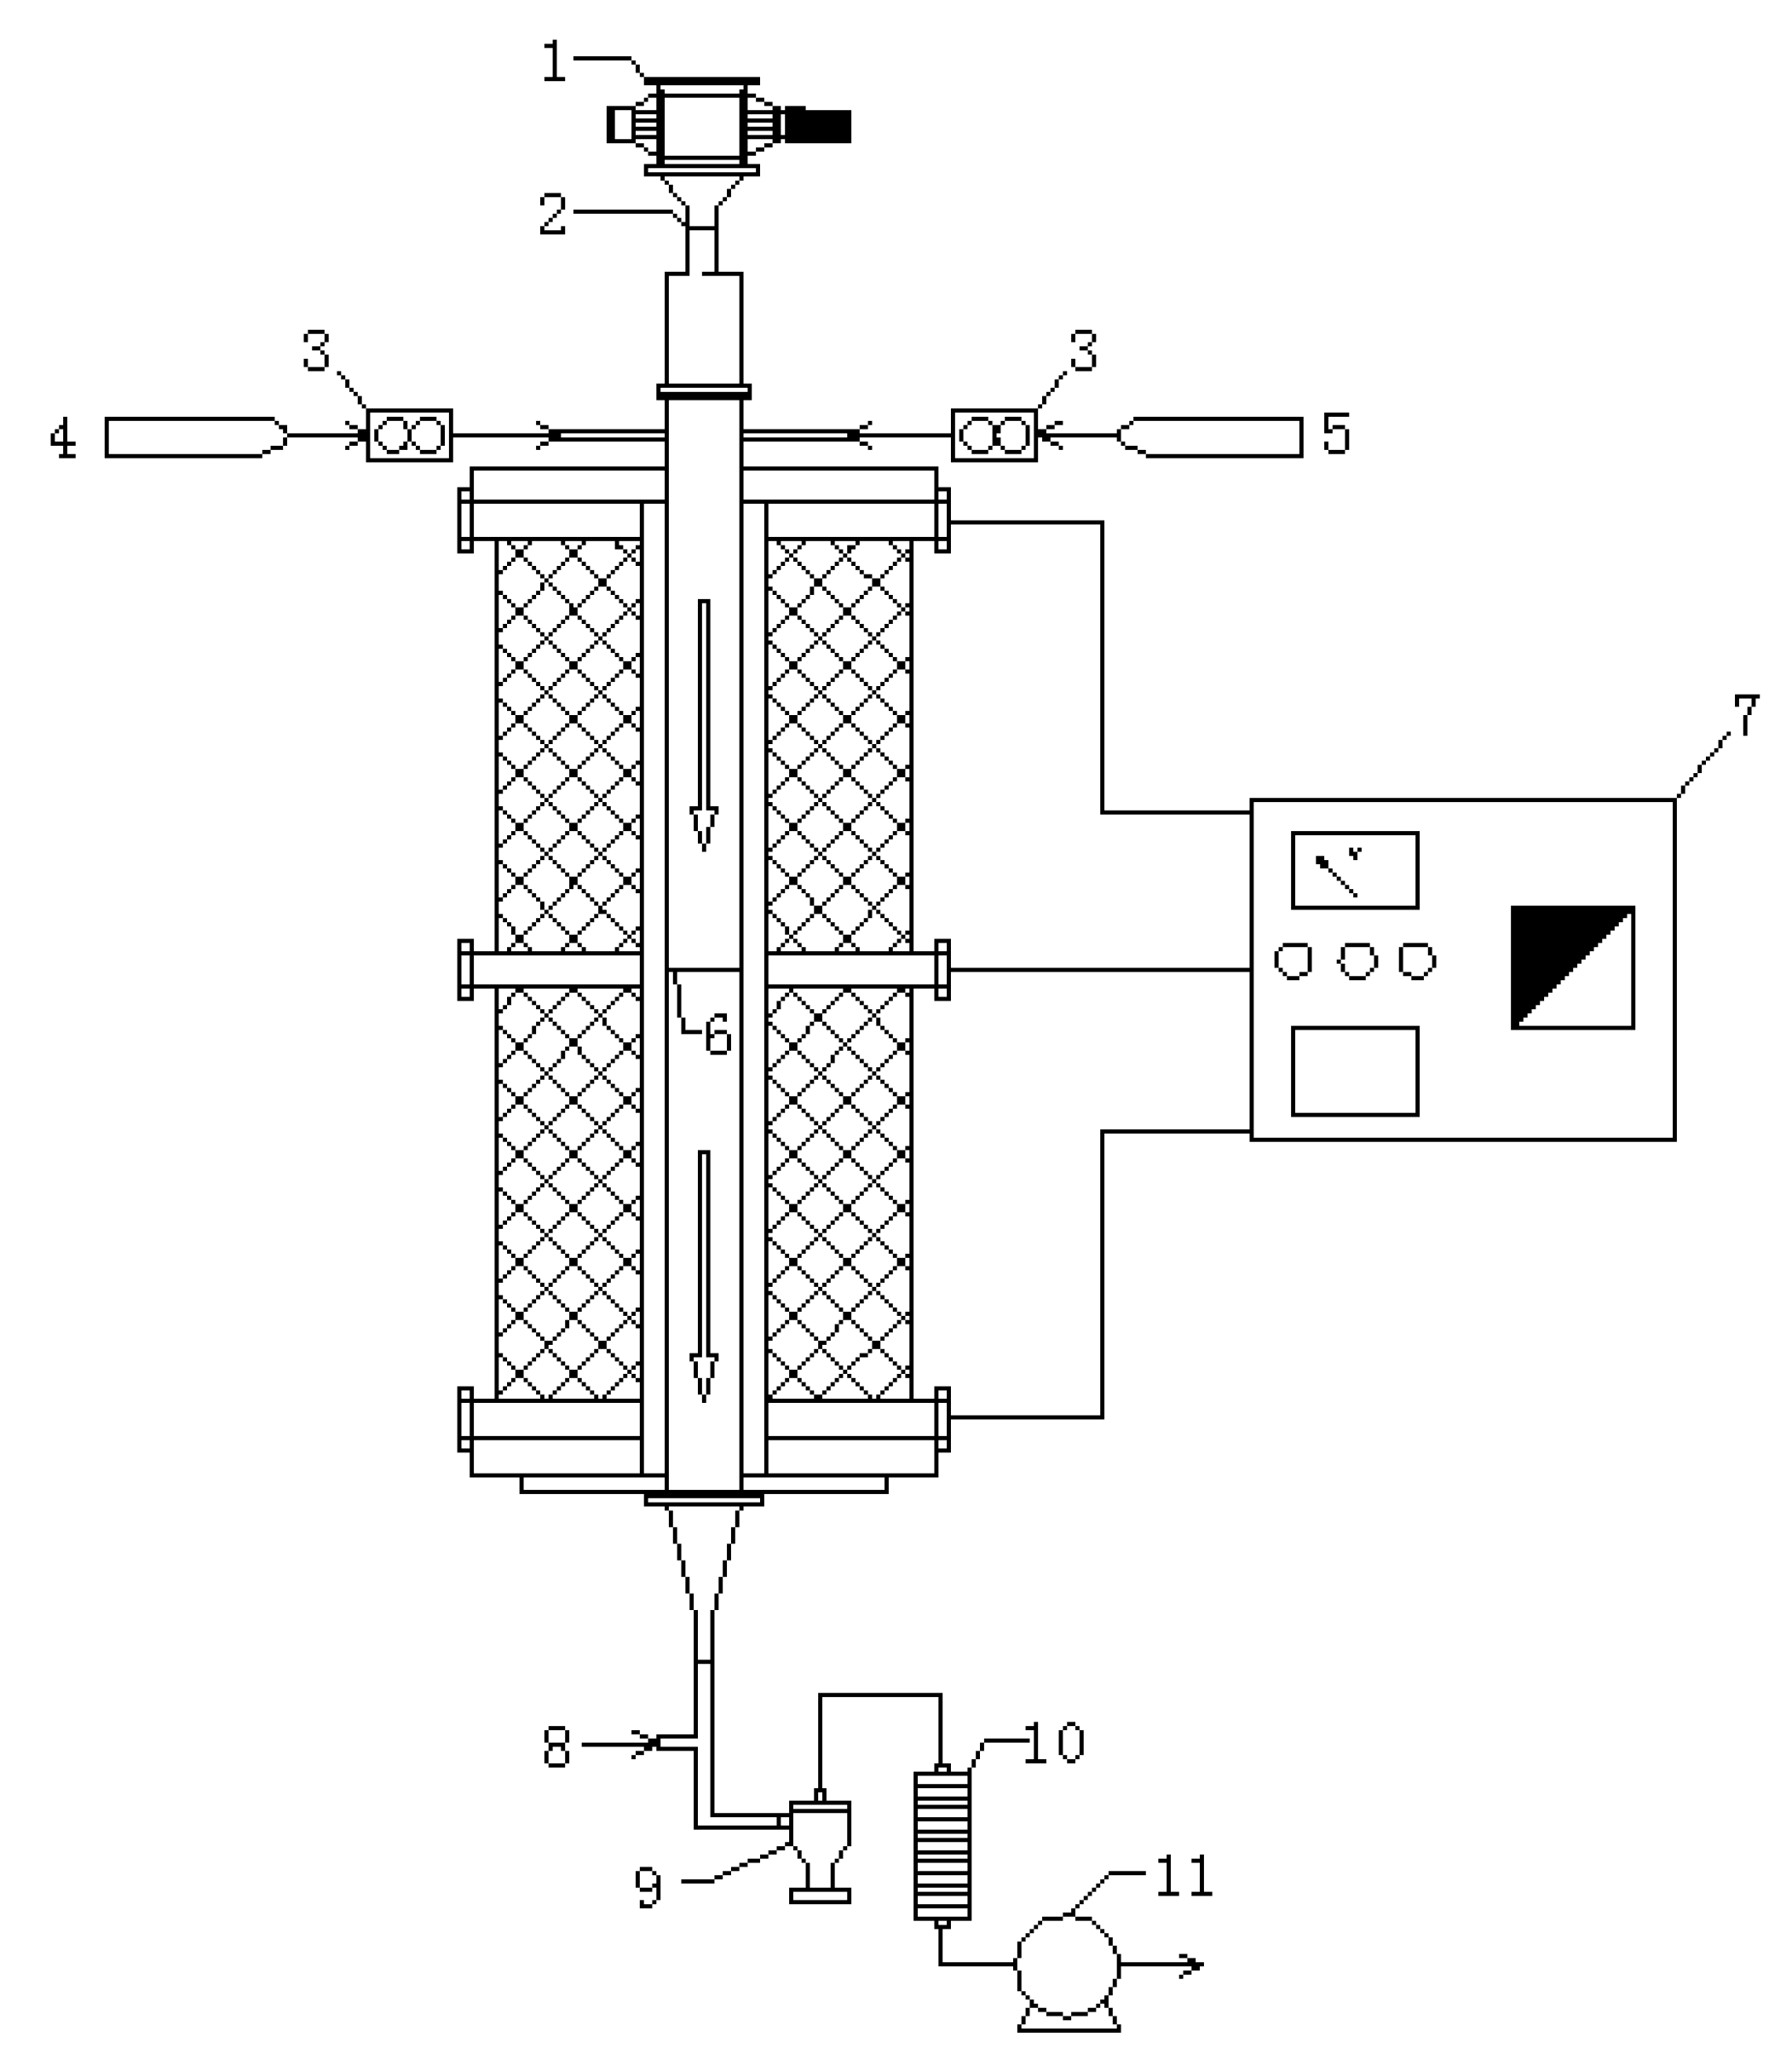
2.5. Collection and Analysis of Particulate Matter

The schematic diagram of the experimental device can be seen in Figure 1. The whole experimental device is mainly composed of the feeding system, gas distributor, temperature control system, fixed-bed reactor, water cooling device, cyclone, Dekati low-pressure impactor (DLPI), and vacuum pump. The height of the reactor is 1600 mm, and the inner diameter is 55 mm. Detailed descriptions of the reactor have been given in the previous literature [10,18]. During the experiment, the combustion temperature was set at 1123 K. N2 (80%) and O2 (20%) were mixed as primary air with 2.5 L/min. The feeder is placed at the top of the reactor, and the biomass or biomass pellet was fed into the reactor through a feeder at a rate of 0.1 g/min. Then the samples descended with the primary air and burned until they fell on a steel multihole distributor that was placed in the middle of the reactor to ensure complete combustion. The high-temperature flue gas at the outlet of the reactor was mixed with the cooling air (7.5 L/min) and then entered the cyclone. The combustion fly ash was separated into coarse particles larger than 10 microns (PM10+) and fine particles smaller than 10 microns (PM10) using a cyclone. PM10 was further divided into 13 particle size categories using a low-pressure impactor (DLPI, Dekati, Kangasala, Finland), and the particle size distribution was obtained. The elemental composition in PM10 was analyzed by an energy spectrum (ESEM−EDS, Quanta 200, FEI, Eindhoven, The Netherlands).

3. Results and Discussion

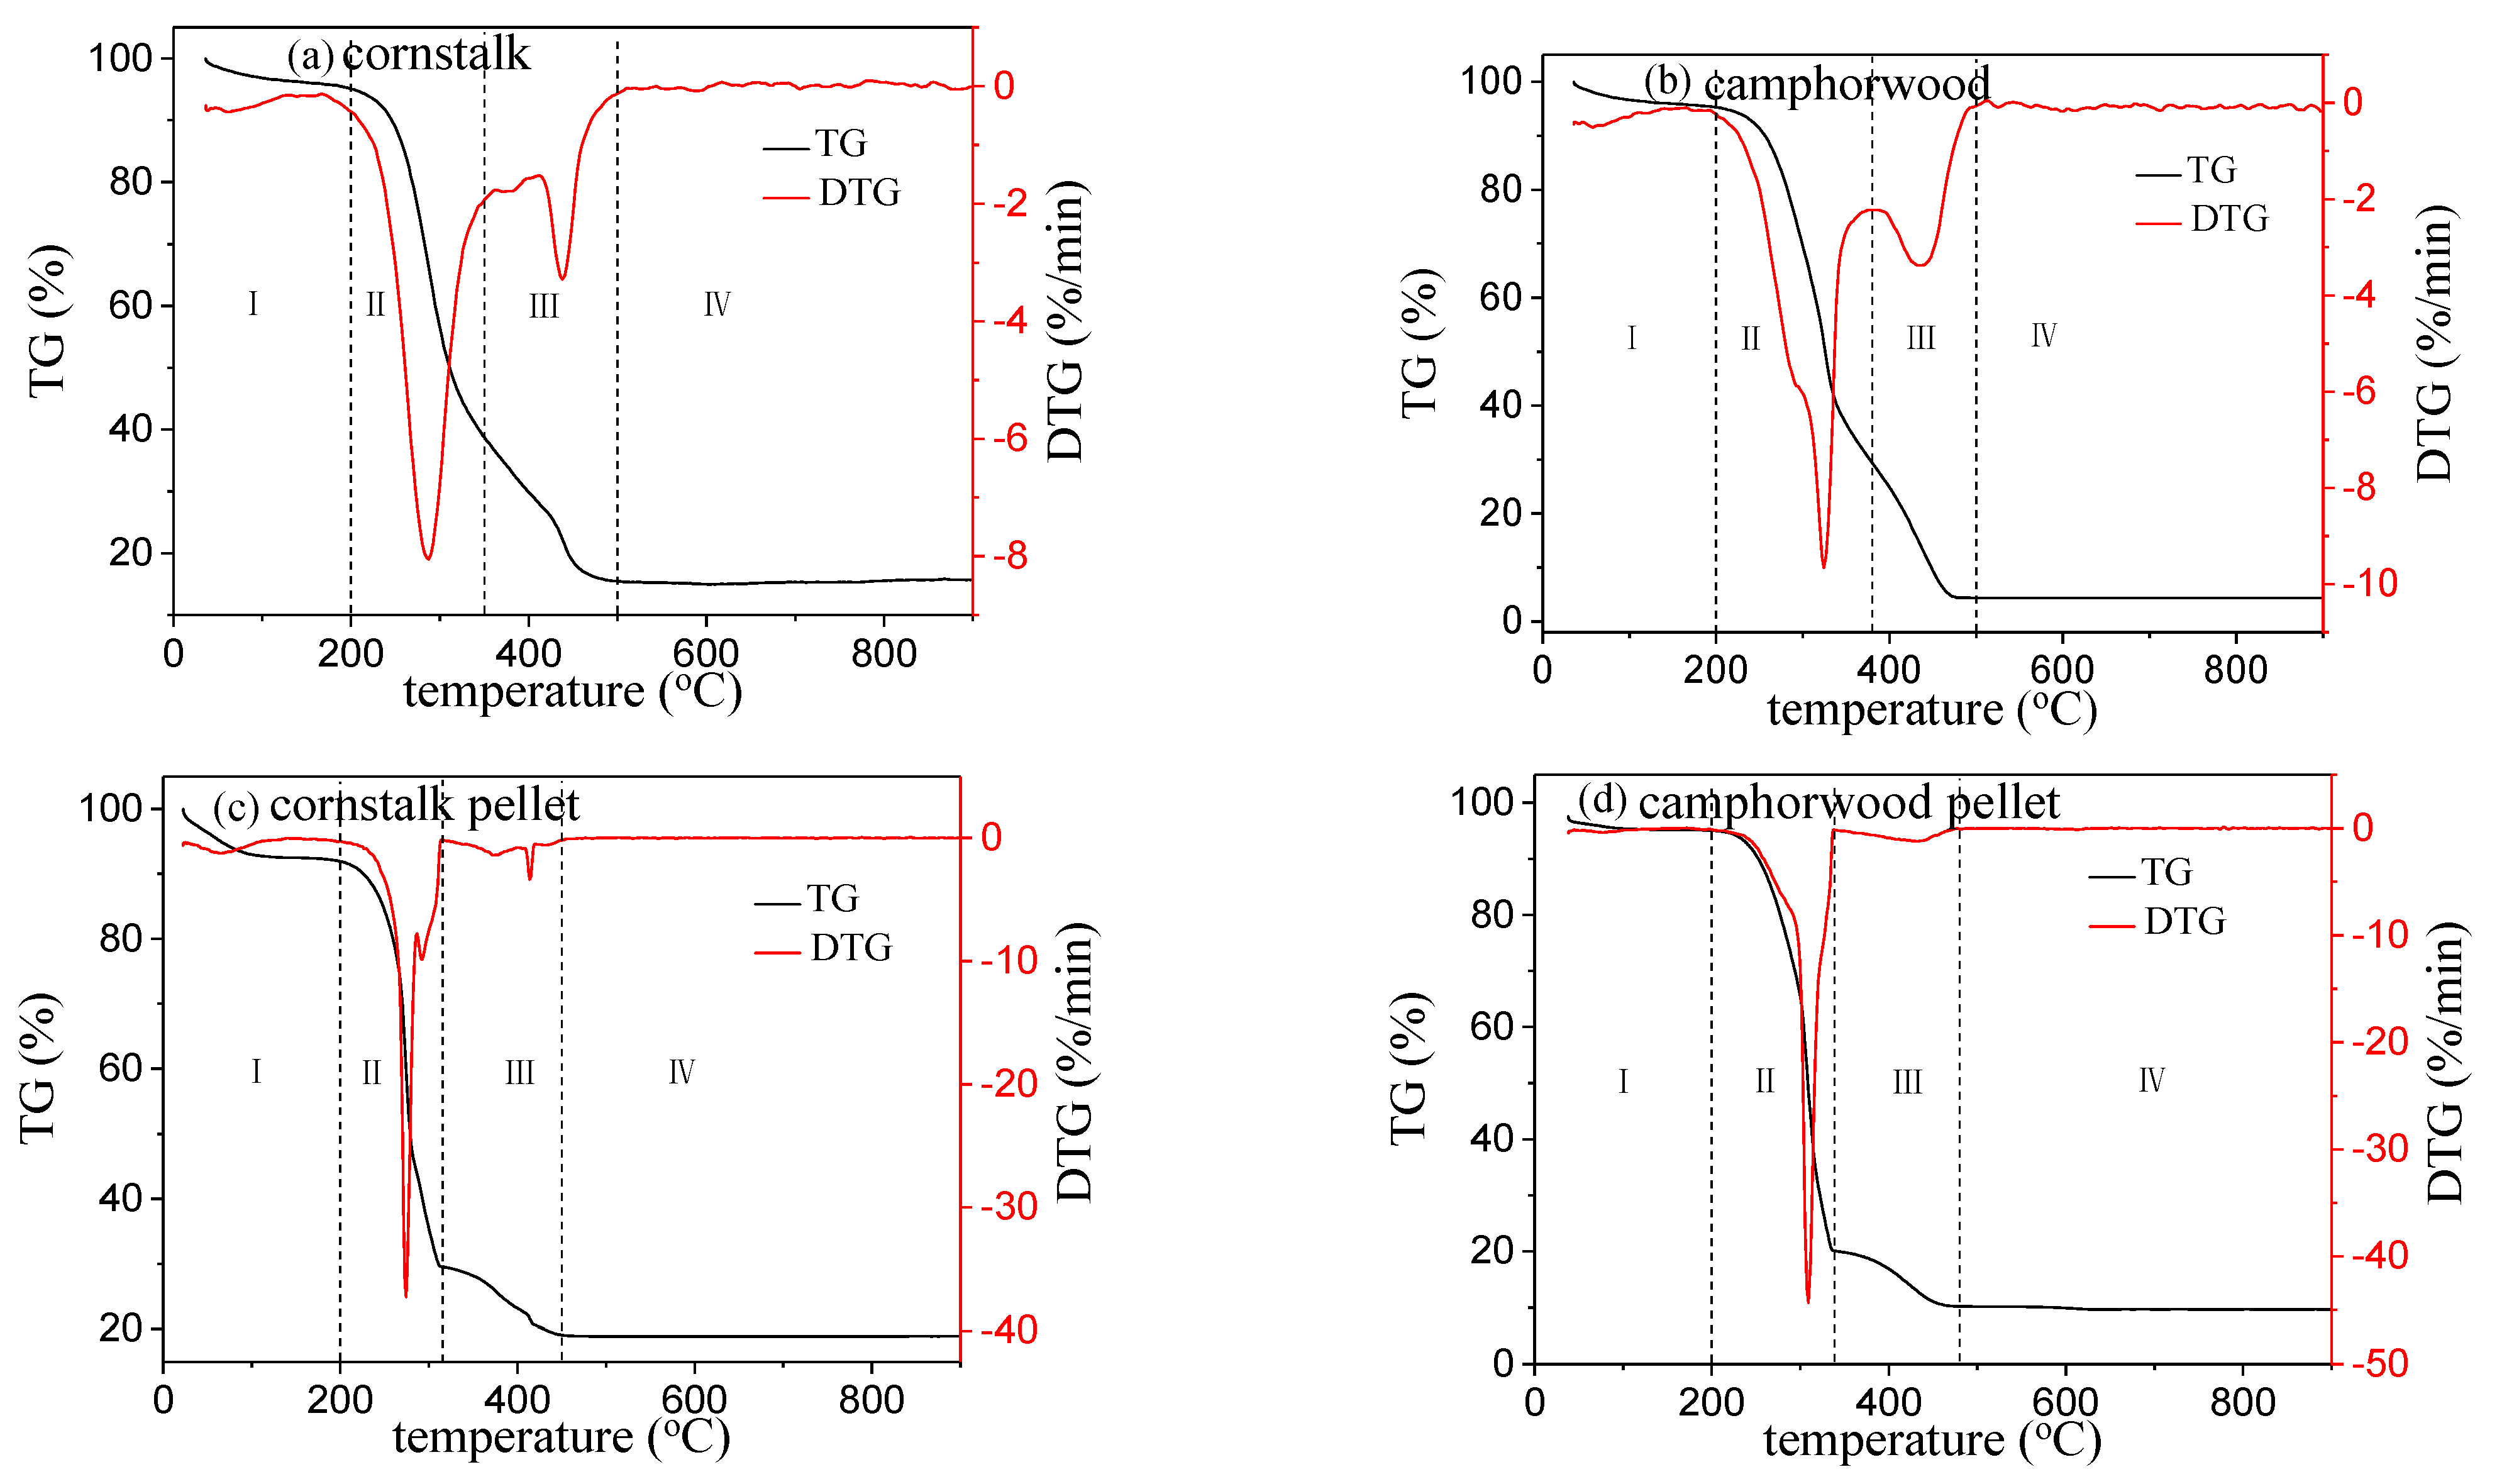
3.1. Thermogravimetric Analysis and Combustion Behavior

The TG−DTG curves of cornstalk and camphorwood are presented in Figure 2. The whole weight loss curves can be divided into four stages, corresponding to water evaporation (stage I), release and combustion of volatile matter (stage II), char combustion (stage III), and fuel burnout (stage IV). The weight loss in the first stage below 200 °C is mainly caused by the water evaporation, whereas the weight loss in the second and third stages was caused by the biomass volatilization and combustion. The second stage appears at around 200–380 °C, which is dominated by the biomass volatilization. The third stage corresponds to 380–500 °C, and the weight loss is mainly caused by the char combustion. Gao et al. studied the pyrolysis of tobacco wastes and found that there were still some volatiles that continued to release and burn during char combustion. With the completion of pyrolysis and the combustion of hemicellulose and cellulose, lignin gradually becomes the main object of the reaction [19]. When the temperature is raised over 500 °C, it is considered that the combustion enters the fourth stage, i.e., the burnout stage. At this stage, the weight loss curve levels off, but there is still a small amount of unburned carbon that continues to burn. This is due to the fact that lignin is mainly composed of many aromatic rings with branched chains, and the chemical bonds are broken in a wide temperature range, so it is difficult for lignin to form a relatively concentrated and obvious weight loss peak during combustion [20].
Comparing the TG−DTG curves of cornstalk and cornstalk pellets in Figure 2a,c, it can be seen that the biomass densification significantly changes the combustion behavior. The residual material is increased from 14.94% for cornstalk to 18.96% for the cornstalk pellets. The weight loss peak of the second stage becomes much obvious, and the combustion occurs at around 300 °C. However, the weight loss peak of the third stage is significantly weakened. From Table 3, it can be seen that, after densification, the ignition temperature increases from 250 °C to 260 °C. Meanwhile, the burnout temperature decreases from 459 °C to 420 °C. The reason behind the changes in the pellet combustion behavior is because the biomass densification slows down the release of volatiles, thereby reducing the contact between volatiles and oxygen, resulting in a delayed ignition of volatiles. The densification leads to an increase in DTGmax from 8.0525%/min to 37.2953%/min as can be seen in Table 3, indicating that the combustion becomes more concentrated in time and intensive for the pellets. Another evidence is that Tmax decreases from 287 to 274 °C, which may be related to the overlap combustion of volatile matter and char, which increases the weight loss rate of the second stage. The weight loss peak in the second stage should contain the combustion of volatiles and part of the char. In the second stage of the cornstalk DTG curve, a small peak appears following the big peak, indicating that a part of the char is burned out in advance. Thus, the peak due to the combustion of the remaining char is smaller as seen in Figure 2c compared with cornstalk in Figure 2a. As summarized in Table 3, densification significantly increases the ignition, burnout, and composite combustion indexes from 14.83 × 10³, 12.97 × 10⁴, and 39.13 × 10⁻¹³ to 56.50 × 10³, 443.15 × 10⁴, and 157.35 × 10⁻¹³, respectively.
For camphorwood, as shown in Figure 2b,d as well as Table 3, the densification increases the residual material from 4.37% to 9.58%. The ignition temperature is increased from 273 °C to 286 °C, whereas the burnout temperature is decreased from 654 °C to 445 °C. Similar to cornstalk, the densification leads to an increase in DTGmax from 9.6609%/min to 44.3195%/min with Tmax decreasing from 324 to 309 °C. The similar trend indicates that the densification has the same influence mechanism in the combustion for both cornstalk and camphorwood. Compared with camphorwood, the ignition, burnout, and composite combustion indexes of camphorwood pellets increase from 13.88 × 10³, 8.92 × 10⁴, and 40.17 × 10⁻¹³ to 54.99 × 10³, 440.19 × 10⁴, and 183.10 × 10⁻¹³, respectively, as given in Table 3.
Generally speaking, the densification promotes a concentrated and intensive combustion. After the combustion of volatile matter and part of the char, the combustion of residual char forms the new weight loss peak in the third stage, which is also the reason for the obvious weakening of the weight loss peak in the third stage [21]. As a part of the char burns together with volatiles in advance, the burnout temperature decreases. The densification increases the ignition, burnout, and composite combustion indexes, so that the performance of biomass combustion is improved.

3.2. Combustion Kinetics

For both the raw cornstalk and camphorwood, biomass devolatilization and combustion mainly take place in stages II and III; the kinetic analysis is made with respect to the two stages. For the biomass pellets, however, the weight loss peak of the second stage becomes sharper and is the dominant combustion stage, so that the kinetic analysis is focused on stage II.
Kinetic parameters and corresponding models of biomass combustion are listed in Table 4. For cornstalk, the kinetics were studied at temperature ranges of 200–459 °C. The combustion process of cornstalk can be divided into three stages: stage 1—more devolatilization and less combustion; stage 2—more combustion and less devolatilization; and stage 3—char combustion. The reaction mechanism of cornstalk can be well-expressed by means of the diffusion mechanism model of D3 for stages 1 and 2 and the chemical reaction series model of F1 for stage 3. When the combustion temperature is low, the diffusion of volatile matter is dominant. With the increase in the temperature, the volatile and char begin to burn and the chemical reaction plays a major role. The activation energy decreases from 104.62 to 23.90 kJ/mol and then increases to 48 kJ/mol. The decrease and increase in the activation energy are closely related to the combustion of volatiles and char, respectively, which is consistent with the research results of Guo et al. [22]. Liao et al. studied the combustion of wheat straw and found that the dynamic analysis was also divided into three stages, but the corresponding dynamic models were different, namely chemical reaction series (F3), diffusion mechanism (D4), and chemical reaction series models (F1) [23]. It indicated that the internal reaction mechanism of different straw biomass was different.
Different from cornstalk, the kinetics of cornstalk pellets were studied at temperature ranges of 220–315 °C. The reaction mechanism can be expressed by the diffusion mechanism model of D1 for stage 1 and should be transformed into the chemical reaction series model of F2 and F1 for stages 2 and 3. Compared with cornstalk, the initial temperature of the chemical reaction model reduced, indicating that densification inhibited the release of volatile matter and limited the diffusion model. This may be due to the destruction of the pore structure by the densification. Jia et al. [24] found that the pore structure of biomass was poor, and the semivolatilized tar produced by pyrolysis could also block the pores, further damaging the pore structure. The activation energy first increases from 87.76 to 135.71 kJ/mol then decreases to 49.79 kJ/mol. The increases in the activation energy should be related to the further combustion of char and the combustion of residual char, which is consistent with the results of Section 3.1.
For camphorwood, on the other hand, the dynamic combustion evolution of biomass can be characterized by the one-dimensional diffusion model of D1 for stage 1 and the three-dimensional diffusion model of D3 for stage 2. This indicates that the combustion of camphorwood is mild and dominated by diffusion mechanism. The activation energies of stage 1 (200–380 °C) and stage 2 (380–480 °C) of camphorwood are 96.54 and 16.04 kJ/mol, respectively. Liu et al. [25] studied the combustion of poplar wood chip and found that the activation energy of the volatile and char combustion stages was 110–120 and 110–130 kJ/mol, respectively, which was significantly higher than that of camphorwood. This further indicates that camphorwood is easy to burn, so the combustion stage is mainly controlled by the diffusion mechanism. Similar to camphorwood, the kinetic analysis of camphorwood pellets was also divided into two stages. At 230–335 °C, the kinetic model is transformed from a single diffusion mechanism model of D3 to a diffusion mechanism model of D1 and a chemical reaction series model of F2. The transition of the reaction model indicates that the combustion of camphorwood pellets is enhanced and thus controlled by the chemical reaction. The result is consistent with Section 3.1. In the initial stage of combustion (230–300 °C), the densification reduces the activation energy from 96.54 to 78.62 kJ/mol and promotes the combustion. However, the activation energy at a later stage of combustion (300–335 °C) increases from 16.04 to 132.00 kJ/mol, indicating the complexity of the influence of the densification on the combustion process.

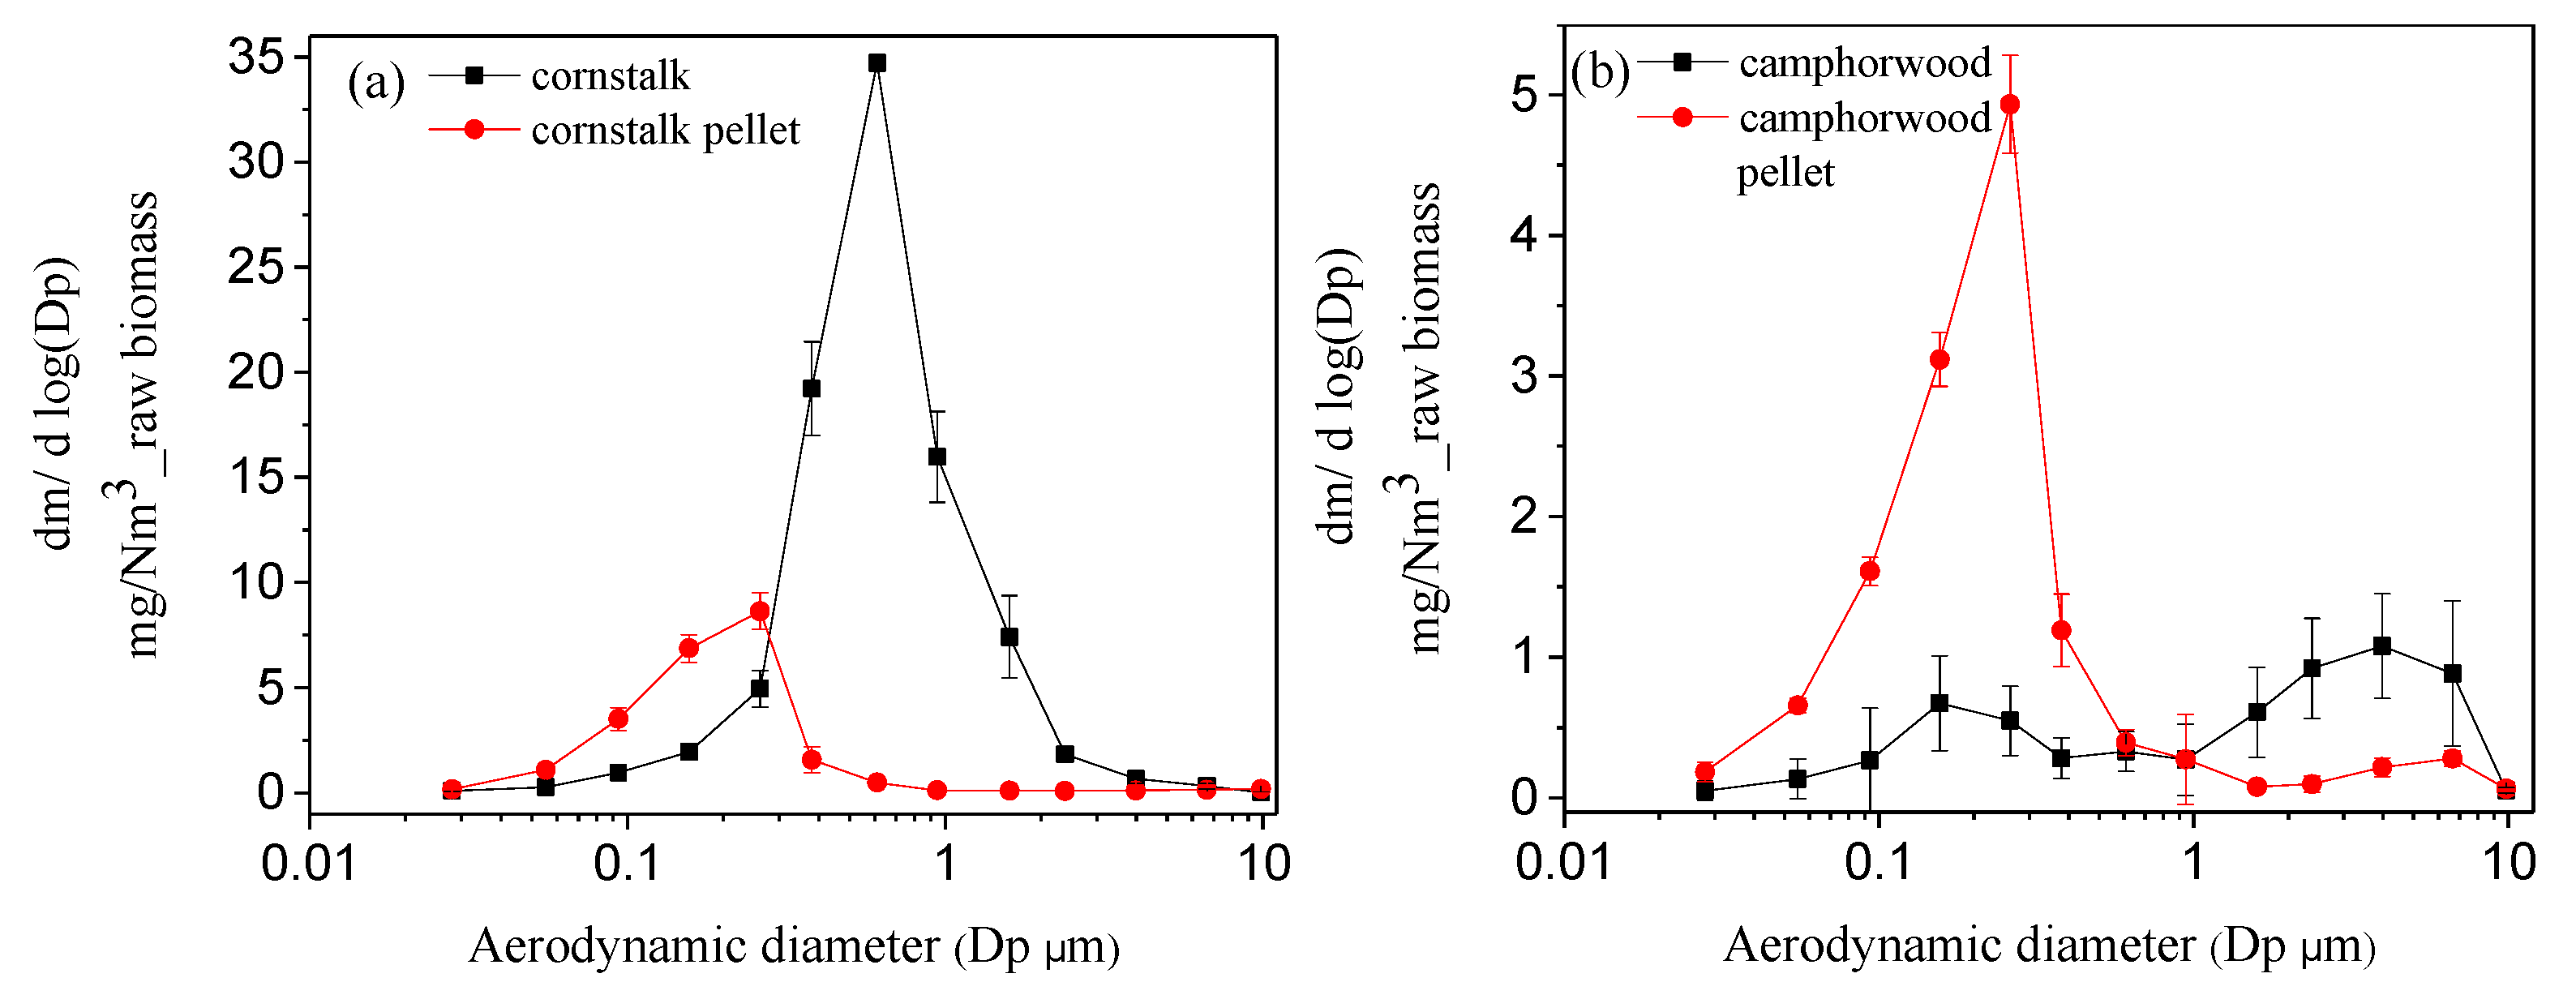
3.3. PM Emission Characteristics

The particle size distributions (PSDs) of PM10 from biomass combustion are presented in Figure 2, and the yields for different particle sizes are given in Table 5. For cornstalk, the PSDs appear in a unimodal distribution, with the peak at around 0.6 μm. The PSDs of cornstalk pellets remain to appear in a unimodal distribution, but the peak shifted to around 0.26 micron. The densification significantly reduces the yields of PM as seen in Figure 2 and Table 5. The yield of PM10, PM1, and PM1–10 of cornstalk decreases from 88.35, 78.12, and 10.23 mg/Nm3 to 23.12, 22.47, and 0.65 mg/Nm3, respectively, due to the biomass densification. For cornstalk, the ratio of PM1 to PM10 is as high as 88.42%, indicating that the PM was mainly composed of submicron particles less than 1 μm. Zhu et al. [26] studied the combustion of cotton stalk and rice husk and also found that the proportion of PM1 in PM was relatively high, indicating that the PM of straw biomass was mainly composed of submicron particles. The ratio of PM1 to PM10 of cornstalk pellets (97.20%) is higher than that of cornstalk (88.42%), indicating that the densification has a more obvious emission reduction effect on PM1–10. However, the yield of PM0.3 increases from 8.22 to 20.30 mg/Nm3, and the ratio of PM0.3 to PM1 increases from 10.52 to 90.34%. These results show that the densification promotes the formation of fine particles (less than 0.3 μm). This should be related to the promotion effect of densification on combustion, as confirmed in Section 3.1, which increases the release of volatile matter, thus increasing the yield of PM0.3.
Different from cornstalk, the PSDs of camphorwood appear in a bimodal distribution, with 1 μm as the boundary as seen in Figure 3b. The peaks of the coarse and fine particle modes are located at 3.97 μm and 0.16 μm, respectively. Figure 3b shows also a bimodal distribution for camphorwood, but the coarse particle model is significantly reduced. Another difference is that the peaks of the coarse and fine particle modes are at 6.65 μm and 0.26 μm, respectively, indicating that the densification delays the formation of the peaks. The densification shifts the PSD curve of PM10 to the right as a clear trend, which promotes the growth of fine particles. Unlike cornstalk, the densification increases the yields of PM10, PM0.3, and PM1 from 6.10, 1.67, and 2.55 mg/Nm3 to 13.10, 10.50, and 12.36 mg/Nm3, respectively, as seen in Table 5. However, the yield of PM1–10 decreases from 3.54 mg/Nm3 to 0.74 mg/Nm3 due to the densification. The ratio of PM1 to PM10 increases from 41.80% to 94.36%, indicating that the PM produced by the camphorwood pellets is mainly composed of submicron particles. Elbl et al. [27] also found similar results when studying the combustion of spruce wood. The results showed that PM was mainly composed of particles below 0.6 micron. The ratio of PM0.3 to PM1 increases from 65.49% to 84.95%, suggesting that the densification also promotes the formation of fine particles, with the similar reason of the cornstalk discussed above.

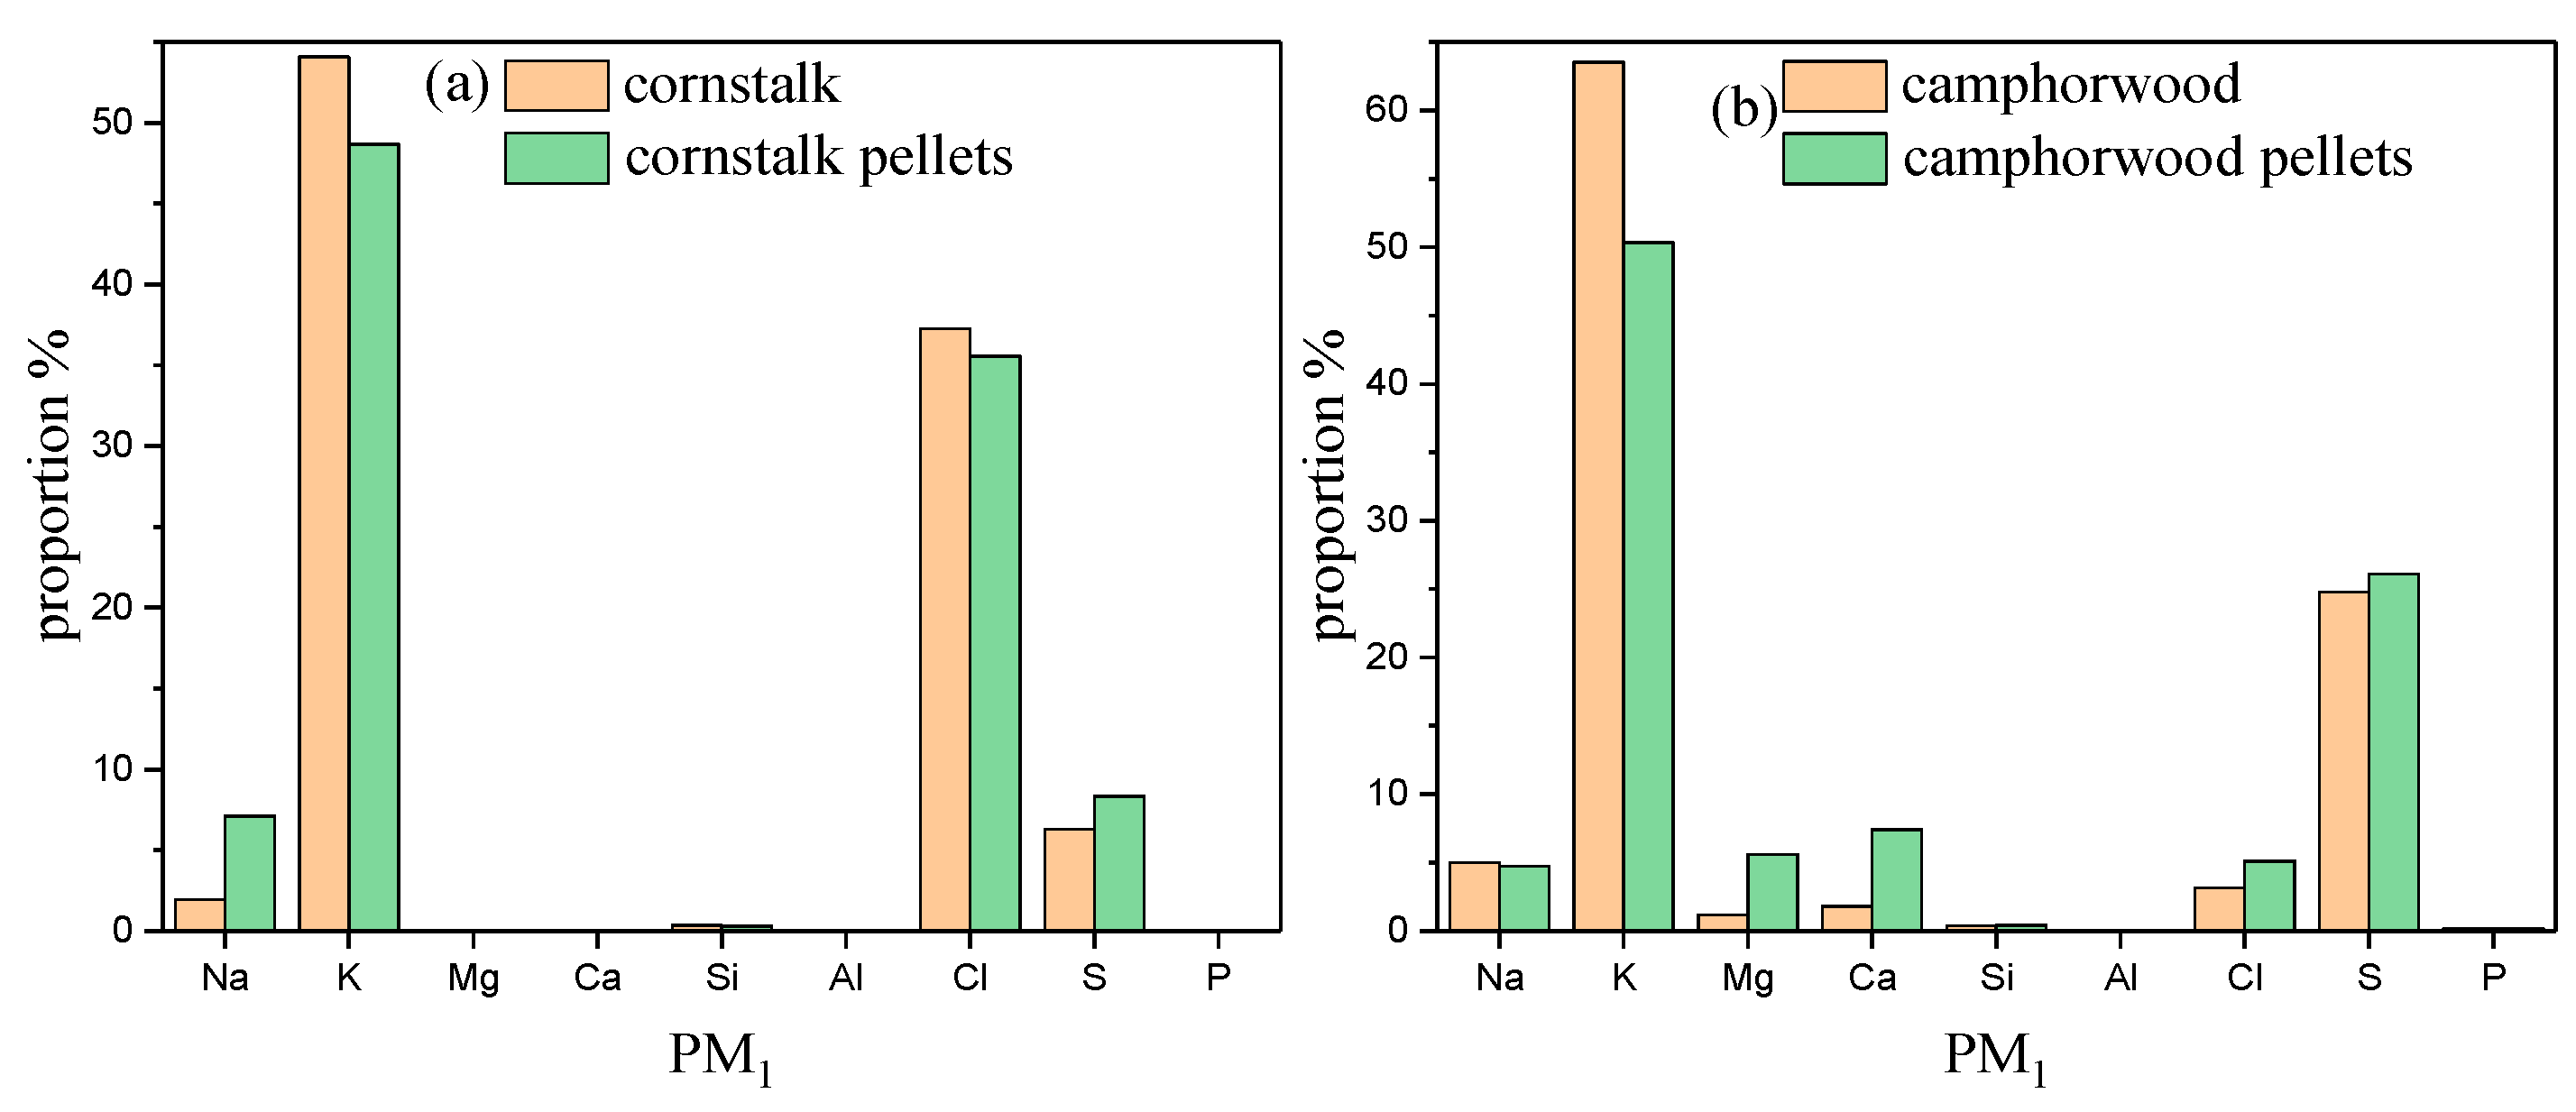
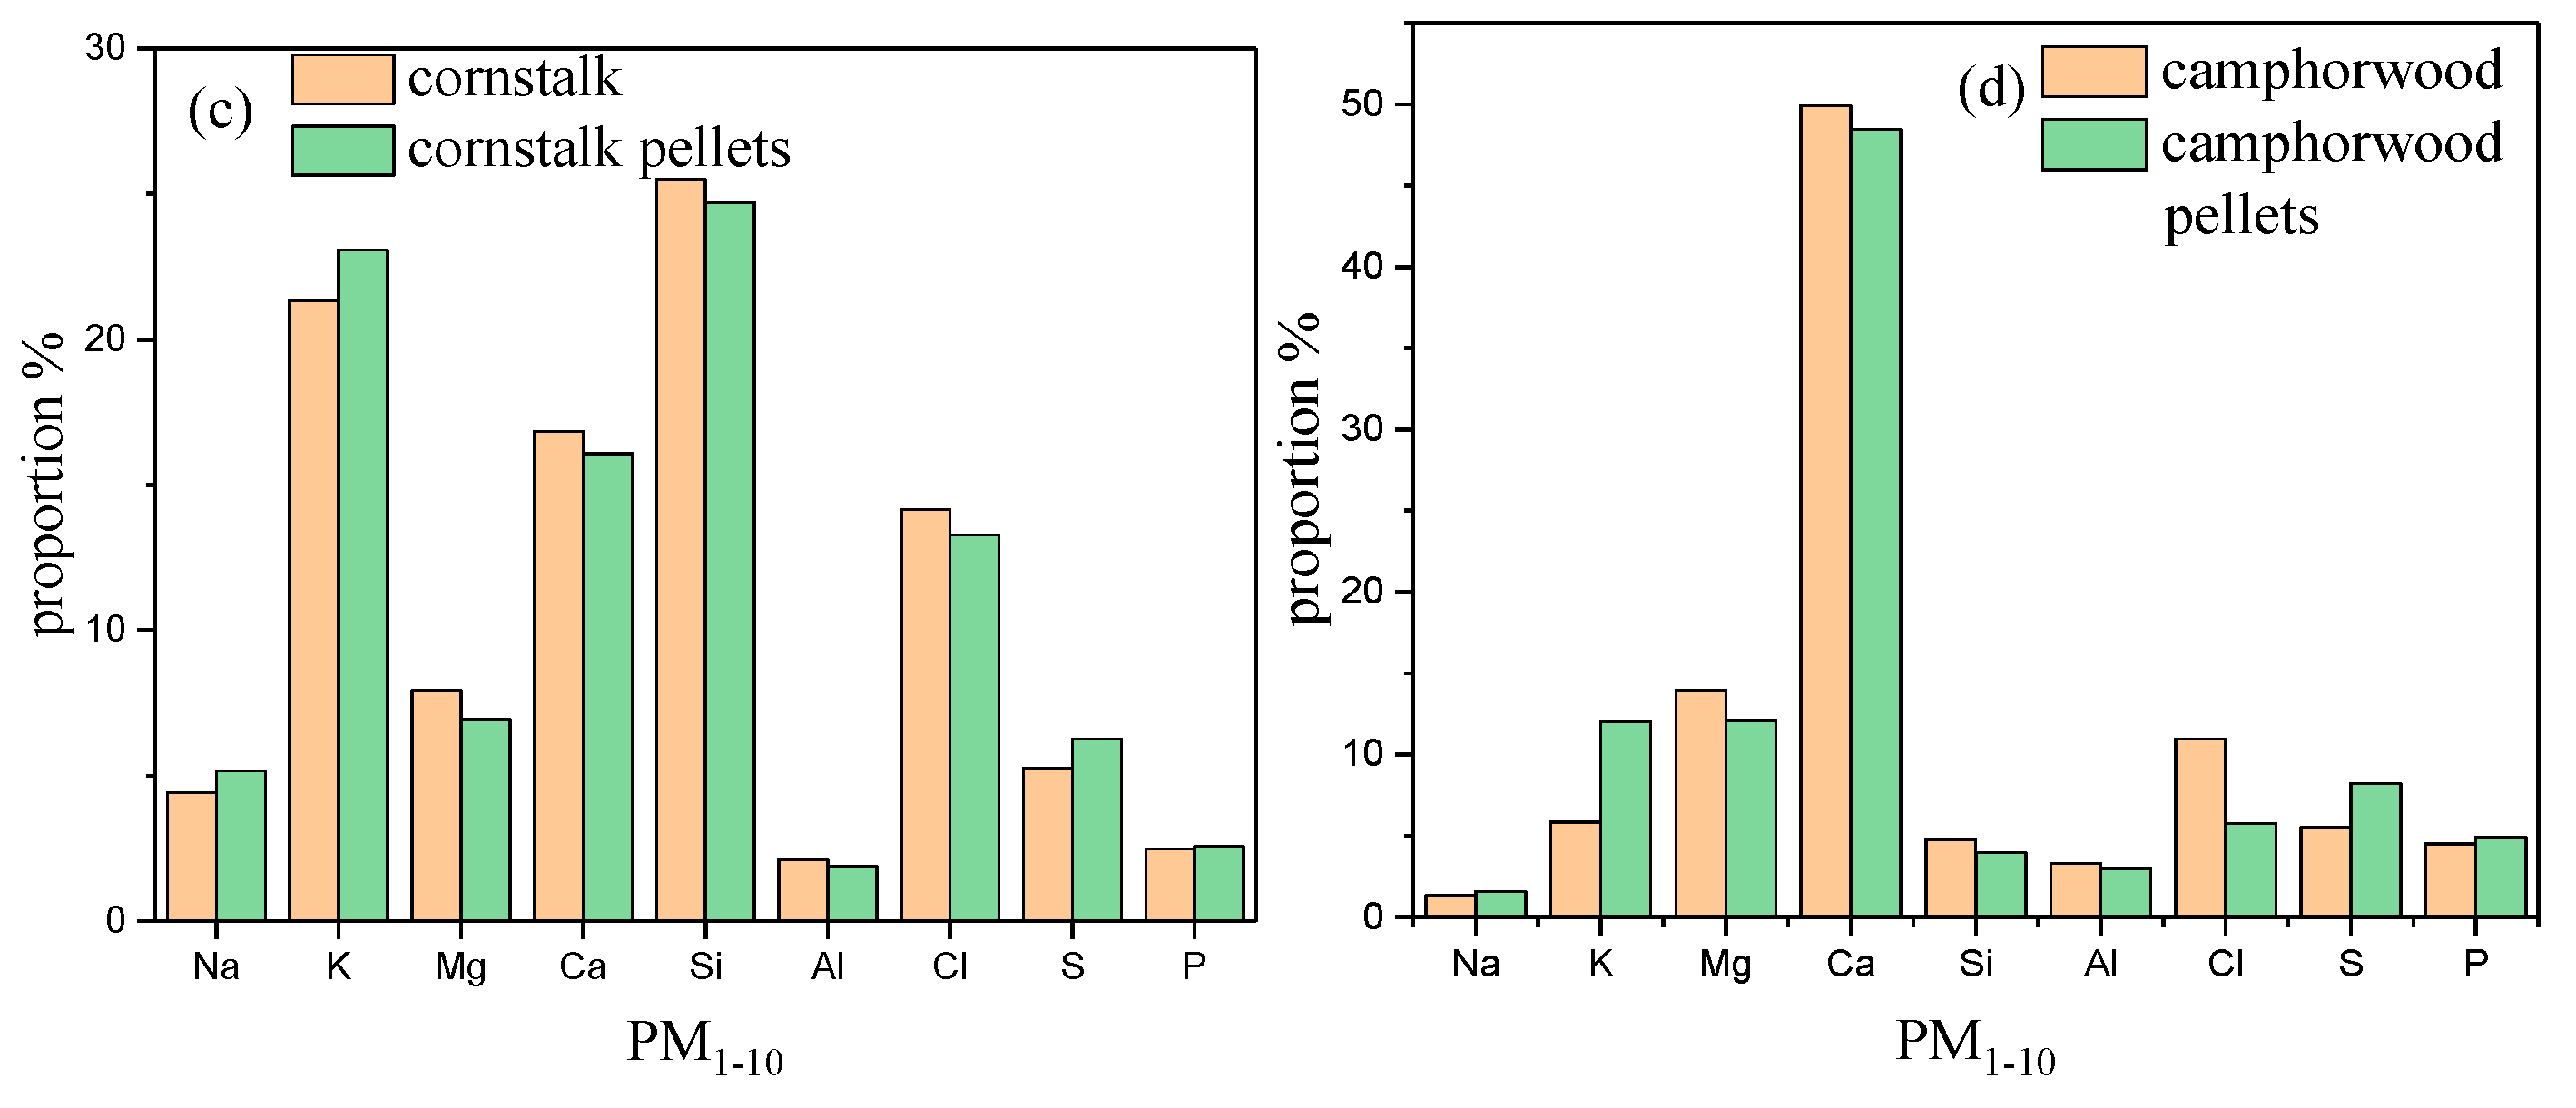
3.4. Chemical Composition of Particulate Matters

The elemental compositions of PM1 and PM1–10 from the combustion of cornstalk and camphorwood as well as their pellets are shown in Figure 4. The molar ratios between the main elements in PM are listed in Table 6. For cornstalk, the composition of PM1 is K, Cl, S, and Na as seen in Figure 4a. The molar ratio of (Na + K)/Cl is 1.50, much lower than (Na + K)/2/S with 4.44. These results suggest that the PM1 of cornstalk is mainly composed of alkali metal chlorides. The molar ratio of (Na + K)/(Cl + 2S) in the PM1 of cornstalk is 1.12, slightly higher than 1, indicating the existence of other minor alkali compounds such as the salts combined with Si. A small amount of Si in the PM1 of cornstalk does exist as seen in Figure 4a. Compared with PM1, the composition of the PM1–10 for cornstalk is more complicated as shown in Figure 4c. The PM1–10 of cornstalk is mainly composed of Si, K, Ca, Cl, and a small amount of other elements. The silicon-dominated compounds are the main contributor to the formation of cornstalk PM1–10. In addition, some alkali metals can also react with silicates or phosphates to form PM1–10 [7].
Comparing the results of cornstalk pellets with cornstalk in Figure 4a,c, it can be said that the densification did not change the composition of PM1 and PM1–10 but caused a slight variation in the content of each component. The densification increases the sulfur content but decreases the chlorine content in PM1 as shown in Figure 4a,c. It can also be seen from Table 6 that the molar ratios of (Na + K)/Cl and (Na + K)/2/S have been changed by densification from 1.50 and 4.44 to 1.57 and 3.35 for PM1, respectively, whereas the molar ratio of (Na + K)/(Cl + 2S) in PM1 is close to 1 but a minor decrease from 1.12 to 1.07. For PM1–10, Figure 4c shows that the densification increases the content of K, Na, and S and decreases the content of other elements. Combined with Table 6, it is found that the molar ratio of (Na + K)/(Cl + 2S) increases from 1.04 to 1.09. Such a small increase indicates a minor effect of the densification on the composition of PM1–10. The composition of PM1–10 is affected by the composition of raw biomass. Zhu et al. [26] found that PM1–10 produced from cotton stalk with a high alkaline earth metal content also contained a lot of Ca/Mg compounds, whereas PM1–10 from rice husk rich in silicon contained many silicate compounds.
For camphorwood, PM1 is mainly composed of alkali metals, chlorine, and sulfur as shown in Figure 4b. Different from cornstalk, the S content of camphorwood is significantly higher than Cl, which can also be confirmed from Table 6, as the molar ratio of (Na + K)/Cl (21.70) in the PM1 of camphorwood is obviously higher than that of (Na + K)/2/S (1.38). The molar ratio of (Na + K)/(Cl + 2S) in the PM1 of camphorwood is 1.30, higher than 1 due to the fact that PM1 also contains a certain amount of Ca, Mg, and Si. In the PM1–10 of camphorwood, the main constituent elements are Ca, Mg, Cl, S, K, etc. as shown in Figure 4d. This suggests that calcium-based compounds play an important role in the formation of camphorwood PM1–10. Other elements (such as K) may also transform into PM1–10 by heterogeneous condensation with alkaline earth metal particles [28,29].
The camphorwood densification results in a decrease in the K and Na contents in PM1 against an increase in the Ca, Mg, Cl, and S contents to a certain extent. The molar ratios of (Na + K)/Cl, (Na + K)/2/S, and (Na + K)/(Cl + 2S) also decrease from 21.70, 1.38, and 1.30 to 10.74, 1.06, and 0.96, respectively, as can be seen from Table 6. However, the effect of the densification on the component content in PM1–10 is not obvious. In PM1–10, the contents of Na, K, and S slightly increase, whereas other elements decrease in a more or less degree. The molar ratios of (Na + K)/Cl, (Na + K)/2/S, and (Na + K)/(Cl + 2S) all increase to a certain extent.

3.5. Discussion on the Effect of Densification on PM

In summary, from the above experimental results, the densification has little effect on the composition of PM but significantly changes the yield of PM. The PM10 emission from biomass combustion is greatly reduced for cornstalk but is clearly increased for camphorwood. There are some reaction mechanisms behind the experimental results that can be discussed below.
For cornstalk, PM is mainly composed of alkali metal compounds as has been presented in Section 3.4. The first mechanism is associated with the higher FC content in cornstalk than camphorwood as given in Table 1. Liu et al. [30] found that dense char can inhibit the ash release; thus, the release of alkali metals in the ash phase and the formation of PM can be reduced. The second mechanism is attributed to the ash melting behavior. The molar ratio of Si/(Ca + Mg) or (Si + P + K)/(Ca + Mg) could be used as an index to predict the ash melting characteristics [5]. The molar ratios of Si/(Ca + Mg) and (Si + P + K)/(Ca + Mg) of cornstalk are higher than those of camphorwood as seen in Table 1, indicating that cornstalk can easily form a low-melting-point eutectic. At the early stage of combustion, a part of the ash might be molten, resulting in a poor pore structure. Therefore, the release of volatile substances is weakened, resulting in reduced PM emission [31]. Liu et al. [32] studied the combustion of cornstalk pellets and found that some alkali metals are also released in the volatile combustion stage. Therefore, when the release of volatiles is blocked by ash melting, the release of alkali metals is reduced and so is the yield of PM. The third mechanism can be related to the biomass densification. The densification enhances the contact between the ash particles, resulting in the enhanced reactivity of Si and alkali metals. Previous studies found that the silicate reaction between Si and alkali metals can reduce the volatilization of alkali metals, leading to a reduction in PM [9,33].
For camphorwood, the densification significantly increases the yield of PM1, which is related to the high alkaline earth metal content as seen in Table 1. First, the densification promotes an intensive biomass combustion, which is accompanied by the rapid release of a large amount of heat. The intensive combustion promotes collisions between alkaline earth metal particles, which are then transformed into particulate matter, as can be confirmed by Figure 4. Second, the broken alkaline earth metal particles are more likely to react with silicon, thus weakening the reaction between alkali metal and silicon. Thus, alkali metals cannot react with silicate to form PMs [34]. Under the combined action of these two factors, the densification can increase the yield of PM1.
Generally speaking, the influence of the densification on PM emission is related to the biomass properties. The difference can be analyzed from the composition of the two samples. Table 1 shows that the molar ratios of Si/(Mg + Ca) and (Si + P + K)/(Mg + Ca) are 1.25 and 5.80, respectively, and the contents of K2O and SiO2 in cornstalk ash are 46.73% and 18.18%, respectively, which are higher than those in camphorwood. As analyzed above, first of all, the high molar ratios of Si/(Ca + Mg) and (Si + P + K)/(Ca + Mg) indicate that cornstalk can easily form a low-melting-point eutectic. Therefore, when the release of volatiles is blocked by ash melting, the release of alkali metals is reduced and so is the yield of PM. Second, the biomass densification enhances the silicate reaction between Si and alkali metals, which reduces the volatilization of alkali metals, leading to a reduction in PM. Therefore, the densification reduces the PM emission of cornstalk. On the contrary, Table 1 shows that the contents of CaO and MgO in camphorwood ash are 53.77% and 12.96%, respectively, which are significantly higher than those in cornstalk. Results of the previous analysis have shown that the densification promotes an intensive combustion, which promotes collisions between alkaline earth metal particles, causing the transformation into PM. Another effect is that alkali earth metals competed with alkali metals in silicate reaction, so alkali metals that cannot participate in the silicate reaction convert into PMs. Finally, the densification contributes to the PM emission of camphorwood.
In summary, these differences lead to the densification that inhibits the PM emission from the combustion of agricultural straw biomass but increases the PM emission from the woody biomass combustion. The difference between the agricultural biomass residues and forest biomass residues should draw special attention with respect to the PM emission from the biomass pellets.

4. Conclusions

The effect of biomass densification on combustion characteristics and PM emission was studied in this work by comparing cornstalk as a typical agricultural biomass residue with camphorwood as a woody biomass. The main conclusions are as follows:
(1)
The TG−DTG results show that the biomass densification increases the ignition, burnout, and composite combustion indexes, leading to a better performance of biomass combustion.
(2)
The results of the kinetic analysis suggest that the main reaction mechanism of cornstalk pellets can be well-expressed with the chemical reaction series model, whereas the diffusion mechanism and chemical reaction series models can be applied to the combustion of camphorwood pellets.
(3)
The influence of biomass densification on PM emission is related to the biomass properties. The densification significantly reduces PM emission for agricultural biomass residues such as cornstalk but significantly increases the yield of PM1 for woody biomass such as camphorwood.

Author Contributions

Conceptualization, Y.H. and H.Y.; data curation, W.Y., L.L. and H.L.; formal analysis, L.L. and H.L.; funding acquisition, Y.L. and H.Y.; investigation, W.Y., Y.Z. and H.Y.; methodology, Y.H. and Y.Z.; resources, Y.L.; validation, W.Z.; writing—original draft, W.Y.; writing—review and editing, Y.Z. and W.Z. All authors have read and agreed to the published version of the manuscript.

Funding

This work was supported by the National Natural Science Foundation of China (No. 51706210), Doctoral Research Fund Project of Zhengzhou University of Light Industry (2019BSJJ010), and Science and Technology Department of Henan province (212102310098). The authors are also grateful for the assistance on the sample preparation and testing provided by the Analytical and Testing Center of Huazhong University of Science and Technology.

Institutional Review Board Statement

Not applicable.

Informed Consent Statement

Not applicable.

Data Availability Statement

To obtain the data for this study, please contact the authors via email.

Conflicts of Interest

The authors declare no conflict of interest.

References

  1. Kang, Y.; Yang, Q.; Bartocci, P.; Wei, H.; Liu, S.S.; Wu, Z.; Zhou, H.; Yang, H.; Fantozzi, F.; Chen, H. Bioenergy in China: Evaluation of domestic biomass resources and the associated greenhouse gas mitigation potentials. Renew. Sustain. Energy Rev. 2020, 127, 109842. [Google Scholar] [CrossRef]
  2. Králík, T.; Knápek, J.; Dvořáček, L.; Vávrová, K. Impact of pelleting cost on competitiveness of intentionally grown biomass for local space heating: Case example of the Czech Republic. Energy Rep. 2020, 6, 732–737. [Google Scholar] [CrossRef]
  3. Zhou, Y.; Zhang, Z.; Zhang, Y.; Wang, Y.; Yu, Y.; Ji, F.; Ahmad, R.; Dong, R. A comprehensive review on densified solid biofuel industry in China. Renew. Sustain. Energy Rev. 2016, 54, 1412–1428. [Google Scholar] [CrossRef]
  4. Mian, I.; Li, X.; Dacres, O.D.; Wang, J.; Wei, B.; Jian, Y.; Zhong, M.; Liu, J.; Ma, F.; Rahman, N. Combustion kinetics and mechanism of biomass pellet. Energy 2020, 205, 117909. [Google Scholar] [CrossRef]
  5. Horvat, I.; Dović, D.; Filipović, P. Numerical and experimental methods in development of the novel biomass combustion system concept for wood and agro pellets. Energy 2021, 231, 120929. [Google Scholar] [CrossRef]
  6. Gao, X.; Rahim, M.U.; Chen, X.; Wu, H. Inorganic PM10 emission from the combustion of individual mallee components and whole-tree biomass. Proc. Combust. Inst. 2017, 36, 3313–3319. [Google Scholar] [CrossRef]
  7. Yang, W.; Zhu, Y.; Cheng, W.; Sang, H.; Yang, H.; Chen, H. Characteristics of Particulate Matter Emitted from Agricultural Biomass Combustion. Energy Fuels 2017, 31, 7493–7501. [Google Scholar] [CrossRef]
  8. Wang, K.; Nakao, S.; Thimmaiah, D.; Hopke, P.K. Emissions from in-use residential wood pellet boilers and potential emissions savings using thermal storage. Sci. Total Environ. 2019, 676, 564–576. [Google Scholar] [CrossRef]
  9. Yang, W.; Zhu, Y.; Cheng, W.; Sang, H.; Xu, H.; Yang, H.; Chen, H. Effect of minerals and binders on particulate matter emission from biomass pellets combustion. Appl. Energy 2018, 215, 106–115. [Google Scholar] [CrossRef]
  10. Cheng, W.; Zhu, Y.; Shao, J.A.; Zhang, W.; Wu, G.; Jiang, H.; Hu, J.; Huang, Z.; Yang, H.; Chen, H. Mitigation of ultrafine particulate matter emission from agricultural biomass pellet combustion by the additive of phosphoric acid modified kaolin. Renew. Energy 2021, 172, 177–187. [Google Scholar] [CrossRef]
  11. Si, Y.; Hu, J.; Wang, X.; Yang, H.; Chen, Y.; Shao, J.; Chen, H. Effect of Carboxymethyl Cellulose Binder on the Quality of Biomass Pellets. Energy Fuels 2016, 30, 5799–5808. [Google Scholar] [CrossRef]
  12. Li, X.G.; Lv, Y.; Ma, B.G.; Jian, S.W.; Tan, H.B. Thermogravimetric investigation on co-combustion characteristics of tobacco residue and high-ash anthracite coal. Bioresour. Technol. 2011, 102, 9783–9787. [Google Scholar] [CrossRef]
  13. Yang, Z.; Zhang, S.; Liu, L.; Li, X.; Chen, H.; Yang, H.; Wang, X. Combustion behaviours of tobacco stem in a thermogravimetric analyser and a pilot-scale fluidized bed reactor. Bioresour. Technol. 2012, 110, 595–602. [Google Scholar] [CrossRef] [PubMed]
  14. Guo, F.; He, Y.; Hassanpour, A.; Gardy, J.; Zhong, Z. Thermogravimetric analysis on the co-combustion of biomass pellets with lignite and bituminous coal. Energy 2020, 197, 117147. [Google Scholar] [CrossRef]
  15. Coats, A.W.; Redfern, J.P. Kinetic Parameters from Thermogravimetric Data. Nature 1964, 201, 68–69. [Google Scholar] [CrossRef]
  16. Magalhães, D.; Kazanç, F.; Riaza, J.; Erensoy, S.; Kabaklı, Ö.; Chalmers, H. Combustion of Turkish lignites and olive residue: Experiments and kinetic modelling. Fuel 2017, 203, 868–876. [Google Scholar] [CrossRef]
  17. Málek, J. The kinetic analysis of non-isothermal data. Thermochim. Acta 1992, 200, 257–269. [Google Scholar] [CrossRef]
  18. Yang, W.; Zhu, Y.; Li, Y.; Cheng, W.; Zhang, W.; Yang, H.; Tan, Z.; Chen, H. Mitigation of particulate matter emissions from co-combustion of rice husk with cotton stalk or cornstalk. Renew. Energy 2022, 190, 893–902. [Google Scholar] [CrossRef]
  19. Gao, W.; Chen, K.; Xiang, Z.; Yang, F.; Zeng, J.; Li, J.; Yang, R.; Rao, G.; Tao, H. Kinetic study on pyrolysis of tobacco residues from the cigarette industry. Ind. Crops Prod. 2013, 44, 152–157. [Google Scholar] [CrossRef]
  20. Ding, K.; Wang, Y.; Liu, S.; Lin, G.; Syed-Hassan, S.S.A.; Li, B.; Hu, X.; Huang, Y.; Zhang, S.; Zhang, H. Volatile-char interactions during biomass pyrolysis: Insight into the activity of chars derived from three major components. J. Anal. Appl. Pyrol. 2021, 159, 105320. [Google Scholar] [CrossRef]
  21. Wang, G.; Zhang, J.; Shao, J.; Liu, Z.; Zhang, G.; Xu, T.; Guo, J.; Wang, H.; Xu, R.; Lin, H. Thermal behavior and kinetic analysis of co-combustion of waste biomass/low rank coal blends. Energy Convers. Manag. 2016, 124, 414–426. [Google Scholar] [CrossRef]
  22. Guo, F.; Zhong, Z. Optimization of the co-combustion of coal and composite biomass pellets. J. Clean. Prod. 2018, 185, 399–407. [Google Scholar] [CrossRef]
  23. Xinjie, L.; Shihong, Z.; Xincheng, W.; Jinai, S.; Xiong, Z.; Xianhua, W.; Haiping, Y.; Hanping, C. Co-combustion of wheat straw and camphor wood with coal slime: Thermal behaviour, kinetics, and gaseous pollutant emission characteristics. Energy 2021, 234, 121292. [Google Scholar] [CrossRef]
  24. Jia, L.; Yu, Y.; Li, Z.-P.; Qin, S.-N.; Guo, J.-R.; Zhang, Y.-Q.; Wang, J.-C.; Zhang, J.-C.; Fan, B.-G.; Jin, Y. Study on the Hg0 removal characteristics and synergistic mechanism of iron-based modified biochar doped with multiple metals. Bioresour. Technol. 2021, 332, 125086. [Google Scholar] [CrossRef]
  25. Liu, L.; Pang, Y.; Lv, D.; Wang, K.; Wang, Y. Thermal and kinetic analyzing of pyrolysis and combustion of self-heating biomass particles. Process Saf. Environ. 2021, 151, 39–50. [Google Scholar] [CrossRef]
  26. Zhu, Y.; Yang, W.; Fan, J.; Kan, T.; Zhang, W.; Liu, H.; Cheng, W.; Haiping, Y.; Wu, X.; Chen, H. Effect of sodium carboxymethyl cellulose addition on particulate matter emissions during biomass pellet combustion. Appl. Energy 2018, 230, 925–934. [Google Scholar] [CrossRef]
  27. Elbl, P.; Sitek, T.; Lachman, J.; Lisý, M.; Baláš, M.; Pospíšil, J. Sewage sludge and wood sawdust co-firing: Gaseous emissions and particulate matter size distribution. Energy 2022, 256, 124680. [Google Scholar] [CrossRef]
  28. Yang, W.; Pudasainee, D.; Gupta, R.; Li, W.; Wang, B.; Sun, L. Particulate matter emission during municipal solid waste combustion: Submicron particulates formation mechanism. Fuel 2022, 310, 122271. [Google Scholar] [CrossRef]
  29. Li, X.; Gong, X.; Zhang, C.; Liu, T.; Wang, W.; Zhang, Y. Occurrence characteristics of ash-forming elements in sea rice waste and their effects on particulate matter emission during combustion. Fuel 2020, 273, 117769. [Google Scholar] [CrossRef]
  30. Liu, S.; Zhu, G.; Niu, Y.; Wen, L.; Lei, Y.; Wang, D.; Hui, S.E. Characteristics of particulate emissions from coal char combustion: Char fragmentation and ash coalescence behaviors. Fuel 2022, 310, 122283. [Google Scholar] [CrossRef]
  31. Zhai, M.; Li, X.; Yang, D.; Ma, Z.; Dong, P. Ash fusion characteristics of biomass pellets during combustion. J. Clean. Prod. 2022, 336, 130361. [Google Scholar] [CrossRef]
  32. Liu, Y.; Wan, K.; He, Y.; Wang, Z.; Xia, J.; Cen, K. Experimental study of potassium release during biomass-pellet combustion and its interaction with inhibitive additives. Fuel 2020, 260, 116346. [Google Scholar] [CrossRef]
  33. Clery, D.S.; Mason, P.E.; Rayner, C.M.; Jones, J.M. The effects of an additive on the release of potassium in biomass combustion. Fuel 2018, 214, 647–655. [Google Scholar] [CrossRef]
  34. Niu, Y.; Tan, H.; Hui, S.E. Ash-related issues during biomass combustion: Alkali-induced slagging, silicate melt-induced slagging (ash fusion), agglomeration, corrosion, ash utilization, and related countermeasures. Prog. Energy Combust. Sci. 2016, 52, 1–61. [Google Scholar] [CrossRef]
Figure 1. Schematic diagram of experimental device [9]. 1. Feeding system, 2. feed inlet, 3. mass flowmeter, 4. nitrogen, 5. oxygen, 6. steel multihole distributor, 7. temperature controller, 8. dilution air, 9. cyclone, 10. Dekati low-pressure impactor, and 11. vacuum pump.
Atmosphere 13 01582 g001
Figure 2. TG−DTG curves of biomass and biomass pellets. (a) cornstalk; (b) camphorwood; (c) cornstalk pellet; (d) camphorwood pellet.
Atmosphere 13 01582 g002
Figure 3. Particle size distributions (PSDs) of PM10 from biomass combustion. (a) cornstalk and cornstalk pellet; (b) camphorwood and camphorwood pellet.
Atmosphere 13 01582 g003
Figure 4. Elemental composition of PM1 and PM1-10. (a) PM1 of cornstalk and cornstalk pellet; (b) PM1 of camphorwood and camphorwood pellet; (c) PM1–10 of cornstalk and cornstalk pellet; (d) PM1–10 of camphorwood and camphorwood pellet.
Atmosphere 13 01582 g004aAtmosphere 13 01582 g004b
Table 1. Fuel properties and ash composition.
SamplesCornstalkCamphorwood
Proximate analysis (wt%)
Mad2.864.03
Adb6.580.89
Vdb64.4987.93
FCdb28.9311.18
Ultimate analysis (wt%)
Cdb39.8148.7
Hdb5.085.93
Ndb0.940.51
Sdb0.230.17
Cldb0.610.11
Odb46.7543.69
LHV (MJ/kg)13.4917.56
Ash composition (wt%)
MgO4.5912.96
SiO218.1810.38
P2O57.558.72
SO32.515.32
Cl2O12.68-
K2O46.737.99
CaO7.1253.77
Fe2O30.390.59
Molar ratio of Si/(Mg + Ca)1.250.13
Molar ratio of(Si + P + K)/(Mg + Ca)5.800.36
Table 2. Solid-state reaction kinetics models.
ModelsReaction Orderf(α)g(α)
Chemical reaction Series modelF11 − α−ln(1 − α)
F3/2(1 − α)1.52(1 − α)−0.5 − 2
F2(1 − α)2(1 − α)−1
Phase interface modelR11a
R22(1 − α)0.51 − (1 − α)0.5
R33(1 − α)1/31 − (1 − α)1/3
Diffusion mechanism modelD11/2αα2
D2 [−ln(1 − α)]1/3(1 − α)ln(1 − α) + α
D33(1 − α)2/3/2[1 − (1 − α)1/3] [1 − (1 − α)1/3]2
D43/2[(1 − α)1/3 − 1](1 − 2α/3) − (1 − α)2/3
Random nucleation modelA22(1 − α)[−ln(1 − α)]1/2[−ln(1 − α)]1/2
A33(1 − α)[−ln(1 − α)]2/3 [−ln(1 − α)]1/3
Note: F: chemical reaction series model; R: phase interface model; D: diffusion mechanism model; A: random nucleation model; 1, 3/2, 2, 3, and 4 represent the reaction order corresponding to the reaction models, respectively.
Table 3. Characteristics parameters during combustion.
SamplesTi
°C
Tb
°C
DTGmax
%/min
Tmax°CDi × 10−3Db × 10−4S × 1013
Cornstalk2504598.052528714.8312.9739.13
Cornstalk
pellet
26042037.295327456.50443.15157.35
Camphorwood2736549.660932413.888.9240.17
Camphorwood pellet28644544.319530954.99440.19183.10
Note: Ti: ignition temperature; DTGmax: maximum combustion rate; Tmax: corresponding temperature of the maximum combustion rate; Tb: burnout temperature; Di: ignition index; Db: burnout index; S: composite combustion index.
Table 4. Combustion reaction kinetics results.
SamplesStagesTemperature °CActivation Energy kJ/molPre-Exponential FactorCorrelation CoefficientModels
Cornstalk1200–350104.624.07 × 1070.9724D3
2350–42523.900.91170.9990D3
3425–45974.421.35 × 1050.9940F1
Cornstalk
pellet
1220–27087.769.23 × 1060.9609D1
2270–280135.719.71 × 10120.9950F2
3280–31549.791.00 × 1040.9992F1
Camphorwood1200–38096.542.62 × 1060.9742D3
2380–48016.040.43080.9813D1
Camphorwood pellet1230–30078.626.51 × 1050.9847D1
2300–335132.008.12 × 10110.9986F2
Table 5. Yields of PM with different aerodynamic diameters.
SamplesPM0.3PM1PM1–10PM10Ratio of PM0.3 to PM1, %Ratio of PM1 to PM10, %
mg/Nm3
Cornstalk8.22 ± 0.9478.12 ± 1.2210.23 ± 2.6788.35 ± 3.8910.5288.42
Cornstalk
pellets
20.30 ± 2.1022.47 ± 2.900.65 ± 0.3323.12 ± 2.5990.3497.20
Camphorwood1.67 ± 0.552.55 ± 0.733.54 ± 0.296.10 ± 0.6265.4941.80
Camphorwood pellets10.50 ± 0.1912.36 ± 0.600.74 ± 0.1813.10 ± 0.5784.9594.36
Note: PM0.3, PM1, and PM10 mean the yield of particles of aerodynamic cutoff diameters less than 0.3, 1, and 10 μm, respectively. PM1–10 means the yield of particles of aerodynamic cutoff diameters between 1 and 10 μm.
Table 6. Molar ratio between main elements in PM.
Samples(Na + K)/Cl(Na + K)/2/S(Na + K)/(Cl + 2S)
PM1PM1–10PM1PM1–10PM1PM1–10
Cornstalk1.501.824.442.451.121.04
Cornstalk pellet1.572.123.352.251.071.09
Camphorwood21.700.651.380.651.300.33
Camphorwood pellets10.742.371.060.830.960.61
Publisher’s Note: MDPI stays neutral with regard to jurisdictional claims in published maps and institutional affiliations.

