Article

An Evaluation of Precipitation in Dongting Lake Basin on CMIP5 Models

1
Yueyang Meteorological Bureau of Hunan Province, Yueyang 414000, China
2
Key Laboratory of Preventing and Reducing Meteorological Disaster in Hunan Province, Changsha 410118, China
3
Yueyang National Observatory, Yueyang 414000, China
*
Author to whom correspondence should be addressed.
Atmosphere 2022, 13(10), 1571; https://doi.org/10.3390/atmos13101571
Submission received: 16 July 2022 / Revised: 15 September 2022 / Accepted: 22 September 2022 / Published: 26 September 2022
(This article belongs to the Section Climatology)

Abstract

:
The rainfall in the Dongting Lake Basin influences tens of millions of people, and its long-term change remains uncertain. In this paper, 15 CMIP5 models with precipitation data for the time period of 2006–2019 for which reliable observations are available under the RCP4.5 scenario were evaluated for their applicability, and the models with better simulation results were selected for predicting the precipitation in the Dongting Lake Basin during the flood season (April–September) in the mid-21st century (2020–2049). The results of the study show that (i) most models behaved reasonably consistent with the observation in the Dongting Lake Basin, and predicted an upward trend for the future precipitation while the multi-model ensemble (MME) showed a relatively slow increasing trend of 0.8 mm/year; (ii) the future precipitation in Dongting Lake Basin presented a variation form of “peak–valley–peak–valley”, suggesting strong interannual and interdecadal variations; (iii) the interannual variability showed great agreement with large-scale circulation, implying that the rainfall is controlled by the circulation. The analysis of the wind fields at 200 hPa and 850 hPa in the peak and valley years showed that the characteristics of low-level convergence and high-level divergence were significantly stronger in the peak precipitation years than in the weak years; moreover, the teleconnection pattern of “+ − +” from Europe, the Ural Mountains, and East Asia was clearly manifested in the 500 hPa height field of the Dongting Lake Basin, which can influence the intensity of the trough ridge over East Asia and change the low-level water vapor convergence and divergence, thus affecting the source of water vapor in the Dongting Lake Basin.

1. Introduction

Climate change is one of the reasons for the water lowering in the Dongting Lake Basin in the 21st century, which contributes to an increase in heavy precipitation processes such as heavy rainfall in the Dongting Lake area and a decrease in the number of rainy days, a decrease in overall rainfall and a decrease in water storage. According to research of the climate model simulations and observations, the total water vapor content in the atmosphere increased by 7% and the global precipitation increased by 1~3% for every 1 °C increase in the global mean temperature [1]. In the context of global warming, extreme weather is frequent, and the long-term change of precipitation in Dongting Lake Basin is uncertain [2]. Therefore, if the future climate change trends can be accurately predicted, it is of great importance to make the correct climate impact assessments and decisions.
In recent years, many scholars have carried out many numerical experiments and predictions of future climate change in China, especially regarding precipitation, through climate models [3,4,5,6,7,8,9,10,11,12,13]. Through numerical experiments assessing 46 global climate models, Yao et al. selected 14 best models to estimate the variance ratio of precipitation in each season in China in the 21st century. The results indicate that the seasonal change rates of precipitation showed a certain increasing trend in all seasons, but in the early-, middle-, and late-term 21st century, they had no significant difference compared to those between 1986 and 2004 [11]. Yang et al. designed multiple regression schemes to revise the model precipitation prediction deviations. Among them, the combined regression revisions of the average precipitation predictions of 24 model ensembles from 2016 to 2045 under the RCP4.5 scenario showed that relative to the 1976–2005 average, the precipitation anomalies in the next 30 years roughly showed a pattern of less in the north and less in the south and more in the middle, with 10% to 20% less precipitation in the middle and lower reaches of the Yangtze River, the central and western area of Jiangnan, the northeast part of Southwest China, the coastal region of South China and Hainan Province, etc. [14]. Cheng et al. predicted precipitation under two emission scenarios, RCP4.5 and RCP8.5, showing that national precipitation presented an increasing trend, a geographical distribution of progressive decrease from southeast to northwest, and a seasonal change feature of strong precipitation in winter and was weak in spring and summer [15]. Sun X.Y. et al. attributed the precipitation simulation differences and identified three main components for the differences in the multi-model simulation results: internal variability, frequency differences, and the combined term of the two, with internal variability being the largest of the three components. These three deviations ultimately depend on two factors: the ability to simulate the frequency of WPs and the ability to simulate the corresponding average daily precipitation generated by these WPs, with the second factor playing a decisive role [3].
Dongting Lake is the second largest freshwater lake in China and is located in the East Asian monsoon region, which brings it complex and changeable weather and ample rainfall [16,17]. A positive and abrupt trend of precipitation in summer as well as its storm frequency was well-detected in the 1990s; in contrast, there was little change in the storm density. The reference evaporation has decreased steadily and obviously since the 1960s; and in summer, the decrease is of much greater significance. The accelerated water circulation driven by global warming has brought the Dongting Lake Basin more precipitation in summer, but the reference evaporation has decreased at the same time, as it was the main climatic contributor to the frequent floods in summer in the 1990s [17]. There has also been a lot of work on the evaluation and prediction of precipitation in lakes and basins around the world [18,19]. Ammara N. et al. analyzed and projected the long-term spatio-temporal changes in precipitation using the data from 2005 to 2099 across two large river basins of Pakistan. The projected precipitation data were synthesized in three steps, and this framework, developed to project climate change trends during the study, can be replicated for any other area.
The precipitation during the rainy season is about 60% of the annual precipitation in the Dongting Lake Basin, easily initiating a flood disaster. Therefore, the lake is crucial to the flood control in the Jingjiang section of the Yangtze River and even the middle and lower reaches of the Yangtze River. Although precipitation prediction has been studied in several regions in China [20,21,22,23,24,25,26,27,28,29,30,31,32,33], relatively few studies have been conducted on the prediction of future precipitation in the Dongting Lake Basin [16,34]. Five relatively independent global climate models were selected from 47 CMIP5 models to simulate future climatic conditions. The results show that the water resources of the Dongting Lake are likely to increase in the future, but are distributed more unevenly.
Therefore, in the context of global warming, the CMIP5 models were used to evaluate the applicability of precipitation data for the time period of 2006–2019 for which reliable observation data are available, and to select models with a better simulation effect for predicting flood precipitation in the Dongting Lake area in the middle of the 21st century, which can help improve the technical level and service capability of meteorological departments in the operation and service of climate change impact assessments on water resources, and provide a reference basis for the government and relevant departments to propose countermeasures for the safety of water resources in the lake, and to respond to the occurrence of disasters and reduce disaster losses.

2. Data and Methods

The Global Coupled Model Comparison Program (CMIP) was established in 1995 by the Coupled Model Working Group of the World Climate Research Program (WCRP), which aims to provide a platform for model comparison tests for research scholars worldwide. CMIP5 contains a total of more than 20 model groups and 50 climate coupled models worldwide, most of which consider changes in greenhouse gases, solar radiation, aerosol interactions, atmospheric chemistry, etc. The IPCC’s Fifth Assessment Report uses four GHG concentration scenarios, ranked from low to high representative pathway concentrations (RCPs): RCP2.6, RCP4.5, RCP6.0, and RCP8.5, where the latter number indicates radiative forcing levels of 2.6 wm−2 to 8.5 wm−2 by 2100. RCP4.5 refers to the reduction in human carbon emissions by 2080, but still exceeding the allowable values. This is more consistent with the direction of national development (carbon peaking and carbon neutrality), so the models under the RCP4.5 pathway were chosen for assessment.
Multiple studies have suggested the CMIP5 performs comparably or better in the EAM simulations than CMIP6. In particular, the selected models in the present study showed the best performance. As such, 15 CMIP5 models were chosen under the RCP4.5 scenario [35], and detailed information is available at https://esgf-node.llnl.gov/projects/cmip5/, accessed on 30 October 2017 (Table 1). The comparison data are the monthly average reanalysis data offered by the National Center for Atmospheric Research (NCEP/NCAR) for the period 1990–2019 with a resolution of 2.5° × 2.5°. The research time was from April to September each year (hereinafter referred to as the flood season), and the Dongting Lake Basin is at 24°63′–30°29′N, 107°25′–114°24′E [34].
This paper is comprised of two main parts including the evaluation and prediction. The RCP4.5 data started in 2006, which is more than 10 years ago, and can be tested with meteorological observation records to assess the uncertainty. Therefore, the precipitation data of the CMIP5 model were first evaluated with Taylor plots and other methods to select the model with a better simulation effect; then regression analysis and synthetic analysis were used to predict the precipitation in the Dongting Lake area in the middle of the 21st century. The evaluation period was 2006–2019 and the prediction period was 2020–2049. Due to the difference in the resolution ratio of the model data, the method of bilinear interpolation was used first to interpolate the prediction data of all models to the longitude and latitude of 2.5° × 2.5°. Since the results of the multi-mode ensemble averaging are generally better than most individual modes, the equal-weight averaging method was used for mode ensemble averaging (MME).

3. Results

3.1. Applicability Analysis of the Models in Dongting Lake Basin

The Dongting Lake Basin refers to Dongting Lake and the surrounding geographical area, which generally often refers to the area including the lake water, lakeside plains, and marginal low hills, with an area of 26.28 × 10⁴ km2. The basin is surrounded by mountains to the east, south, and west, with an open horseshoe-shaped basin to the north, high in the northwest and low in the southeast. Dongting Lake is a disc-shaped basin with high periphery and low central part, with many island-like hills jutting out at the edge of the basin about 500 m, and the hills around the lake are below 250 m in elevation. The central part is a mounded plain composed of lake accumulation, river-lake alluvium, estuarine delta and outer lake, mostly at 25–45 m. Dongting Lake is divided into the East, West and South Dongting Lakes, and the lake is in the shape of a “U”. The Dongting Lake Basin is in the climate zone from the central subtropical to the northern subtropical excess, with an average multi-year temperature of 10–18.5 ℃ and an average multi-year relative humidity of 78–84%. The average total precipitation is 990 mm in the Dongting Lake Basin during the flood season (Table 2), with the most precipitation in June, followed by May, which is more than 200 mm, and the least in September, which is only about 97 mm. Seen from the spatial distribution in Figure 1, the precipitation showed a trend of being much in the south and less in the north during the flood season. The precipitation was between 720 mm and 840 mm in the northwest, greater than 1080 mm in the southeast, and between 840 mm and 1080 mm in the remaining areas. Seen from the monthly precipitation distribution in Figure 2, the precipitation was greater in the southeast and less in the northwest in May and June, with most areas receiving more than 200 mm; precipitation was relatively equally distributed in July and August, with most in the range of 140–160 mm; precipitation was greater in the east and less in the west in April, with 160 mm in the east and 100–120 mm in the west; and precipitation in September was in the range of 80–120 mm.
Next, an applicability assessment of the precipitation data between 2006 and 2019 (there has been reliable observation data in the prediction data) was made. The precipitation anomaly percentage reflects the extent of deviation of the precipitation in a certain period from the average in the same period, as shown in Table 3. The precipitation anomaly percentages of 15 models during the flood season between 2006 and 2019 are shown in Figure 3, from which it can be found that most of the models showed a good performance ability for the flood precipitation in the Dongting Lake during the past 14 years, and the precipitation distance level percentages were less than 50%. However, the ACCESS1-0 and MIROC5 models had unusually high precipitation (Figure 3a,j). Among them, the deviations of the precipitation under the FGOALS-s2, inmcm4, MPI-ESM-LR, MPI-ESM-MR, and NorESM1-M model (Figure 3d,g,l,m,o) fell into the normal range, indicating that the models had a good prediction ability.
The Taylor diagram of the precipitation during the flood season between 2006 and 2019 of the 15 models is shown in Figure 4. The angular coordinate is the spatial correlation coefficient between the models and the observational data, and the vertical coordinate is the ratio of the standard deviations between the simulation field and the observation field [36]. In short, the larger the spatial correlation coefficient and the smaller the ratio the standard deviations, the closer it is to the actual condition. According to the figure, there was a certain deviation between the models. The spatial correlation between the models and the actual condition was relatively low, whose correlation coefficients were all less than 0.7. Among them, the correlation coefficients of ACCESS1-0 and GISS-E2-H were smaller than 0.1, which had a relatively poor correlation with the actual condition; the ratios of the standard deviations between most models and the actual condition were less than 1, but those of ACCESS1-0 and MIROC5 were larger than 1.5, showing a relatively large deviation.
Through the above analysis, the majority of models can adapt well to the flood precipitation under the RCP4.5 emission scenario from 2006 to 2019, but there exist certain deviations between models. In this paper, the ACCESS1-0, MIROC5, and GISS-E2-R models with relatively large deviations from the actual situation were eliminated, and the rest models were used for the future precipitation evaluation in the Dongting Lake Basin.

3.2. Projection of Precipitation in Flood Season in Dongting Lake Basin in the next 30 Years

Based on the above analysis, 12 models that performed well in the precipitation during the flood season between 2006 and 2019 were selected to predict flood precipitation in the Dongting Lake area for the next 30 years (2020–2049) through precipitation data at a moderate greenhouse gas emission concentration (Rcp4.5). The observation comparison period used was 1990–2019, and the MME is an equally weighted model ensemble average.
The trend of precipitation in the next 30 years was predicted by the linear trend and sliding average methods. The results showed that there were some differences between the models, with most of them showing an upward trend (Figure 5) and different growth rates. IPSL-CM5A-MR and NorESM1-M showed the most apparent increasing trend, inmcm4, IPSL-CM5A-LR, and MRI-CGCM3 showed a relatively decreasing trend, and MME showed a slow increasing trend. Moreover, there were also obvious interannual and interdecadal variations in model precipitation. Seen from the MME, there was a variation in the form of “peak–valley–peak–valley” between 2020 and 2049. Among them, there was a significant increasing trend between 2020 and 2026. The precipitation reached the peak value in 2026, continuously declined until 2033, and arrived at the valley value in 2033. Furthermore, there was an increasing trend between 2034 and 2037 as well as decreases between 2038 and 2044, followed by continuous increases until 2049.
Next, the spatial distribution of precipitation was estimated. Figure 6 shows the trend distribution of precipitation from April to September, and the dotted area indicates that it passed the 95% significance test. The precipitation during the future flood period showed an increasing trend on the whole (Figure 6g), which is consistent with the analysis in Figure 5m. Northeast and southwest of the Dongting Lake Basin passed the significance test. The largest precipitation growth trend was 1.2 mm/year in the southwest, followed by 0.8 mm/year in the northeast, with an average growth trend of 0.8 mm/year. The month-by-month trend varied widely (Figure 6a–f). Precipitation in April increased across almost the entire Dongting Lake Basin, increasing and passing the test in the central and western parts, with a maximum growth rate of 0.5 mm/year (Figure 6a). The situation was the opposite in May (Figure 6b), with an overall weakening trend and a basic weaking rate of 0.3–0.4 mm/year. In June and July, the precipitation showed an increasing trend as a whole (Figure 6c,d), which was growingly obvious in the northeast. Its reliability passed the test, conforming to the precipitation distribution of the plum rain zones during this period, but the growth rate in June was greater than that in July; in addition, there was a relatively apparent weakening trend in the northwest of the Dongting Lake Basin in June. The precipitation showed a weakening trend in the northeast in August and September, and an increasing trend in other areas (Figure 6e,f). Among them, the growth rate in August was slightly larger than that in September.

3.3. Analysis of Circulation Characteristics

According to the above analysis, the precipitation in the next 30 years presents the interannual variation characteristic of “peak–valley–peak–valley”, and the circulation field will be analyzed in the following to discover the characteristics of the interannual variation in precipitation. The peak precipitation years (2025, 2026, 2035, 2036, 2045, and 2046) and valley years (2030, 2031, 2040, and 2041) were first selected, and then methods such as composite analysis were used to analyze the reasons for the interannual variation in precipitation.
Seen from the climate state in the 500 hPa height field 30 years in the future (Figure 7), the area from Europe to the Ural Mountains at the mid- and high-latitudes is the plateau ridge, the northern Tibet Plateau is the high-pressure ridge, and the eastern region of China is the large East Asia trough. Shallow trough activities frequently occurred near the south side of the Tibet Plateau at the mid and low latitudes. The posterior part of the shallow trough over the northeast China, together with the northerly air current in the front weak ridge over Tibet, drives the permeation of the ground cold air, which converges over the Dongting Lake Basin with the warm and wet air in the shallow trough of the Southern Tibet Plateau, bringing precipitation. Looking from the height field difference between the peak year and the valley year, the trough ridges at the mid- and high-latitudes were stronger in the peak year, which was more conductive to the permeation of the cold air, and at the same time, the subtropical high strength was stronger, which is beneficial to the transmission of water vapor and heat. Therefore, there were better water vapor and heat conditions in the peak year.
It is worth noting that in the figure, the European region was a positive anomaly, the area from the eastern Ural Mountains to West Siberia was a negative anomaly, and that from the Central Asia to East Siberia was a positive anomaly. At this time, the teleconnection pattern of “+ ‡ +” formed from Europe, the Ural Mountains and East Asian region. The high-pressure ridge of the Ural Mountains was weaker as well as the upper trough located from Europe and Mongolia to the Tibet Plateau, so the radial circular flow was decreased, thus weakening the monsoon circulation. Cyclonic anomalies often occur over Dongting Lake, which is helpful for the convergence of the water vapor in the lower atmosphere. It can be drawn that the EU teleconnection pattern has an obvious performance in the 500 hPa height field in the Dongting Lake Basin, which can affect the trough ridge strength over East Asia, and change the convergence and divergence of the water vapor in the lower atmosphere, thus influencing the water vapor source of the Dongting Lake Basin.
From the upper 200 hPa (figure omitted), the westerly current prevails in the north of 30°N, and the high-pressure center in South Asia is located near 90°E and 20°N. The Dongting Lake Basin lies in the divergence current on the northeast side of the high pressure, which is conducive to the maintenance of the ascending motion. Looking from the wind field difference map in the peak year and the valley year (Figure 8), there exists apparent divergence areas of wind direction and speed over the Dongting Lake Basin. The divergence in the higher atmosphere helps the maintenance and reinforcement of the ascending motion, which indicates that there are better dynamic conditions for precipitation in the peak year.
On account that the water vapor in the atmosphere mainly centered at 850 hPa, the wind field variation plays an important role in the water vapor source during the flood season in the Dongting Lake Basin. Therefore, through analysis of the wind field difference map in the peak years and the valley years (Figure 9), it was found that there are distinct wind speed convergence and cyclonic rotation over the Dongting Lake Basin, showing that there was a better water vapor convergence in the peak years, which is beneficial for the lifting of the water vapor convergence in the lower atmosphere. The feature of low level convergence and high level divergence facilitate the maintenance of the ascending motion, increasing precipitation.

4. Summary and Discussion

In this paper, 15 CMIP5 models under the RCP4.5 scenario were used to evaluate the applicability of precipitation data for the time period 2006–2019 for which reliable observation data are available; then, the models with good performance were selected to predict the flood precipitation in Dongting Lake Basin for the next 30 years. The results show that:
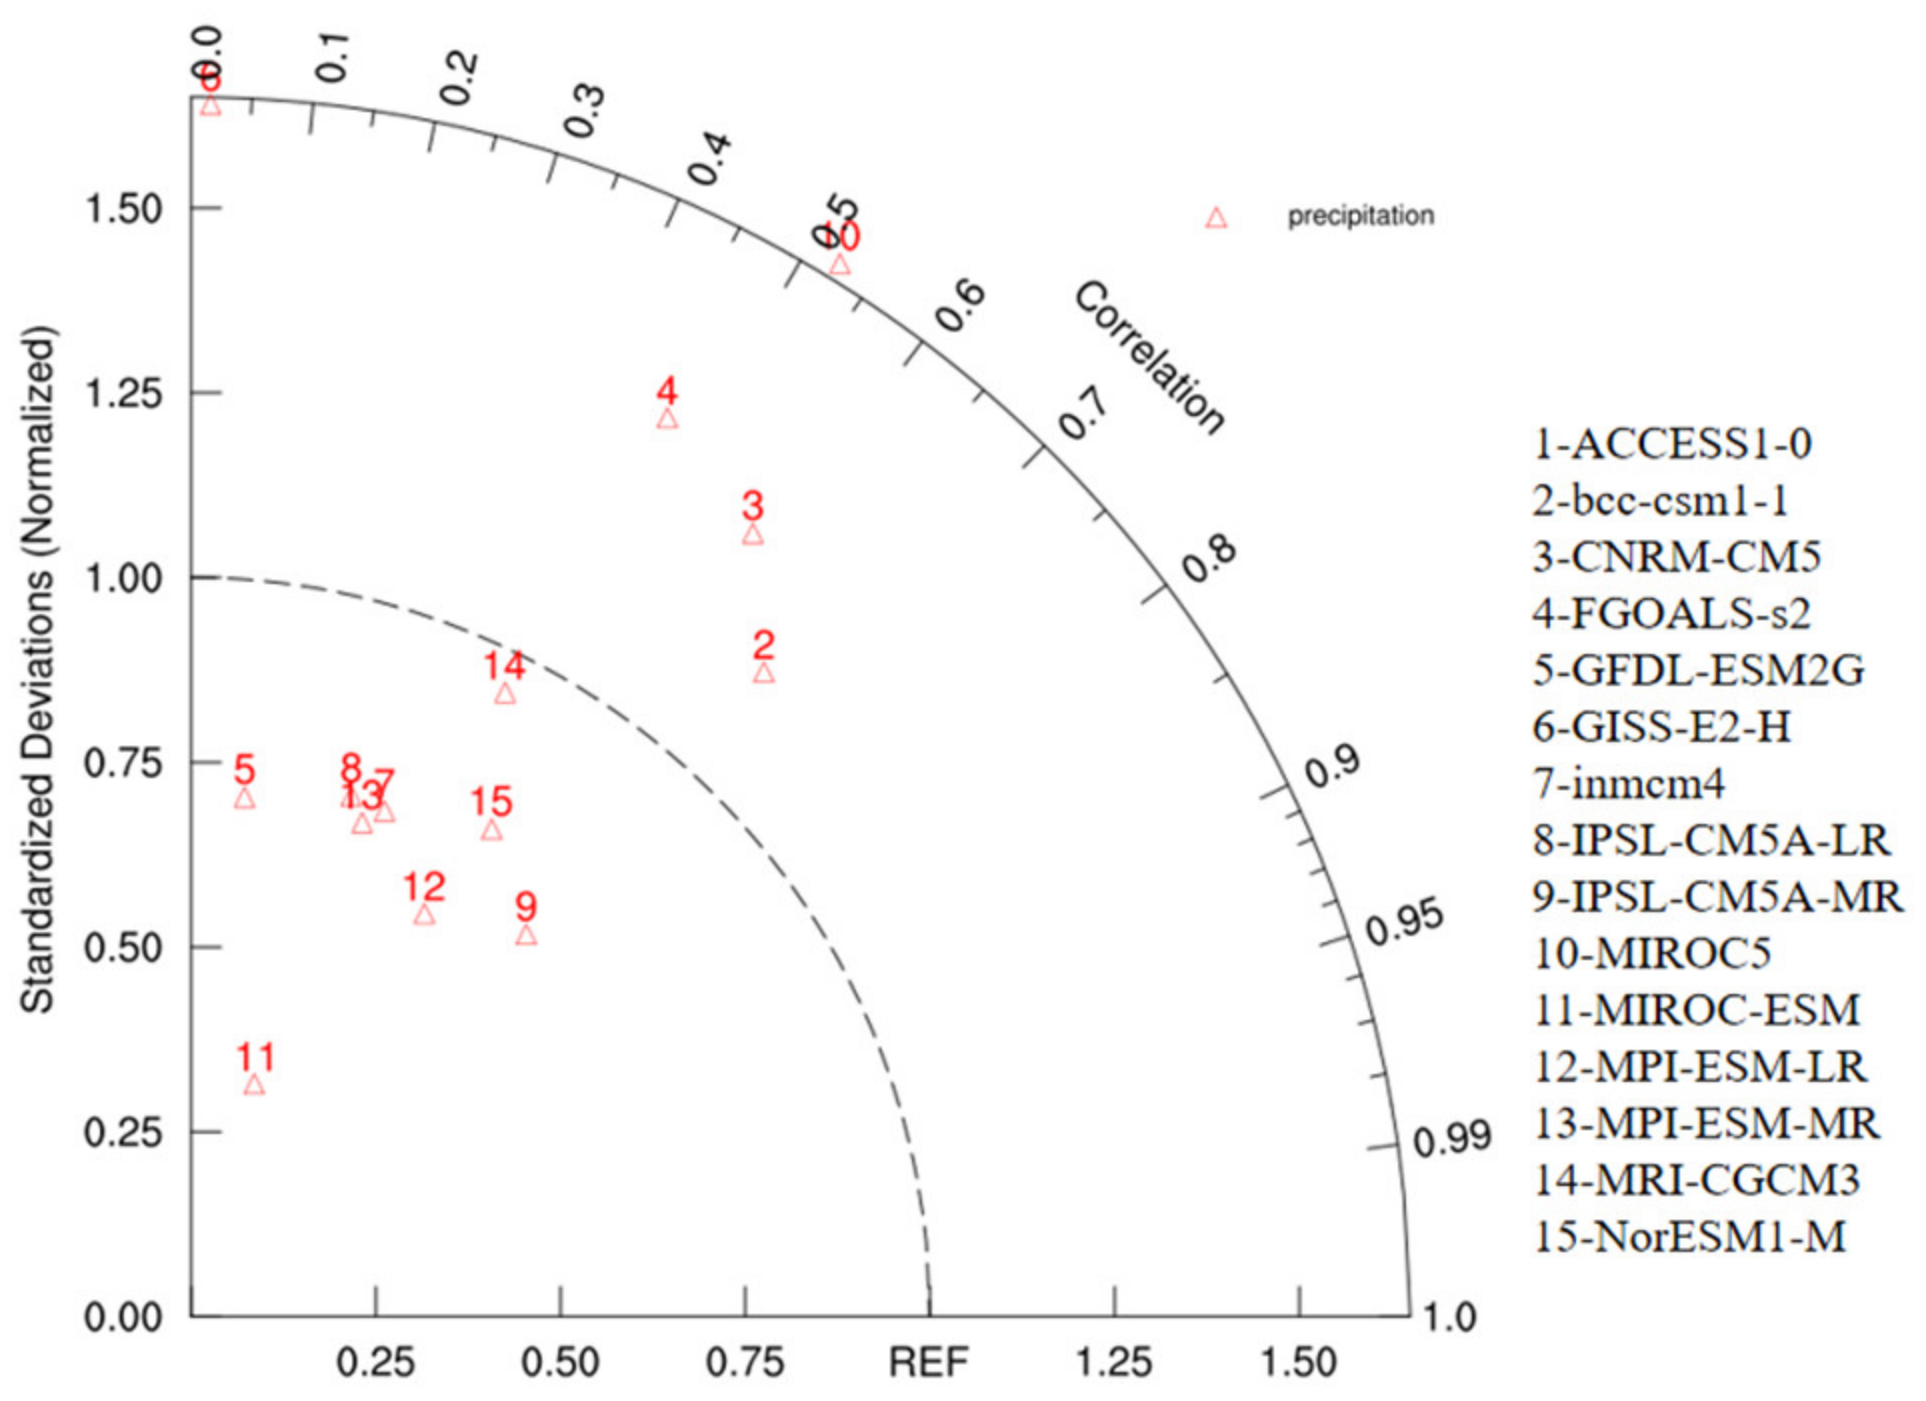
  • Most of the models showed good performance ability for flood precipitation in Dongting Lake Basin during 2006–2019, but the spatial correlation was relatively low. The models that performed well by evaluation were inmcm4, MPI-ESM-LR, MPI-ESM-MR, and NorESM1-M, and the models that performed poorly were ACCESS1-0, GISS-E2-H, and MIROC5.
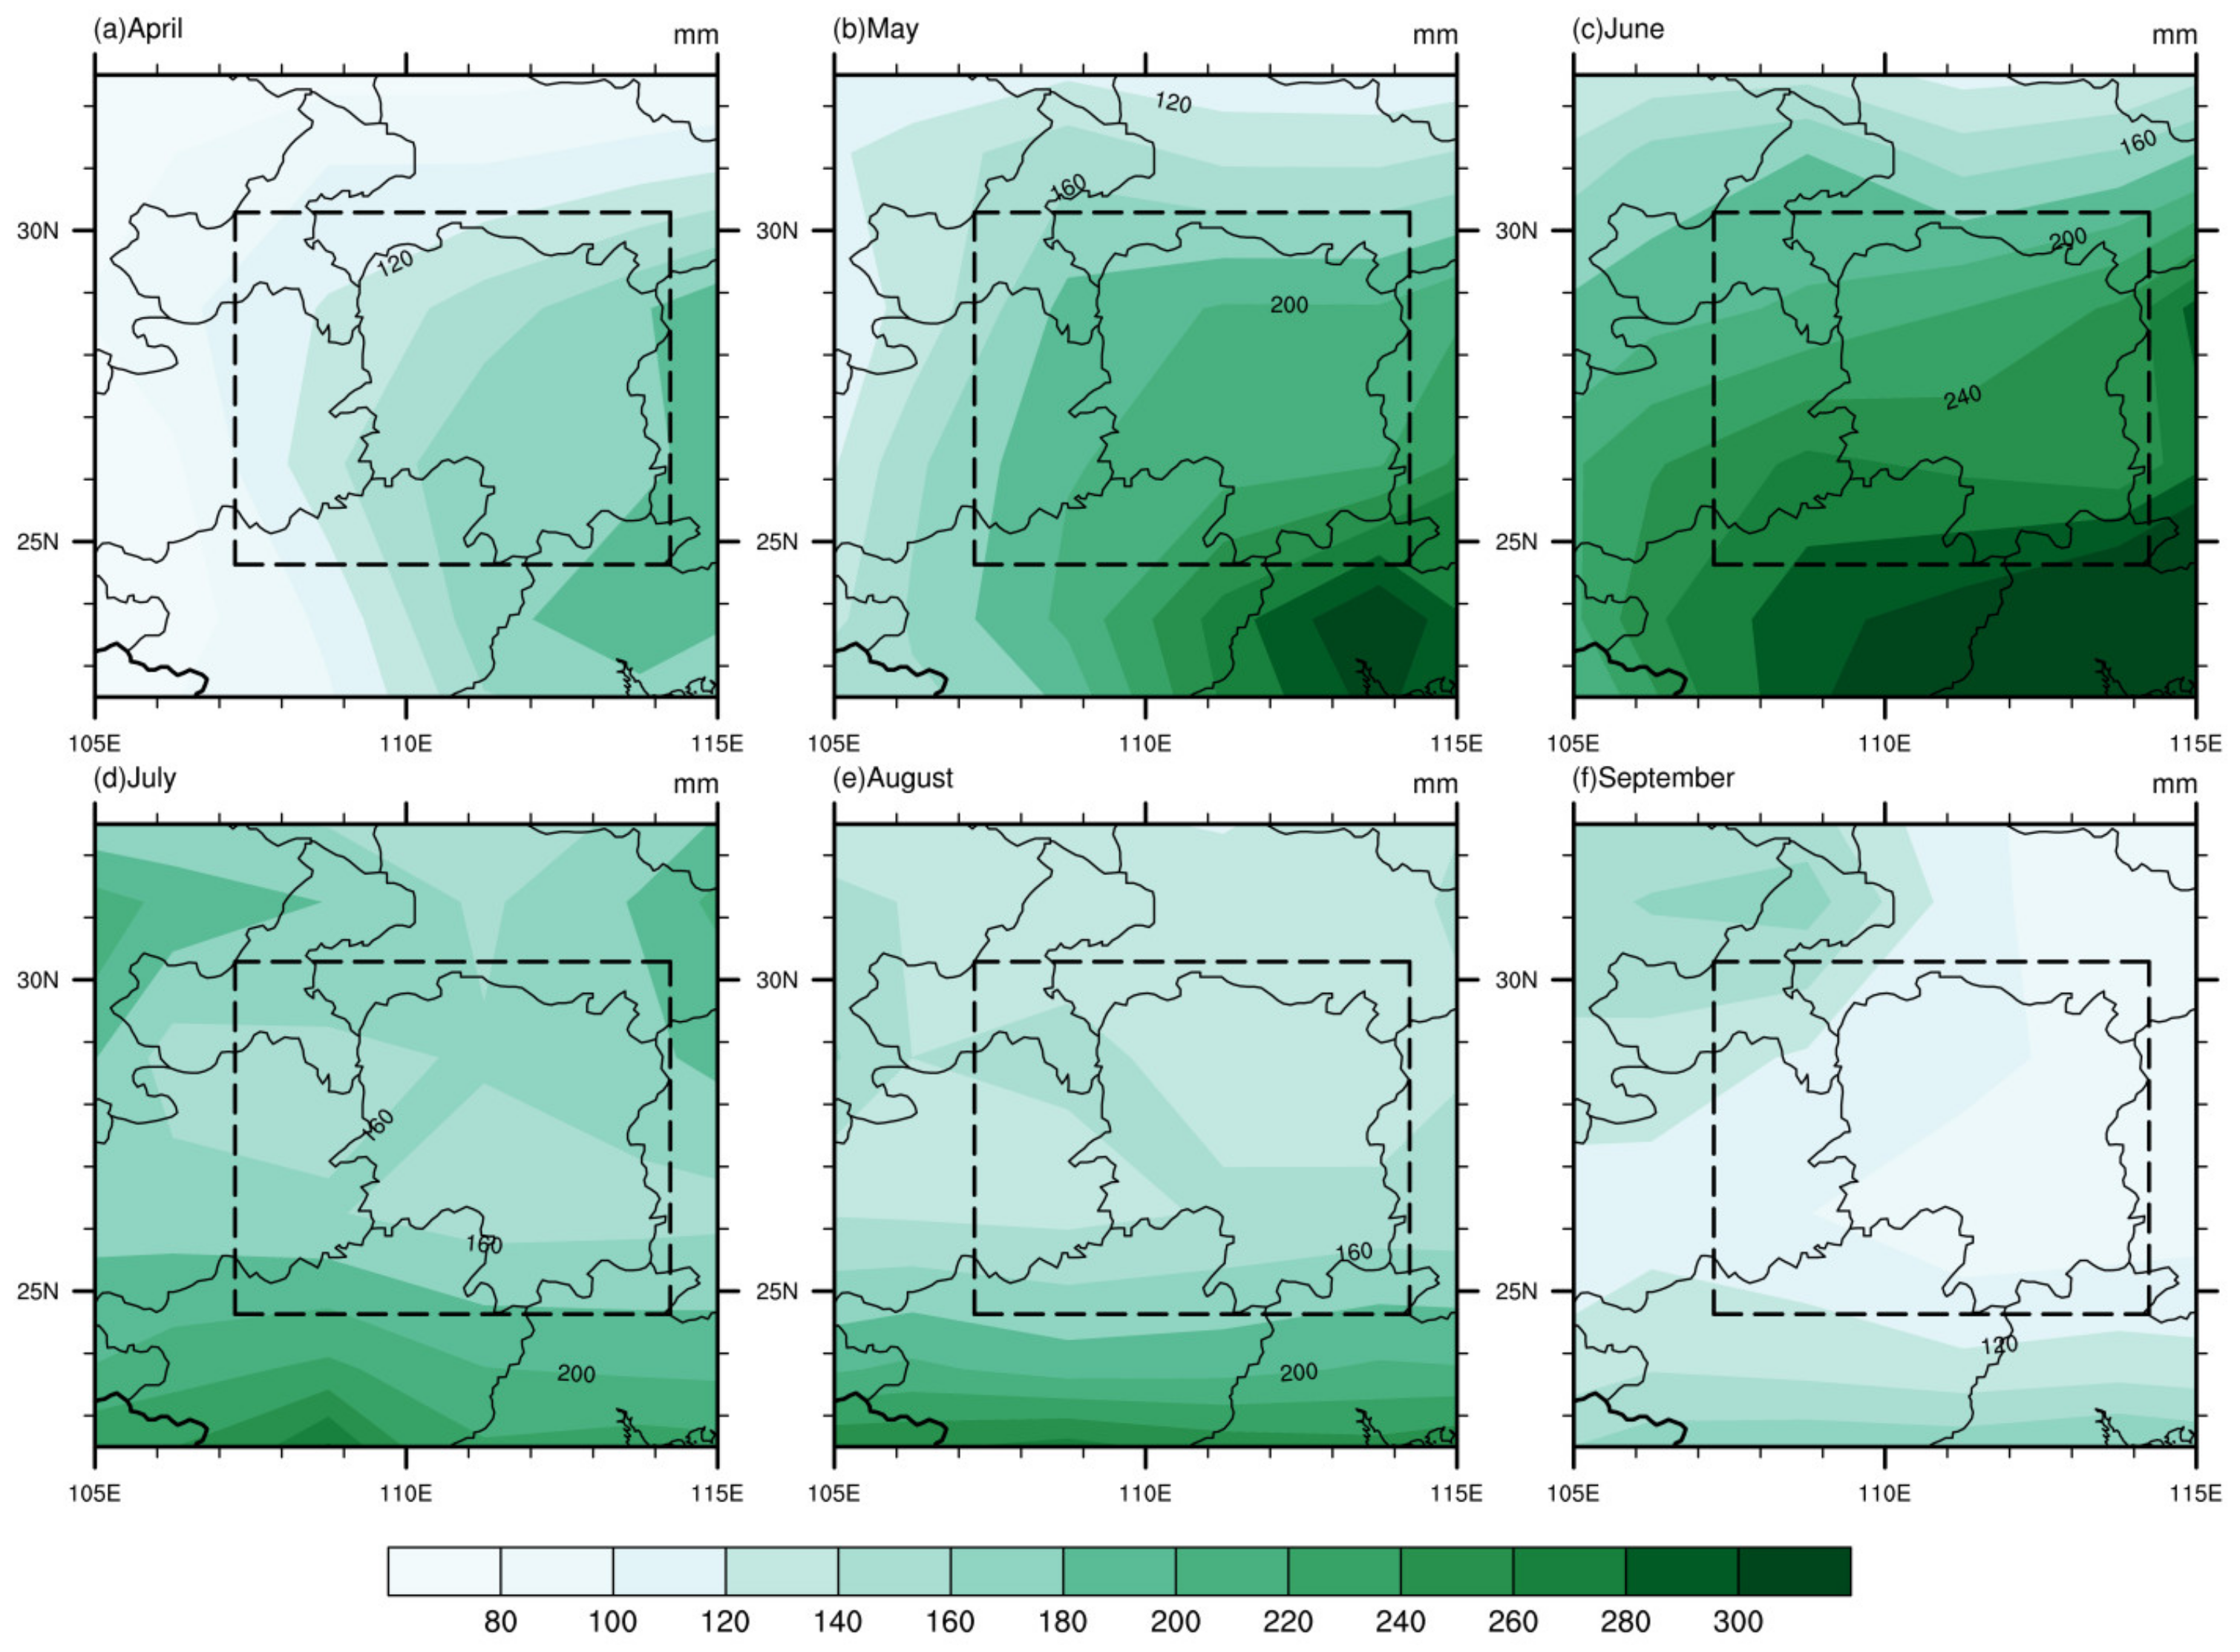
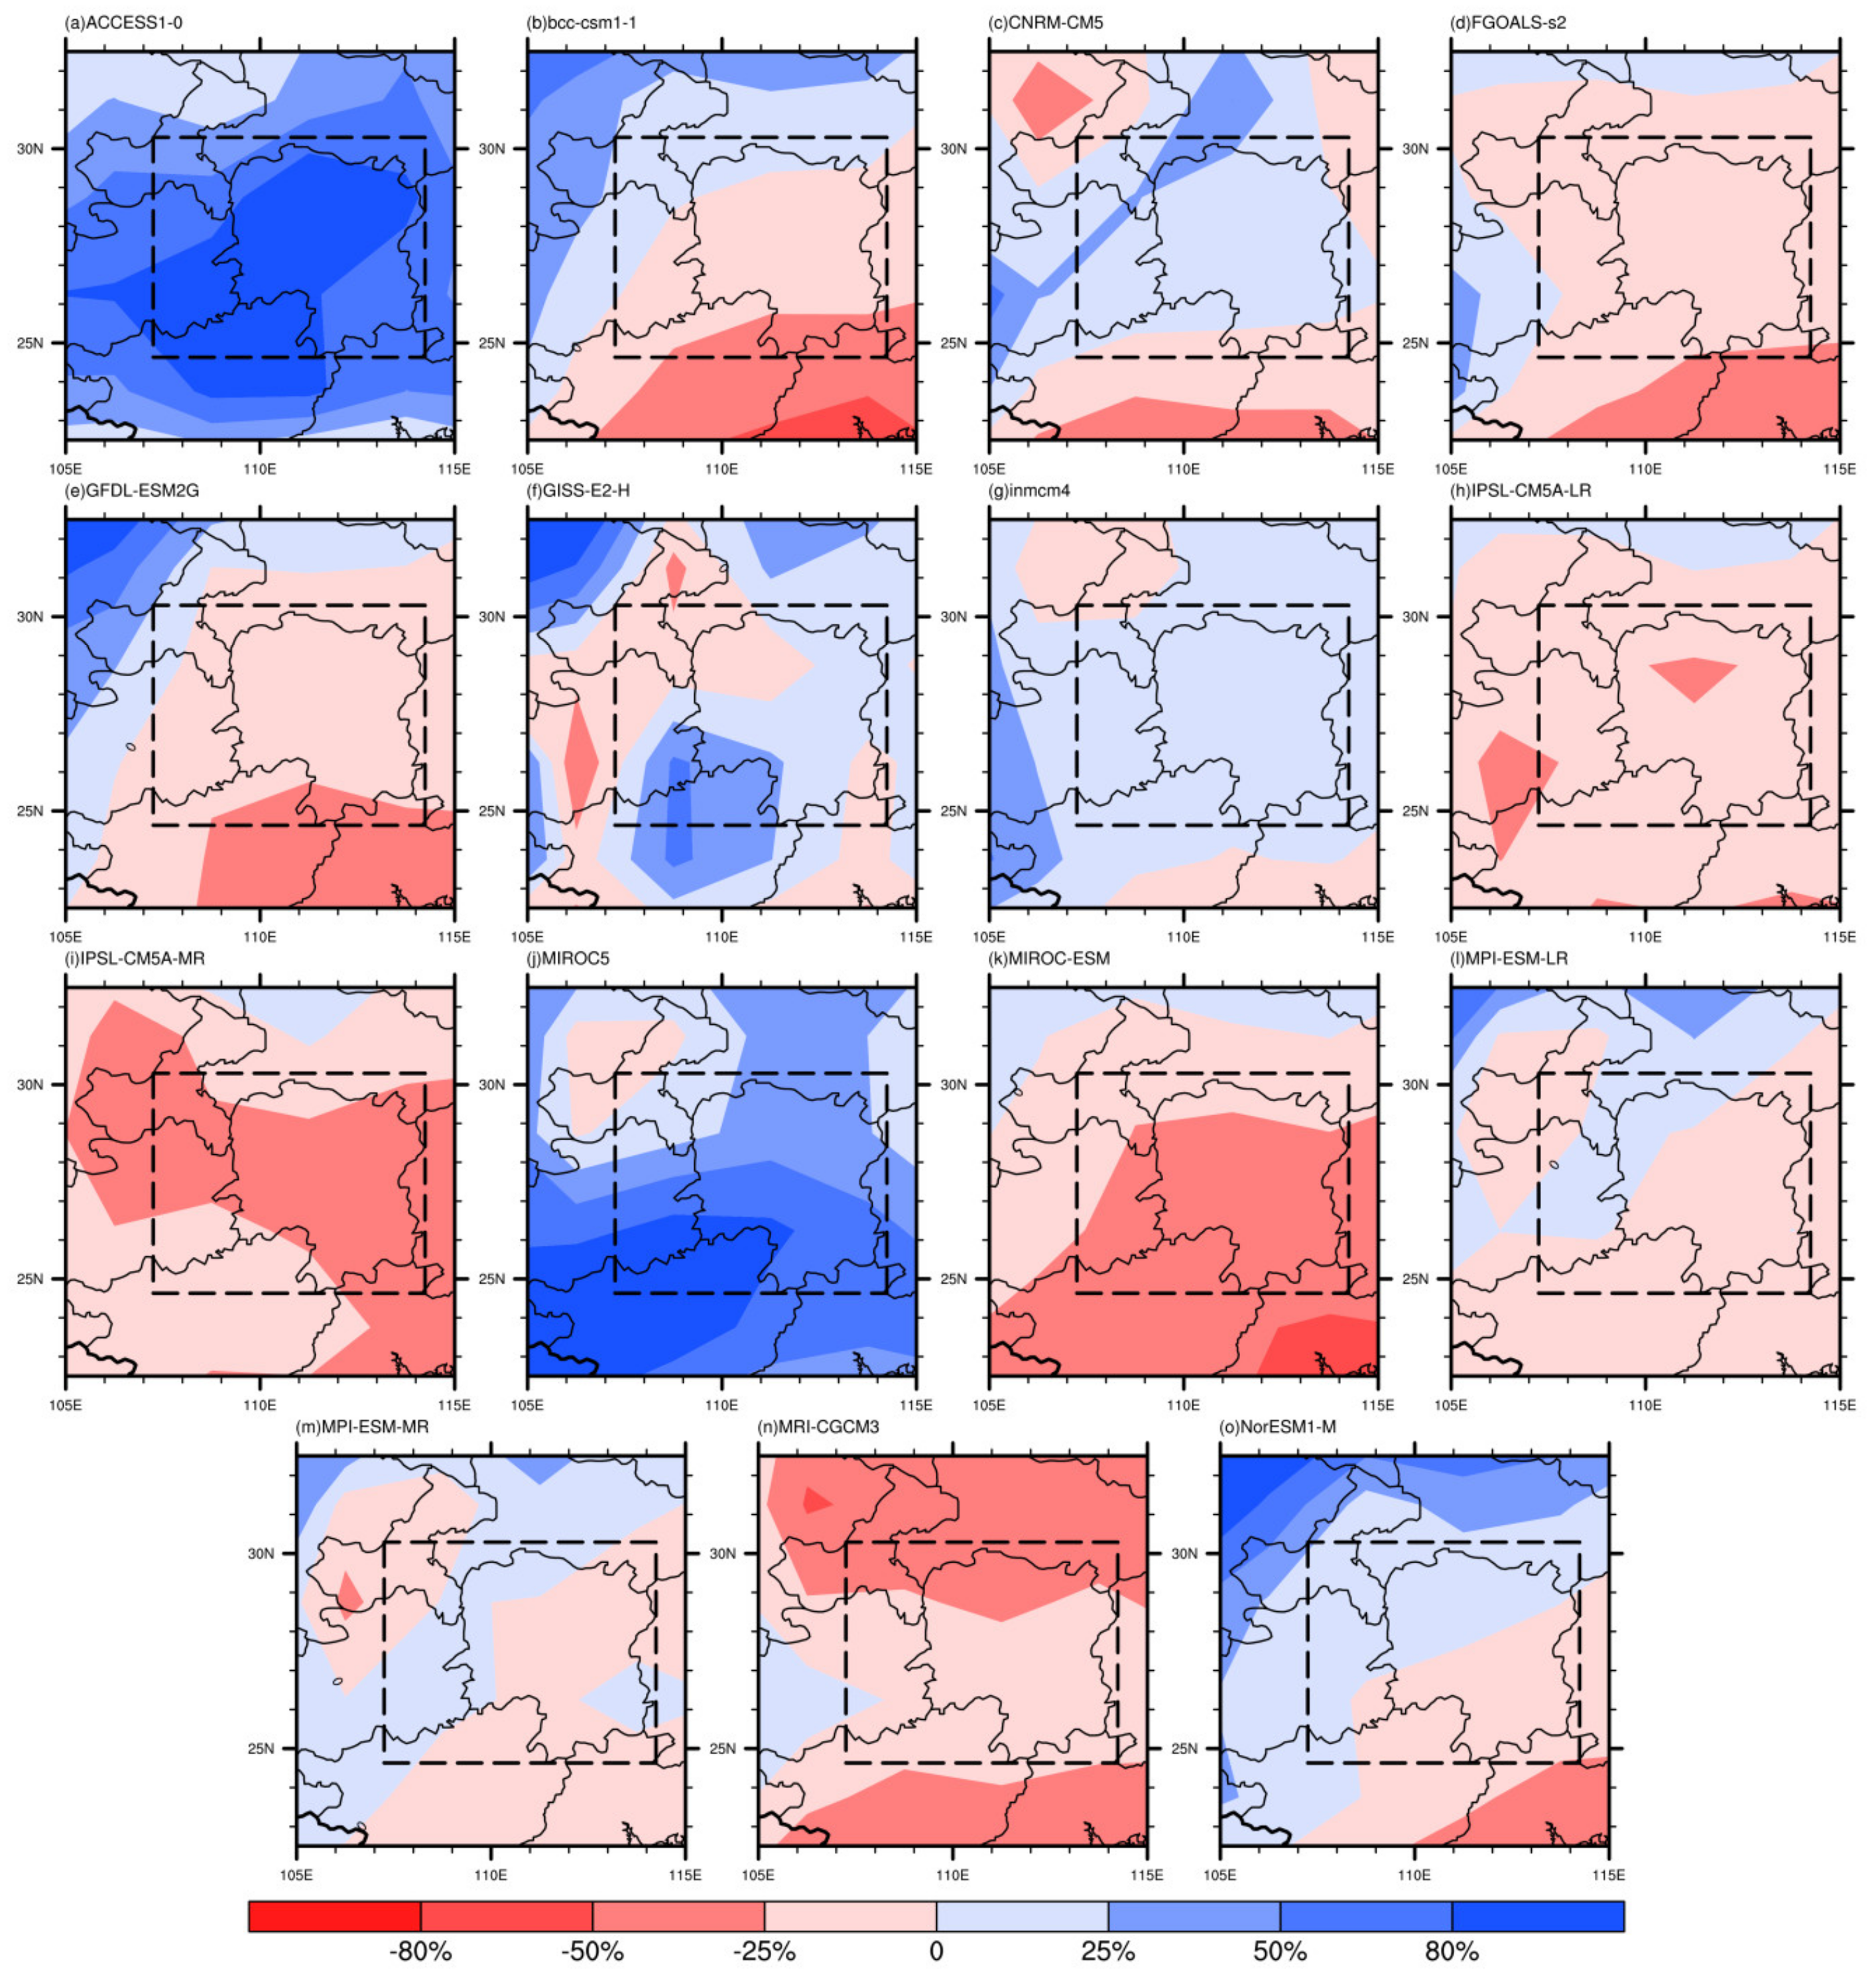
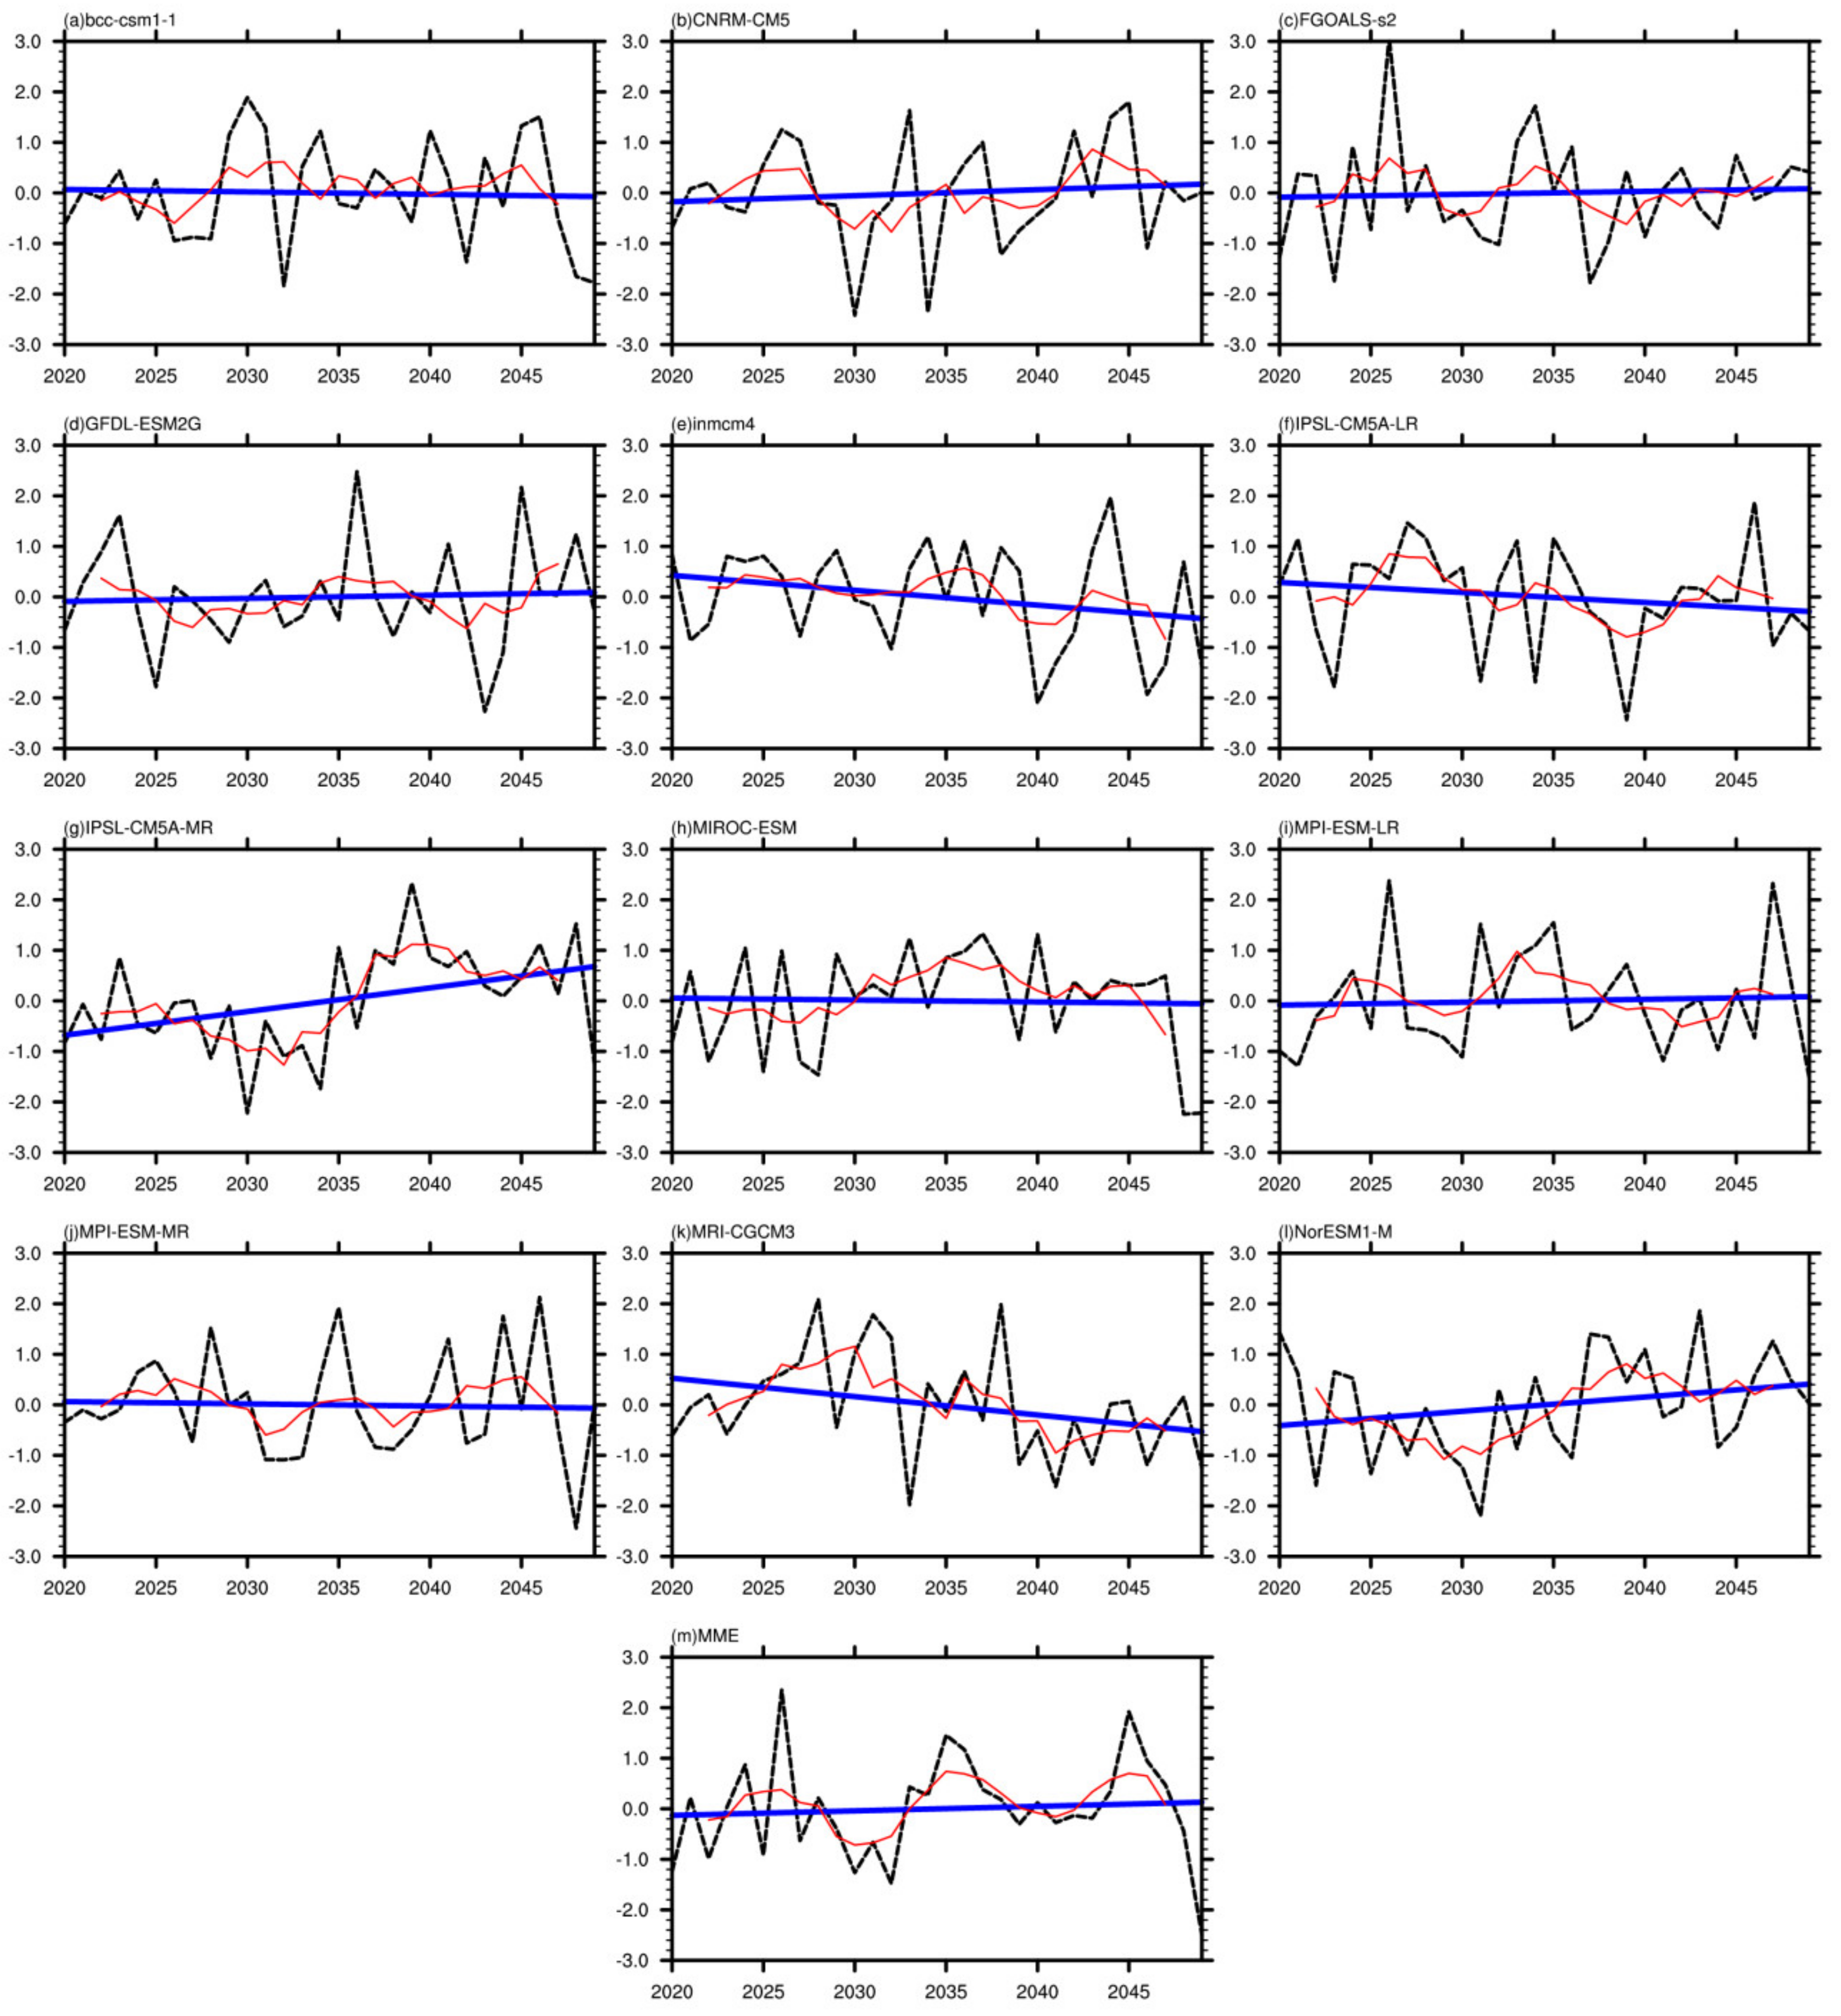
  • Seen from the analysis of the precipitation prediction trend from 2020 to 2049, most models showed an increasing trend in future precipitation prediction in the Dongting Lake Basin, while the MME showed a slow growth trend, with an average growth rate of 0.8 mm/year. Looking from the monthly prediction trend, the precipitation showed an increasing trend in April, and a weakening trend in May; the precipitation prediction presented a rising trend on the whole in June and July, but a declining trend in a small range of areas; the August and September trend distributions were relatively similar; the northeastern precipitation showed a weakening trend, while other areas showed an increasing trend.
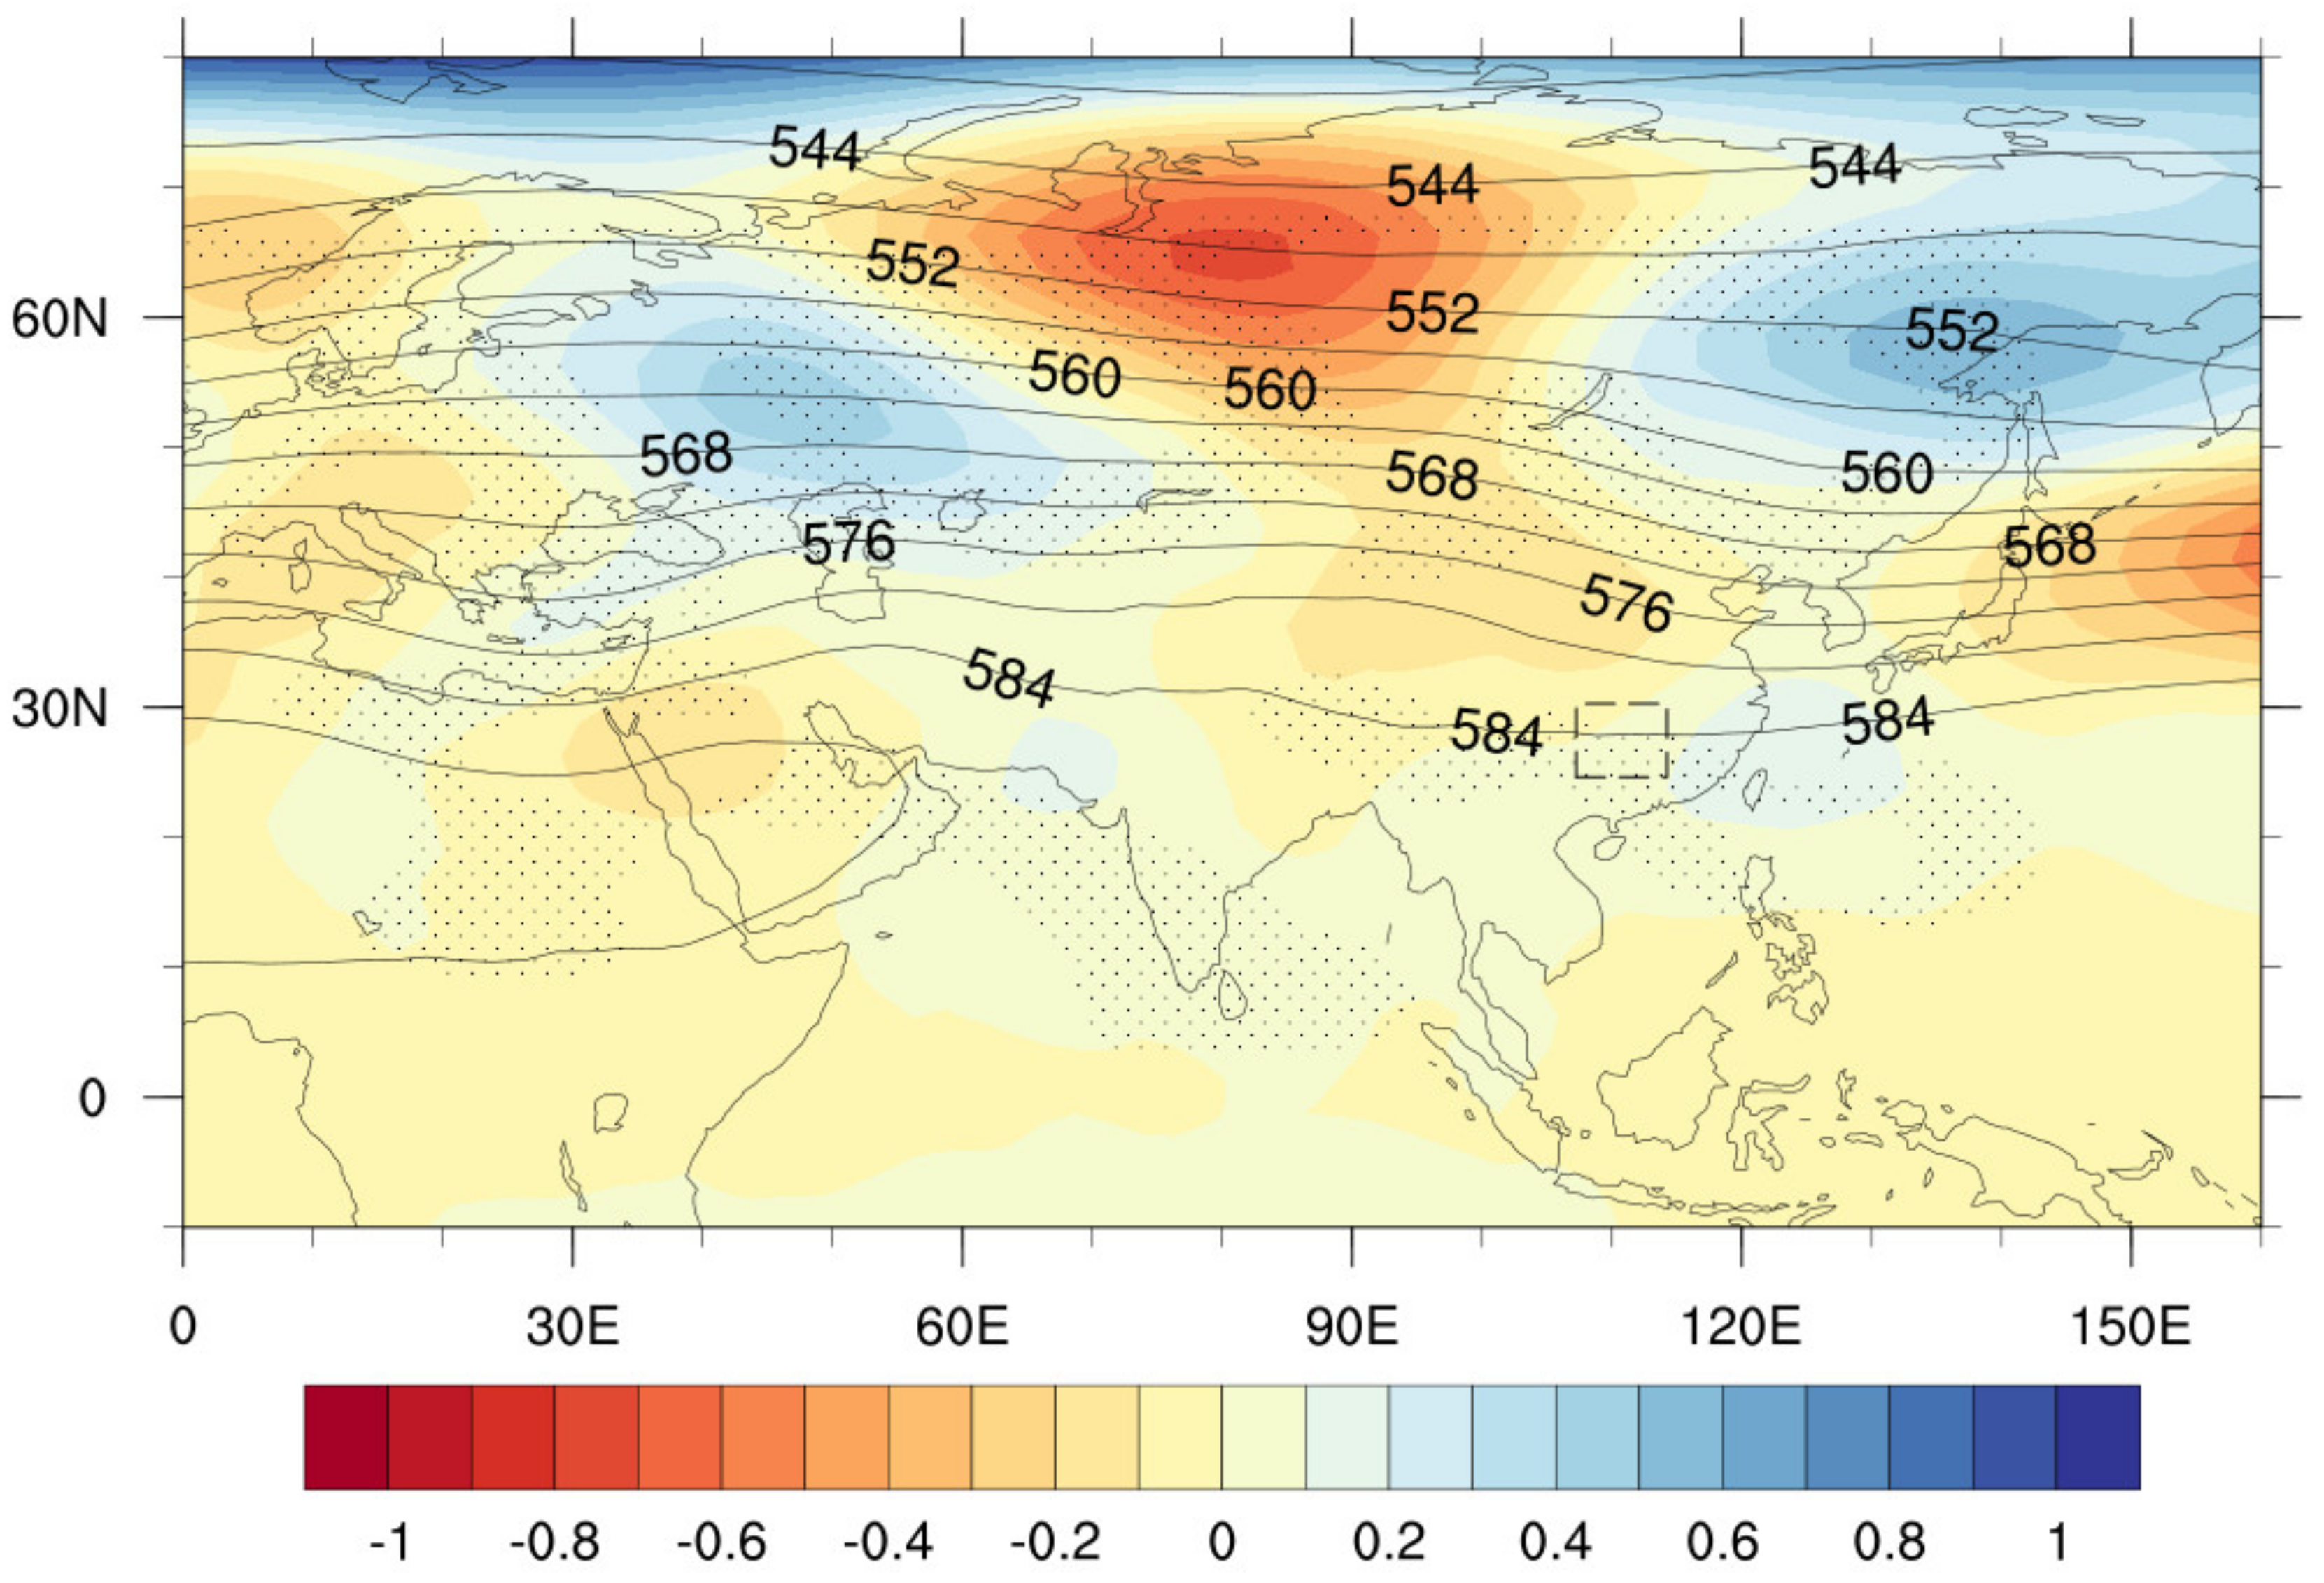
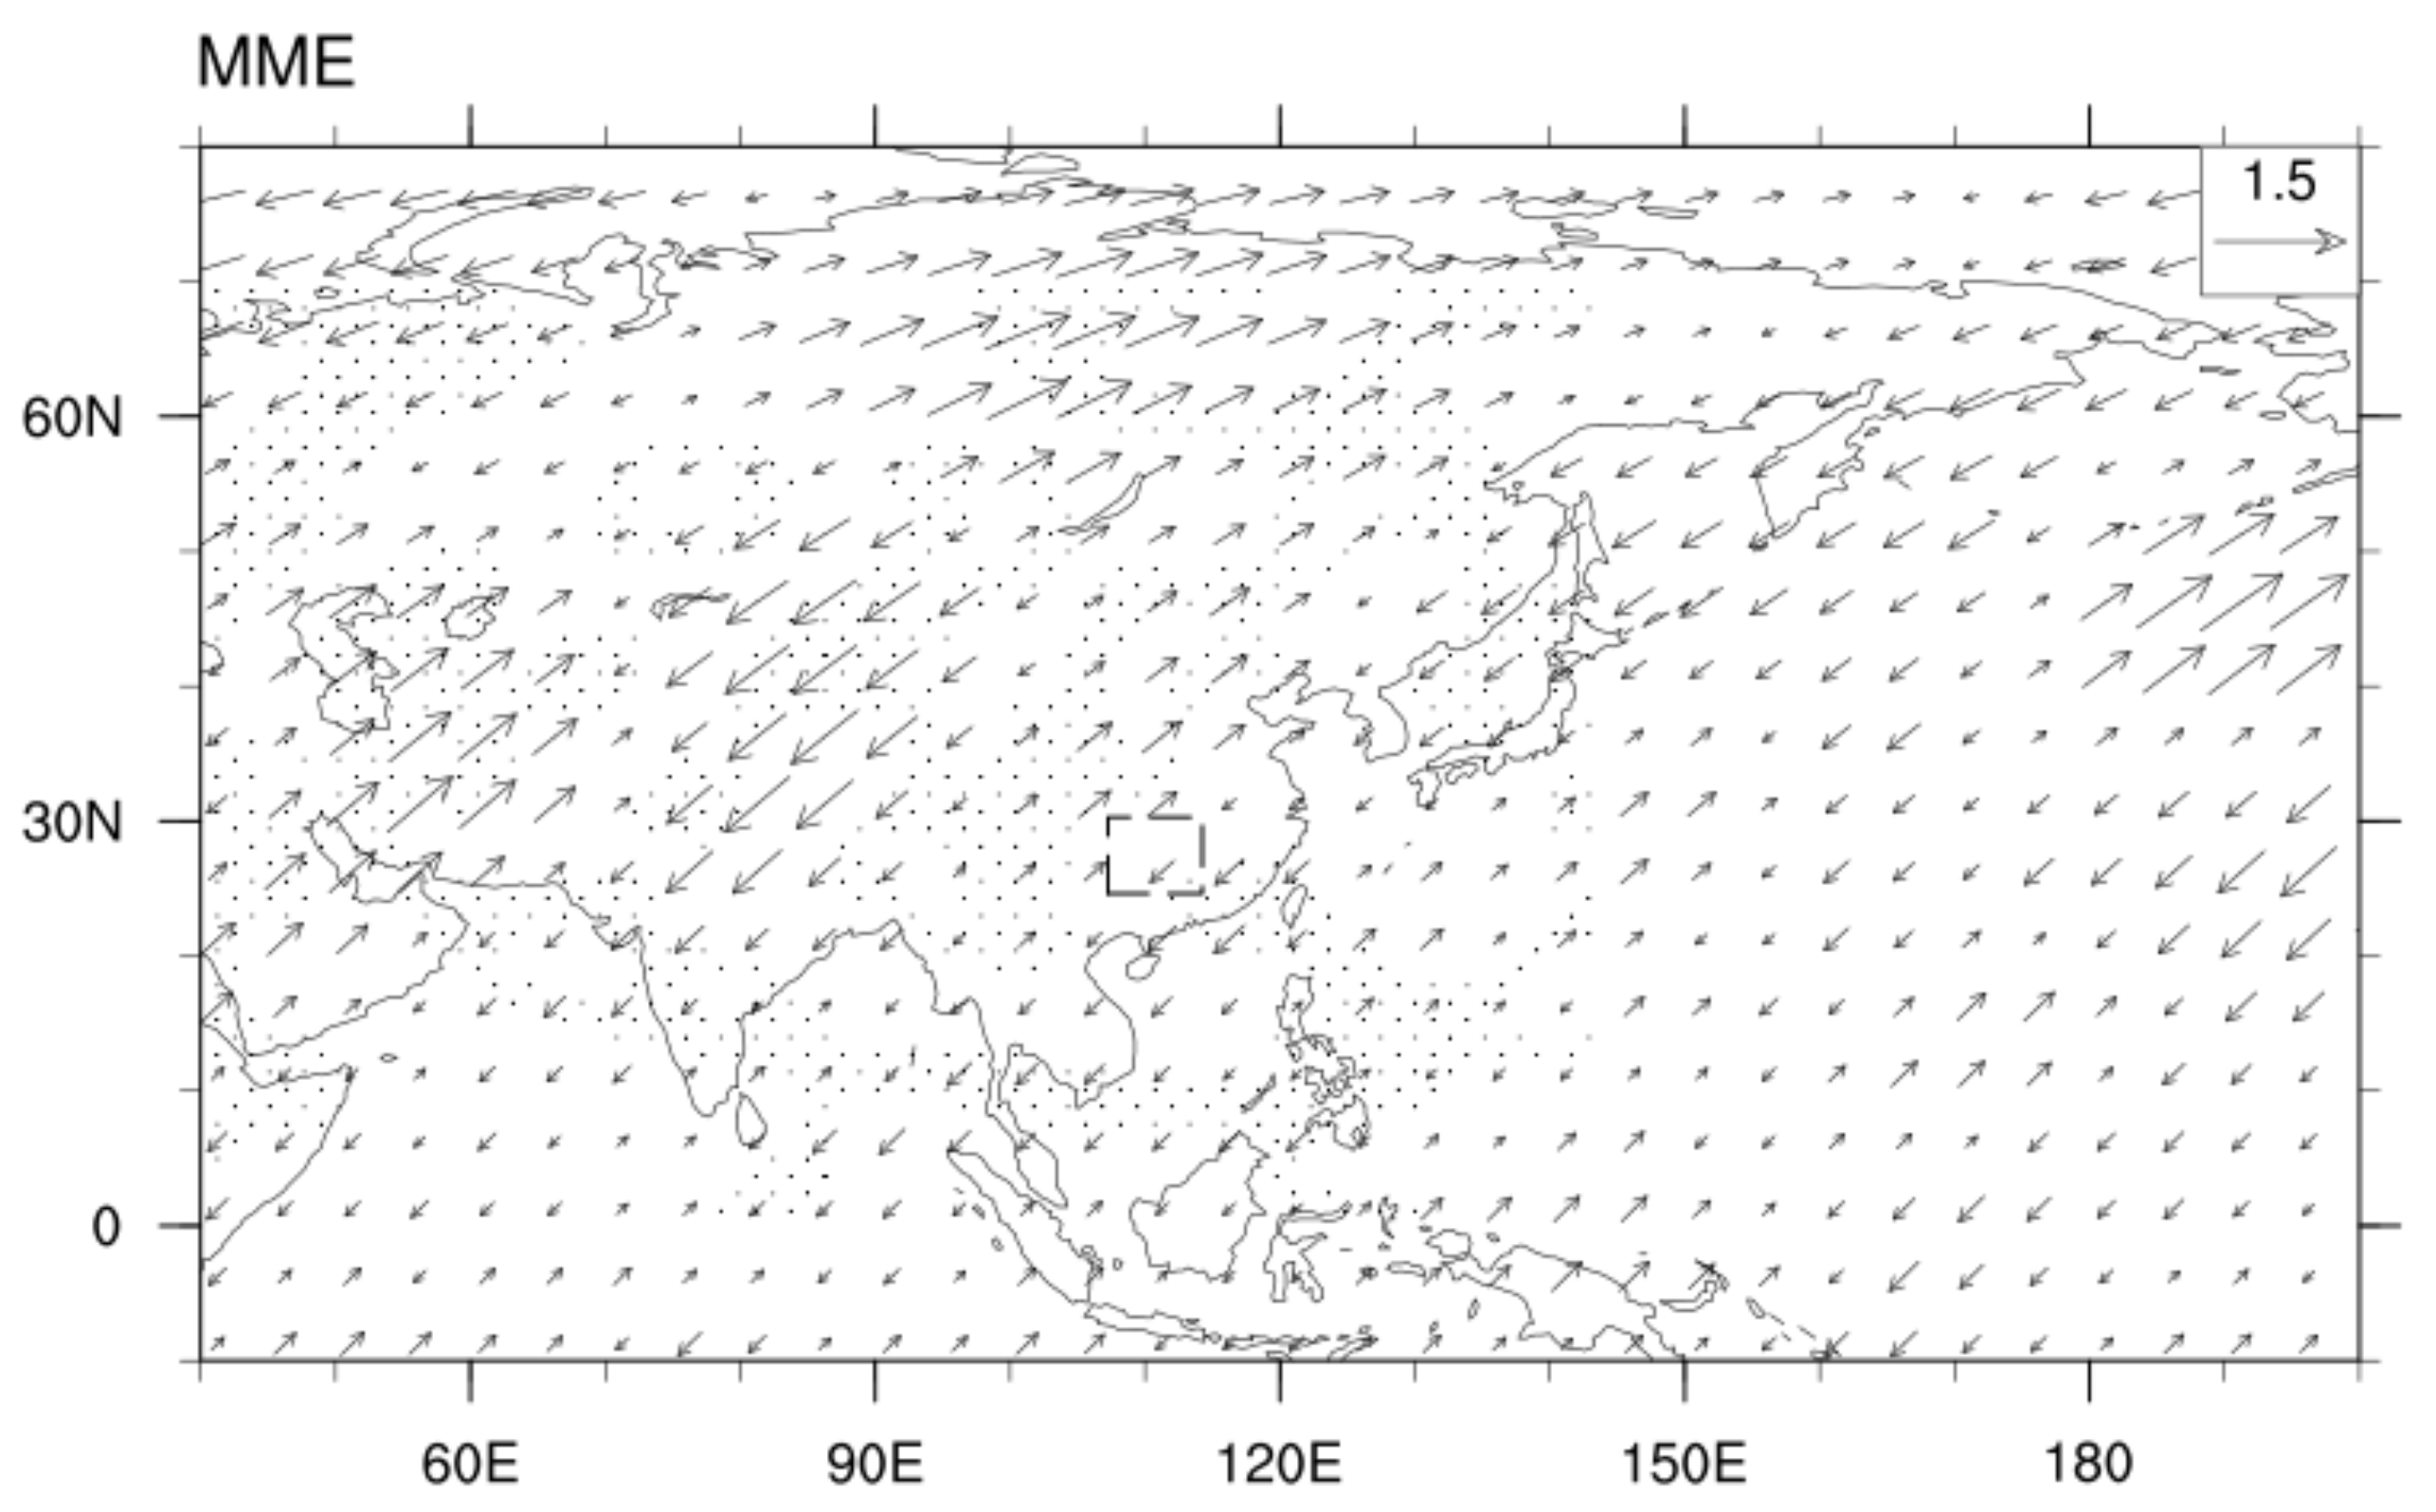
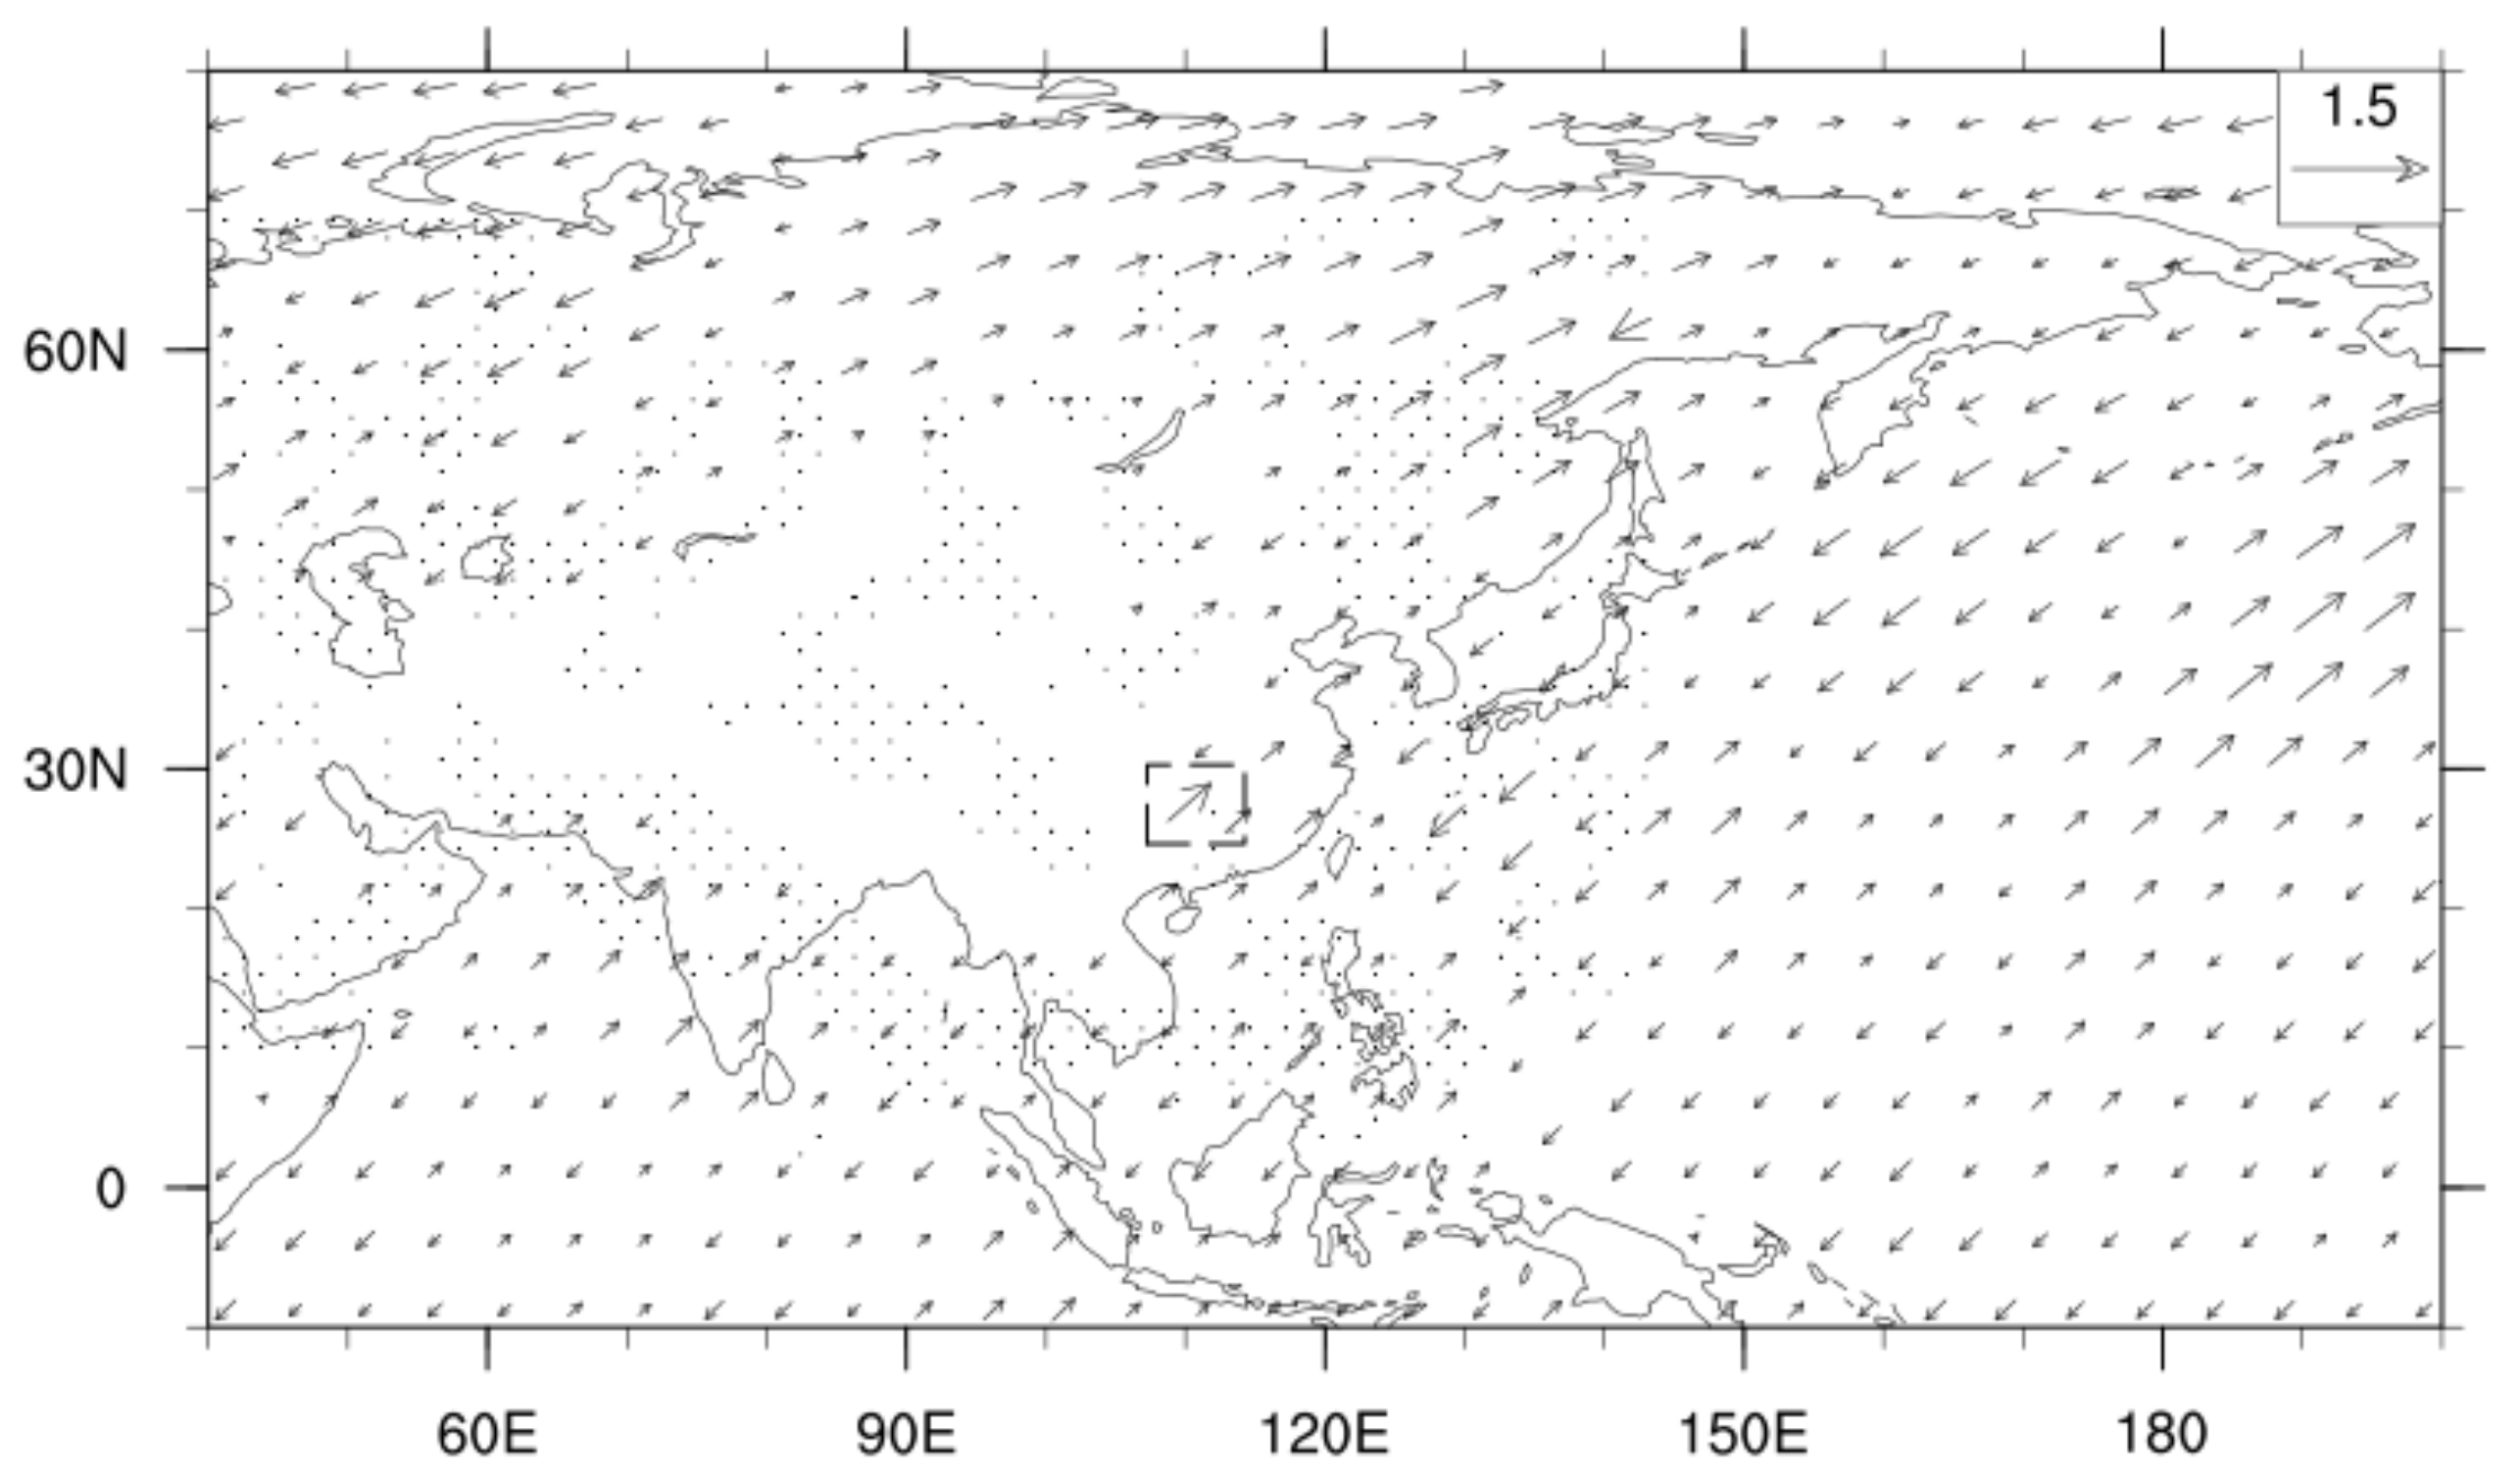
  • There were obvious interannual and interdecadal variations in the future flood precipitation in the Dongting Lake Basin, showing a “peak–valley–peak–valley” pattern of change. The analysis of the circulation field in the peak and valley years showed that the interannual variation of precipitation was closely related to the large-scale circulation field, and the features of low-level convergence and high-level divergence had an obviously stronger effect compared with the inactive years; moreover, the teleconnection pattern of “+ − +” formed from Europe, the Ural Mountains, and East Asian region clearly manifested in the height field of 500 hPa in the Dongting Lake Basin, which can affect the trough ridge strength over East Asia, and change the convergence and divergence of the water vapor in the lower atmosphere, thus influencing the water vapor source of the Dongting Lake Basin.
  • In the context of global warming, the water resources situation of Dongting Lake has changed significantly, especially after the Yangtze River entered the post Three Gorges era, the traditional river–lake relationship and the climate ecosystem of the Dongting Lake region have undergone radical changes. Factors such as water storage in the Three Gorges, water coming from Yangtze River, and precipitation in four water basins will have important impacts on the Dongting Lake Basin. Flood precipitation is only one part of this, but it has a significant impact on the natural environment and human activities. This study evaluated the performance of climate models in capturing historical precipitation and the range of uncertainty in future projections to provide more information on the expected precipitation changes, which can be useful for water resource management in the Dongting Lake Basin and can also provide a reference for subsequent studies assessing or predicting precipitation in the Dongting Lake Basin. One shortcoming of this article is that only statistical methods were used to predict precipitation in the Dongting Lake Basin during the flood season, and more methods can be used in future studies to reduce the uncertainty of future predictions. It is worth noting that the use of methods such as downscaling of the data in model assessment or prognosis of basin scale will make the results more convincing, which is also planned in future research. Another shortcoming is that the latest CMIP6 model information was not used because there have been few studies on the model assessment or prognosis of the Dongting Lake Basin. The CMIP5 model information used in this paper to conduct the study can be used as a basis for future studies.

Author Contributions

Funding acquisition, J.P. and H.Z.; Formal analysis, S.J.; Validation, N.R. and W.W.; Writing—original draft, Y.Y. All authors have read and agreed to the published version of the manuscript.

Funding

This research was funded by [Impacts of climate change on water resources in Dongting Lake], grant number [CCSF201946]; [Impact-based meteorological risk warning and forecasting technology for urban flooding in Yueyang], grant number [XQKJ20A005] and [The application of multi-source meteorological information in thunderstorm catastrophic weather forecasting], grant number [XQKJ21B021].

Institutional Review Board Statement

Not applicable.

Informed Consent Statement

Informed consent was obtained from all subjects involved in the study.

Data Availability Statement

The CMIP5 data can be directly downloaded at https://esgf-node.llnl.gov/projects/cmip5/, accessed on 30 October 2017. The NCEP/NCAR data can be downloaded at http://www.cdc.noaa.gov, accessed on 15 November 2019.

Conflicts of Interest

The authors declare no conflict of interest.

References

  1. Wentz, F.J.; Ricciardulli, L.; Hilburn, K.; Mears, C. How much more rain will global warming bring? Science 2007, 317, 233–235. [Google Scholar] [CrossRef] [PubMed]
  2. He, C.; Liu, Z.; Hu, A. The transient response of atmospheric and oceanic heat transports to anthropogenic warming. Nat. Clim. Chang. 2019, 9, 222–226. [Google Scholar] [CrossRef]
  3. Sun, X.Y.; Wang, Y.D. Attribution Analysis of Annual Precipitation Simulation Differences and Its Correction of CMIP5 Climate Models on the Chinese Mainland. Atmosphere 2022, 13, 382. [Google Scholar] [CrossRef]
  4. Chen, H.P. Projected change in extreme rainfall events in China by the end of the 21st century using CMIP5 models. Chin. Sci. Bull. 2013, 58, 1462–1472. [Google Scholar] [CrossRef]
  5. Gao, X.J.; Shi, Y.; Zhang, D.F.; Filippo, G. Climate change in China in the 21st century as simulated by a high resolution regional climate model. Chin. Sci. Bull. 2012, 57, 1188–1195. [Google Scholar] [CrossRef]
  6. Ren, Y.J.; Zhou, B.T.; Song, L.C.; Xiao, Y. Interannual variability of western North Pacific subtropical high, East Asian jet and East Asian summer precipitation: CMIP5 simulation and projection. Quat. Int. 2017, 440, 64–70. [Google Scholar] [CrossRef]
  7. Sun, Y.; Ding, Y.H. A projection of future changes in summer precipitation and monsoon in East Asia. Sci. China Ser. D Earth Sci. 2010, 53, 284–300. [Google Scholar] [CrossRef]
  8. Xu, Y.; Xu, C.H. Preliminary assessment of simulations of climate changes over China by CMIP5 multi-models. Atmos. Ocean. Sci. Lett. 2012, 5, 489–494. [Google Scholar] [CrossRef]
  9. Jiang, D.; Tian, Z.; Lang, X. Reliability of climate models for China through the IPCC Third to Fifth Assessment Reports. Int. J. Climatol. 2016, 36, 1114–1133. [Google Scholar] [CrossRef]
  10. Wu, J.; Zhou, B.T.; Xu, Y. Response of precipitation and its extremes over China to warming: CMIP5 simulation and projection. Chin. J. Geophys. 2015, 58, 3048–3060. (In Chinese) [Google Scholar] [CrossRef]
  11. Yao, S.B.; Jiang, D.P.; Fan, G.Z. Projection of precipitation seasonality over China. Chin. J. Atmos. Sci. 2018, 42, 1378–1392. (In Chinese) [Google Scholar] [CrossRef]
  12. Zhou, L.; Lan, M.C.; Cai, R.H.; Huang, J.; Jiang, Z.H. The simulation of extreme precipitation over Hunan province based on the statistical dow nscaling method of transform cumulative distribution function (CDF-t). Plateau Meteorol. 2019, 38, 734–743. (In Chinese) [Google Scholar] [CrossRef]
  13. Jiang, Y.H.; Zeng, X.H.; Duan, L.J.; Tang, J.H.; Wu, J. Variation Characteristics of Precipitation Structure during Flood Season in Hunan Province. J. Arid. Meteorol. 2021, 39, 554. [Google Scholar]
  14. Yang, Y.; Dai, X.G.; Tong, H.W.; Zhang, B. CMIP5 Model Precipitation Bias-correction Methods and Projected China Precipitation for the Next 30 Years. Clim. Environ. Res. 2019, 24, 769–784. (In Chinese) [Google Scholar] [CrossRef]
  15. Chen, X.; Ren, L.L.; Yang, X.L.; Liu, L.J.; Tong, R.; Zhou, M. A CMIP5 Multi-model Estimation of Spatio-temporal Characteristics of Temperature, Precipitation in 7 Regions of China. J. China Hydrol. 2016, 36, 37–43. (In Chinese) [Google Scholar]
  16. Guo, R.; Zhu, Y.; Liu, Y. A comparison Study of precipitation in the poyang and the Dongting Lake Basins from 1960–2015. Sci. Rep. 2020, 10, 3381. [Google Scholar] [CrossRef]
  17. Wang, G.; Jiang, T.; Wang, Y.; Zhao, Y.U. Characteristics of climate change in the lake dongting basin (1961–2003). J. Lake Sci. 2006, 18, 470–475. [Google Scholar]
  18. Nusrat, A.; Gabriel, H.F.; e Habiba, U.; Rehman, H.U.; Haider, S.; Ahmad, S.; Shahid, M.; Ahmed Jamal, S.; Ali, J. Plausible Precipitation Trends over the Large River Basins of Pakistan in Twenty First Century. Atmosphere 2022, 13, 190. [Google Scholar] [CrossRef]
  19. Miró, J.J.; Estrela, M.J.; Olcina-Cantos, J.; Martin-Vide, J. Future Projection of Precipitation Changes in the Júcar and Segura River Basins (Iberian Peninsula) by CMIP5 GCMs Local Downscaling. Atmosphere 2021, 12, 879. [Google Scholar] [CrossRef]
  20. He, C.; Liu, Z.; Otto-Bliesner, B.L.; Brady, E.C.; Zhu, C.; Tomas, R.; Gu, S.; Han, J.; Jin, Y. Deglacial variability of South China hydroclimate heavily contributed by autumn rainfall. Nat. Commun. 2021, 12, 5875. [Google Scholar] [CrossRef]
  21. He, C.; Liu, Z.; Otto-Bliesner, B.L.; Brady, E.C.; Zhu, C.; Tomas, R.; Clark, P.U.; Zhu, J.; Jahn, A.; Gu, S. Hydroclimate footprint of pan-Asian monsoon water isotope during the last deglaciation. Sci. Adv. 2021, 7, eabe2611. [Google Scholar] [CrossRef] [PubMed]
  22. Wen, Q.; Liu, Z.; Zhu, J.; Yan, M.; He, C.; Han, J.; Liu, J.; Liang, Y. Local Insolation Drives Afro-Asian Monsoon at Orbital-Scale in Holocene. Geophys. Res. Lett. 2022, 49, e2021GL097661. [Google Scholar] [CrossRef]
  23. Ou, C.; Li, J.; Zhou, Y.; Cheng, W.; Yang, Y.; Zhao, Z. Evolution characters of water exchange abilities between Dongting Lake and Yangtze River. J. Geogr. Sci. 2014, 24, 731–745. [Google Scholar] [CrossRef] [Green Version]
  24. Yang, S.Y.; Yang, D.W.; Zhao, B.X.; Ma, T.; Lu, W.W.; Jerasorn, S. Future Changes in High and Low Flows under the Impacts of Climate and Land Use Changes in the Jiulong River Basin of Southeast China. Atmosphere 2002, 13, 150. [Google Scholar] [CrossRef]
  25. Sun, J.Q.; Ao, J. Changes in precipitation and extreme precipitation in a warming environment in China. Chin. Sci. Bull. 2013, 58, 1395–1401. [Google Scholar] [CrossRef]
  26. Zhou, B.T.; Wen, Q.H.; Xu, Y.; Song, L.; Zhang, X. Projected changes in temperature and precipitation extremes in China by the CMIP5 multimodel ensembles. J. Clim. 2014, 27, 6591–6611. [Google Scholar] [CrossRef]
  27. Wang, Y.J.; Zhou, B.T.; Qin, D.H.; Wu, J.; Gao, R.; Song, L. Changes in mean and extreme temperature and precipitation over the arid region of northwestern China: Observation and projection. Adv. Atmos. Sci. 2017, 34, 289–305. [Google Scholar] [CrossRef]
  28. Xu, Y.; Xu, C.; Gao, X.; Luo, Y. Projected changes in temperature and precipitation extremes over the Yangtze River basin of China in the 21st century. Quat. Int. 2009, 208, 44–52. [Google Scholar] [CrossRef]
  29. Zhao, L.; Liu, J.; Jin, C.H. Evaluation and projection of climate change in Jiangsu Province based on the CMIP5 multi-model ensemble mean datasets. J. Meteorol. Sci. 2019, 39, 739–746. (In Chinese) [Google Scholar]
  30. Zhang, J.Y.; Li, Y.; Zhang, D.H.; Chen, Z.H.; Yang, Y. Projected Changes in Extreme Precipitation Events in Guizhou Based on CMIP5 Simulations over the 21st Century. Chin. J. Agrometeorol. 2017, 38, 655–662. (In Chinese) [Google Scholar] [CrossRef]
  31. Yu, X.J.; Li, S.J.; Zhao, Y.; Yao, J.Q.; Li, H.J. Projected Summer Precipitation over Xinjiang by Multi-CMIP5 Models in the Next 30 Years. Desert Oasis Meteorol. 2017, 11, 53–62. (In Chinese) [Google Scholar] [CrossRef]
  32. Yu, H.; Zhou, Y.J.; Li, Q.; Jiang, Q.; Qiu, W.T.; Wu, D.; Cui, X.F. Study on Precipitation and Extreme Precipitation in the Wet Season in Sichuan Basin based on CMIP5 Models. Plateau Meteorol. 2020, 39, 68–79. (In Chinese) [Google Scholar] [CrossRef]
  33. Zhou, L.; Lan, M.C.; Cai, R.H.; Wen, P.; Yao, R.; Yang, Y.Y. Projection and uncertainties of extreme precipitation over the Yangtze River valley in the early 21st Century. Acta Meteorol. Sin. 2018, 76, 47–61. (In Chinese) [Google Scholar] [CrossRef]
  34. Zhou, H.; Khadgi, V.R.; Mao, D.; Xiao, H. Study on projection of water resources of Dongting Lake catchment based on emission scenarios assumptions. Hydrol. Sci. J. 2016, 61, 1791–1800. [Google Scholar] [CrossRef]
  35. Moss, R.H.; Edmonds, J.A.; Hibbard, K.A.; Manning, M.R.; Rose, S.K.; Vuuren, D.V. The next generation of scenarios for climate change research and assessment. Nature 2010, 463, 747–756. [Google Scholar] [CrossRef]
  36. Taylor, K.E.; Stouffer, R.J.; Meehl, G.A. An Overview of CMIP5 and the Experiment Design. Bull. Am. Meteorol. Soc. 2012, 93, 485–498. [Google Scholar] [CrossRef] [Green Version]
Figure 1. Accumulated precipitation in the flood season from 2006 to 2019, unit: mm; The dotted box is the Dongting Lake area (24°63′–30°29′N, 107°25′–114°24′E), the same below.
Atmosphere 13 01571 g001
Figure 2. Monthly precipitation during the flood season from 2006 to 2019, unit: mm.
Atmosphere 13 01571 g002
Figure 3. The percentage of the precipitation anomalies of 15 models in the flood season from 2006 to 2019.
Atmosphere 13 01571 g003
Figure 4. The Taylor diagram of precipitation in the flood season from 2006 to 2019.
Atmosphere 13 01571 g004
Figure 5. Trends of precipitation in the flood season from 2020–2049 for 12 models and MME, black line: Regional average in Dongting Lake Basin; red line: Five-year moving average; blue line: linear trend.
Atmosphere 13 01571 g005
Figure 6. Trend distribution of the precipitation, unit: mm/year; the dotted area indicates that it passed the 95% significance test.
Atmosphere 13 01571 g006
Figure 7. The 500 hPa height field of MME over the next 30 years (contour), the difference between the peak years and valley years (shaded), the dotted area indicates that it passed the 95% significance test; the same below.
Atmosphere 13 01571 g007
Figure 8. The 200 hPa wind field difference between the peak years and valley years, unit: mm/s, the dotted area indicates that the meridional wind passed the 95% significance test.
Atmosphere 13 01571 g008
Figure 9. The 850 hPa wind field difference between the peak years and valley years, unit: mm/s, the dotted area indicates that zonal wind passed the 95% significance test.
Atmosphere 13 01571 g009
Table 1. The model identification, originating center, and resolution.
Model NameModeling Center and
Country
Resolution
Grid × Grid
ACCESS1-0Commonwealth Scientific and Industrial Research Organisation (CSIRO) and Bureau of Meteorology (BOM), Australia192 ×145
bcc-csm1-1Beijing Climate Center,
China
128 ×64
CNRM-CM5Centre National de Recherches Meteorologiques, France256 × 128
FGOALS-s2Institute of Atmospheric
Physics, Chinese Academy
of Sciences, China
128 × 60
GFDL-ESM2GNOAA Geophysical Fluid Dynamics Laboratory, USA144 × 90
GISS-E2-HNASA Goddard Institute for Space Studies, USA144 × 90
inmcm4Institute for Numerical Mathematics, Russia180 × 120
IPSL-CM5A-LRInstitut Pierre Simon
Laplace, France
96 × 96
IPSL-CM5A-MRInstitut Pierre Simon
Laplace, France
144 × 143
MIROC5Marine-Earth Science and Technology, Japan256 × 128
MIROC-ESMMarine-Earth Science and Technology, Atmosphere and Ocean Research Institute (The University of Tokyo), and National Institute for Environmental Studies, Japan128 × 64
MPI-ESM-LRMax Planck Institute for
Meteorology, Germany
192 × 96
MPI-ESM-MRMax Planck Institute for
Meteorology, Germany
192 × 96
MRI-CGCM3Meteorological Research Institute, Japan320 × 160
NorESM1-MNorwegian Climate Centre, Norway144 × 96
Table 2. Precipitation during the flood season and monthly in Dongting Lake Basin, unit: mm.
MonthFlood Season456789
Precipitation99015620323815913797
Table 3. The precipitation grading standards monthly and seasonally: (△R% is the percentage of precipitation anomaly).
StateNormalMoreProminently MoreAbnormally More
Positive anomaly△R% ≤ 25%25% < △R% < 50%50% ≤ △R% < 80%80% ≤ △R%
StateNormalLessProminently lessAbnormally less
Negative anomaly△R% ≥ −25%−25% > △R% > −50%−50% ≥ △R% > −80%−80% ≥ △R%
Publisher’s Note: MDPI stays neutral with regard to jurisdictional claims in published maps and institutional affiliations.

