Article

Cost–Benefit Analysis of Synergistic CO2 and NOx Energy-Efficient Technologies for the Road Transport Sector in China

1
School of Environmental Science and Engineering, Tianjin University, Tianjin 300350, China
2
School of Environmental Science and Engineering, Hubei Polytechnic University, Huangshi 435003, China
3
College of Management and Economics, Tianjin University, Tianjin 300072, China
4
Institute of Biomedical and Environmental Science and Technology, School of Life Sciences, University of Bedfordshire, Bedfordshire LU1 3JU, UK
5
State Environmental Protection Key Laboratory of Environmental Planning and Policy Simulation, Chinese Academy of Environmental Planning, Beijing 100012, China
6
College of Ecology and Environment, Hainan University, Haikou 570228, China
*
Authors to whom correspondence should be addressed.
Atmosphere 2022, 13(10), 1540; https://doi.org/10.3390/atmos13101540
Submission received: 25 August 2022 / Revised: 18 September 2022 / Accepted: 19 September 2022 / Published: 20 September 2022

Abstract

:
The transportation sector is a major source of greenhouse gases and air pollutants, and it has a crucial effect on the synergistic reduction of NOx and carbon. In order to find the energy-efficient vehicle technologies with the highest net reduction potential and lowest net reduction cost over the life cycle, this study traced the CO2 and NOx emission streams of 33 energy-efficient technologies, hidden in the supply chain during the production phase, through structural path analysis, and measured the emission reductions during the use phase using the emission factor method. Moreover, we applied structural decomposition analysis to quantify the three main drivers, including emission intensity, industrial structure, and final demand, of changes in CO2 and NOx emissions from 11 transport subsectors during 2012–2018. Results indicate that CO2 emissions of the transport sector more than doubled from 2012 to 2018; however, the influence of NOx was less significant. The final demand of the road subsector was the most significant driver contributing to CO2 emission changes, with an increase of 109.27 Mt. The emission intensity of road transportation caused the greatest mitigation effect on NOx emission changes, with a decrease of 1902 Kt. The findings of the scenario analysis demonstrate that the most efficient action of the pure electric technology for passenger cars reduces 20.92 Mt NOx emissions, and the parallel hybrid technology for heavy trucks offers the greatest cost effectiveness with a net abatement of 2577 Mt CO2 over its life cycle. Consequently, the aggressive development of new energy technology has become a prerequisite strategy to synergistically reduce CO2 and NOx emissions.

1. Introduction

Transportation is a demand-derived source of mobility that facilitates economic activity by linking the production, exchange, consumption, and distribution of goods or services in society. Transportation ensures the proper conduct and development of economic activity and plays an important role in the economic activity of society. However, as the economy grows, China’s environmental pollution problem has attracted widespread attention. To address this serious pollution problem, the State Council of China promulgated the toughest ever Air Pollution Prevention and Control Action Plan in 2013. With the implementation of this policy from 2013 to 2017, air quality has improved significantly nationwide [1]. However, the transportation sector remains a major contributor to CO2 and NOx emissions [2,3]. Therefore, analyzing the change in emissions in the transport sector from 2012 to 2018 and its main drivers would inform the development of future emission reduction pathways, while finding the most cost-effective and emission-reducing potential technologies for the most prominent emission subsector (the road transport sector) is essential to reduce emissions from the transport sector in the future.
A large number of existing studies analyzed the abatement costs and reduction potential of various energy-efficient technologies for vehicles. For example, the International Council on Clean Transportation (ICCT) examined the emission reduction potential and abatement costs of a variety of technologies, including passenger cars and trucks, over a fifteen-year period from 2015 to 2030 [4,5], and they found that the larger the reductions, the higher the cost of the required technology investment. However, consumers may also gain benefits through fuel cost savings, which will be two to three times the cost of investment by 2030 due to technology implementation [5]. Peng et al. [6] studied 55 energy-efficient technologies related to passenger cars in China from 2010 to 2030, whose findings showed that new energy technologies, including electric and hybrid electric vehicles, have the greatest abatement potential but the highest abatement costs. Of all the technologies, only a few technologies can reap the benefits while reducing emissions. In addition, technologies with low abatement costs would reduce abatement potential. Some studies [7,8,9] researched the cost-effectiveness of new energy vehicles in terms of greenhouse gas emission reduction; their findings also showed that electric vehicles have high greenhouse gas reduction potential but a poor ability to be cost-effective. The net abatement cost, as a result of the above study, is uncertain, due to the fact that it is determined by several factors, including investment costs and oil prices. However, the general rule is that investment costs increase with the amount of abatement, and oil prices have a strong influence on whether energy efficiency technologies require costs or return benefits.
At the same time, energy-efficient technologies may produce significant emissions in the production phase. Rosenfeld et al. [10] showed that new energy vehicles have high CO2 emissions in the production phase, especially pure electric vehicles, whose emissions in the production phase can reach half of the emission reductions in the use phase. In the coming decades, with the advancement of technology, the use phase of new energy vehicles may have a higher emission reduction potential, and the production phase may become the main stage of pollutant emissions during its life cycle. In addition, the results of Zhu et al. [11] showed that the impact of greenhouse gases on global temperature has a lag. That is, the production emissions now will affect the temperature in the next decades. Therefore, emissions from the production phase of emission reduction technologies cannot be ignored. Inadequately, most of the available studies focused on the research of the use stage of the treatment technology of vehicles, but rarely analyze the whole life cycle of vehicle emission reduction technology.
To make up for this research gap, based on the input–output model, we applied the structural path analysis (SPA) method to study the emission abatement potential and cost of 33 technologies, including the whole life cycle of production and consumption (i.e., the use stage). SPA is a suitable tool for linking emissions from various sectors of the national economy and revealing the flow of emissions from the product to the consumer [12,13]. SPA is a widely used tool to study the emission pathways of greenhouse gases and pollutants, such as CO2 [14,15], particulate matter (PM2.5) [16,17], SO2 [18], and so on. Therefore, it is feasible to use SPA to measure the implied emission streams in the economic system due to the implementation of energy-efficient technologies in the transport sector. In terms of emission objects, the current study selected the greenhouse gas CO2 and the air pollutant NOx. The transport sector is the main source of these two emissions.
By analyzing the emission abatement potential and cost of various vehicle energy-efficient technologies, the results of present study aimed to provide a scientific basis for the energy-efficient technologies that may help reduce air pollution, and to, consequently, help the Chinese government to choose and promote cost-effective and environmentally friendly technologies.

2. Methods and Data

In the current study, a number of variables were used to study the abatement costs and abatement potential of the transport sector. Their descriptions and notations are summarized in Table 1.

2.1. Methods

The structural decomposition analysis (SDA) and structural path analysis (SPA) models were applied to extend the decomposition of CO2 and NOx emission structure based on the input–output (IO) model. The IO model was proposed in the 1930s by the American economist Wassily Leontief and has been widely used in a variety of disciplines affected by economic activity, especially the environmental impact of economic activity. We assumed that the IO table contains n industries, and the IO table can be represented as:
( x 1 x 2 x n ) = ( a 11 a 12 a 1 n a 12 a 22 a 2 n a n 1 a n 2 a n n ) × ( x 1 x 2 x n ) + ( f 1 f 2 f n )
Equation (1) can also be expressed as follows:
( x 1 x 2 x n ) = ( 1 a 11 a 12 a 1 n a 12 1 a 22 a 2 n a n 1 a n 2 1 a n n ) 1 × ( f 1 f 2 f n )
Equations (1) and (2) are the core formulas of the input–output table, where X = ( x i ) is the total output of industry i; A = ( a i j ) is the amount of value per unit of output consumed by sector j for product i; and F = ( f i ) is the final demand of sector i.

2.1.1. Structural Decomposition Analysis (SDA)

In the present study, SDA was used to analyze the drivers of changes in CO2 and NOx emissions in the transport sector. SDA was proposed by Chang and Lin [19] to evaluate the factors affecting changes in industrial greenhouse gas emissions in Taiwan, decomposing emissions into multiple drivers during 1981–1991. Since SDA can provide detailed information about structural factors, it has been widely applied to explore the influencing factors [20,21,22].
SDA is commonly used to examine the contribution of potential drivers to changes in observed indicators in IO tables [23]. SDA calculates the contribution of each independent variable to the dependent variable by considering the changes in each independent variable in a different way.
To assess the driving forces, the pollutant emissions (E) are decomposed into emission intensity (θ), industry structure (I − A)−1), and final demand (F).
Δ E = E t + 1 E t = θ t + 1 ( I A ) t + 1 1 Y t + 1 θ t ( I A ) t 1 Y t
Δ E = Δ θ ( I A ) t + 1 1 Y t + 1 + θ t Δ ( I A ) 1 Y t + 1 + θ t ( I A ) t 1 Δ Y
where, Δ denotes the amount of change; for example, ΔE denotes the change in pollutant emissions between 2012 and 2018, t + 1 denotes 2018, and t denotes 2012.

2.1.2. Method of Measuring Cost–Benefit

The cost of abatement is an important consideration for companies, sectors, and regions when determining the pathways of mitigating emissions. As the road is the highest CO2- and NOx-emitting transport subsector, the search for the most efficient and least costly abatement technology for vehicles is a critical issue, which facilitates the opportunity to design sensible, model-specific mitigation strategies.
Currently, China has different scrappage regulations for different vehicle types, with 15 years for light trucks and heavy trucks, and 15 years or longer for passenger cars, which have no specific time limit. Therefore, for the convenience of accounting, the service life of all three models studied in this study was set to 15 years [24]. In the present study, the intensity of emissions by sector and the supply relationship between sectors were assumed to remain constant over the life cycle of vehicle use (i.e., 15 years), and similar assumptions have been set in many studies [25,26,27].
Cost–benefit analysis methods have been widely applied in the field of environmental decision-making, where they are used to quantify the costs and benefits of different policy actions or abatement technologies in order to obtain optimal decisions. The study considered three types of costs, including technology investment costs ( f 1 ), fuel-saving benefits ( f 2 ), and electricity costs ( f 3 ), of which investment costs are one-time, and fuel savings and electricity costs are cumulative over the life cycle of technology implementation. Therefore, we did not consider discounting for the technology investment costs ( f 1 ), while setting the fuel-saving benefit ( f 2 ) and electricity cost ( f 3 ) increases at a discount rate of 5% over 15 years [6]. These three costs or benefits (in million yuan) can be calculated as follows:
f 1 = I C × T O × 10 6
f 2 = i = 1 15 ( T O × F E × T M × F C × S × 10 6 × ( 1 + 5 % ) 14 )
f 3 = i = 1 15 ( T O × P E × T M × E C × 10 6 × ( 1 + 5 % ) 14 )
where I C (yuan) is the investment cost of each technology installed in each vehicle. T O is the total ownership of the three categories studied in this paper as of the end of 2018. F E is the fuel efficiency per unit mileage (L/km). P E is the power efficiency per unit mileage (kW·h/km). T M is the total mileage over the life cycle (km). F C (yuan/L) is the cost per liter of fuel; the price per liter of diesel was 6.88 yuan, and the average price per liter of gasoline was 7.27 yuan in China in 2018 [28]. E C is the cost per kW·h of electricity (yuan/kW·h), and the average electricity price in China in 2018 was 0.374 yuan/kW·h [29]. S is the energy efficiency in %. The parameters of F E , P E , T M , and V O are listed in Table 2. I C and S are given in Table 3.
If a technology could be economically beneficial while still fulfilling its intended role, this would go a long way toward reducing resistance to technology implementation. Existing studies generally discuss emission reductions from a cost perspective. However, considering the potential economic benefits of a large number of energy efficiency technologies studied in this paper, we used benefits as an economic indicator for each technology, and the net benefits ( N B ) are as follows:
N B = f 3 f 1 f 2

2.1.3. Methodology of Structural Path Analysis (SPA) and Measuring of Net Abatement Potential

Not only economy is an important reference factor in choosing an abatement technology, but the abatement potential is equally important. Facing the current severe environmental pressures, it is optimal to find technologies that have high economic efficiency and a high potential to reduce emissions. For this purpose, we measured the direct and embodied emissions of the entire economy during the production phase of the abatement technology, using the structural path analysis (SPA) method. We used the investment costs ( f 1 ), fuel benefits ( f 2 ), and electricity costs ( f 3 ) of 33 specific energy-efficient technologies as the final demand variation parameters for the SPA methodology to evaluate the CO2 and NOx emissions in the production phase.
Skelton et al. [13] extended the application of traditional structural path analysis (SPA) methods in the environmental domain. The extended SPA approach can trace the complex relationships between sectoral interactions and embodied emission streams, as well as investigate the differences between final production emissions and final demand emissions and the reasons for their formation. SPA models, which can show detailed flow path maps of the supply chain between final production and consumption, have been widely used to identify key sectors and supply chain pathways leading to energy consumption and pollutant emissions [37,38]. This approach can effectively quantify demand-driven environmental emissions.
The SPA approach relies on the Leontief inverse matrix, which is able to systematically identify key impact sectors or pathways through decomposition. The decomposition of the Leontief inverse matrix ( I A ) 1 is expressed as follows:
( I A ) 1 = l i m t I + A + A 2 + A 3 + + A t
Then, the input–output model can be expressed as:
X = θ ( I A ) 1 F = l i m t ( θ I F + θ A F + θ A 2 F + θ A 3 F + + θ A t F )
where θ is the emission intensity, that is, the pollutant emissions per unit of output, and, in this paper, is the emission intensity of CO2 and NOx. In Equation (10), θ A i F represents the impact from the production sector at level i. For example, when F represents the demand for the production of a car, θ I F is the direct emission of the producer in the production process; in order to produce the car, other sectors need to input A F , which generates the emission of θ A F ; the increased input of other sectors further requires the production input of A 2 F , which continues to generate the emission of θ A 2 F . This process continues through the infinite expansion of the power of the Leontief inverse matrix, and eventually, the total direct and implicit emissions from the production of a car are decomposed in layers to obtain all emission paths.
This study quantified the emissions of energy-efficient technologies in the production phase ( A P P ), using the extended structural path analysis (SPA) method described above, including the additional emissions generated by the technology itself in the manufacturing process ( E t e c h ), the additional emissions of the electricity required in the use phase of the abatement technology in the production phase ( E e l e c ), and the reduction in emissions from the fuel saved by the energy savings of the abatement technology in the production phase ( E f u e l ).
A P P = E t e c h + E e l e c E f u e l
The coefficient method is a common accounting method for the total amount of pollutants. In the use phase of the abatement technology, we used the coefficient method to estimate the CO2 and NOx emissions. We obtained the CO2 reduction ( A P U C O 2 ) by multiplying the CO2 production factor of the fuel (gasoline or diesel) by all the fuel saved by the technology during the use phase. As vehicle NOx is more likely to be influenced by exhaust gas control technologies, the relationship between its production and fuel consumption is currently uncertain. Therefore, in the absence of sufficient data, this study obtained the NOx use phase emission reductions ( A P U N O x ) by multiplying the emissions before technology implementation by the corresponding energy efficiency of the 33 technologies.
In summary, we obtained additional emissions in the production phase based on the SPA method, and emission reductions in the use phase based on the coefficient method, and the net emission abatement potential ( A P n e t , CO2 in Mt, and NOx in Kt) over the life cycle of the energy-efficient technology can be expressed as:
A P n e t = A P U A P P

2.2. Data

2.2.1. Input–Output Table and Pollutant Emission Data

The 2012 input–output tables and 2018 input–output tables used in this study were obtained from the National Bureau of Statistics of China [39]. The transportation sector in this study included 11 subsectors, including passenger and freight transport by rail, road, water, and air, as well as pipeline transport, multimodal transport, and postal services.
Since the transportation sector is the most important source of NOx, we only considered NOx in this study. The data of NOx emissions for vehicles (the road passenger transport subsector and road freight transport subsector) were obtained from the Annual Report on Environmental Management of Mobile Sources in China [40]; among them, the tailpipe NOx emissions in 2018 were 600 Kt for passenger cars, 276 Kt for light trucks, and 3513 Kt for heavy trucks. NOx emission data for other sectors were obtained from the National Bureau of Statistics of China [39]. The CO2 emission accounting process in this paper used energy consumption data by sector from CEADs [41] and CO2 generation factors from the Intergovernmental Panel on Climate Change (IPCC) [42].

2.2.2. Basic Data of Energy-Efficient Technologies

For the future development of automotive emission reduction technology, the “New Energy Vehicle Industry Development Plan (2021–2035)” in China clearly states that new energy vehicles (e.g., pure or plug-in electric vehicles, hybrid vehicles, and fuel cell vehicles) and general-purpose body and engine technologies (such as lightweight technologies and low frictional resistance technologies) are the future direction of development [43]. However, there is a lack of systematic and published data for these technologies in China. Here, the parameters of energy-efficient technologies for trucks refer to the reports of the National Science Research Council and the National Highway and Traffic Safety Administration [34,35,36], and the parameters of passenger cars refer to the study of Peng et al. [6] and the report of the National Highway and Traffic Safety Administration [34].

3. Results and Discussion

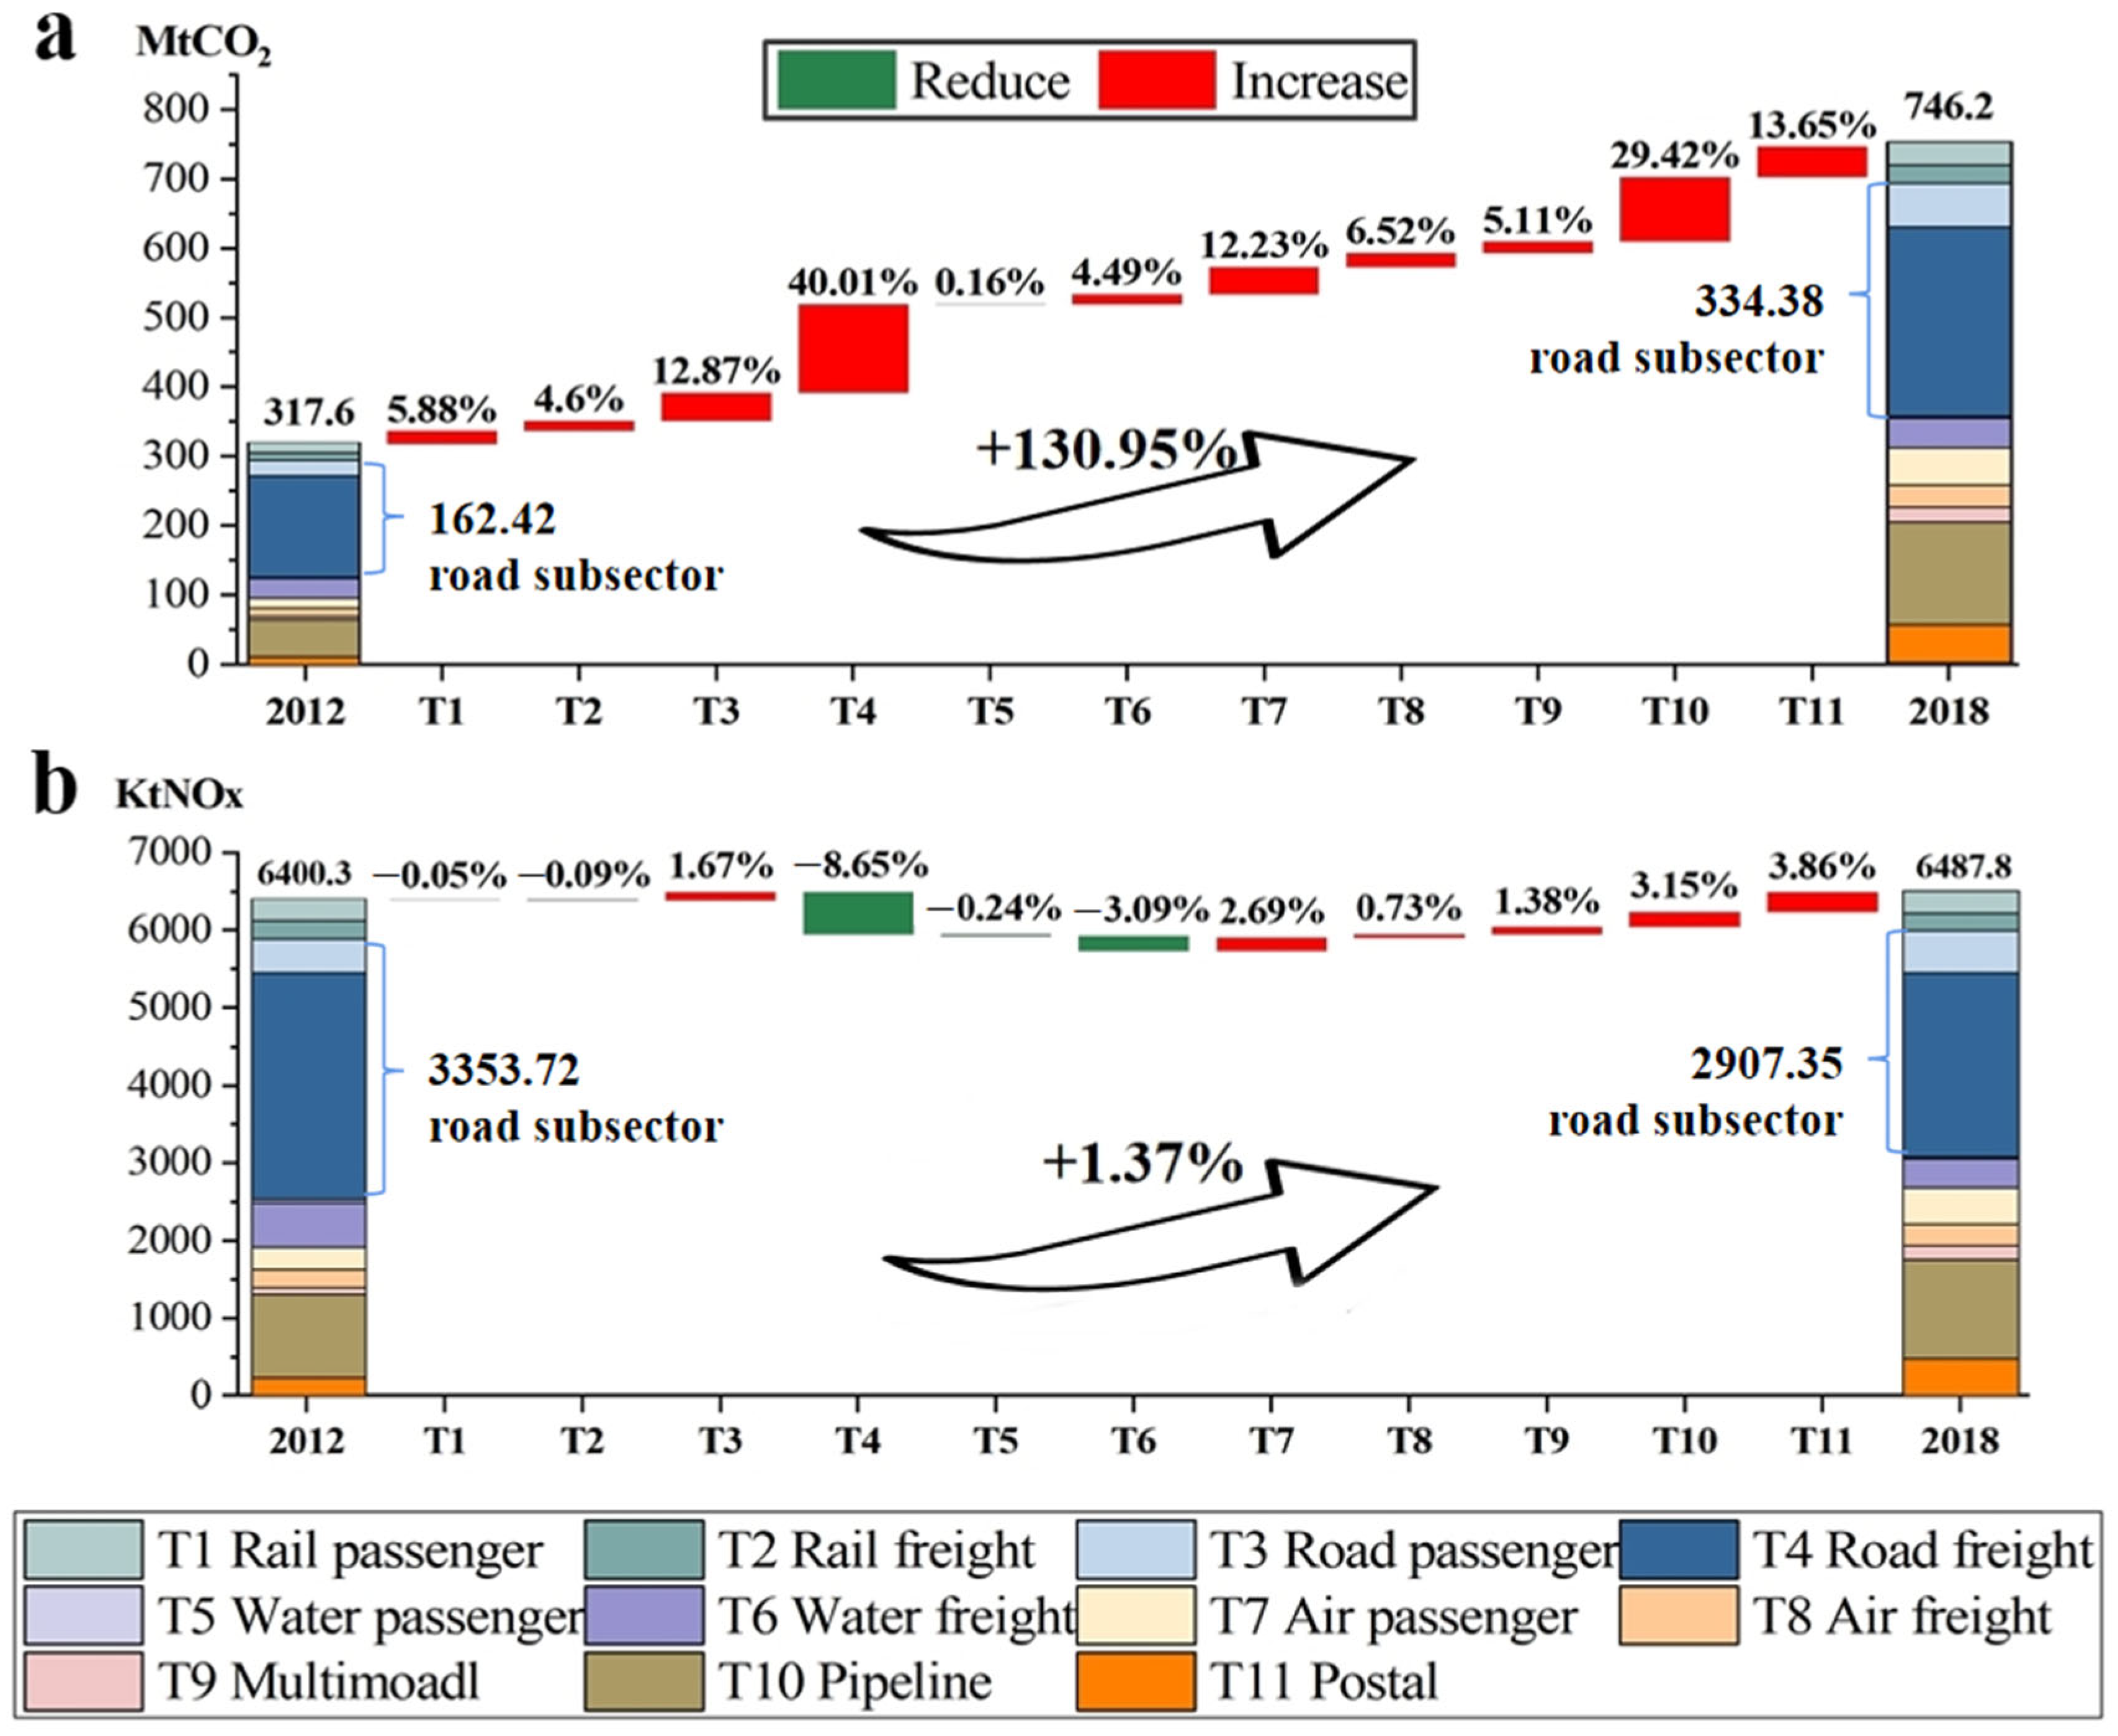
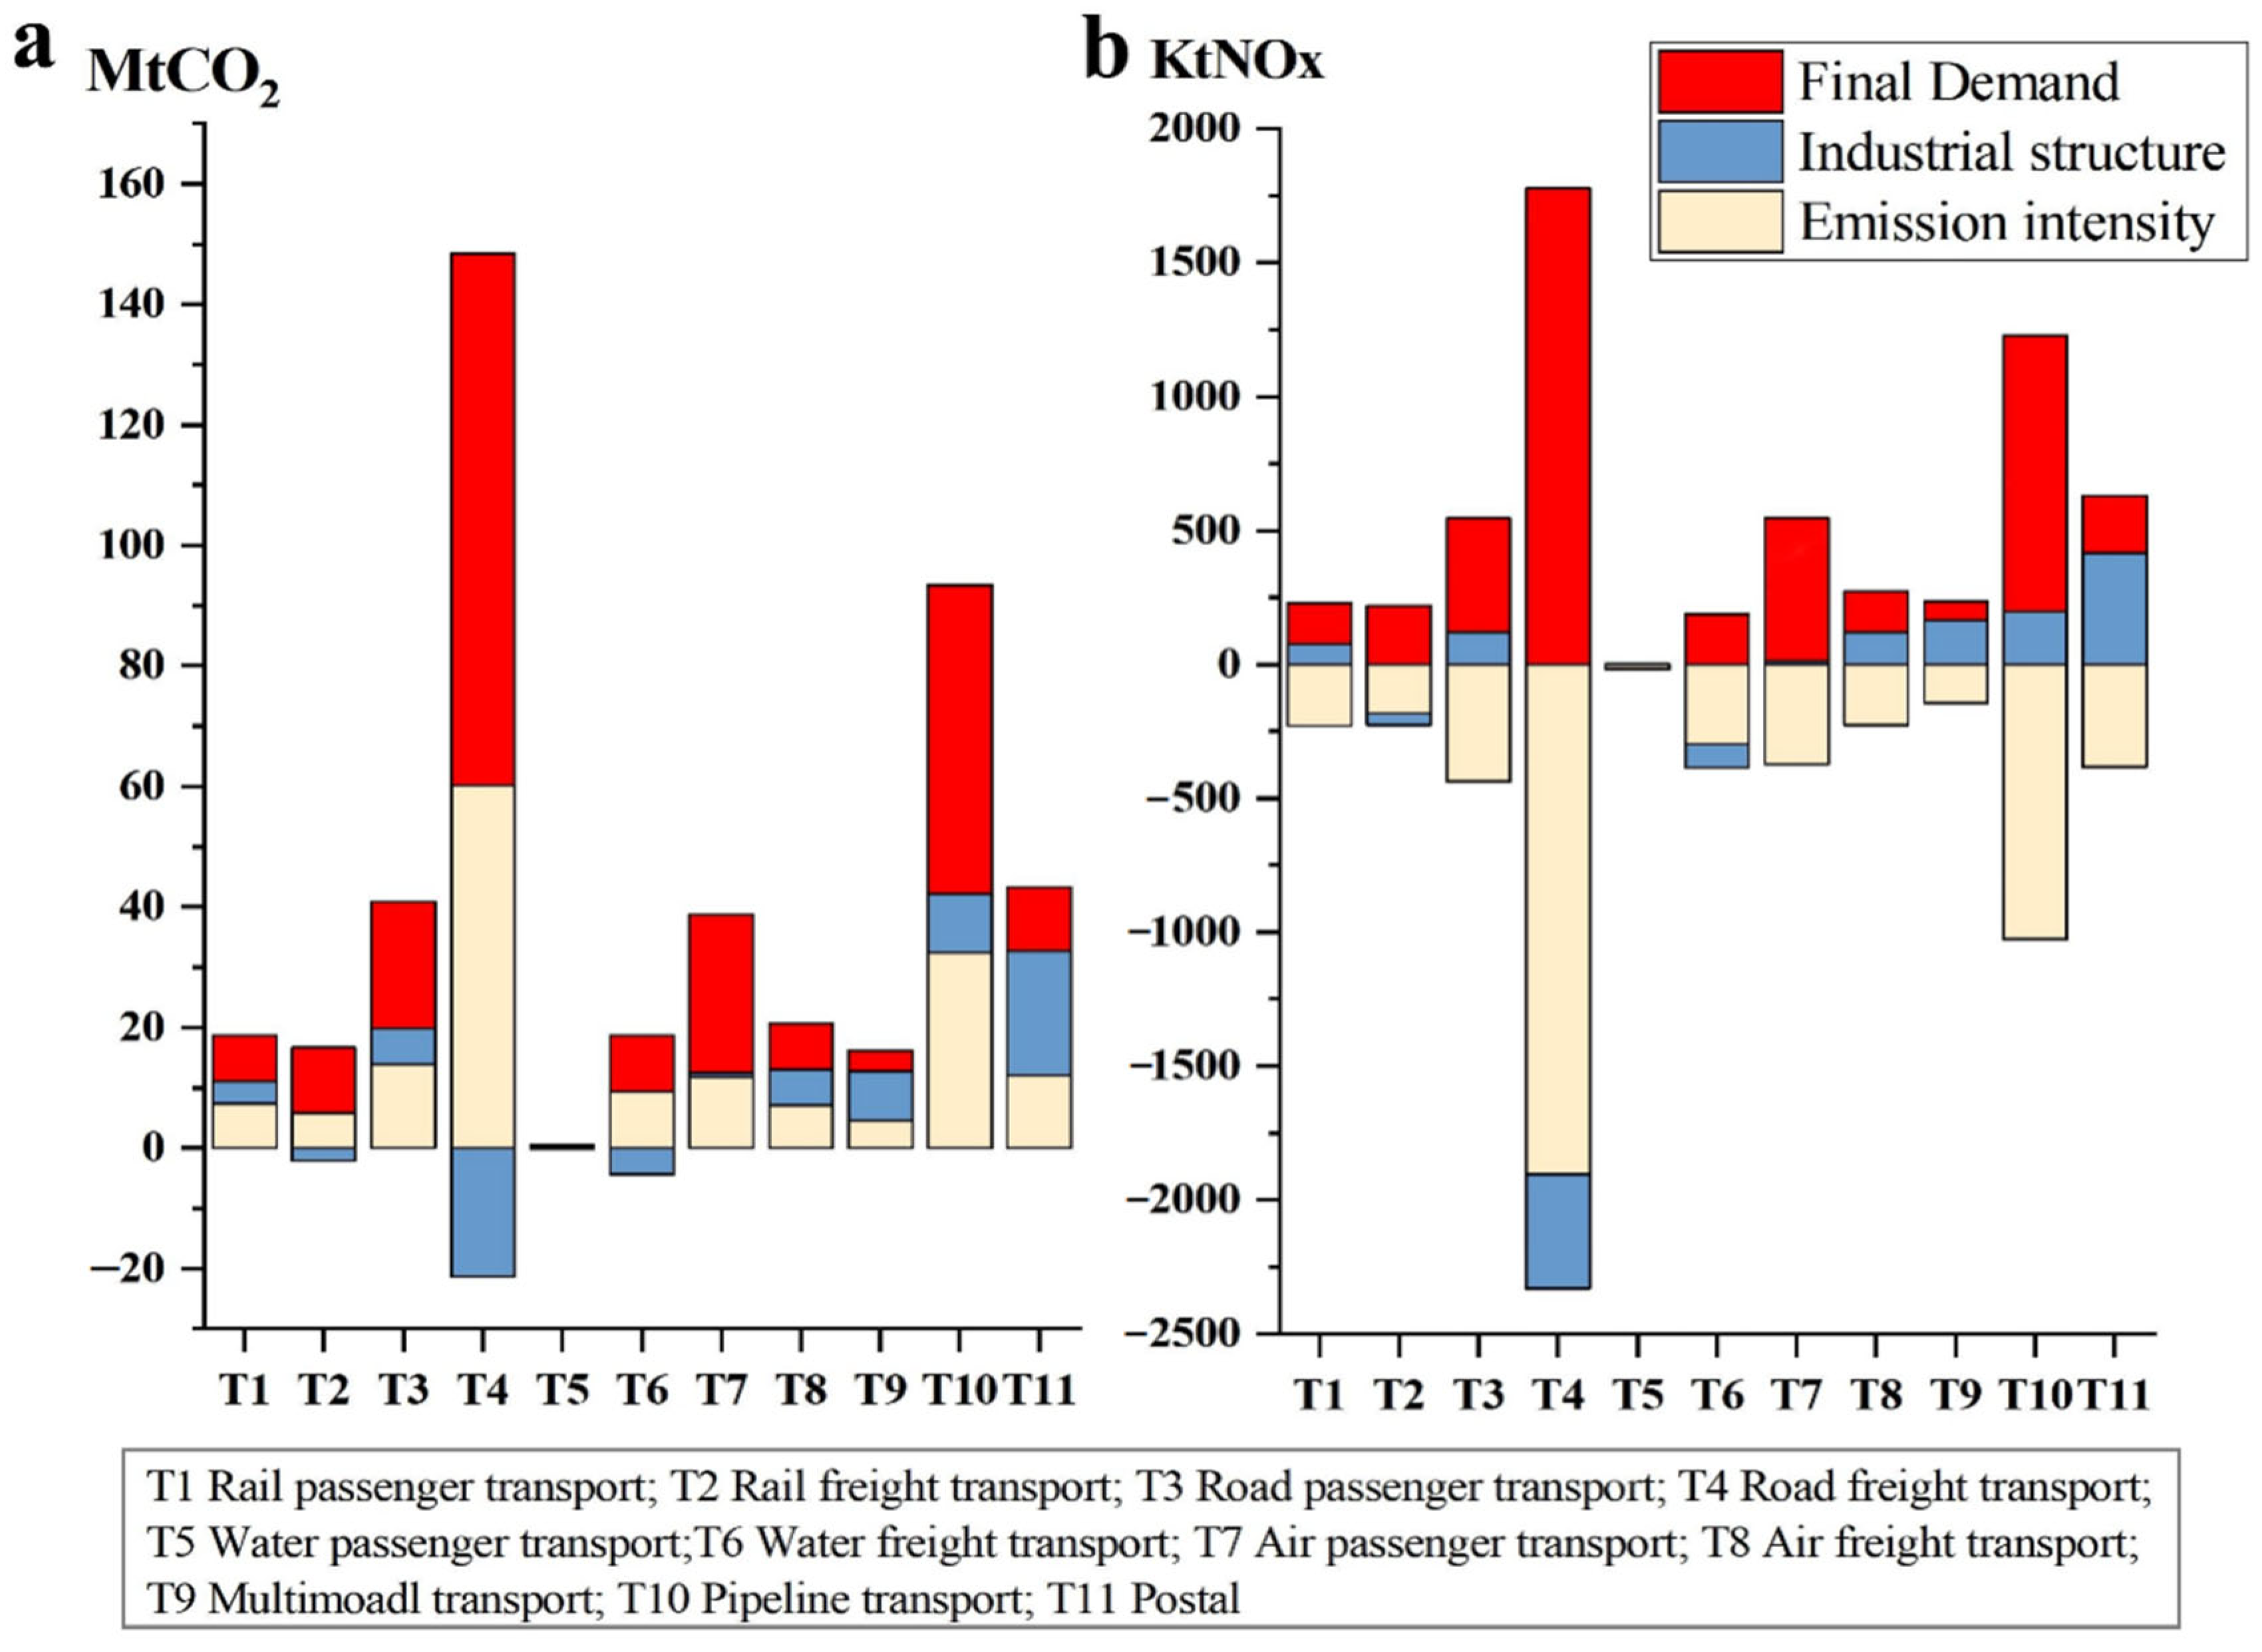
3.1. Change and Driving Force Analysis of CO2 and NOx Emissions in the Transport Sector

The Air Pollution Prevention and Control Action Plan (the Action Plan) put forward a series of requirements to reduce emissions from transportation sources, such as improving fuel quality and phasing out yellow-label vehicles by a deadline [44]. We analyzed the changes of CO2 and NOx emissions in 11 subsectors of transportation and their drivers before and after the implementation of the Action Plan.
Based on CO2 and NOx emissions from 11 transport subsectors over the period of 2012–2018, our results showed that CO2 emissions from the transport sector increased significantly, while NOx emissions remained largely flat (Figure 1). The largest contribution to the increase in CO2 emissions was made by the road freight transport sector, which accounted for about 40% of the increase, followed by the multimodal transport subsector and the road passenger transport subsector, which accounted for 29.42% and 12.87%, respectively. NOx reductions in the road freight transport sector had a significant impact on NOx flatness in the transport sector, with an 8.65% reduction from 2012–2018.
In addition, our study used the structural decomposition analysis (SDA) method to analyze the drivers of change in emissions in the transport sector. The SDA has been widely used to investigate emissions to identify drivers of CO2 and NOx emission change, based on input–output models of analysis [20,21,22,45]. We exposed the impact of emission intensity, industrial structure, and final demand as drivers of CO2 (a) and NOx (b) emission changes (see Figure 2).
As shown in Figure 2, the drivers of final demand played positive roles in increasing CO2 and NOx emissions over the study period, leading to an increase of 236.67 Mt CO2 and 4769.7 Kt NOx in the transport sector. In particular, the road subsector had the largest increase in emissions due to final demand factors, with an increase of 109.27 Mt CO2 and 781.41 Kt NOx. The industrial structure also had an impact on the growth of emissions in the total transport sector, with an increase of 26.78 Mt CO2 and 539.7 Kt NOx compared to 2012. However, from 2012 to 2018, the industrial structure also had a negative impact on some subsectors, especially the road freight subsector, which mitigated 21.29 Mt CO2 and 429.07 Kt NOx. Emission intensity had a different impact on CO2 and NOx, with an increase of 165.12 Mt CO2 but a decrease of 5221.60 Kt NOx from 2012.
Among all studied factors, the increased emissions of both CO2 and NOx that were due to final demand were the highest. From 2012–2018, China’s demand for the transport sector increased dramatically, leading to significantly increased emissions. In the road subsector, for example, China’s car ownership per 1000 people is much lower than in developed countries [46], which means that with China’s rapid economic development, in the foreseeable future, there will be an inevitable trend toward swelling car ownership. The study also found that the intensity of CO2 emissions was also a factor contributing to the increase in emissions during its study period (Figure 2a). However, the increase in final demand was offset by a reduction in the intensity of NOx emissions (Figure 2b). Environmental policies may be the main reason for the opposite trend of NOx and CO2 emissions. From 2013 to 2018, China became very stringent in managing transport NOx emissions, especially for the road subsector, the main emission subsector of the total transport sector, which has entered deep water. A range of vehicle end-of-pipe policies have helped to achieve significant NOx reductions, such as improved fuel quality for energy efficiency [47], the installation of exhaust treatment units, and stricter exhaust emission standards [48].
In the future, emissions from motor vehicles will remain high, as will other transport subsectors. Therefore, there is an urgent need to find effective ways to reduce emissions; perhaps the use of cost-effective and high abatement potential technologies could help reduce CO2 and NOx emissions.

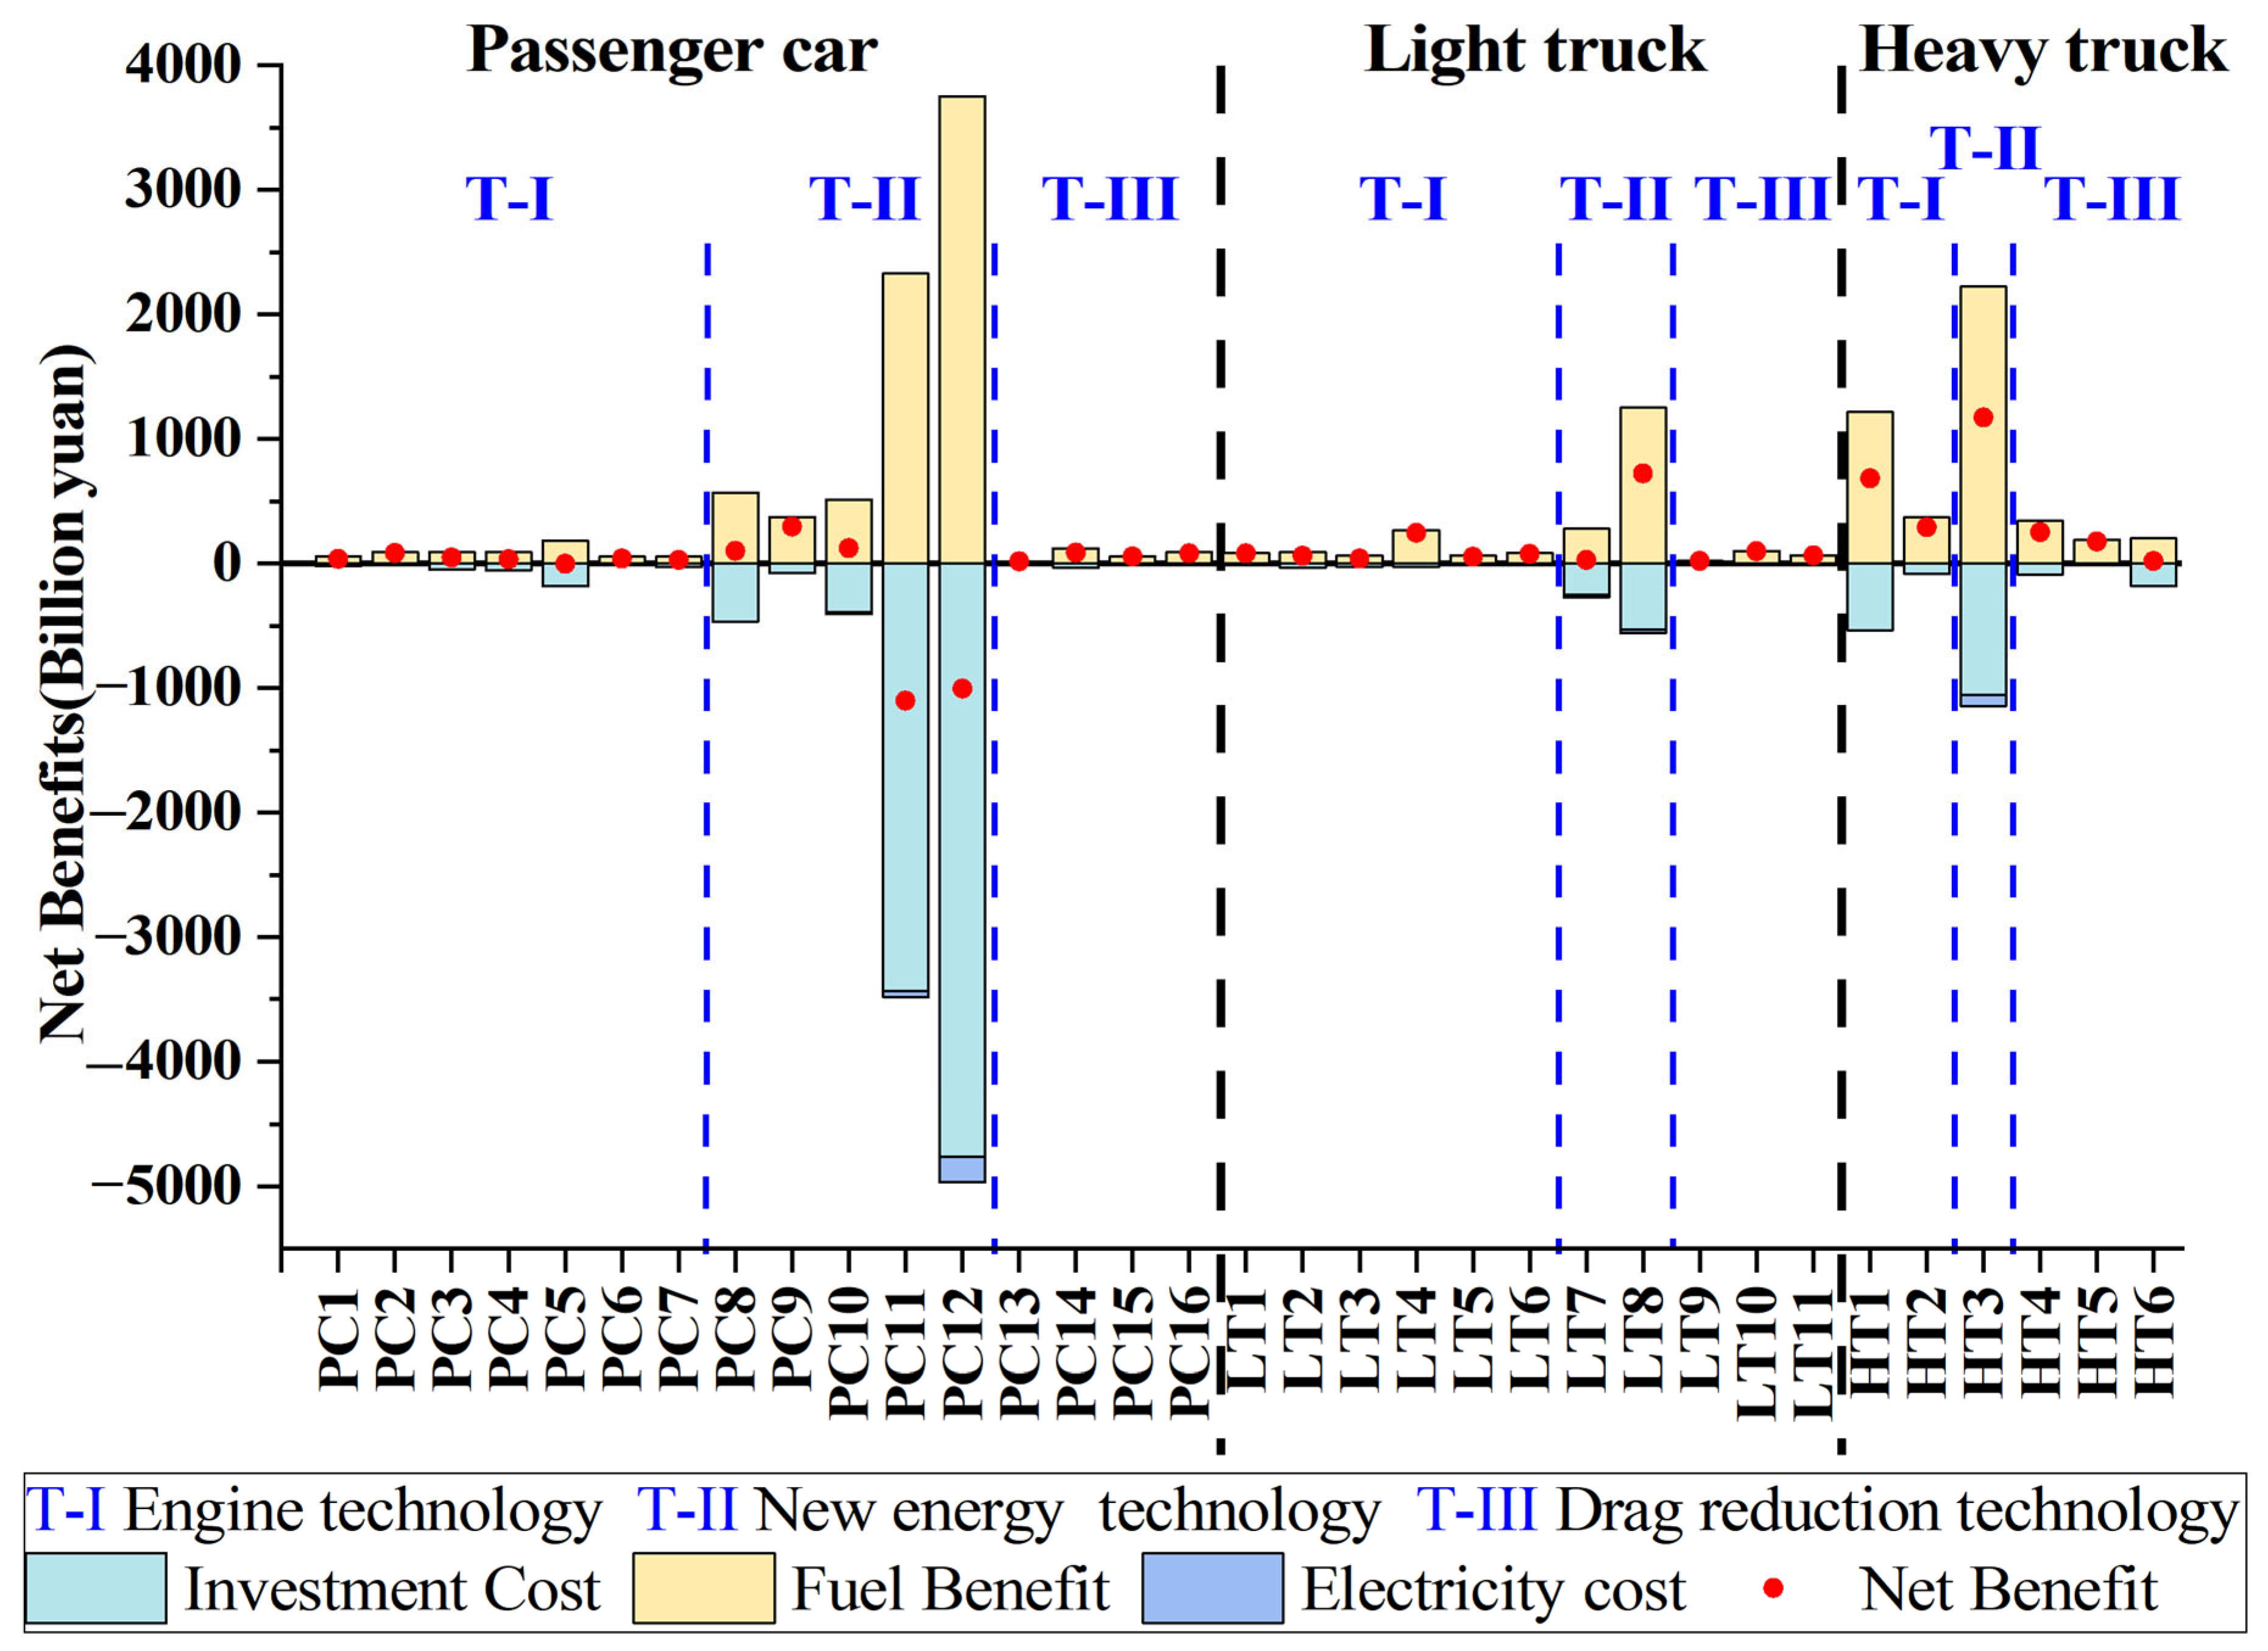
3.2. Cost–Benefit Analysis of Energy-Efficient Technologies

Assessing the net abatement potential and economic costs of mainstream vehicle energy efficiency technologies can provide data to support and inform the planning of low-carbon investments and policies in China’s road transport sector. We calculated the net abatement potential ( A P n e t ) of 33 road transport technologies using cost–benefit analysis and the SPA method (see Figure 3), which includes both additional emissions from the production phase and direct reductions from the use phase. This allows emissions directly from the technology, electricity, and oil production stages, and indirectly through the supply chain, to be taken into account.
The results showed that most the studied technologies had good synergistic CO2 and NOx reduction effects. Overall, passenger cars and heavy trucks had a high potential to reduce emissions. Of these, new energy technologies (T-II) were more prominent in all three categories, as shown in Figure 3. Among all energy-efficient technologies, the pure electric technology for passenger cars (PC12) had the highest net NOx reduction potential, and the parallel hybrid technology (HT3) for heavy trucks had the highest potential for synergistic CO2 and NOx emission reductions.
Figure 4 illustrates the net benefits (NB) of the 33 energy-efficient technologies, and it can be seen that most technologies are cost-effective. Among all studied technologies, heavy trucks showed the highest net abatement benefits, while passenger cars had the lowest net abatement benefits. In which, new energy technologies (T-II) for passenger cars had the lowest net abatement benefits. On the contrary, new energy technologies for heavy trucks had the highest emission reduction benefits. In addition, the net abatement benefits of engine technologies (T-I) and drag reduction technologies (T-III) were found to be lowest.
The results showed that most of the technologies are able to achieve a net benefit over their life cycle, due to the fact that the economic benefits of fuel savings during the use phase outweigh the investment costs. The net benefits of pure electric technology for passenger cars (PC12) and plug-in hybrid technology for passenger cars (PC11) were negative, meaning that these two technologies do not generate benefits over their life cycle and require some additional expense. PC12 technology had the highest net NOx abatement potential (20.92 Mt NOx), with a total net benefit of −1004 billion over its lifetime. Therefore, to implement pure electric vehicles with great emission reduction potential on a large scale, government subsidies would reduce their promotion resistance [49]. In addition, it is worth noting that the parallel hybrid technology for heavy trucks (HT3) had not only the highest CO2 and NOx synergistic reduction potential, but also the highest net benefit of all the technologies studied, with a net benefit of 2225 billion yuan, while reducing 2577 Mt CO2 emissions and 13.76 Mt NOx emissions. Therefore, HT3 technology is a worthy priority for future emission reduction planning in the road transport sector, both from an economic and environmental point of view.
In sum, there were two main novel findings from the cost–benefit analysis of these technologies. Firstly, we found that, although the pure electric technology for passenger cars (PC12) and the plug-in hybrid technology for passenger cars (PC11) show good huge and synergistic CO2 and NOx reduction effects, these technologies also cost the most. Secondly, we found that the parallel hybrid technology (HT3) for heavy trucks not only has huge emission reduction potential, but also requires a relatively low cost compared to PC12 and PC11 technologies. Considering both the net abatement potential and net abatement cost, we believe the parallel hybrid technology for heavy trucks (HT3) is the most desirable abatement pathway to be promoted in the future, as it has a high CO2 and NOx synergistic abatement potential and low retrofit cost, which provides the highest economic benefits over the life cycle.

3.3. Uncertainty Analysis

There is some uncertainty in the results of this paper, which mainly comes from two aspects: the reliability of the emission data and the accuracy of the cost and efficiency of abatement technologies.
First of all, the sources of air pollutant emission data for mobile sources in China are generally three influential sources: the environmental statistics yearbook, pollution census data, and annual report of environmental management of mobile sources, but all these three sources only have NOx data and no CO2 data. Therefore, in this study, CO2 emission data were obtained from Tsinghua University CEADs inventory and accounting according to IPCC greenhouse gas guidelines. Of course, due to various factors such as technical level and statistical caliber, there is no absolutely reliable emission inventory for either CO2 or NOx. Therefore, although the data collection and measurement methods of CO2 and NOx are different, in this study, we used the environmental statistics yearbook [39] and the annual report of mobile source environmental management data [40], published by the Chinese government for NOx and Tsinghua University CEADs [41] inventory and accounting according to the IPCC greenhouse gas guidelines [42] for CO2, in order to ensure the accuracy of the data as much as possible.
In the abatement cost analysis section, there is no government published data on the cost and energy saving efficiency of various abatement technologies. Therefore, the data were obtained from the National Science Research Council of America, the National Highway Traffic Safety Administration of America, and related literature. While the research object of this paper is China, there is some uncertainty. Moreover, in this paper, we equate energy saving efficiency with abatement efficiency, but in fact, for the vehicle itself, energy saving efficiency does not necessarily reduce emissions, and may cause an increase in pollutants. The purpose of this study was not to conduct very precise simulations, but to study the chain reaction of the implementation of abatement technologies on the emissions of the whole supply chain, and to propose a new approach to the feasibility analysis of pollution abatement technologies. In the future, more advanced monitoring data may further improve the accuracy of emission inventories, and more research on China’s transportation sector may make the cost and abatement capacity of abatement technologies more consistent with the actual situation in China, resulting in less uncertainty in the data.

4. Conclusions

This paper examines the changes in CO2 and NOx emissions in the transportation sector and their drivers from 2012–2018, as well as the reduction potential and abatement costs of energy-efficient technologies of the road passenger and road freight transport subsectors. The results showed that CO2 more than doubled during the study period, from 318 Mt in 2012 to 746 Mt in 2018. Although emissions of NOx have not increased significantly, its level remains high at 6400 Kt. Current emission reduction measures for transport are weak in terms of CO2 control. In the coming decades, with the increased demand for the transportation sector, especially the road transport subsector (vehicles), the transportation sector will continue to be a major contributor of CO2 and NOx, which are essential for improving air quality. This is consistent with the study by Zhao et al. [50], who found that income and population have a significant impact on vehicle CO2 emissions. Income and population generate a huge demand for transport. Therefore, China should focus on reducing emissions from the transportation sector, especially from the road subsector, in order to achieve the synergistic pollutant and carbon reduction targets.
This study analyzed the net reduction potential and cost of 33 vehicle energy-efficiency technologies. The results showed that most of the studied technologies showed good synergistic CO2 and NOx reduction effects. Moreover, most technologies can deliver benefits with emission reductions. Of all these technologies, new energy technologies have the greatest advantage in net abatement potential, especially pure electric and hybrid technologies. Numerous studies [6,7,50,51] have come to the same conclusion; they are all positive about the abatement potential of new energy technologies. However, in terms of the cost–benefit analysis of this research, new energy technologies are not economically efficient compared to drag reduction technologies and energy-efficient technologies, especially for passenger cars. Specifically, most technologies achieve economic benefits, except for pure electric technology for passenger cars (PC12) and plug-in hybrid technology for passenger cars (PC11), which may require some cost. In addition, the price of oil has a significant impact on whether energy-efficient technologies require costs or return benefits [7,52]. Previously, we used 2010 as the base year, and our results showed that most of the abatement technology options had costs [6]. Whereas in this research, we employed 2018 as the base year, with a fuel price increase of approximately 15% from our previously published study [6], and the results showed that most of the technical options could be profitable. This difference is mainly caused by the increase in fuel prices. We can expect that the economics of new energy technologies for passenger cars using price-stabilized electricity will improve significantly as the price of oil increases [8]. At the same time, both PC12 and PC11 technologies have a high potential for life-cycle emission reductions, despite their high emissions in the production phase. Therefore, gradual electrification is an important path to passenger car emission reduction.
In contrast, new energy technologies for heavy trucks can yield significant benefits, which are considerably more cost-effective than passenger cars. Parallel hybrid technology for heavy trucks (HT3) not only offers the highest CO2 and NOx synergistic emission reductions, but also economic benefits over its life cycle. The reason for this situation is that parallel hybrid technology is based on a conventional fuel vehicle, with the modification of twin engines and electronic auxiliaries [53], and therefore, the cost is low compared to replacing the entire vehicle with pure electric technology (PC12). In addition, the parallel hybrid technology for heavy trucks is the technology that can meet the demand of emission reduction and long-distance transportation. At present, parallel hybrid technology for heavy trucks is more common in Europe [54], but it has not been commonly promoted in China. Under the background of China’s national strategy of green freight and the optimization of traffic structure, the promotion of hybrid heavy trucks may be a win-win solution for the environment and economy in the near future, compared to the promotion of pure electric technology for passenger cars.

Author Contributions

Conceptualization: L.P., Y.W. and W.M.; data curation, L.P., L.-C.L., B.P. and H.Z.; formal analysis, L.P., Y.W. and B.P.; funding acquisition, Y.W. and B.P.; investigation, L.P. and L.-C.L.; methodology, L.P., Y.W., L.-C.L., B.P., B.Y.A., H.Z. and W.M.; supervision, Y.W.; validation, L.-C.L. and H.Z.; visualization, L.P. and L.-C.L.; writing—original draft, L.P., L.-C.L. and H.Z.; writing—review and editing, Y.W., B.P., B.Y.A. and W.M. All authors have read and agreed to the published version of the manuscript.

Funding

This research was supported by the National Natural Science Foundation of China (Grant No. 41871211, 41571522, 71834004, and 71904141), the National Key Research and Development Program of China (Grant No. 2018YFC0213602) and the Key project of Hubei Province Education Department. All figures and tables in this paper were created by the authors.

Institutional Review Board Statement

Not applicable.

Informed Consent Statement

Not applicable.

Data Availability Statement

The data that support the findings of this study are available from the corresponding authors upon request.

Conflicts of Interest

The authors declare no conflict of interest.

References

  1. Zhang, Q.; Zheng, Y.; Tong, D.; Shao, M.; Wang, S.; Zhang, Y.; Xu, X.; Wang, J.; He, H.; Liu, W.; et al. Drivers of improved PM2. 5 air quality in China from 2013 to 2017. Proc. Natl. Acad. Sci. USA 2019, 116, 24463–24469. [Google Scholar] [CrossRef]
  2. IEA. World Energy Balance. 2019. Available online: https://www.iea.org/reports/world-energy-balances-overview (accessed on 3 October 2021).
  3. Zhang, R.; Fujimori, S.; Hanaoka, T. The contribution of transport policies to the mitigation potential and cost of 2 °C and 1.5 °C goals. Environ. Res. Lett. 2018, 13, 054008. [Google Scholar] [CrossRef]
  4. Lutsey, N.; Meszler, D.; Isenstadt, A.; German, J.; Miller, J. Efficiency Technology and Cost Assessment for US 2025–2030 Light-Duty Vehicles; International Council on Clean Transportation (ICCT): Washington, DC, USA, 2017. [Google Scholar]
  5. Norris, J.; Escher, G. Heavy Duty Vehicles Technology Potential and Cost Study; The International Council on Clean Transportation: San Francisco, CA, USA, 2017. [Google Scholar]
  6. Peng, B.-B.; Fan, Y.; Xu, J.-H. Integrated assessment of energy efficiency technologies and CO2 abatement cost curves in China’s road passenger car sector. Energy Convers. Manag. 2016, 109, 195–212. [Google Scholar] [CrossRef]
  7. Hao, H.; Cheng, X.; Liu, Z.; Zhao, F. Electric vehicles for greenhouse gas reduction in China: A cost-effectiveness analysis. Transp. Res. Part D Transp. Environ. 2017, 56, 68–84. [Google Scholar] [CrossRef]
  8. Karplus, V.J.; Paltsev, S.; Reilly, J.M. Prospects for plug-in hybrid electric vehicles in the United States and Japan: A general equilibrium analysis. Transp. Res. Part A Policy Pract. 2010, 44, 620–641. [Google Scholar] [CrossRef]
  9. Yazdanie, M.; Noembrini, F.; Heinen, S.; Espinel, A.; Boulouchos, K. Well-to-wheel costs, primary energy demand, and greenhouse gas emissions for the production and operation of conventional and alternative vehicles. Transp. Res. Part D Transp. Environ. 2016, 48, 63–84. [Google Scholar] [CrossRef]
  10. Rosenfeld, D.C.; Lindorfer, J.; Fazeni-Fraisl, K. Comparison of advanced fuels—Which technology can win from the life cycle perspective? J. Clean. Prod. 2019, 238, 117879. [Google Scholar] [CrossRef]
  11. Zhu, Y.; Skerlos, S.; Xu, M.; Cooper, D.R. Reducing Greenhouse Gas Emissions from U.S. Light-Duty Transport in Line with the 2 °C Target. Environ. Sci. Technol. 2021, 55, 9326–9338. [Google Scholar] [CrossRef]
  12. Kagawa, S.; Suh, S.; Hubacek, K.; Wiedmann, T.; Nansai, K.; Minx, J. CO2 emission clusters within global supply chain networks: Implications for climate change mitigation. Glob. Environ. Chang. 2015, 35, 486–496. [Google Scholar] [CrossRef]
  13. Skelton, A.; Guan, D.; Peters, G.P.; Crawford-Brown, D. Mapping Flows of Embodied Emissions in the Global Production System. Environ. Sci. Technol. 2011, 45, 10516–10523. [Google Scholar] [CrossRef]
  14. Shi, J.; Li, H.; An, H.; Guan, J.; Arif, A. Tracing carbon emissions embodied in 2012 Chinese supply chains. J. Clean. Prod. 2019, 226, 28–36. [Google Scholar] [CrossRef]
  15. Wang, Z.; Wei, L.; Niu, B.; Liu, Y.; Bin, G. Controlling embedded carbon emissions of sectors along the supply chains: A perspective of the power-of-pull approach. Appl. Energy 2017, 206, 1544–1551. [Google Scholar] [CrossRef]
  16. Meng, J.; Liu, J.; Xu, Y.; Tao, S. Tracing primary PM2.5 emissions via Chinese supply chains. Environ. Res. Lett. 2015, 10, 054005. [Google Scholar] [CrossRef]
  17. Nagashima, F. Critical structural paths of residential PM2.5 emissions within the Chinese provinces. Energy Econ. 2018, 70, 465–471. [Google Scholar] [CrossRef]
  18. Yang, X.; Zhang, W.; Fan, J.; Li, J.; Meng, J. The temporal variation of SO2 emissions embodied in Chinese supply chains, 2002–2012. Environ. Pollut. 2018, 241, 172–181. [Google Scholar] [CrossRef]
  19. Chang, Y.F.; Lin, S.J. Structural decomposition of industrial CO2 emission in Taiwan: An input-output approach. Energy Policy 1998, 26, 5–12. [Google Scholar] [CrossRef]
  20. Cansino, J.M.; Román, R.; Ordóñez, M. Main drivers of changes in CO2 emissions in the Spanish economy: A structural decomposition analysis. Energy Policy 2016, 89, 150–159. [Google Scholar] [CrossRef]
  21. Feng, K.; Davis, S.J.; Sun, L.; Hubacek, K. Drivers of the US CO2 emissions 1997–2013. Nat. Commun. 2015, 6, 1–8. [Google Scholar] [CrossRef]
  22. Wang, Z.; Liu, W.; Yin, J. Driving forces of indirect carbon emissions from household consumption in China: An input–output decomposition analysis. Nat. Hazards 2014, 75, 257–272. [Google Scholar] [CrossRef]
  23. Dietzenbacher, E.; Los, B. Structural Decomposition Techniques: Sense and Sensitivity. Econ. Syst. Res. 1998, 10, 307–324. [Google Scholar] [CrossRef]
  24. Order No. 12 of 2012; Motor Vehicles Mandatory Scrapping Standards Regulations. Ministry of Commerce of the People’s Republic of China; National Development and Reform Commission; The Ministry of Public Security of the People’s Republic of China; Ministry of Ecology and Environment of the People’s Republic of China: Beijing, China, 2013.
  25. Keller, M.; Lamprecht, U.; Gode, J.; Smokers, R.; Hausberger, S. Cost-Effectiveness of Greenhouse Gases Emission Reductions in Various Sectors; 2006. [Google Scholar]
  26. Bates, J.; Brand, C.; Davison, P.; Hill, N. Economic Evaluation of Emissions Reductions in the Transport Sector of the EU; European Commission: Brussels, Belgium, 2001. [Google Scholar]
  27. Capros, P.; Kouvaritakis, N.; Mantzos, L.; Hendriks, C. Economic Evaluation of Sectoral Emission Reduction Objectives for Climate Change. Top-Down Analysis of Greenhouse Gas Emission Reduction Possibilities in the EU. Final Report; European Commission: Brussels, Belgium, 2001.
  28. Oil Price Website. Available online: http://youjia.chemcp.com/index.asp (accessed on 20 July 2021).
  29. National Energy Administration. Available online: http://www.nea.gov.cn/2019-11/05/c_138530255.htm (accessed on 15 July 2021).
  30. Ministry of Ecology and Environment of the People’s Republic of China. China Vehicle Environmental Management Annual Report; Ministry of Ecology and Environment of the People’s Republic of China: Beijing, China, 2018.
  31. Ministry of Ecology and Environment of the People’s Republic of China. Technical Guidelines for the Preparation of Air Pollutant Emission Inventories for Road Motor Vehicles (for Trial Implementation); Ministry of Ecology and Environment of the People’s Republic of China: Beijing, China, 2014.
  32. Sun, Q.; Wang, Q.; Mao, B. A framework design for the study of energy consumption factors and their comparability for different transportation modes. J. Transp. Syst. Eng. Inf. Technol. 2009, 9, 10–14. [Google Scholar] [CrossRef]
  33. Energy Foundation. Research Report of Electric Vehicle Energy Consumption Limits Standard China Automotive Technology Research Center Limited, Institute of Automotive Standardization. 2018. Available online: https://www.efchina.org/Attachments/Report/report-ctp-20190512-2 (accessed on 20 July 2021).
  34. National Highway and Traffic Safety Administration (NHTSA). Preliminary Regulatory Impact Analysis: Corporate Average Fuel Economy for MY 2011–2015. Passenger Cars and Light Trucks; U.S. Department of Transportation: Washington, DC, USA, 2008.
  35. National Research Council. Assessment of Fuel Economy Technologies for Light-Duty Vehicles; National Academies Press: Cambridge, MA, USA, 2011.
  36. National Research Council (NRC). Technologies and Approaches to Reducing the Fuel Consumption of Medium-and Heavy Vehicles; National Academies Press: Cambridge, MA, USA, 2010.
  37. Sun, X.; Ma, X.; Shi, F.; Han, M.; Xie, H.; He, Y. Decomposition of China’s regional carbon emission paths: An analysis of environmental input and output considering regional development differences. Environ. Sci. Pollut. Res. 2022, 29, 62537–62559. [Google Scholar] [CrossRef]
  38. Wen, L.; Zhang, Y. A study on carbon transfer and carbon emission critical paths in China: I-O analysis with multidimensional analytical framework. Environ. Sci. Pollut. Res. 2020, 27, 9733–9747. [Google Scholar] [CrossRef] [PubMed]
  39. National Bureau of Statistics. 2019. Available online: http://www.gov.cn/zhengce/zhengceku/2019-09/03/content_5426959.htm (accessed on 15 July 2021).
  40. Ministry of Ecology and Environment of the People’s Republic of China. China Mobile Source Environmental Management Annual Report 2019; Ministry of Ecology and Environment of the People’s Republic of China: Beijing, China, 2019.
  41. China Emission Accounts and Datasets (CEADs). 2021. Available online: http://www.ceads.net/data (accessed on 3 July 2021).
  42. Intergovernmental Panel on Climate Change (IPCC). 2019 Refinement to the 2006 IPCC Guidelines for National Greenhouse Gas Inventories; IPCC: Geneva, Switzerland, 2019. [Google Scholar]
  43. General Office of the State Council of China. New Energy Vehicle Industry Development Plan (2021–2035). 2020. Available online: http://www.gov.cn/zhengce/content/2020-11/02/content_5556716.htm (accessed on 3 March 2022).
  44. State Council of the People’s Republic of China. Notice of the General Office of the State Council on Issuing the Air Pollution Prevention and Control Action Plan. Available online: http://www.gov.cn/zwgk/2013-09/12/content_2486773.htm (accessed on 14 September 2022).
  45. He, S.; Zhao, L.; Ding, S.; Liang, S.; Dong, L.; Wang, J.; Feng, Y.; Liu, L. Mapping economic drivers of China’s NOx emissions due to energy consumption. J. Clean. Prod. 2019, 241, 118130. [Google Scholar] [CrossRef]
  46. McKinsey & Co. McKinsey China Auto Consumer Insights; McKinsey & Co.: Tokyo, Japan, 2019. [Google Scholar]
  47. Wu, X.; Wu, Y.; Zhang, S.; Liu, H.; Fu, L.; Hao, J. Assessment of vehicle emission programs in China during 1998–2013: Achievement, challenges and implications. Environ. Pollut. 2016, 214, 556–567. [Google Scholar] [CrossRef]
  48. Wu, Y.; Zhang, S.; Li, M.; Ge, Y.; Shu, J.; Zhou, Y.; Xu, Y.; Hu, J.; Liu, H.; Fu, L.; et al. The challenge to NOx emission control for heavy-duty diesel vehicles in China. Atmos. Chem. Phys. 2012, 12, 9365–9379. [Google Scholar] [CrossRef]
  49. Ministry of Finance of the People’s Republic of China; Ministry of Industry and Information Technology of the People’s Republic of China; Ministry of Science and Technology of the People’s Republic of China; National Development and Reform Commission. Notice on the Financial Subsidy Policy for the Promotion and Application of New Energy Vehicles in 2022; Ministry of Finance of the People’s Republic of China; Ministry of Industry and Information Technology of the People’s Republic of China; Ministry of Science and Technology of the People’s Republic of China; National Development and Reform Commission: Beijing, China, 2021.
  50. Zhao, D.; Lei, Y.; Zhang, Y.; Shi, X.; Liu, X.; Xu, Y.; Xue, W. Analysis of vehicular CO2 emission in the Central Plains of China and its driving forces. Sci. Total Environ. 2022, 814, 152758. [Google Scholar] [CrossRef]
  51. Xu, Y.; Liu, Z.; Xue, W.; Yan, G.; Shi, X.; Zhao, D.; Zhang, Y.; Lei, Y.; Wang, J. Identification of on-road vehicle CO2 emission pattern in China: A study based on a high-resolution emission inventory. Resour. Conserv. Recycl. 2021, 175, 105891. [Google Scholar] [CrossRef]
  52. Gambhir, A.; Lawrence, K.C.; Tong, D.; Martinez-Botas, R. Reducing China’s road transport sector CO2 emissions to 2050: Technologies, costs and decomposition analysis. Appl. Energy 2015, 157, 905–917. [Google Scholar] [CrossRef]
  53. Hu, J.; Li, J.; Hu, Z.; Xu, L.; Ouyang, M. Power distribution strategy of a dual-engine system for heavy-duty hybrid electric vehicles using dynamic programming. Energy 2020, 215, 118851. [Google Scholar] [CrossRef]
  54. Silver, F.; Brotherton, T. CalHEAT Research and Market Transformation Roadmap for Medium-and Heavy Trucks; California Hybrid, Efficient and Advanced Truck Research Center: Pasedena, CA, USA, 2013. [Google Scholar]
Figure 1. Changes in CO2 (a) and NOx (b) emissions in the transport sector from 2012 to 2018.
Atmosphere 13 01540 g001
Figure 2. Contribution of three main drivers of CO2 (a) and NOx (b) emission change in 11 transport subsectors from 2012 to 2018.
Atmosphere 13 01540 g002
Figure 3. Net abatement potential of 33 specific energy-efficient technologies.
Atmosphere 13 01540 g003
Figure 4. Net benefits of 33 specific energy-efficient technologies.
Atmosphere 13 01540 g004
Table 1. List of variables and symbols.
Variable NameSymbolVariable NameSymbol
Direct emission coefficientθVehicle ownershipVO
Total output column vectorXAverage annual mileageAM
Complete demand factor matrix(I − A)−1Fuel densityρ
Final demand column vectorYPower consumption per unit mileagePM
Pollutant emissionsEOil priceOP
Amount of changeΔElectricity priceEP
Production layerPLInvestment costIC
Direct emissionsDtFinal demand of reduction in the refined petroleum sectory1
Indirect production embodied emissionsPtFinal demand of increases in the related industries of auto parts sector, rubber, and complete vehicle manufacture sectory2
Consumption emissionsEtFinal demand of increases in the electricity sectory3
CO2 generation factorαAdditional emissions from the implementation of emission reduction technologies through industry linkagesAPP
Engine efficiencySDirect emission abatement during the use phase of the technologyAPU
Annual statistical NOx emissionsβNet emission abatement potential from LCA perspectiveAPnet
Fuel economyFENet abatement benefitNB
Table 2. Parameters of the three types of vehicles.
TapeVO [30]
(Million Vehicles)
TM [31] ( 10 4 km ) FE or PM [32] (per km)
Passenger Car (Fuel)227.7270.092 L
Passenger Car (Electric) [33]/14.90.164 kW·h
Light Truck100.96450.205 L
Heavy Truck80.841130.297 L
Table 3. Energy saving rate and emission reduction efficiency of 33 technologies. This table shows the technology name, saving efficiency, investment costs, and code.
Passenger Car [6,34]Light Truck [35]Heavy Truck [36]
Technology NameSaving EfficiencyInvestment Costs (Yuan/Vehicle)CodeTechnology NameSaving EfficiencyInvestment Costs (Yuan/Vehicle)CodeTechnology NameSaving EfficiencyInvestment Costs (Yuan/Vehicle)Code
Engine TechnologyEngine Friction Reduction1.50%820.56PC1Engine Friction Reduction2.00%463.22LT1Advanced
6–9 L Engine
16.07%66,174.00HT1
Variable Valve Timing—Dual
Cam Phasing
2.50%403.66PC2Continuous Variable
Valve Lift
2.17%3176.35LT2Advanced Transmission and Drivetrain4.90%10,146.68HT2
Continuous
Variable Valve
Lift
2.50%2024.92PC3Chemometric Proportioning
—Direct Gasoline
Injection
1.50%2438.51LT3Parallel
Hybrid
29.33%130,142.20HT3
Chemometric Proportioning—Direct Gasoline Injection2.40%2425.28PC4Turbocharging and Miniaturization6.25%2316.09LT410% Air Resistance Reduction4.50%11,084.15HT4
Turbocharging
and
Miniaturization
4.85%8093.08PC5High-Efficiency Generator and Accessory1.50%959.52LT5Low Rolling Resistance
Tire
2.47%1345.54HT5
Electric Power Steering1.50%747.77PC6Electric Power Steering2.00%1042.24LT63%
Lightweight
2.65%22,366.81HT6
High-Efficiency Attachment1.50%1270.54 PC7
New Energy technologyDieselization15.20%20,570.19PC8Power Split Hybrid6.50%24,980.69LT7Parallel
Hybrid
29.33%130,142.20HT3
Advanced Dieselization10%3441.05PC9Plug-in Hybrid29.00%52,277.46LT8
General Hybrid13.70%17,160.24PC10
Plug-in Hybrid62%150,649.08PC11
Pure Electric100%208,978.42PC12
Drag reduction technologyLow-Friction Lubricant0.50%33.09PC13Low-Friction Lubricant0.50%19.85LT910% Air Resistance Reduction4.50%11,084.15HT4
5% Lightweight3.30%1581.56PC1410% Air Resistance Reduction2.33%248.15LT10Low Rolling Resistance Tire2.47%1345.54HT5
Low Rolling Resistance Tire1.50%49.63PC15Low Rolling Resistance Tire1.50%39.70LT113%
Lightweight
2.65%22,366.81HT6
10% Air
Resistance Reduction
2.50%582.33PC16
Low Rolling Resistance Tire1.50%49.63PC15
10% Air Resistance Reduction2.50%582.33PC16
Publisher’s Note: MDPI stays neutral with regard to jurisdictional claims in published maps and institutional affiliations.

