Abstract
In addition to the Taiwan Strait, the geographical channel effect (GCE) has been observed in the Taipei Basin during winters. This study explored the potential links amongst GCE phenomena in the basin, fine particulate matter (PM2.5) events, and position of the continental high-pressure system (CHPS). Principal component analysis was applied to classify the CHPS distribution patterns influencing PM2.5 concentrations and meteorological parameters in the Taipei metropolis. In addition, non-parametric Kruskal–Wallis and Dwass–Steel–Critchlow–Fligner tests were applied to compare the parameters amongst distinct groups. Moreover, track analysis was utilised to trace the trajectories of air masses. The merged Dark Target Aerosol Angstrom Exponent (Ocean), Deep Blue Aerosol Angstrom Exponent (Land), and Aerosol Optical Depth (AOD) 3 km (Land and Ocean) of Terra/MODIS and Aqua/MODIS were used to confirm the connection of long-range PM2.5 transport. Two features in the atmospheric environment induce double GCEs: (1) wind direction below 90° in most of the upwind area of the Taisumi and Xindian River Basins; (2) CHPS centres moved across 110° E. Double GCEs can reduce the magnitude of PM2.5 air pollution and shape the distribution of PM2.5; however, they cannot prevent PM2.5 events.
1. Introduction
In the Taipei metropolis of Taiwan, pollution caused by fine PM with a diameter smaller than or equal to 2.5 μm (PM2.5) is prevalent during winters [1]. These air pollution events are attributed to two major causes: (1) emissions and (2) weather conditions, such as transport, downdraft, and air dispersion, amongst others. The link between transport and air pollution is evident [2,3]. Downdraft affects the conditions of air dispersion [4,5], and poor air dispersion worsens air quality, as stagnant atmospheric conditions aid the accumulation of air pollutants [6,7].
In addition to these major factors, the interactions between weather patterns and terrain affect air quality. For instance, in basin areas, air pollutants do not disperse easily [8]. The results of previous studies, such as high PM2.5 concentrations in the Sichuan Basin, China [9], the wintertime Guanzhong Basin, China [10], the Mexico City Basin [11], Chengdu City in the Sichuan Basin, China [12] and the Taipei Basin, Taiwan [13], as well as obvious ventilation in basin areas of Athens, Greece [14], suggested that the common characteristics of PM2.5 pollution in a basin were related to synoptic weather patterns. However, the directions of the channels are different although the abovementioned areas all exhibit basin topography.
The geographic channel effect (GCE) is a type of terrain effect, which can influence the mean wind speed over a basin [15]. In the Taiwan Strait, during northeasterly monsoon seasons, the accumulation of air parcel in windward areas due to the terrain effect of the Wuyi Mountains in China and the Central Mountain Range (CMR) in Taiwan results in the windward ridge and leeside tough phenomenon, which is considered a GCE. Here, the depth of strong winds is as high as 850–900 hPa [16]. This GCE becomes stronger along the north–south air pressure gradient and accelerates northerly winds over the Taiwan Strait [16,17]. According to Lin et al. [18], the GCE of CMR accelerates wind speed over the Taiwan Strait and influences Asian dust transport. In the present study, GCEs were observed over the Taipei Basin; thus, we speculated that the terrain effect plays a key role in concordance with the synoptic weather pattern to influence air quality in the Taipei metropolis.
The Taipei metropolis is located in northern Taiwan, and its topographic characteristics are unique on the Taiwan island, with the presence of three river basins. Yang et al. [19] noted that the associations of PM2.5 with emissions, meteorology, and topography were spatially diverse in China. Therefore, we speculated that factors increasing the mean PM2.5 concentration () in the Taipei Basin are not homogeneous across the Taiwan island. Therefore, the primary aim of the present study was to explore the link between GCE and in the Taipei metropolis during winters, in relation to the location of the continental high-pressure system (CHPS).
2. Materials and Methods
2.1. Study Area
The Taiwan island is located between the Eurasian Plate and Pacific Ocean, which are, respectively, the largest plate and the largest ocean on Earth (Figure 1a). Therefore, monsoon climatic phenomena are very obvious in this region. From October to April, corresponding to the winter seasons in the present study, northeasterly monsoon dominates the weather in the Taipei metropolis [20]. Figure 2 shows the distribution of CHPS centres from 2015 to 2020.
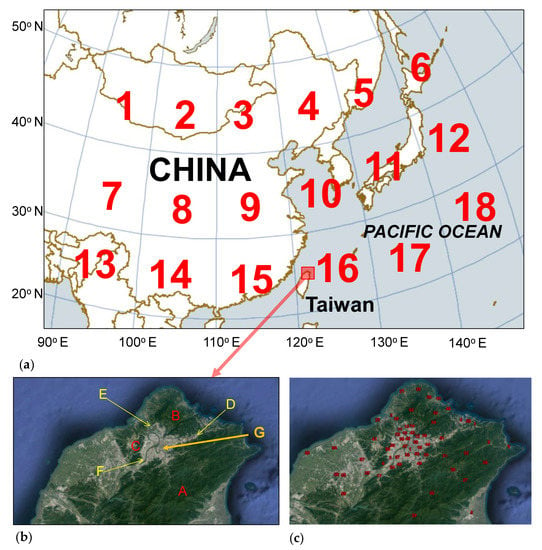
Figure 1.
Geographical information of Taiwan. (a) Location of the Taiwan island and Taipei metropolis. (b) Topographical features of the Taipei metropolis. A: Snowy Mountains; B: Tatun volcano group; C: Linkou tableland; D: Xindian River Basin; E: Tamsui River Basin; F: Tahan River Basin; G: Taipei Basin. (c) Locations of the monitoring sites of the Environmental Protection Administration and Central Weather Bureau. Numbers correspond to number signs (No.) of sites in Table 1. Satellite figures were retrieved from Google Earth, available at: https://earth.google.com/web/@25.07001375,121.56191713,4.3012896a,106580.52557716d,35y,0.294h,0t,0r?utm_source=earth7&utm_campaign=vine&hl=zh-TW (accessed on 4 June 2022).
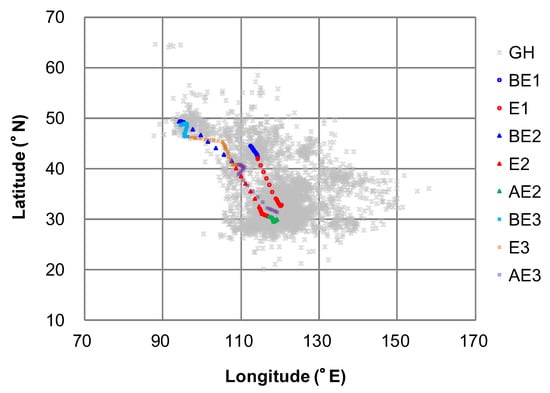
Figure 2.
Distribution of the centres of continental high-pressure systems during general and event hours. GH: general hours; BE1: before event one stage; E1: during event one stage; BE2: before event two stage; E2: during event two stage; AE2: after event two stage; BE3: before event three stage; E3: during event three stage; AE3: after event three stage.
The Taipei metropolis is located in northern Taiwan. With a population of nearly 6.63 million in 2020 [21], it is the largest city on the Taiwan island. The key topographic characteristic of the metropolis is the Taipei Basin, which is surrounded by the Linkou tableland with an altitude of 240–260 m, Tatun volcano group with an altitude of 200–1120 m, and Snowy Mountains with the highest altitude of 2130 m (Figure 1b). There are three channels in the basin. The first is the Tamsui River Basin, which is located in the northwestern part between the Linkou tableland and Tatun volcano group. The second is the Xindian River Basin, located in the northeastern part between the Tatun volcano group and Snowy Mountains. The third is the Tahan River Basin, located in the southwestern part between the Linkou tableland and Snowy Mountains (Figure 1b).
2.2. Materials
The study period was between October and April from 2015 to 2020. Table 1 summarises the information of meteorological and air quality monitoring sites in the present study [22,23]. Data of hourly PM2.5 concentration (μg·m−3), wind speed (WS, m·s−1), and wind direction (WD, degree) at the 24 air quality monitoring stations owned by the Taiwan Environmental Protection Administration were obtained from the air quality monitoring network. Data of hourly surface air pressure (hPa), air temperature (Tm, °C), relative humidity (RH, %), WS, rainfall (RA, mm), and dew point temperature (°C) were obtained from the four meteorological stations and 32 auto-monitoring meteorological sites owned by the Taiwan Central Weather Bureau (CWB). Figure 1c shows the distribution of the 24 air quality monitoring sites and 36 meteorological sites. The daily surface east Asian weather maps, recorded at 02:00, 08:00, 14:00, and 20:00 local standard time (LST), were obtained from the Japan Meteorological Agency by the Data Bank for Atmospheric and Hydrological Research of the Department of Atmospheric Science, Chinese Culture University.

Table 1.
Geographical information of the 36 meteorological sites and 24 air quality monitoring sites.
2.3. Methods
2.3.1. Location of the Continental High-Pressure System
In the present study, the region in which CHPS centres were located (between 20° N–50° N and 90° E–150° E) was categorised into 18 grids at 10° longitude × 10° latitude per grid. As shown in Figure 1a, the region included grids 1, 2, 3…, and 18. Furthermore, each grid was categorised into 4 sub-grids at 5° longitude × 5° latitude per sub-grid, including sub-grids 1-1, 1-2, 2-1…, and 18-2 (Figure 3a). The locations of CHPS centres were estimated using Equations (1) and (2), as follows:
where x, x1, y, and y1 are the measured lengths on the surface weather map; a is the minimum longitude of the grid; x1 is the measured length between CHPS centre and a; x is the measured length of 10° longitude; b is the minimum latitude of the grid; y1 is the measured length between CHPS centre and b; y is the measured length of 10° latitude.
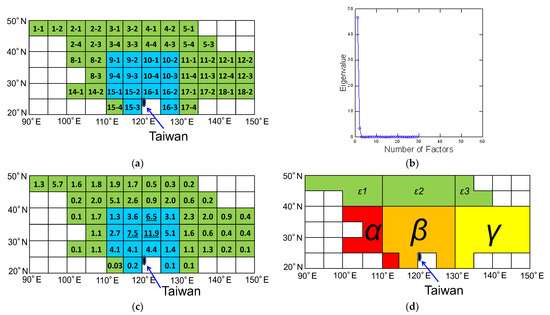
Figure 3.
Association between the atmospheric environment in the Taipei metropolis and location of the continental high-pressure system (CHPS) as calculated using principal component analysis (PCA). (a) Assigned number of the location of CHPS centre. (b) Number of major factors and their eigenvalues. (c) Frequency (%) of the location of CHPS centres. Green regions indicate the first component of PCA, and blue regions indicate the second component of PCA on nine parameters. The Taiwan island is indicated as the dark region. (d) Four sub-groups (α, β, ɣ, ε). R-ε included sub-regions ε1, ε2, and ε3.
2.3.2. Preliminary Data Treatment
In the present study, the data of hourly rainfall greater than or equal to 0.1 mm, defined as a rainy hour, were omitted. This is because precipitation removes wet PM and prevents surface dust transport [24]. Since the present study focused on CHPS, hourly data unrelated to CHPS, hourly data with unidentified weather patterns, and hourly data with multi-weather patterns were excluded.
Furthermore, some data were calculated preliminarily. Surface air pressure difference, ∆P (hPa), between the Taipei station and CHPS centre was estimated using Equation (3), as follows:
where P1 (hPa) is the surface air pressure at CHPS centre; P2 (hPa) is the surface air pressure at the Taipei station; ∆θ (degree) is the angle between the Taipei station and CHPS centre, estimated using Equation (4), as follows:
where θ1 (degree) is the longitude of CHPS centre and θ2 (degree) is the longitude of the Taipei station.
The distance between the Taipei station and CHPS centre, (d, km), the geodesic length on the planet’s surface, was calculated using nested equations developed by Vincenty [25]. In the present study, locations of the Taipei stations owned by CWB were represented as point sites in the Taipei metropolis (Figure 1c), whose number signs (No.) of sites in Table 1 are from No. 1 to No. 3. Vincenty’s inverse solution program can be run on the website of Vincenty solutions of the geodesics on the ellipsoid (http://www.movable-type.co.uk/scripts/latlong-vincenty.html; accessed on 29 April 2022).
2.3.3. Definition of PM2.5 Event
There are 17 air quality monitoring sites in the Taipei metropolis, whose number signs of sites in Table 1 are from No. 37 to No. 53. In the present study, the definition of a PM2.5 event was set to fulfil the following three requirements: (1) hourly ≥ 48 μg·m−3 in the Taipei metropolis; (2) at least 80% of the 17 sites reaching the PM2.5 concentration threshold; (3) the first and second conditions lasting for at least 12 h. The value of 48 μg·m−3 was the 99th percentile of the ranking of hourly in the Taipei metropolis from 1 January 2015 to 31 December 2020.
The pollution index (PI) reflects the magnitude of air pollution, estimated using Equation (5). PI estimates the magnitude of air pollution by considering the proportion of polluted areas. The greater the PI, the more severe the PM2.5 pollution.
where is the hourly of the 17 sites and PArea is the percentage of the 17 sites whose is ≥48 μg·m−3, representing the proportion of polluted areas.
2.3.4. Ventilation Index
In the present study, the ventilation index (VI) was used to represent the air dispersion of pollutants [26,27], estimated using Equation (6), as follows:
where MH is the mixing height (m) and WS is mean wind speed (m·s−1) in the Taipei metropolis.
VI = MH × WS
In the present study, the Nozaki planetary boundary layer height (PBLH) [28] was used to calculate the mixing height of the Taipei metropolitan area, as shown in Equations (7) and (8). There were two reasons for the use of the Banqiao station as a special site. First, the Banqiao station is a sounding meteorological station. The observation of hourly mixing height was challenging, as the sounding data at the Banqiao station are obtained twice a day, at 08:00 and 20:00 LST, respectively. The use of the PBLH equation can resolve the problem of insufficient data. Second, Huang and Chang [29] estimated mixing height using the sounding data of Banqiao station, Taiwan, and found that the estimation of mixing height by the Nozakai method was greater than that by the Holzworth method. In previous studies by Ali and Hassoon [30], Du et al. [31], Lai [32], and Zeng and Zhang [33], the definition of parameters in these two equations was mentioned and the PBLH equation was applied to assess air pollution. The settings of the parameters, such as L (terrain rough length) [34] and S (stable parameters) [35] in the Banqiao station, were described in the previous study by Lai [32].
2.3.5. Principal Component Analysis
Typically, air pollutant concentrations differ between the windward and leeward sides [36,37,38]. For instance, Cheng [39] found that ozone events occurring in the Taichung Basin, Taiwan, which is on the leeward side of CMR, were related to the eastern wind field generated by the peripheral circulation of synoptic weather patterns. Hsu and Cheng [40] indicated that three synoptic weather systems, including CHPS lingering, eastward movement, and CHPS leaving the Asian continent, were closely related to air pollution in Taiwan. In addition, peaked when CHPS left the Asian continent, with western Taiwan on the leeward side of CMR. Therefore, in the present study, CHPSs were initially categorised into three major types: type I, in which CHPS centres were in the Asian continent; type II, in which CHPS centres moved eastward to the sea but not across 125° E; type III, in which CHPS centres moved across 125° E and left the Asian continent [41,42]. Further, to focus on the effect of CHPS on PM2.5 concentration and weather conditions in the Taipei metropolis, apart from the three major types, data of other synoptic weather patterns and rainy hours were excluded.
CHPS centres were distributed from the northwest to southeast (Figure 2). The region between 20° N–50° N and 90° E and 150° E was categorised into 5° longitude × 5° latitude sub-grids. One sub-grid included several CHPS centres, depending on the locations of CHPSs. One CHP centre corresponded to nine hourly parameters (i.e., , ΔP, d, ∆θ, PArea, Tm, RH, WS, and MH) in the Taipei metropolis. Each sub-grid included the average hourly and eight hourly parameters when several centres were in the sub-grid. The nine parameters were estimated by principal component analysis (PCA) to determine the number of groups divided when CHPS centres were located in the region of the sub-grid, as the PCA scores are more definite than common factor analysis scores [43]. In this study, the purpose of PCA was to summarise many sub-grids by a few groups. This indicated that the weather parameters within each group were more correlated with parameters in the group with high eigenvalue than with the parameters of other groups with relatively low eigenvalue.
2.3.6. Non-Parametric Statistical Methods
and weather parameter data for the Taipei Basin in the groups did not obey the distributional assumptions for linear models, whose treatments did not follow the four assumptions: (1) additivity of the treatment effect; (2) independence of the error; (3) homogeneity of the error; (4) normality of the error. In addition, normalising transformation did not improve data quality. Therefore, non-parametric tests, including the Kruskal–Wallis test [44], were utilised to analyse variance; that is, and weather parameter data for the Taipei Basin in the groups representing the different locations of CHPS centres, as well as the different stages of the period. The null hypothesis of the test was that the group distribution functions were equal. The alternative hypothesis was that the mean values of the groups were not equal. If the null hypothesis of the Kruskal–Wallis test was rejected, the Dwass–Steel–Critchlow–Fligner test [45] was applied for all pairwise comparisons amongst the groups.
2.3.7. Back Trajectory Tracks
Tracks analysis is available at https://aeronet.gsfc.nasa.gov/cgi-bin/bamgomas_interactive (accessed on 11 July 2022), based on the trajectory code developed at NASA/Goddard Code 614-The Atmospheric Chemistry and Dynamics Branch. In the present study, we set a 3-day trajectory interval of the Hybrid Single-Particle Lagrangian Integrated Trajectory (HYSPIT) model output [46,47] for the three PM2.5 events, which all occurred during 2015, at 20:00 LST on 17 January, at 12:00 LST on 5 February, and at 16:00 LST on 16 December, respectively. The back trajectory focused on the ending height of 100, 500, and 1000 m-AGL at the Taipei station. The trajectory dataset input was retrieved from the Global Data Assimilation System. Many studies (e.g., Hondula et al. [48] and Ma et al. [49]) have applied the HYSPIT model back trajectories to assess air mass tracks.
2.3.8. Features of Emission Sources
The merged Dark Target Aerosol Angstrom Exponent (550 and 860 nm, Ocean) and Deep Blue Aerosol Angstrom Exponent (412–470 and 470–670 nm, Land) as well as Aerosol Optical Depth (AOD) 3 km (550 nm, Land and Ocean) [50,51] of Terra/MODIS and Aqua/MODIS obtained from Worldview, NASA (https://www.earthdata.nasa.gov/eosdis/science-system-description/eosdis-components/gibs; accessed on 28 June 2022) were utilised to indicate the features of PM and levels of aerosols from the emission sources, which are associated with long-range transport. The larger the Angstrom exponent, the smaller the particle size. When the exponent value is <1, the optical dominance is coarse PM. On the contrary, when the exponent value is >1, the optical dominance is fine PM. For AOD 3 km, when the AOD value is <0.1, the sky is clean, but when the AOD value is >3, the sky is polluted (indicating the presence of abundant aerosols).
3. Results
The tracks of CHPS centres were distributed from the northwest to southeast between October and April from 2015 to 2020 (Figure 2). These tracks indicated that CHPSs moved on the northwest to southeast, related to air pollution events in Taiwan [39,52]. During winter, CHPS can mainly affect weather conditions in the Taipei metropolis, which is in northern Taiwan.
3.1. Distribution of Continental High-Pressure System
Principal component analysis of the mean nine hourly parameters revealed two major PCs when CHPS centres were located in sub-grids 1-1, 1-2, and the other 48 sub-grids (Figure 3a). These were considered two groups (Figure 3b), categorised based on sub-grids (Figure 3a) in which CHPS centres typically appeared when the and atmospheric environment exhibited similar characteristics. As shown in Figure 3c, the frequency of the centres in the second group was greater than that in the first group. As shown in Figure 3a, the second group included 9, 10, 15-1, 15-2, 15-3, 16-1, 16-2, and 16-3, with most regions between 20° N–40° N and 110° E–130° E. The first group included other regions between 20° N–50° N and 90° E–150° E, except those in the second group. As shown in Figure 3c, CHPS centres were concentrated in 9-3, 10-1, and 10-4, which were in the second group and near the Taiwan island.
The negative linear relationship between in the Taipei metropolis and d appeared within approximately 1500 km (Figure 4). Therefore, we further divided the two major groups formed based on PCA results into four sub-groups: regions α (R-α), R-β, R-γ, and R-ε. R-α included sub-grids 8-1, 8-2, 8-3, 14-1, 14-2, and 15-4; R-β included grids 9, 10, sub-grids 15-1, 15-2, and 15-3, and 16; R-γ included grids 11, 12, 17, and 18; R-ε included sub-regions ε1, ε2, and ε3 (Figure 3d).
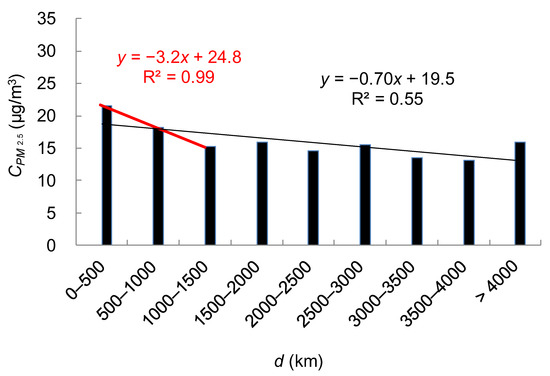
Figure 4.
Relationship between mean PM2.5 concentration (, μg·m−3) in the Taipei metropolis and distance between the Taipei station and centre of the continental high-pressure system (d, km).
In the sub-regions, d exceeded 1500 km. In addition, values in the Taipei metropolis did not significantly differ when CHPS centres were in sub-regions ε1, ε2, and ε3 (Table 2). Therefore, in the present study, further comparisons of and other weather parameters focused on three groups: R-α, R-β, and R-γ.

Table 2.
Mean PM2.5 concentrations () and major parameters in the Taipei metropolis during winters from 2015 to 2020, when the centres of continental high-pressure system (CHPS) were in sub-regions ε1, ε2, and ε3.
3.2. Geographical Channel Effect in the Taipei Basin
Mean PI (121.3 ± 718.5) in R-β was significantly lower than that in R-γ (130.8 ± 615.2; p < 0.05) (Table 3). This difference may be attributed to air dispersion, which is likely related to the location of the CHPS [40]. For instance, in R-β, mean WS, MH, and VI were the highest, whereas mean Tm, ΔP, and d were the lowest. On the contrary, the highest , mean ∆θ, and d, but the lowest mean WS, MH, and VI were recorded in R-γ. Therefore, air dispersion in the Taipei metropolis was poor when the CHPS centres were the farthest from Taipei amongst the three groups. These results are consistent with the findings of Gao et al. [53] and Vecchi et al. [54], who indicated that poor air quality is positively related to poor air dispersion.

Table 3.
Mean PM2.5 concentrations () and major parameters in the Taipei metropolis during winter from 2015 to 2020, when the centres of the continental high-pressure systems were in regions α, β, and γ.
During winter, the northeasterly monsoon is closely associated with CHPS, dominating the weather conditions in the Taipei metropolis. As shown in Figure 5, mean wind fields in the Taipei metropolis during winter differed when CHPS centres were in R-α, R-β, and R-γ. As shown in Figure 5a,b,d,e, double GCEs were obvious in the Xindian and Tahan River Basins when CHPS centres were in R-α and R-β, which were closer to the Taipei metropolis than R-γ. In this scenario, some of the northeasterly winds were interrupted by the Tatun volcano group and Snowy Mountains. Therefore, the mean wind speeds in the Xindian River Basin increased due to the GCE. In the downwind area of the Taipei Basin, the second GCE occurred in the Tahan River Basin because the northeasterly winds were interrupted by the Linkou tableland and Snowy Mountains. The second GCE was weaker compared to the first GCE. The two GCEs increased the mean wind speed, MH, and VI, resulting in good air dispersion to dilute PM2.5 concentrations.
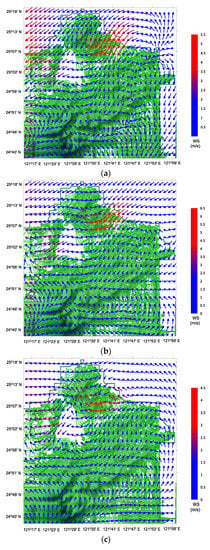
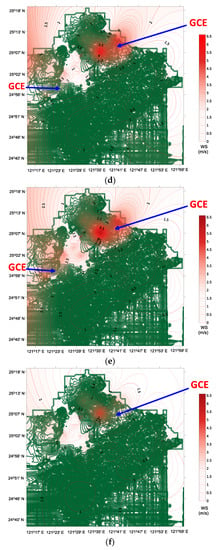
Figure 5.
Mean wind speed (m·s−1) and resultant vectors (degree) in the Taipei metropolis when the centres of the continental high-pressure system (CHPS) were in different regions: (a) region-α; (b) region-β; (c) region-γ. Mean wind speed (m·s−1) and geographical channel effect (GCE) in the Taipei metropolis when the centres of CHPS were in different regions: (d) region-α; (e) region-β; (f) region-γ.
Compared with those in R-α and R-β, the easterly winds were more obvious than the northeasterly winds and the mean wind speeds were less in R-γ (Figure 5). The double GCEs in the Xindian and Tahan River Basins were less obvious in R-γ than in R-α and R-β. The mean wind speed may have been low to generate an obvious GCE. Overall, the following major feature was noted when double GCEs occurred in the Taipei Basin: most mean resultant vectors were <90° in areas between 25°07′ N–25°18′ N and 121°15′ E–121°47′ E. In the present study, this region was considered the upwind area of the Taisumi and Xindian River Basins (UARB). Compared with that in R-α, air dispersion was greater in R-β. However, PI was significantly greater in R-β, although the double GCEs occurred in both R-α and R-β. Therefore, other factors likely influenced PI. The following three case studies may help clarify reasons underlying the occurrence of PM2.5 events.
3.3. Case Studies
Periods one, two, and three, which represented three distinct CHPSs (Figure 2, Table 4), were used to assess the three PM2.5 events (event one between 7:00 and 22:00 LST on 17 January (16 h); event two between 9:00 and 23:00 LST on 5 February (15 h); event three between 17:00 LST on 15 December and 18:00 LST on 16 December (26 h)). According to the characteristics of CHPS, each period was divided into two or three stages to realize variations in events: before event one stage (BE1), during event one stage (E1), before event two stage (BE2), during event two stage (E2), after event two stage (AE2), before event three stage (BE3), during event three stage (E3), and after event three stage (AE3). Within the same period, the time length of a stage was the same. In comparison to periods two and three, the number of stages was less in period one because the CHPS centre dispersed after 22:00 LST on 17 January. Therefore, there was no after event one stage in period one.

Table 4.
Mean PM2.5 concentrations () and major parameters in winter from 2015 to 2020 during the three periods including events 1, 2, and 3 in the Taipei metropolis.
During period one, at 20:00 LST on 16 January, air pressure at the CHPS centre was 1044 hPa and it lingered in the Inner Mongolia Autonomous Region (43° N, 113° E) at BE1. At this stage, in the Taipei metropolis was 27.0 ± 8.2 μg·m−3. At 20:00 LST on 17 January, air pressure at the CHPS centre decreased to 1032 hPa and was located in the Jiangsu Province (32° N, 120° E) (Figure 6a), when maximum in the Taipei metropolis was 78.5 μg·m−3. The minimum Tm, RH, ΔP, and d were recorded at E1. Furthermore, the mean MH, VI, and Δθ at E1 were significantly greater than those at BE1 (Figure 7a, Table 4). When CHPS was at a specific location, where the minimum mean d recoded and Δθ was −3.5 ± 2.2°. Thus, strong peripheral circulation of the northeast monsoon affected weather conditions in the Taipei metropolis (Figure 6a), leading to a high VI. As shown in Figure 8a, the back trajectories of air masses ended at 20:00 LST on 17 January at the Taipei station. Therefore, rather than the stagnant atmospheric environment, the high was related to long-range transport over the Circum-Bohai-Sea region (CBSR) in China due to strong northeasterly monsoon, which was affected by the location of the CHPS centre. The values of merged Dark Target Aerosol Angstrom Exponent (Ocean) and Deep Blue Aerosol Angstrom Exponent (Land) of Terra/MODIS and Aqua/MODIS (Figure 9a) were greater than one. In addition, the 3 km AOD was greater than three in CBSR. The Terra satellite passed over CBSR at 11:24–11:25 LST on 16 January, and the Aqua satellite passed over CBSR at 13:02–13:03 LST, while the long-range transport was over CBSR in China. From these results, levels of PM pollutants and aerosols were high in CBSR, supporting the transport of fine PM.
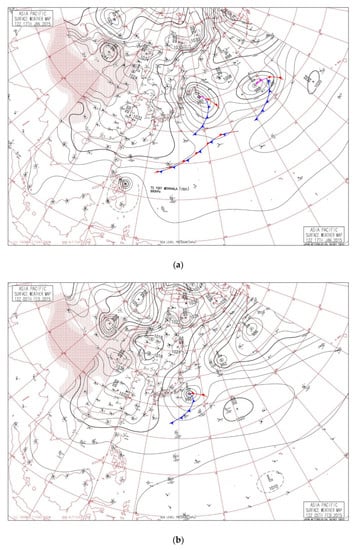
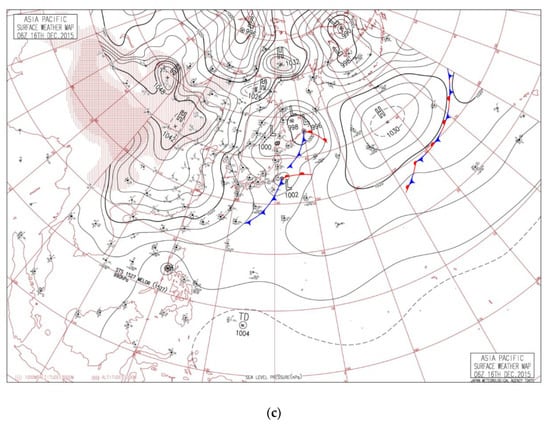
Figure 6.
Surface weather map of East Asia: (a) at 20:00 LST on 17 January 2015; (b) at 20:00 LST on 5 February 2015; (c) at 14:00 LST on 16 December 2015.
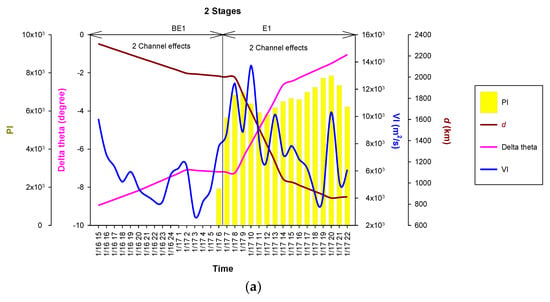
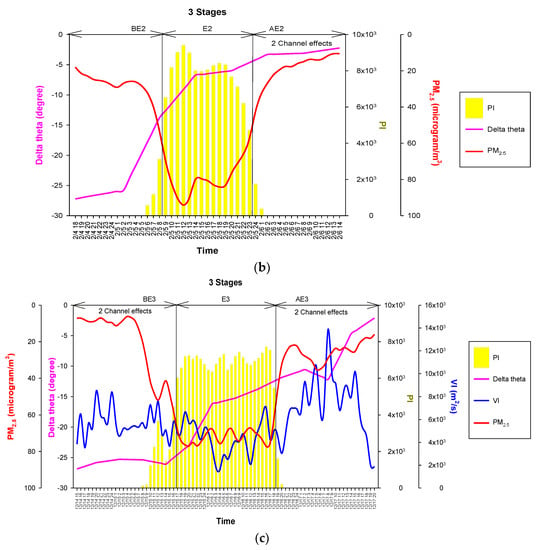
Figure 7.
Time series of PM2.5 concentration (μg·m−3), pollution index (PI), ventilation index (VI, m2·s−1), distance between the centre of the continental high-pressure system (CHPS) and Taipei (d, km), and difference in longitude (∆θ) between the CHPS centre and Taipei during the three periods: (a) period 1; (b) period 2; (c) period 3. BE1: before event one stage; E1: during event one stage; BE2: before event two stage; E2: during event two stage; AE2: after event two stage; BE3: before event three stage; E3: during event three stage; AE3: after event three stage.
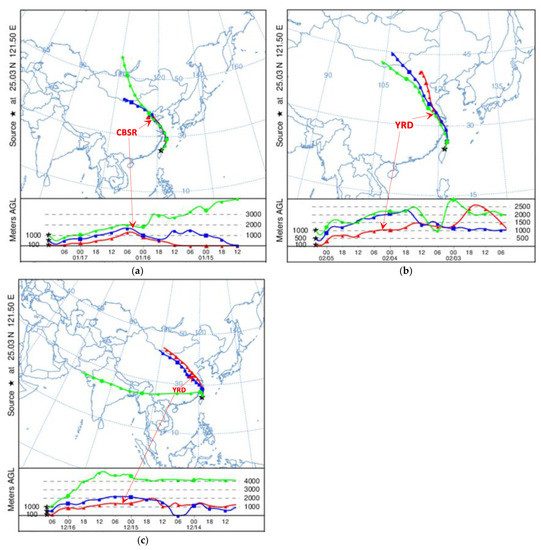
Figure 8.
Back trajectory tracks run using NOAA HYSPLIT model, NASA/AERONET based on GDAS meteorological data of three PM2.5 events at the Taipei station ending (maximum in Taipei) at (a) 20:00 LST on 17 January 2015; (b) 12:00 LST on 5 February 2015; (c) 16:00 LST on 16 December 2015. Red line: 100 m-AGL; blue line: 500 m-AGL; green line: 1000 m-AGL.
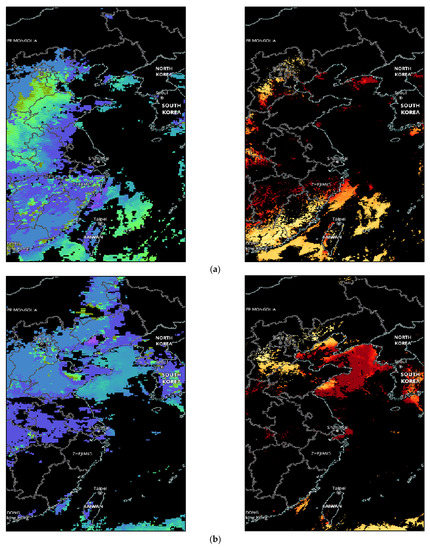
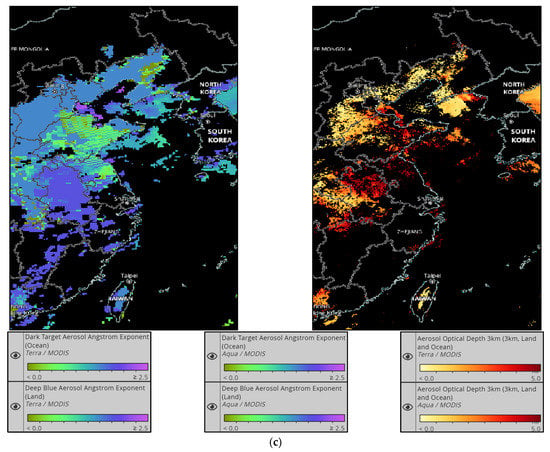
Figure 9.
Satellite retrievals of Terra/MODIS and Aqua/MODIS from NASA Worldview merged Deep Blue Aerosol Angstrom Exponent (Land) and Dark Target Aerosol Angstrom Exponent (Ocean) are shown on the left; Aerosol Optical Depth 3km (3km, Land and Ocean) is shown on the right. (a) The Terra satellite passed over the Circum-Bohai-Sea region (CBSR) at 11:24–11:25 LST, and the Aqua satellite passed over CBSR at 13:02–13:03 LST, 16 January 2015; (b) the Terra satellite passed over Yangtze River Delta (YRD) at 10:16–10:17 LST, and the Aqua satellite passed over YRD at 13:33–13:34 LST, 4 February 2015; (c) the Terra satellite passed over YRD at 10:54–10:55 LST, and the Aqua satellite passed over YRD at 12:30–12:31 LST, 15 December 2015. Satellite figures were provided by Global Imagery Browse Services, NASA. The interactive interface for browsing global, full-resolution satellite imagery is available at https://earthdata.nasa.gov/gibs (accessed on 28 June 2022).
During period two, at 20:00 LST on 4 February, air pressure at the CHPS centre was 1056 hPa, located in Mongolia (49° N, 94° E) at BE2. It then moved toward the east–southeast. At 12:00 LST on 5 February, the maximum in the Taipei metropolis was 94.2 μg·m−3 (Figure 7b). At 20:00 LST, air pressure at the CHPS centre decreased to 1032 hPa, located in the Hubei Province (31° N, 115° E) at E2 (Figure 6b). It then moved further toward the east-southeast. At 08:00 LST on 6 February, air pressure at the CHPS centre decreased to 1030 hPa, located in the Jiangxi Province (29° N, 118° E) at AE2. It then moved slowly toward the east. At the three stages, apart from Δθ, Tm, RH, WS, MH, VI, ΔP, and d at E2 were not significantly different between BE2 and AE2 (Table 4). Thus, CHPS was at a specific location, where mean Δθ was −7.4 ± 2.4° at E2. As shown in Figure 8b, the back trajectories of air masses ended at 12:00 LST on 5 February in Taipei. Therefore, the observed event was related to the long-range transport of PM over Yangtze River Delta (YRD), which was closely linked with the specific location of CHPS. As shown in Figure 9b, the exponent was greater than one in YRD. In addition, the AOD 3km value was greater than three in YRD. The Terra satellite passed over YRD at 10:16–10:17 LST, and the Aqua satellite passed over YRD at 13:33–13:34 LST, 4 February 2015, while the long-range transport of PM was over YRD. From these results, aerosol levels were high in YRD, which supported fine PM transport.
During period three, at 08:00 LST on December 15, air pressure at the CHPS centre was 1052 hPa, located in the Xinjiang Uighur Autonomous Region (43° N, 96° E) at BE3. It then moved toward the southeast. At 14:00 LST on 16 December, it was located in the Inner Mongolia Autonomous Region (40° N, 107° E) at E3 (Figure 6c). It then moved eastward. At 16:00 LST on 16 December, the maximum in the Taipei metropolis was 77.2 μg·m−3 (Figure 7c). At 20:00 LST on 16 December, air pressure at the CHPS centre decreased to 1044 hPa, located in the Inner Mongolia Autonomous Region (40° N, 109° E) at AE3. It then moved toward the east-southeast. The maximum and PI and the minimum VI were recorded at E3 (Table 4), indicating poor air dispersion. Values of ∆P, d, and ∆θ at E3 were significantly different from those at BE3 and AE3. Thus, CHPS was at a specific location, where mean d was 2602.3 ± 358.6 km and mean ∆θ was −17.0 ± 3.7 (degree). As shown in Figure 8c, the back trajectories of the air mass ended at 16:00 LST on 16 December. Thus, the observed event was related to the long-range transport of PM over YRD, China. As shown in Figure 9c, the exponent was greater than one in YRD. In addition, the AOD 3 km value was greater than three in YRD. The Terra satellite passed over YRD at 10:54–10:55 LST, and the Aqua satellite passed over YRD at 12:30–12:31 LST, 15 December 2015. Thus, fine PM pollutants appeared in YRD where aerosol levels were high, which supported fine PM transport. Overall, in addition to poor air dispersion, the observed events were related to long-range transport due to the specific location of CHPS.
4. Discussion
During event stages, high PM2.5 concentrations accumulated in specific areas of the Taipei Basin. At E1, the double GCEs in the Xindian and Tahan River Basins were obvious (Figure 10b). At E2 and E3, the GCE in the Xindian River Basin was evident, although that in the Tahan River Basin was not (Figure 10d,g). At E1, E2, and E3, high PM2.5 concentrations accumulated at the downwind exit of the Xindian River Basin and in the eastern Linkou tableland, which are weak wind areas of the basin. Compared with those at E2 and E3, the accumulative PM2.5 phenomena were less obvious at E1 due to the double GCEs (Figure 10b,d,g). Therefore, double GCEs can mitigate the magnitude of PM2.5 pollution. In other words, amongst E1, E2, and E3, double GCEs occurred only at E1, although they could not prevent the PM2.5 event. Compared with those at E2 and E3, and PI were lower at E1 (Table 4). Thus, the double GCEs reduced and the magnitude of the PM2.5 events.
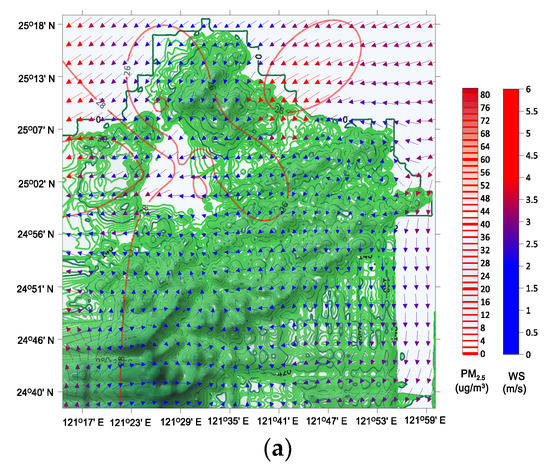
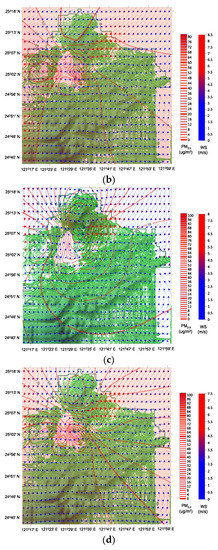
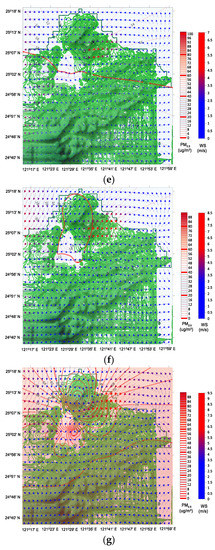
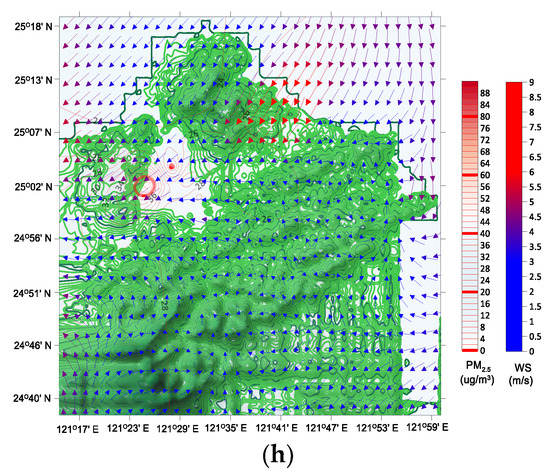
Figure 10.
Distribution of mean PM2.5 (μg·m−3), mean wind speed (m·s−1), and the resultant vectors (degree) in the Taipei metropolis: (a) BE1; (b) E1; (c) BE2; (d) E2; (e) AE2; (f) BE3; (g) E3; (h) AE3. BE1: before event one stage; E1: during event one stage; BE2: before event two stage; E2: during event two stage; AE2: after event two stage; BE3: before event three stage; E3: during event three stage; AE3: after event three stage.
Our results are different from the findings of Chuang et al. [13], who suggested that terrain blocking may induce the accumulation of aerosols via high-pressure peripheral circulation, as the Taipei Basin is on the leeside of the Snowy Mountains; the findings of Ho et al. [55], who suggested that more than 50% of PM2.5 events in Taipei were from local emissions, which was related to photochemical reaction in southwesterly monsoon seasons in summers. During the three PM2.5 events, instead of terrain blocking related to the leeside of the Snowy Mountains and photochemical reaction, the high PM2.5 concentrations accumulating at the downwind exit of the Xindian River Basin were related to long-range transport by and location of CHPSs. Air pollutants can be transported to downwind areas via wind [56,57]. Our results were similar to the findings of Zhang et al. [58], who reported that PM2.5 cross-region transport between the Beijing–Tianjin–Hebei region and the Cheng-Yu region affected PM2.5 concentration in the Cheng-Yu region in the Sichuan Basin of China. Consistently, Zhan et al. [59] noted that PM2.5 pollution in a city cluster in the Sichuan Basin, China, was related to long-range transport. However, these previous studies did not focus on the GCE of YRD in the northeastern Sichuan Basin. Furthermore, Xiao et al. [60] demonstrated that haze pollution was associated with weather conditions, such as calm winds, low temperature, low RH, and high surface pressure, in the Chengdu City Basin of China. Our study further observed that double GCEs could reduce and affect the distribution of in the Taipei Basin.
The double GCEs appeared at BE1, E1, AE2, BE3, and AE3 (Figure 10). However, apart from at E1, in the Taipei metropolis was below 48 μg·m−3 at the abovementioned stages, and the minimum mean WS was 1.8 ± 0.4 m·s−1 (Table 4). These findings imply that double GCEs could not entirely prevent the PM2.5 event resulting from long-range transport over YRD or CBSR. As shown in Figure 10b, double GCEs appeared in the Xindian and Tahan River Basins at E1. Compared with that at E1 (Figure 10b), PM2.5 concentrations in the accumulative areas were higher at E2 and E3 (Figure 10d,g). In addition, at E2 and E3 was greater than that at E1. Therefore, double GCEs reduced and the magnitude of PM2.5 events, although the basin terrain can limit the dispersion of PM2.5 depending on the position [61]. Our results were partly similar to the findings of Zhao et al. [62], who observed that the decrease in PM2.5 concentrations in the Sichuan Basin, China, was related to good vertical and horizontal dispersion as well as increase in wind speed and change in wind direction in the basin. While the link between CHPS location and GCE occurrence in the Taipei Basin cannot be verified in Table 4, Figure 2 indicates that when CHPS centres were ≥110° E during event stages, double GCEs in the Taipei Basin occurred 82.7% of the time.
5. Conclusions
The association between the atmospheric environment, such as , ΔP, d, ∆θ, PArea, Tm, RH, WD, and MH, in the Taipei metropolis and CHPS distribution was categorised into two major components using PCA, based on CHPS location. A negative linear correlation was noted between in the Taipei metropolis and the distance between the CHPS centre and Taipei within 1500 km. Compared with that in R-γ, the mean PI in the Taipei metropolis was lower when the CHPS centre was located in R-α and R-β, where the double GCEs of the Xindian and Tahan River Basins were more obvious. Two features in the atmospheric environment induced the double GCEs to reduce : (1) the resultant vectors <90° in most areas of UARB and (2) CHPS centres moved across 110° E. Our three cases studies indicated that the most common reason for the occurrence of the observed PM2.5 events was long-range transport over YRD or CBSR, China, which was associated with CHPS location (i.e., specific mean Δθ). Therefore, the double GCEs can reduce and mitigate PI in the basin, although they cannot entirely prevent a PM2.5 event.
Governmental health authorities should consider public health concerns in areas of high PM2.5 concentrations at the downwind exit of the Xindian River Basin and eastern Linkou tableland when PM2.5 events occur during the winter. In addition, related authorities should formulate relevant active strategies to help inhabitants protect themselves from PM2.5 pollution. Furthermore, governmental economic authorities should enforce policies to avoid establishment of industries that cause intense pollution in these areas.
A limitation of the present study is the precision of Asian surface weather maps, which affected the quantification of ΔP, d, and ∆θ. This is because the data of isobars, fronts, CHPS centre location, and others are related to the number and density of meteorological sites. The greater the number and density of meteorological sites, the more precise the data.
Author Contributions
Conceptualization, L.-W.L. and C.-Y.L.; methodology, L.-W.L. and C.-Y.L.; software, L.W.; validation, L.-W.L. and C.-Y.L.; formal analysis, L.-W.L.; investigation, L.-W.L. and C.-Y.L.; resources, L.-W.L. and C.-Y.L.; data curation, L.-W.L. and C.-Y.L.; writing—original draft preparation, L.-W.L. and C.-Y.L.; writing—review and editing, L.-W.L. and C.-Y.L.; visualization, L.-W.L. and C.-Y.L.; supervision, L.-W.L. and C.-Y.L.; project administration, L.-W.L.; funding acquisition, L.-W.L. All authors have read and agreed to the published version of the manuscript.
Funding
This research was funded by the Taiwan Ministry of Science and Technology, grant number MOST 110-2111-M-141-001.
Institutional Review Board Statement
Not applicable.
Informed Consent Statement
Not applicable.
Data Availability Statement
The meteorological data are available at the Data Bank for Atmospheric and Hydrological Research in the Department of Atmospheric Science, Chinese Culture University [https://dbar.pccu.edu.tw/Default.aspx] (accessed on 18 July 2022). The PM2.5 concentration data are available at the Taiwan Environmental Protection Administration [https://airtw.epa.gov.tw/CHT/Query/His_Data.aspx] (accessed on 18 July 2022).
Acknowledgments
The authors are grateful to the Taiwan Central Weather Bureau (CWB) and the Environmental Protection Administration for providing meteorological and air pollutant concentration data. The authors are grateful to the Central Geological Survey at the Ministry of Economic Affairs for providing the digital terrain model data. The authors also thank the Data Bank for Atmospheric and Hydrological Research of the Department of Atmospheric Science at the Chinese Culture University for providing the meteorological data owned by CWB. The authors gratefully acknowledge the NOAA Air Resources Laboratory (ARL) for the provision of the HYSPLIT transport and dispersion model and/or READY website [https://www.ready.noaa.gov] (accessed on 11 July 2022) used in this publication. The authors thank the Global Imagery Browse Services, NASA, for providing satellite retrievals.
Conflicts of Interest
The authors declare no conflict of interest.
References
- Lai, L.W. Fine particulate matter events associated with synoptic weather patterns, long-range transport paths and mixing height in the Taipei Basin, Taiwan. Atmos. Environ. 2015, 113, 50–62. [Google Scholar] [CrossRef]
- Tao, M.; Chen, L.F.; Xiong, X.H.; Zhang, M.G.; Ma, P.F.; Tao, J.H.; Wang, Z.F. Formation process of the widespread extreme haze pollution over northern China in January 2013: Implications for regional air quality and climate. Atmos. Environ. 2014, 98, 417–425. [Google Scholar] [CrossRef]
- Wang, S.H.; Hung, W.T.; Chang, S.C.; Yen, M.C. Transport characteristics of Chinese haze over Northern Taiwan in winter, 2005–2014. Atmos. Environ. 2016, 126, 76–86. [Google Scholar] [CrossRef]
- Fan, S.J.; Fan, Q.; Yu, W.; Luo, X.Y.; Wang, B.M.; Song, L.L.; Leong, K.L. Atmospheric boundary layer characteristics over the Pearl River Delta, China, during the summer of 2006: Measurement and model results. Atmos. Chem. Phys. 2011, 11, 6297–6310. [Google Scholar] [CrossRef]
- Gallardo, L.; Olivares, G.; Langner, J.; Aarhus, B. Coastal lows and sulfur air pollution in Central Chile. Atmos. Environ. 2002, 36, 3829–3841. [Google Scholar] [CrossRef]
- Zheng, G.J.; Duan, F.K.; Su, H.; Ma, Y.L.; Cheng, Y.; Zheng, B.; Zhang, Q.; Huang, T.; Kimoto, T.; Chang, D.; et al. Exploring the severe winter haze in Beijing: The impact of synoptic weather, regional transport and heterogeneous reactions. Atmos. Chem. Phys. 2015, 15, 2969–2983. [Google Scholar] [CrossRef]
- Zhang, Y.; Ding, A.; Mao, H.; Nie, W.; Zhou, D.; Liu, L.; Huang, X.; Fu, C. Impact of synoptic weather patterns and inter-decadal climate variability on air quality in the North China Plain during 1980–2013. Atmos. Environ. 2016, 124, 119–128. [Google Scholar] [CrossRef]
- Rutllant, J.; Garreaud, R. Meteorological air pollution potential for Santiago, Chile: Towards an objective episode forecasting. Environ. Monit. Assess. 1995, 34, 223–244. [Google Scholar] [CrossRef]
- Shu, Z.; Zhao, T.; Liu, Y.; Zhang, L.; Ma, X.; Kuang, X.; Li, Y.; Huo, Z.; Ding, Q.; Sun, X.; et al. Impact of deep basin terrain on PM2.5 distribution and its seasonality over the Sichuan Basin, Southwest China. Environ. Pollut. 2022, 300, 118944. [Google Scholar] [CrossRef]
- Watson, J.; Cao, J.; Wang, X.; Chow, J. PM2.5 Pollution in China’s Guanzhong Basin and US’s San Joaquin Valley Mega-Regions. Faraday Discuss. 2020, 226, 255–289. [Google Scholar] [CrossRef]
- Diaz-Esteban, Y.; Barrett, B.S.; Raga, G.B. Circulation patterns influencing the concentration of pollutants in central Mexico. Atmos. Environ. 2022, 274, 118976. [Google Scholar] [CrossRef]
- Liao, T.; Wang, S.; Ai, J.; Gui, K.; Duan, B.; Zhao, Q.; Zhang, X.; Jiang, W.; Sun, Y. Heavy pollution episodes, transport pathways and potential sources of PM2.5 during the winter of 2013 in Chengdu (China). Sci. Total Environ. 2017, 584–585, 1056–1065. [Google Scholar] [CrossRef]
- Chuang, M.T.; Chiang, P.C.; Chan, C.C.; Wang, C.F.; Chang, E.E.; Lee, C.T. The effects of synoptical weather pattern and complex terrain on the formation of aerosol events in the Greater Taipei area. Sci. Total Environ. 2008, 399, 128–146. [Google Scholar] [CrossRef]
- Pateraki, S.; Asimakopoulos, D.N.; Bougiatioti, A.; Maggos, T.; Vasilakos, C.; Mihalopoulos, N. Assessment of PM2.5 and PM1 chemical profile in a multiple-impacted Mediterranean urban area: Origin, sources and meteorological dependence. Sci. Total Environ. 2014, 479–480, 210–220. [Google Scholar] [CrossRef]
- Lavagnini, A.; Sempreviva, A.M.; Transerici, C.; Accadia, C.; Casaioli, M.; Mariani, S.; Speranza, A. Offshore wind climatology over the Mediterranean Basin. Wind. Energy 2006, 9, 251–266. [Google Scholar] [CrossRef]
- Wu, C.C.; Lu, F.C.; Chan, W.D.; Chao, J.C.; Juang, H.M. A study of strong wind over Taiwan coastal water in northeasterly monsoon season. Meteorol. Bull. 2006, 46, 29–43. (In Chinese) [Google Scholar]
- Chien, F.C.; Kuo, Y.H. Topographic Effects on a Wintertime Cold Front in Taiwan. Monthly Weather Review. Mon. Weather Rev. 2006, 134, 3297–3316. [Google Scholar] [CrossRef]
- Lin, C.Y.; Sheng, Y.F.; Chen, W.N.; Wang, Z.; Kuo, C.H.; Chen, W.C.; Yang, T. The impact of channel effect on Asian dust transport dynamics: A case in southeastern Asia. Atmos. Chem. Phys. 2012, 12, 271–285. [Google Scholar] [CrossRef]
- Yang, Q.; Yuan, Q.; Yue, L.; Li, T. Investigation of the spatially varying relationships of PM2.5 with meteorology, topography, and emissions over China in 2015 by using modified geographically weighted regression. Environ. Pollut. 2020, 262, 114257. [Google Scholar] [CrossRef]
- Central Weather Bureau (CWB). Northeasterly Monsoons in Taiwan. 2022. Available online: https://www.cwb.gov.tw/V8/C/K/Encyclopedia/climate/climate6_list.html#climate6-03 (accessed on 17 June 2022).
- Department of Household Registration, Ministry of Interior (DHRMI). Demographic Data in Taiwan. 2020. Available online: https://www.cwb.gov.tw/V8/E/K/Encyclopedia/nous/climate_list.html#climate-03 (accessed on 17 June 2022).
- Central Weather Bureau (CWB). Index Number of Station and Station Information. 2022. Available online: https://e-service.cwb.gov.tw/wdps/obs/state.htm (accessed on 17 June 2022).
- Environmental Protection Administration (EPA). Introduction of Central Monitoring Stations. 2022. Available online: https://airtw.epa.gov.tw/CHT/EnvMonitoring/Central/article_station.aspx (accessed on 17 June 2022).
- Li, Y.; Chen, Q.; Zhao, H.; Wang, L.; Tao, R. Variations in PM10, PM2.5 and PM1.0 in an urban area of the Sichuan Basin and their relation to meteorological factors. Atmosphere 2015, 6, 150–163. [Google Scholar] [CrossRef]
- Vincenty, T. Direct and Inverse Solutions of Geodesics on the Ellipsoid with application of nested equations. Surv. Rev. 1975, 23, 88–93. [Google Scholar] [CrossRef]
- Ainslie, B.; Jackson, P.L. The use of an atmospheric dispersion model to determine influence regions in the Prince George, B.C. airshed from the burning of open wood waste piles. J. Environ. Manag. 2009, 90, 2393–2401. [Google Scholar] [CrossRef] [PubMed]
- Kiefer, M.T.; Charney, J.J.; Zhong, S.; Heilman, W.E.; Bian, X.; Mathewson, T.O. A multiscale numerical modeling study of smoke dispersion and the ventilation index in Southwestern Colorado. Atmosphere 2020, 11, 846. [Google Scholar] [CrossRef]
- Nozaki, K.Y. Mixing Depths Model Using Hourly Surface Observations; Report 7053; USAF Environmental Technical Applications Center: Patrick Space Force Base, FL, USA, 1973.
- Huang, L.M.; Tai-Sheng Chang, T.S. Exploration of Simple Estimation Method of Mixing Layer Height. J. Soil Water Conserv. 2012, 44, 231–250. (In Chinese) [Google Scholar]
- Ali, M.A.; Hassoon, A.F. Effect of daytime and nocturnal boundary layers height on some pollutant gases profile over Baghdad city, Iraq. Plant Arch. 2020, 20, 2624–2630. [Google Scholar]
- Du, C.; Liu, S.; Yu, X.; Li, X.; Chen, C.; Peng, Y.; Dong, Y.; Dong, Z.; Wang, F. Urban boundary layer height characteristics and relationship with particulate matter mass concentrations in Xi’an, Central China. Aerosol Air. Qual. Res. 2013, 13, 1598–1607. [Google Scholar] [CrossRef]
- Lai, L.W. Poor visibility in winter due to synergistic effect related to fine particulate matter and relative humidity in the Taipei metropolis, Taiwan. Atmosphere 2022, 13, 270. [Google Scholar] [CrossRef]
- Zeng, S.; Zhang, Y. The effect of meteorological elements on continuing heavy air pollution: A case study in the Chengdu area during the 2014 Spring Festival. Atmosphere 2017, 8, 71. [Google Scholar] [CrossRef]
- Eagleson, P.S. Dynamic Hydrology; McGraw-Hill: New York, NY, USA, 1970. [Google Scholar]
- NOAA Air Resources Laboratory (ARL). Pasquill Stability Classes. 1961. Available online: https://www.ready.noaa.gov/READYpgclass.php (accessed on 18 July 2022).
- Hsieh, C.C.; Tsai, J.H. VOC concentration characteristics in Southern Taiwan. Chemosphere 2003, 50, 545–556. [Google Scholar] [CrossRef]
- Lo, K.C.; Hung, C.H. Forming high ozone concentration in the ambient air of southern Taiwan under the effects of Western Pacific Subtropical High. Adv. Meteorol. 2015, 2015, 352630. [Google Scholar] [CrossRef]
- Zhao, X.; Kim, S.K.; Zhu, W.; Kannan, N.; Li, D. Long-range atmospheric transport and the distribution of polycyclic aromatic hydrocarbons in Changbai Mountain. Chemosphere 2015, 119, 289–294. [Google Scholar] [CrossRef]
- Cheng, W.L.; Pai, J.L.; Tsuang, B.J.; Chen, C.L. Synoptic patterns in relation to ozone concentrations in west-central Taiwan. Meteorol. Atmos. Phys. 2001, 78, 11–21. [Google Scholar] [CrossRef]
- Hsu, C.H.; Cheng, F.Y. Synoptic weather patterns and associated air pollution in Taiwan. Aerosol Air. Qual. Res. 2019, 19, 1139–1151. [Google Scholar] [CrossRef]
- Cheng, W.L. Synoptic weather patterns and their relationship to high ozone concentrations in the Taichung Basin. Atmos. Environ. 2001, 35, 4971–4994. [Google Scholar] [CrossRef]
- Lai, L.W.; Cheng, W.L. Air quality influenced by urban heat island coupled with synoptic weather patterns. Sci. Total Environ. 2009, 407, 2724–2733. [Google Scholar] [CrossRef]
- SYSTAT. Statistics-I; Systat Software, Incorp.: San Jose, CA, USA, 2007. [Google Scholar]
- SYSTAT. Statistics-III; Systat Software, Incorp.: San Jose, CA, USA, 2007. [Google Scholar]
- SYSTAT. Statistics-III; Systat Software, Incorp.: San Jose, CA, USA, 2009. [Google Scholar]
- Stein, A.F.; Draxler, R.R.; Rolph, G.D.; Stunder, B.J.B.; Cohen, M.D.; Ngan, F. NOAA’s HYSPLIT atmospheric transport and dispersion modeling system. Bull. Am. Meteorol. Soc. 2015, 96, 2059–2077. [Google Scholar] [CrossRef]
- Rolph, G.; Stein, A.; Stunder, B. Real-time Environmental Applications and Display system: READY. Environ. Model. Softw. 2017, 95, 210–228. [Google Scholar] [CrossRef]
- Hondula, D.M.; Sitka, L.; Davis, R.E.; Knight, D.B.; Gawtry, S.D.; Deaton, M.L.; Lee, T.R.; Normile, C.P.; Stenger, J. A back-trajectory and air mass climatology for the Northern Shenandoah Valley, USA. Int. J. Climatol. 2010, 30, 569–581. [Google Scholar] [CrossRef]
- Ma, Y.; Wang, M.; Wang, S.; Wang, Y.; Feng, L.; Wu, K. Air pollutant emission characteristics and HYSPLIT model analysis during heating period in Shenyang, China. Environ. Monit. Assess. 2021, 193, 9. [Google Scholar] [CrossRef]
- Levy, R.; Hsu, C. MODIS Atmosphere L2 Aerosol Product. NASA MODIS Adaptive Processing System, Goddard Space Flight Center, USA. 2015. Available online: http://dx.doi.org/10.5067/MODIS/MOD04_L2.061 (accessed on 27 August 2022).
- Levy, R.; Hsu, C. MODIS Atmosphere L2 Aerosol Product. NASA MODIS Adaptive Processing System, Goddard Space Flight Center, USA. 2017. Available online: http://doi.org/10.5067/MODIS/MYD04_L2.061 (accessed on 7 July 2022).
- Chang, K.H.; Jeng, F.T.; Tsai, Y.L.; Lin, P.L. Modeling of long-range transport on Taiwan’s acid deposition under different weather conditions. Atmos. Environ. 2000, 34, 3281–3295. [Google Scholar] [CrossRef]
- Gao, H.; Chen, J.; Wang, B.; Tan, S.C.; Lee, C.M.; Yao, X.; Yan, H.; Shi, J. A study of air pollution of city clusters. Atmos. Environ. 2011, 45, 3069–3077. [Google Scholar] [CrossRef]
- Vecchi, R.; Marcazzan, G.; Valli, G.; Ceriani, M.; Antoniazzi, C. The role of atmospheric dispersion in the seasonal variation of PM1 and PM2.5 concentration and composition in the urban area of Milan (Italy). Atmos. Environ. 2004, 38, B4437–B4446. [Google Scholar] [CrossRef]
- Ho, W.Y.; Tseng, K.H.; Liou, M.L.; Chan, C.C.; Wang, C.H. Application of Positive Matrix Factorization in the Identification of the Sources of PM2.5 in Taipei City. Int. J. Environ. Res. Public Health 2018, 15, 1305. [Google Scholar] [CrossRef] [PubMed]
- Graham, A.; Pope, R.; McQuaid, J.; Pringle, K.; Arnold, S.; Bruno, A.G.; Moore, D.; Harrison, J.; Chipperfield, M.; Sanchez-Marroquin, A.; et al. Impact of the June 2018 Saddleworth Moor wildfires on air quality in northern England. Environ. Res. Commun. 2020, 2, 031001. [Google Scholar] [CrossRef]
- Yan, Y.; Cai, X.; Miao, Y.; Yu, M. Synoptic condition and boundary layer structure regulate PM2.5 pollution in the Huaihe River Basin, China. Atmos. Res. 2022, 269, 106041. [Google Scholar] [CrossRef]
- Zhang, Z.; Wang, X.; Cheng, S.; Guan, P.; Zhang, H.; Shan, C.; Fu, Y. Investigation on the difference of PM2.5 transport flux between the North China Plain and the Sichuan Basin. Atmos. Environ. 2022, 271, 118922. [Google Scholar] [CrossRef]
- Zhan, C.C.; Xie, M.; Fang, D.X.; Wang, T.J.; Wu, Z.; Lu, H.; Li, H.M.; Chen, P.L.; Zhuang, B.L.; Li, S.; et al. Synoptic weather patterns and their impacts on regional particle pollution in the city cluster of the Sichuan Basin, China. Atmos. Environ. 2019, 208, 34–47. [Google Scholar] [CrossRef]
- Xiao, K.; Wang, Y.; Wu, G.; Fu, B.; Zhu, Y. Spatiotemporal characteristics of Air pollutants (PM10, PM2.5, SO2, NO2, O3, and CO) in the Inland Basin City of Chengdu, Southwest China. Atmosphere 2018, 9, 74. [Google Scholar] [CrossRef]
- Wang, P.; Cao, J.; Tie, X.; Wang, G.; Li, G.; Hu, T.; Wu, Y.; Xu, Y.; Xu, G.; Zhao, Y.; et al. Impact of meteorological parameters and gaseous pollutants on PM2.5 and PM10 mass concentrations during 2010 in Xi’an, China. Aerosol Air. Qual. Res. 2015, 15, 1844–1854. [Google Scholar] [CrossRef]
- Zhao, S.; Yu, Y.; Yin, D.; Qin, D.; He, J.; Li, J.; Dong, L. Two winter PM2.5 pollution types and the causes in the city clusters of Sichuan Basin, Western China. Sci. Total Environ. 2018, 636, 1228–1240. [Google Scholar] [CrossRef]
Publisher’s Note: MDPI stays neutral with regard to jurisdictional claims in published maps and institutional affiliations. |
© 2022 by the authors. Licensee MDPI, Basel, Switzerland. This article is an open access article distributed under the terms and conditions of the Creative Commons Attribution (CC BY) license (https://creativecommons.org/licenses/by/4.0/).