Article

Cutting Cement Industry CO2 Emissions through Metakaolin Use in Construction

by
Yetunde Oyebolaji Abiodun
1,*,
Oludolapo Akanni Olanrewaju
2,
Oluwashina Philips Gbenebor
3,
Ezenwanyi Fidelia Ochulor
3,
Dumebi Victoria Obasa
4 and
Samson Oluropo Adeosun
2,3
1
Department of Civil and Environmental Engineering, University of Lagos, Lagos 100001, Nigeria
2
Industrial Engineering Department, Durban University of Technology, Durban 4000, South Africa
3
Department of Metallurgical and Materials Engineering, University of Lagos, Lagos 100001, Nigeria
4
Department of Mechanical Engineering, Edo State University, Uzairue 302115, Nigeria
*
Author to whom correspondence should be addressed.
Atmosphere 2022, 13(9), 1494; https://doi.org/10.3390/atmos13091494
Submission received: 26 July 2022 / Revised: 30 August 2022 / Accepted: 8 September 2022 / Published: 14 September 2022

Abstract

:
Cement production is one of the most important industries on the planet, and humans have relied on is use dating back to the dawn of civilization. Cement manufacturing has increased at an exponential rate, reaching 3 billion metric tons in 2015, representing a 6.3% annual growth rate and accounting for around 5–8% of global carbon dioxide (CO2) emissions. Geopolymer materials, which are inorganic polymers made from a wide range of aluminosilicate powders, such as metakaolin, fly ash, and blast furnace or steel slags, have also been elicited for use due to concerns about the high energy consumption and CO2 emissions connected with cement and concrete manufacturing. This study focused on the mechanical and durability properties of metakaolin in concrete production. X-ray diffraction (XRD), scanning electron microscopy (SEM), and energy-dispersive spectroscopy (EDS) analyses were used to confirm the characteristics of kaolin and metakaolin. The results showed that 15 wt.% metakaolin can be used to partially replace cement, and that metakaolin, when synthesized with alkaline activators, can also be utilized as a geopolymer to totally replace cement in concrete production. For predicting the compressive strength of different concrete mixtures, few practical models have been presented. This research has shed light on the possibility of utilizing ecologically friendly materials in the building, construction, and transportation sectors to decrease carbon dioxide emissions.

Graphical Abstract

1. Introduction

Global warming has resulted from rising average atmospheric temperatures, causing a slew of changes in the Earth’s climate and weather systems [1]. Human activities also contribute to the emission of carbon dioxide into the atmosphere, which results in ozone depletion and pollution, among other problems. In 2021, global CO2 emissions from energy combustion and industrial operations increased to their greatest yearly level ever. Emissions increased by 6% to 36.3 gigatons (GT) from 2020 in 2021, according to the International Energy Agency’s extensive region-by-region and fuel-by-fuel analysis, which used the most recent official national data, as well as publicly available energy, economic, and weather data. In 2020, the COVID-19 epidemic had a significant impact on energy demand, resulting in a 5.2 percent reduction in worldwide CO2 emissions [2]. The construction industry, particularly the cement manufacturing sector, has also been identified as one of the largest CO2 emitting industries [3] due to the processes involved in cement manufacturing. CO2 emissions per ton of cement range between 800 and 1000 kg. Concrete manufacturing is one of the main uses of cement in structural construction, and it contributes between 5–8% of the world’s CO2 emissions [4]. With over twelve billion metric tons manufactured and consumed annually, concrete is one of the most widely used construction materials on the planet [5]. It is suitable to a wide range of applications, as it provides significant strength at a reasonable cost [6].
Concrete can be made with locally available materials, cast into a wide range of structural shapes, and maintained with little effort during service [7]. However, environmental concerns regarding the high energy costs and CO2 emissions connected with cement production have pushed for the development of supplemental materials to reduce cement usage [8]. A wide range of agricultural wastes, such as sugarcane bagasse ash and rice husk ash, have been added to the current construction industry for possible use as a cement clinker supplement in order to promote green construction and reduce air pollution problems [9]. Fly ash, metakaolin, silica fume, and rice husk ash are also potential supplementary cementitious materials known as pozzolans [10]. Pozzolans are siliceous minerals that react chemically with calcium hydroxide to generate cementitious compounds, when finely ground and in the presence of water. They may be either natural or man-made [11]. Metakaolin has also been used as a geopolymer in concrete, as it is one of the most widespread source materials containing aluminosilicates. When silicon (Si) and aluminum (Al) are combined with alkali activators in a natural source material, such as metakaolin, or a byproduct material, such as fly ash, geopolymer binders are created [12]. Geopolymers are low-cost and eco-friendly materials that possess relevant physio-chemical properties, high adsorbent potential for capturing CO2, and which have showed excellent results in cementing and plug wells for CO2 storage [13]. Even though geopolymers have received considerable attention as a potential building material, the bulk of studies have focused on fly ash-based geopolymer concrete [14], slag [15], rice husk ash [16], or kaolin [17]. In a study reported by Amin et al. [18], industrial wastes such as fly ash, metakaolin, and granulated blast furnace slag were used as a base for high strength geopolymer concrete. Metakaolin is a supplementary cementitious material. It is a dehydroxylated version of the clay mineral kaolinite that meets ASTM C 618, Class N pozzolan standards as a supplementary cementitious material [19]. It is unique in that it is neither an industrial by-product nor a wholly natural material, and it can be expressed as presented in Equation (1) [20].
Al2Si2O5 (OH)4 → Al2O3·2SiO2 + 2H2O↑
Metakaolin is made mainly by calcining kaolin clays at temperatures ranging from 600 °C to 900 °C to improve its color, eliminate inert impurities, and tune its particle size. The improvement in information on geopolymers and alkali-activated materials in general tends to suggest that this might potentially offer an effective alternative to ordinary Portland cement (OPC) in specific applications [21]. As demonstrated in Equation (1), the process that leads to metakaolin necessitates a lower temperature and produces water rather than carbon dioxide. This is in stark contrast to what is available in the cement industry. The world’s top producers of kaolin are shown in Figure 1 [22].
Studies on metakaolin-based geopolymers have mostly focused on mortars and pastes to examine the interactions between the geopolymerization process and alkaline solutions [23,24], as well as the effect of curing techniques, such as temperature and/or time, on mechanical characteristics. The performance of metakaolin-based geopolymer concrete at elevated temperature was investigated. Metakaolin-based geopolymer concrete was exposed to aggressive environments, such as elevated temperature. The results of the abrasion resistance of metakaolin-based geopolymer concrete specimens showed that weight loss increased as the temperature went up. At 200 °C, metakaolin based geopolymer concrete showed a weight loss of 0.06%. At 400, 600, and 800 °C, the weight loss increased to 0.08%, 0.10%, and 0.18%, respectively. It was reported that, due to a partial decomposition of sodium silicate, as the temperature rises, compressive strength decreases [25]. In another study, two different types of red (iron oxide) and green (chromium oxide) pigments were combined with three more ratios of metakaolin (0, 2, 4, and 6% by weight) to create colored geopolymer concrete. It was noted that the values of the slump test decreased with increasing pigment percentage for all pigment types, and that the higher percentage increases in compressive strength for red and green (2% metakaolin) are 6.28 and 3.25%, respectively. It was also noted that the compressive strength decreased by increasing the percentage of pigment [26]. The development of the compressive strength of mortar with 5–25 wt.% of metakaolin substituted for cement and the impact of the pozzolanic reactivity of blast furnace slag and metakaolin on mortar was explored in one study. The results showed that the strength increases at all percentages <15% replacement [27]. Another application of metakaolin-based geopolymer is in oil-well cementing as an alternative to conventional Portland cement systems. It was reported that when geopolymer is subjected to elevated temperatures, the gel structure is altered due to the formation of crystalline phases that may induce thermal stresses [28]. It has been established from the literature that metakaolin has a potential to be used as either a pozzolan or as a geopolymer in concrete and mortar production. The findings in this study aim to aid in the understanding of the mechanical characteristics of cement-metakaolin concrete and metakaolin-based geopolymer concrete as sustainable building materials when compared to OPC concrete. Under comparable laboratory conditions and variables, compressive strength may be predicted using the strength prediction models presented in this study. Therefore, this study focuses on geopolymer or alkali-activated cementitious material as a cement alternative, with low carbon emission and little environmental effect. As a result, the building, construction, and transportation industries will become more sustainable.

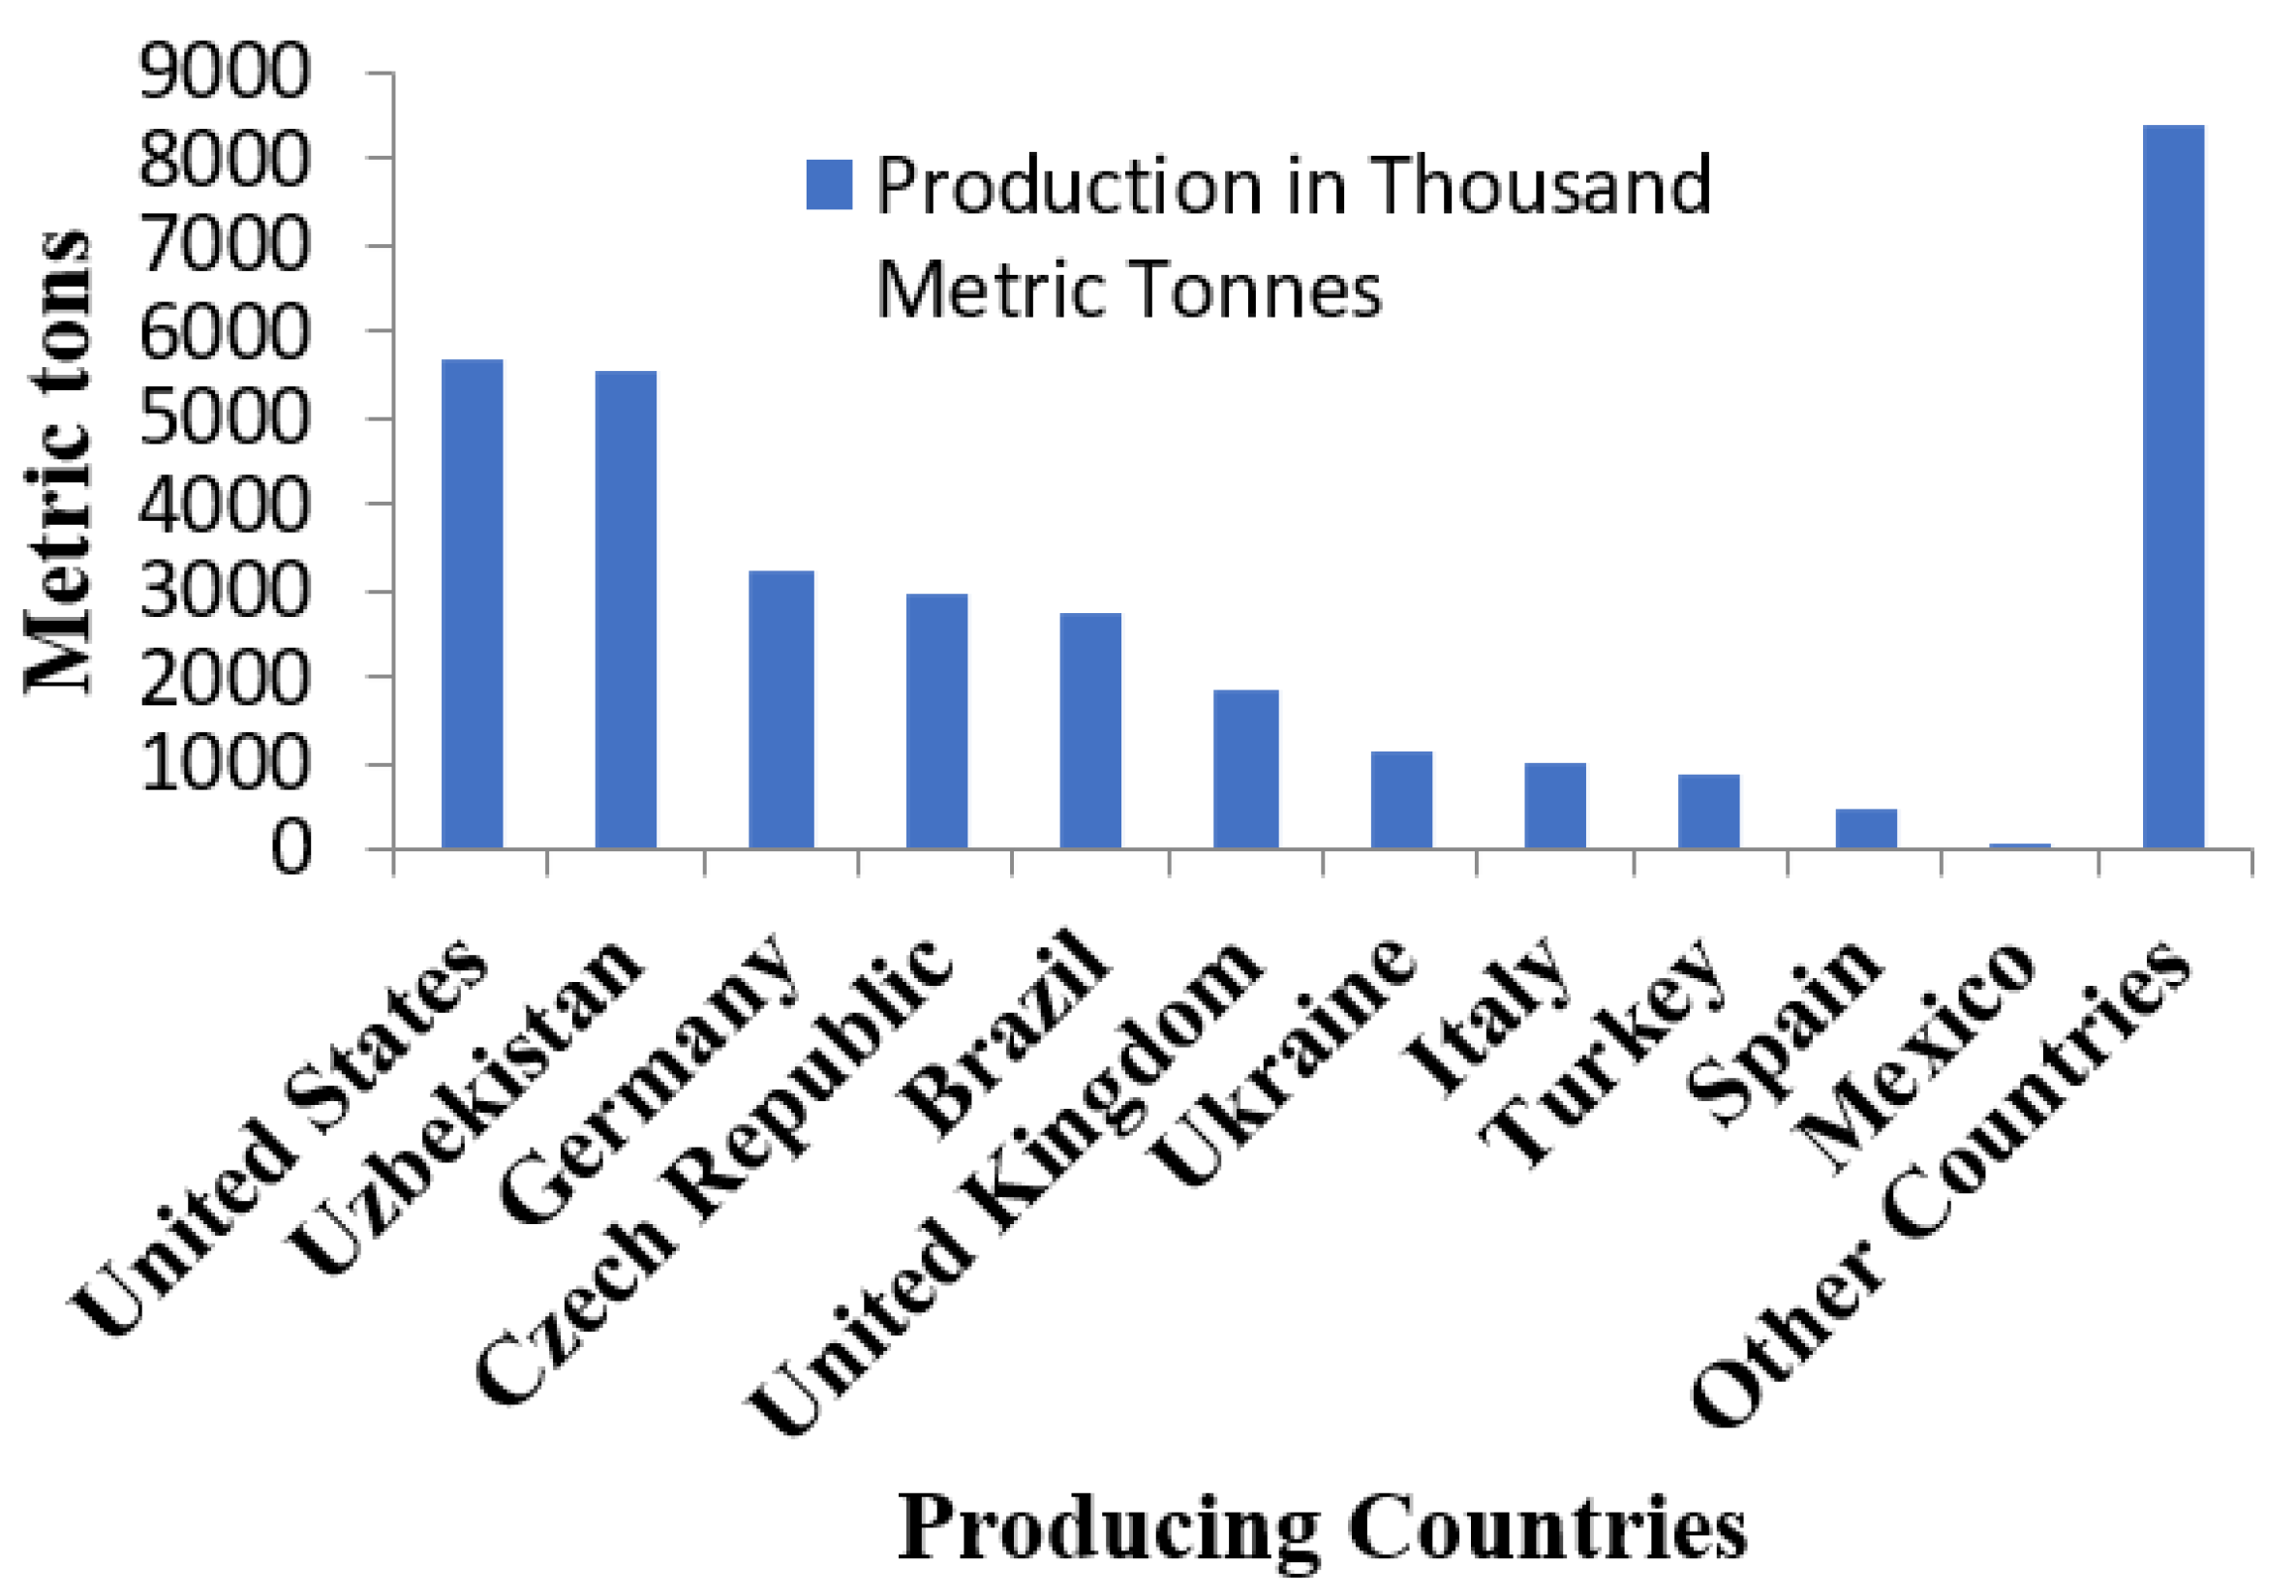
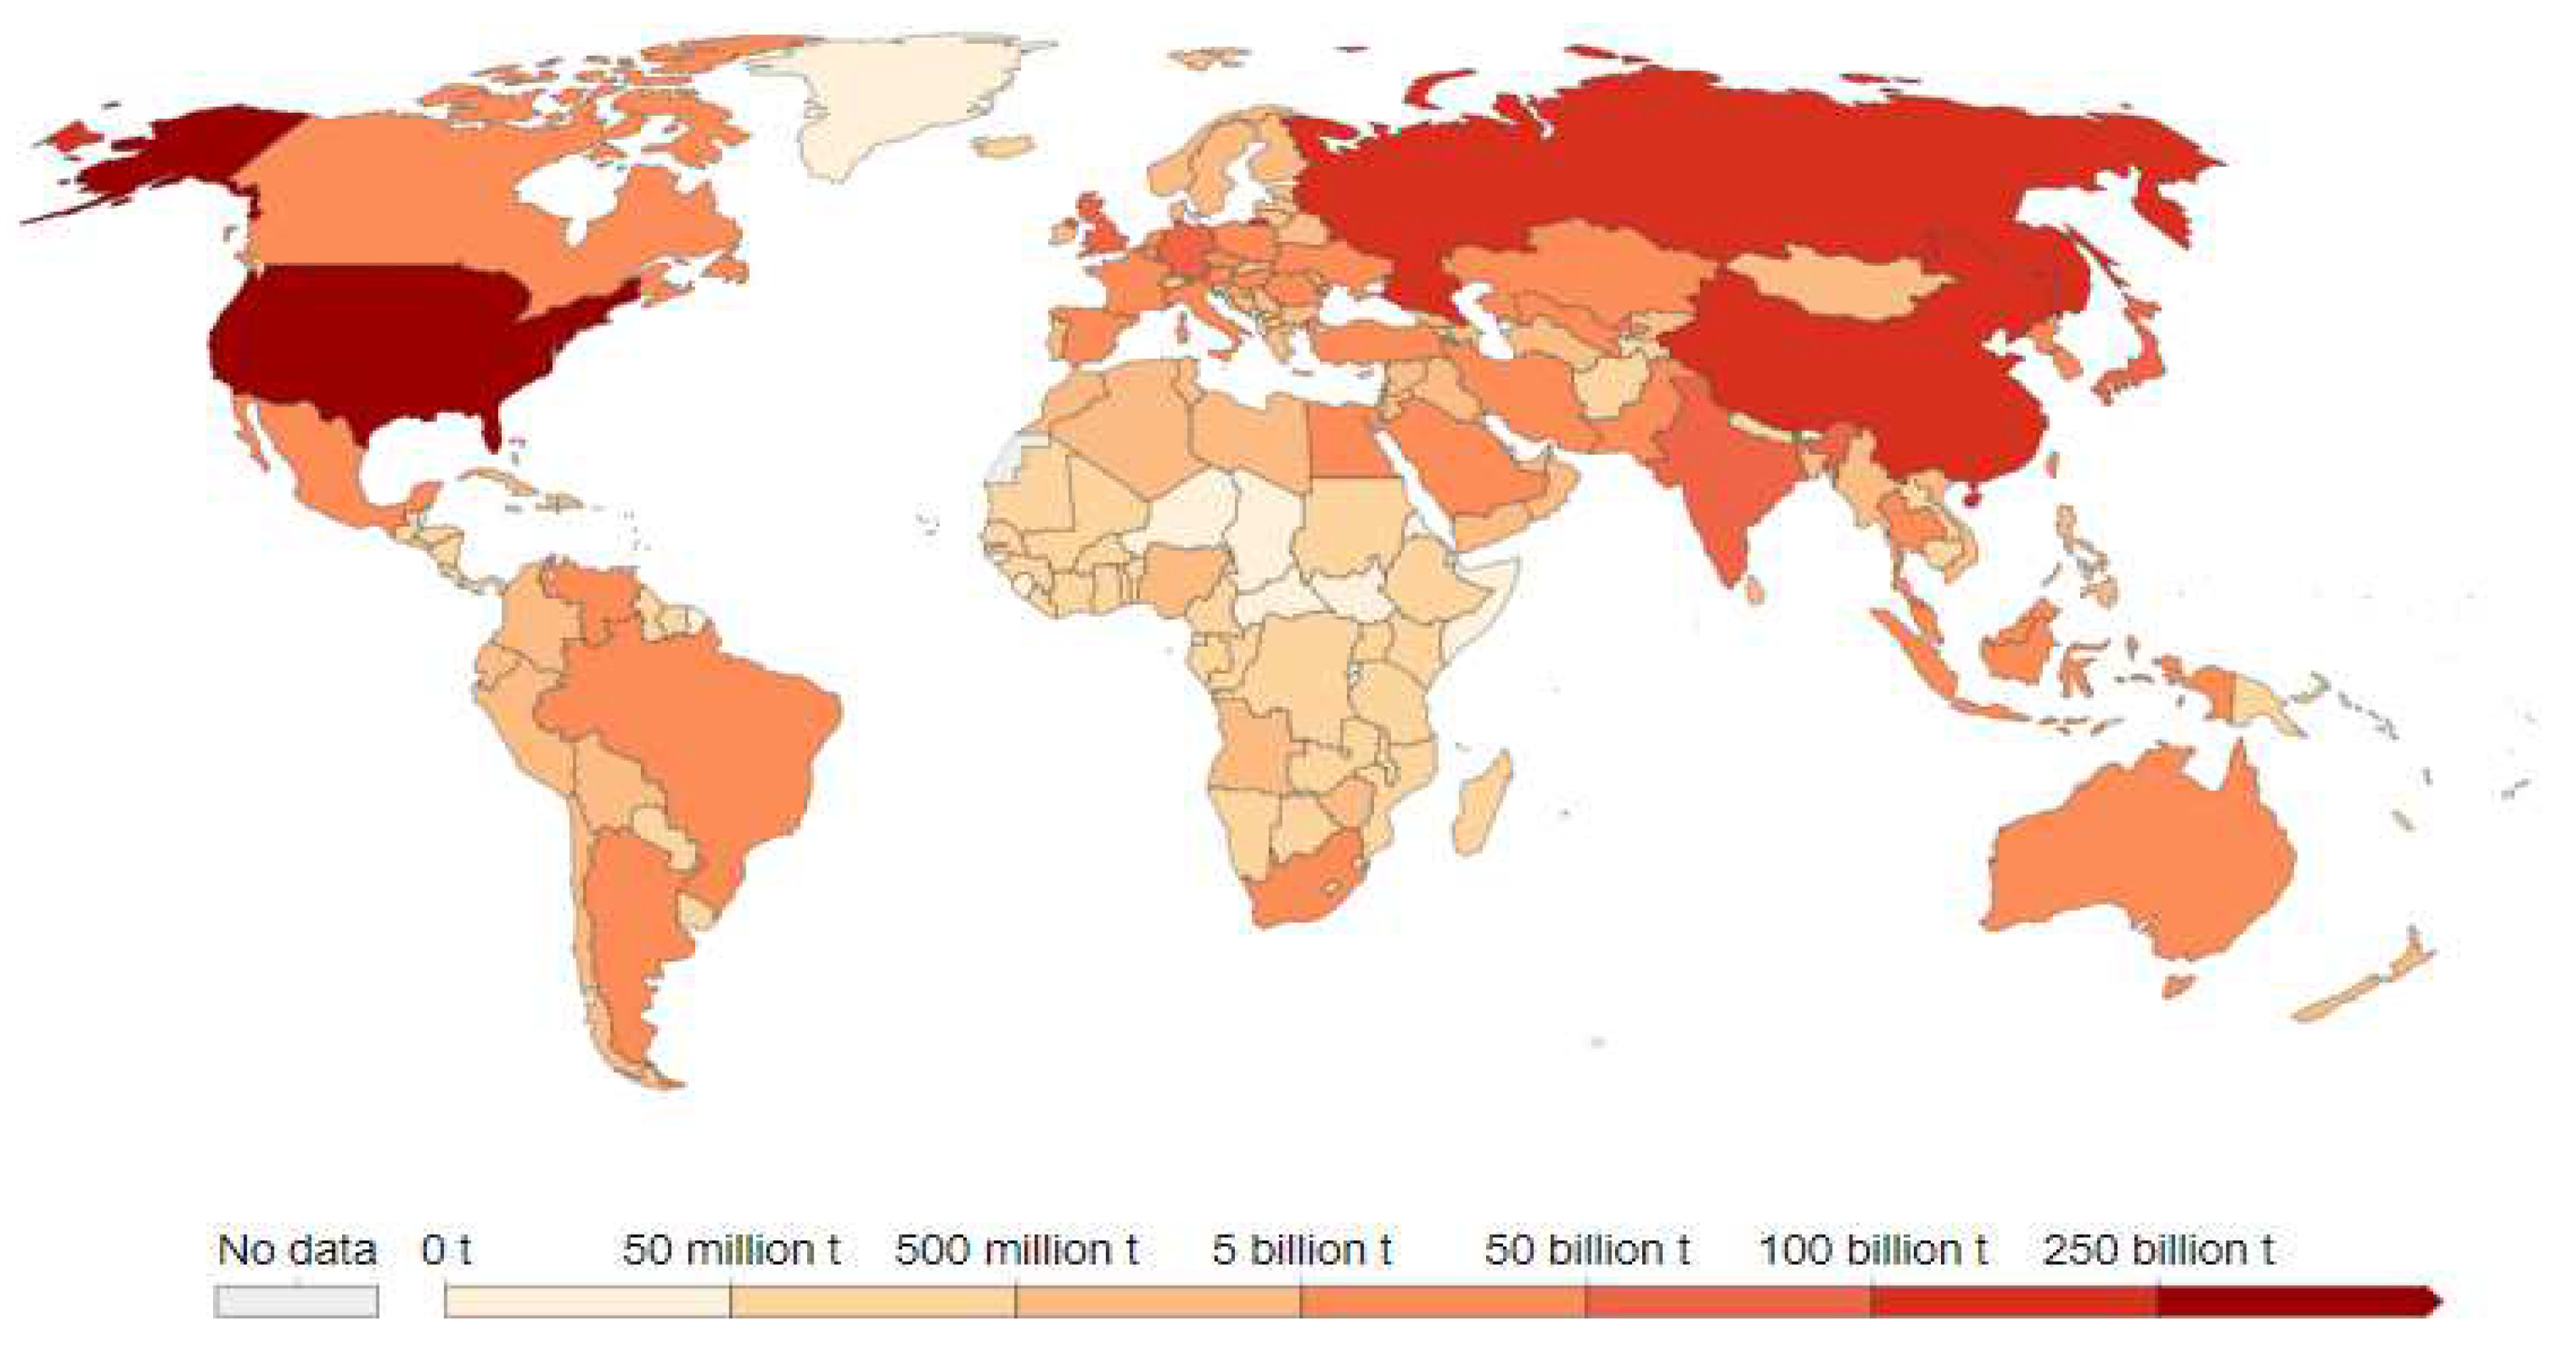
2. The Global Cement Industry

Climate change is regarded as one of our society’s primary environmental issues, and carbon dioxide (CO2) is one of the principal greenhouse gases. The manufacturing of cement contributes to CO2 emissions through the combustion of fossil fuels and the decarbonization of limestone [29]. Approximately 2% of the world’s primary energy consumption and more than 5% of all industrial energy consumption is attributed to the production of cement, which is a very energy-intensive process. Due to the extensive use of carbon-intensive fuels—such as coal—in the manufacturing of clinker, the cement industry is a significant source of CO2 emissions [30]. In addition to using energy, the calcining process during the clinker-manufacturing process emits CO2. Since it produces emissions both from emission sources and from the generation of power, cement manufacture is a significant source of carbon emissions and should be included when considering carbon emission-reduction initiatives [31]. There are several types of cement, varying according to their differing calcium sources and the additives that are used to regulate their characteristics. Some of the major types are Portland cement, slag cement, high alumina cement, and the pozzolans. The particular qualities of cement are achieved by its specific composition (e.g., sulphate resistance, alkali content, and heat of hydration), while fineness is a key factor in the development of its strength and setting rate. A chemical reaction obtained during the hydration of cement is provided in Equation (2) [32].
Ca(OH)2 + H4SiO4 → Ca2+ + H2SiO42− + 2 H2O → CaH2SiO4·2H2O
The demand for limestone, a key element in the production of cement, is expected to rise as the world’s infrastructure improves. From 2020 to 2027, the worldwide limestone market is predicted to develop at a compound annual growth rate (CAGR) of 4.4%. The United States is recognized for its abundant limestone quarries, which have helped it to become self-sufficient and less reliant on imports [33].

Cutting Carbon Dioxide Emission through Different Technologies

The CO2 emissions associated with the production of Portland cement are mainly from raw materials calcination (50%) and quarrying (40%), with minimum effect from finish milling and kiln fuel [34]. In the manufacturing of cement, carbon dioxide is formed as shown in Equation (3).
CaCO3 → CaO (Clinker) + CO2
This means that in every kg of limestone (calcium carbonate) subjected to calcination, 0.56 kg of CaO and 0.44 kg of CO2 is produced. The CO2 emissions per ton of cement for each process depend on the ratio of clinker to cement [35]. A decrease in the CO2 emissions of 440 kg CO2/ton clinker and the total CO2 emission release of 34.81 billion metric tons (as of 2020) can be achieved by using alternative clinker chemistries and changing cement production methods in favor of more energy-efficient methods [36].
Some technologies have also been adopted for effective CO2 reduction. Biofuel is a renewable fuel option, and it is regarded as a safe, ecologically acceptable replacement for fossil fuels. The dwindling supply of fossil fuels and efforts to slow global warming are the key forces behind the development of biofuel. To provide energy security and reduce environmental effects, the production of biofuel, a green alternative to petroleum resources, attempts to create energy fuel through biological processes, or originating from biomass [37]. The capacity of biomass products to provide fuels with high energy density and liquid storage that is compatible with the infrastructure based on petroleum is well known [38]. Through its impact on the environment, the economy, and energy security, this type of energy source is anticipated to contribute to both the welfare and the sustainability of the energy system [39]. Moreover, many researchers have looked at the viability and applications of microalgae technology. Medeiros et al. [40] performed research to gain insight into the implementation of the technology utilizing earlier life cycle assessment (LCA) microalgae studies, which compared microalgae biofuel with fossil fuel choices, and examined the integration of algal biofuel into a local electrical grid. The outcome demonstrates the great efficacy of microalgae as an energy source and its enormous potential to reduce reliance on fossil fuels. Algal biodiesel has been shown to be a non-toxic, sulfur-free energy source that is far more environmentally friendly than traditional fuels, as well as being extremely biodegradable [41]. Olofsson et al. [42] investigated how industrial flue gas utilized as a CO2 source for microalgal culture in a cement mill was converted into usable biomass. To evaluate the viability of employing cement flue gas in the production of algal biomass, components such as lipids, proteins, and carbohydrates were studied to determine the influence of cement flue gas toxicity on algal biomass production. The research findings indicated that growing microalgae is a biologically plausible way to turn industrial waste into sustainable energy sources. For other cement power plants hoping to investigate additional options as part of their sustainable development program, this research is very helpful. Third-generation biofuels include microalgae. However, to efficiently use microalgae as a biofuel, a number of critical factors must be taken into consideration. For instance, the pH level should be between 6 and 9, the nutrient medium temperature should be between 20 and 30 °C, the algae nutrient medium should be composed, and the nutrient medium should contain nitrogen and phosphorus [43]. Oxy-fuel combustion capture, which was first developed in 1982, has gained significant attention from academics because of its distinct benefits [44,45]. Based on current coal-fired power generation, it first isolates oxygen from the air before replacing combustion-supporting air with high-purity oxygen and recycled flue gas to produce high-concentration CO2. According to earlier studies [46], oxy-fuel combustion capture may be more economical and energy-efficient than carbon capture technology. The oxy-fuel combustion technique may be used with several fossil fuels, including coal [47], natural gas [48], biomass [49], and sludge treatment [50]. The process of CO2 capture in flue gas from oxy-fuel burning by [EMIM][Tf2N], an eco-friendly solvent, was simulated in the study conducted by Huang et al. [51]; temperature, pressure, flow rate, predicted energy consumption, and the impact of physical factors on carbon capture were all reported by this simulation. The findings demonstrated that when the liquid–gas ratio is 1.55 (molar/molar) and the desorption efficiency is 98.2%, the volume fraction of CO2 in the exhaust gas is less than 2%. When the desorption pressure is 0.01 MPa, the mass purity of the CO2 product is 99.9%. When the load efficiency is 0.45 mol CO2·mol−1 IL, the product purity is 99.9%, and the lean circulation is 46.65 kmol·h−1t−1 CO2; this results in an 81% reduction in energy consumption when compared to air–fuel combustion and a 76% reduction in total energy consumption (112.27 kWh·t−1 CO2). The use of oxy-fuel combustion capture is a more cost-effective option in terms of lean circulation and energy usage. Table 1 illustrates how CO2 emissions are decreased in the cement sector by using alternative technologies and materials.
The annual cumulative CO₂ emissions produced from fossil fuels and cement since 1750, measured in tons, is shown in Figure 2 [5].

3. Materials and Methods

3.1. Metakaolin as a Pozzolan in Concrete Production

The kaolin sample was collected from Ogun State, Nigeria. The kaolin sample was calcined at 800 °C for 60 min and allowed to cool for 24 h at room temperature to prevent crystallization of the amorphous metakaolin. It was then ground and sieved to a fineness of 45 µm. The heating temperature and duration adopted were derived following the method described in [19], which calculated the percentage of mass loss at various heating temperatures and durations. In this study, several mix ratios for cement–metakaolin concrete (1:2:4; 1:1½:3 and 1:1.1:2.6) and water–cement ratios (0.4; 0.5 and 0.6) were taken into consideration. Different percentages of metakaolin were employed to replace cement (0, 5, 10, 15, 20, and 25%). Cubes of 150 mm × 150 mm × 150 mm in size were cast, as depicted in Figure 3, and cured in water for 28 and 90 days.
Metakaolin was substituted for cement in mortar applications at various percentages (0, 5, 10, 15 and 20%) utilizing a 0.4 water-to-cement ratio and a 1:5 general purpose mix ratio. Cubes of cement–metakaolin mortar measuring 150 mm × 150 mm × 150 mm were cast, and they underwent 7, 28, and 90 days of water curing. Throughout the experiment, each data point received three replicate samples. The cubes underwent a compressive strength test in line with BS EN 12390-3 [52].

3.2. Metakaolin as a Geopolymer in Concrete Production

The activation of metakaolin with an alkaline activator at a ratio of 0.3 alkaline activator/metakaolin was used to create the geopolymer samples. Sodium silicate (Na2SiO3) and sodium hydroxide (NaOH) solutions were produced and combined at a constant ratio of 1.00 for the alkaline activator [53]. The NaOH solution was created by dissolving sodium hydroxide pellets in deionized water, with a constant concentration of 10 M. Because of the exothermic nature of the reaction, the solution had to cool for at least 24 h before being added to the fine (sharp sand) and coarse (granite) aggregates. Concrete samples made of metakaolin-based geopolymer were cast using a 150 mm × 150 mm × 150 mm mold. At 7, 28, and 90 days after air-curing under the ambient condition of 30 ± 2 °C, the compressive strength test was performed. The samples were produced the use of ordinary Portland cement. The components used to make metakaolin-based geopolymer concrete are shown in Figure 4.

3.3. Durability Test on Metakaolin-Based Geopolymer Concrete

The water absorption capacity test was carried out at 28 and 56 days of curing for OPC-concrete and metakaolin-based geopolymer concrete, in accordance with BS 1881-122 [54]. A total of 36 samples were tested for absorption capacity. A total of 9 repeat samples were obtained per data point throughout this test. The samples were dried in an oven for 24 h at 105 °C. After being removed from the oven, they were allowed to cool at ambient temperature so that the initial weight could be calculated. This weight was recorded as (P1). After, the concrete specimens were submerged in water for 24 h and later taken out and dried with a piece of cloth. The specimens were then weighed again and the final weight was calculated and recorded as (P2). The equation for the computation of water absorption capacity is given in Equation (4).
Water   absorption = P 1     P 2 P 2 × 100
where: P1 = weight of the concrete sample after oven drying; P2 = weight of the saturated surface of the dry concrete sample.

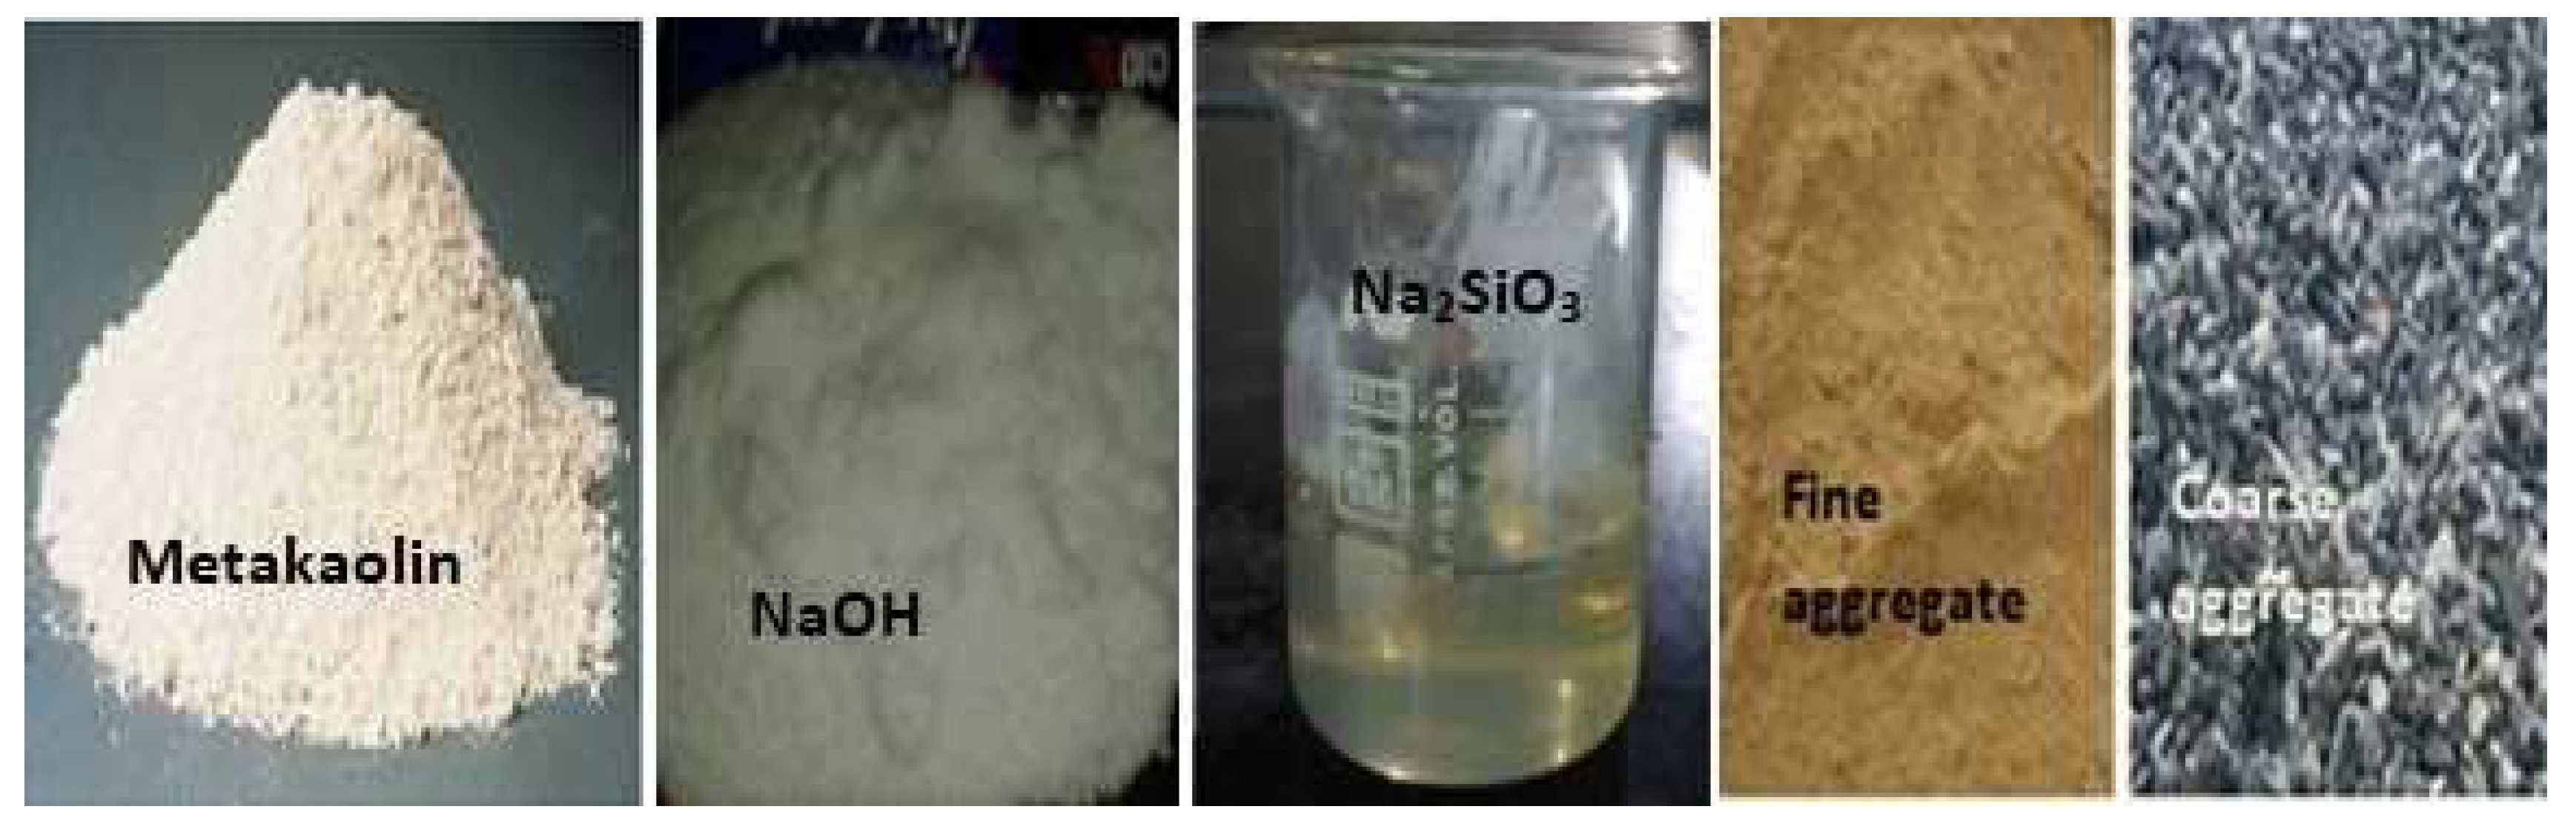
3.4. Chemical Composition Test and Microstructural Analysis of Kaolin and Metakaolin

The chemical composition test was carried out on the kaolin and metakaolin samples to determine the chemical oxides present. This test was performed at the Chemistry Department, University of Lagos, Nigeria. For the microstructural assessment, a scanning electron microscopy test (SEM) was carried out to examine the morphology of the sample of kaolin and metakaolin on ASPEX 3020 machine while Energy Dispersive X-ray Spectroscopy (EDS) was used for spatial distribution analysis of the kaolin and metakaolin samples. The tests were done at Sheda Science and Technology Institute, Abuja, Nigeria. The X-ray diffraction spectroscopy test (XRD) of the kaolin and metakaolin samples was carried out at the National Geosciences Research Laboratories (NGRL) Kaduna, Nigeria, using Empyrean XRD model. Crystalline powder was pressed into the sample holder and held in the sample at an angle of 45°. The intensity of the beam was 45 kV and 40 mA. The X-rays were generated by a cathode ray tube, filtered to produce monochromatic radiation, collimated to concentrate, and directed toward the sample. The interaction of the incident rays with the sample produces constructive interference, satisfying Bragg’s Law.

3.5. Statistical Analysis

The effects of the percentage replacement levels, curing days, and water–cement ratio on the compressive strength of metakaolin-based geopolymer concrete were investigated using regression analysis. The regression analysis was carried out at a level of confidence of 90% and considered the linear and interaction terms. Analysis of variance (ANOVA) was carried out to determine the factors that were statistically significant to the compressive strength of metakaolin-based geopolymer concrete using Minitab 19. The significance of the interactions of the factors was also determined using ANOVA. Regression models were developed to predict the compressive strength of metakaolin-based geopolymer concrete in terms of the percentage replacement levels, curing days, and water–cement ratio.

4. Results and Discussion

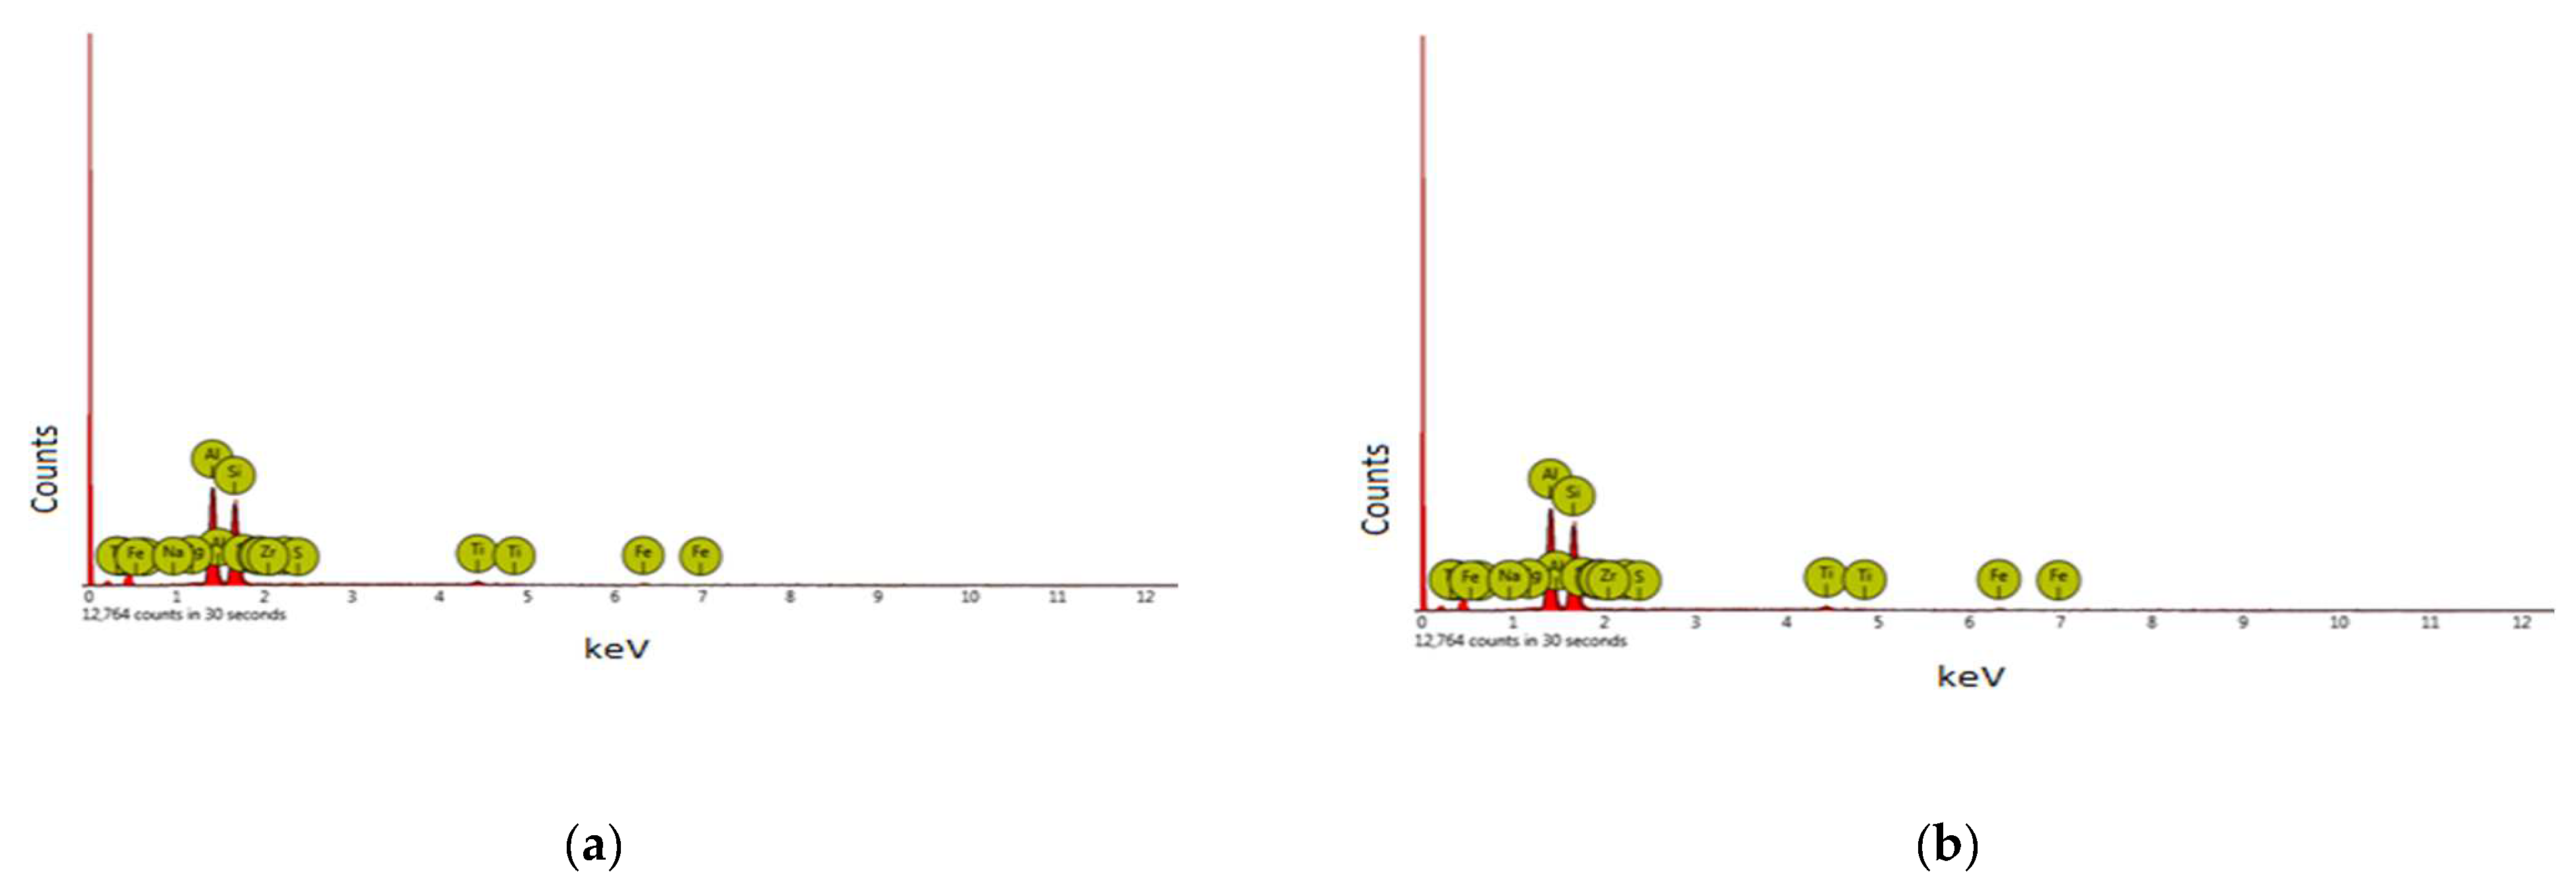
4.1. Chemical Composition of Kaolin and Metakaolin

Table 2 displays the chemical composition of the studied kaolin and metakaolin (after calcination) samples. It could be observed that the after calcination, metakaolin became reactive as the percentages of silica and alumina increased. The cumulative percentage of the silica and alumina was 93.39.

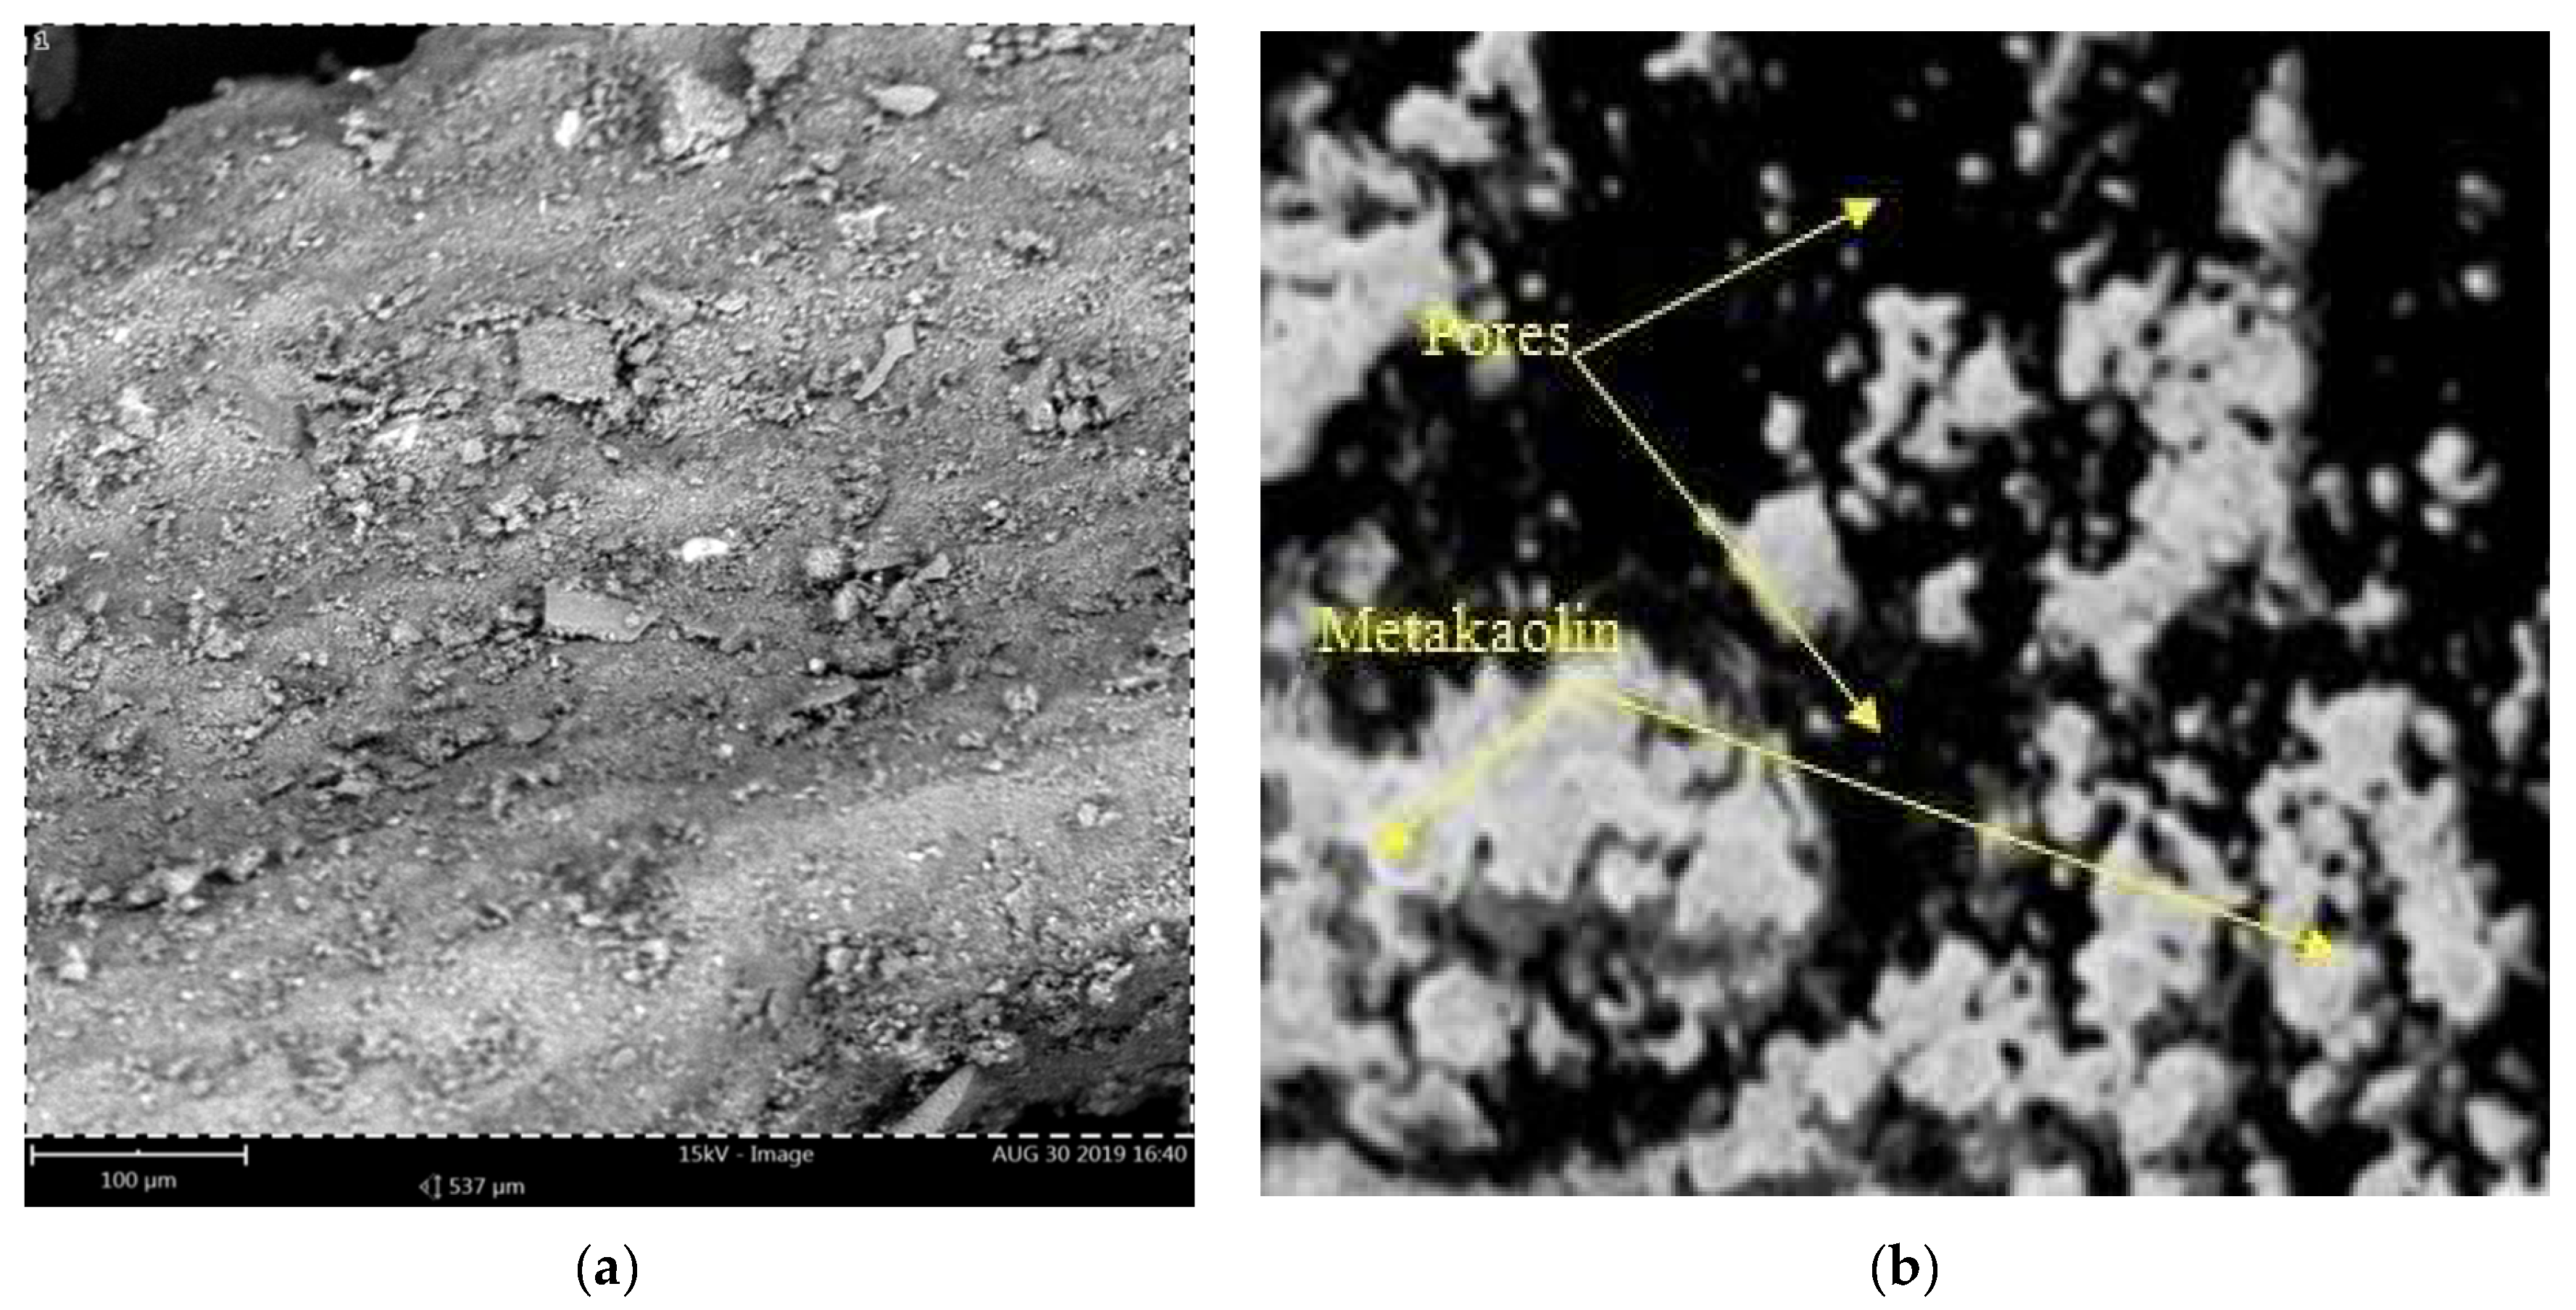
4.2. Microstructural Analysis of Ogun Samples of Kaolin and Metakaolin

A scanning electron microscopy (SEM) test was conducted on both the kaolin and metakaolin samples. The microstructures of kaolin and metakaolin at 200 µm and 15 kV of accelerating voltage are shown in Figure 5a,b, respectively. The operating distance (machine microscope distance) was 15.9 mm between the microscope and the sample. Based on the mineral composition, the morphological analysis of the kaolin sample reveals its crystalline character, whereas the analysis of the metakaolin sample reveals its amorphous form. The metakaolin SEM image shows more tiny particles and numerous residual pores dispersed throughout the sample, demonstrating the silica’s high activity and huge internal surface area. The kaolin decomposes during calcination and displays a very porous structure, similar to the results shown in [19]. The results from the energy dispersive X-ray spectroscopy (EDS) yielded the elemental composition of the kaolin and metakaolin samples, as shown in Figure 6a,b, respectively. Observations from the EDS charts show that accelerating voltage of 15 kv was used to stimulate the X-rays from all elements in the samples.
This energy was enough to overcome the ionization energy to generate the characteristic X-ray. The height of the X-ray peak (counts) in the spectra (EDS) generated from an SEM is not proportional to the concentration of the element in the samples. However, the elements present in major amounts will show major peaks in the spectrum.

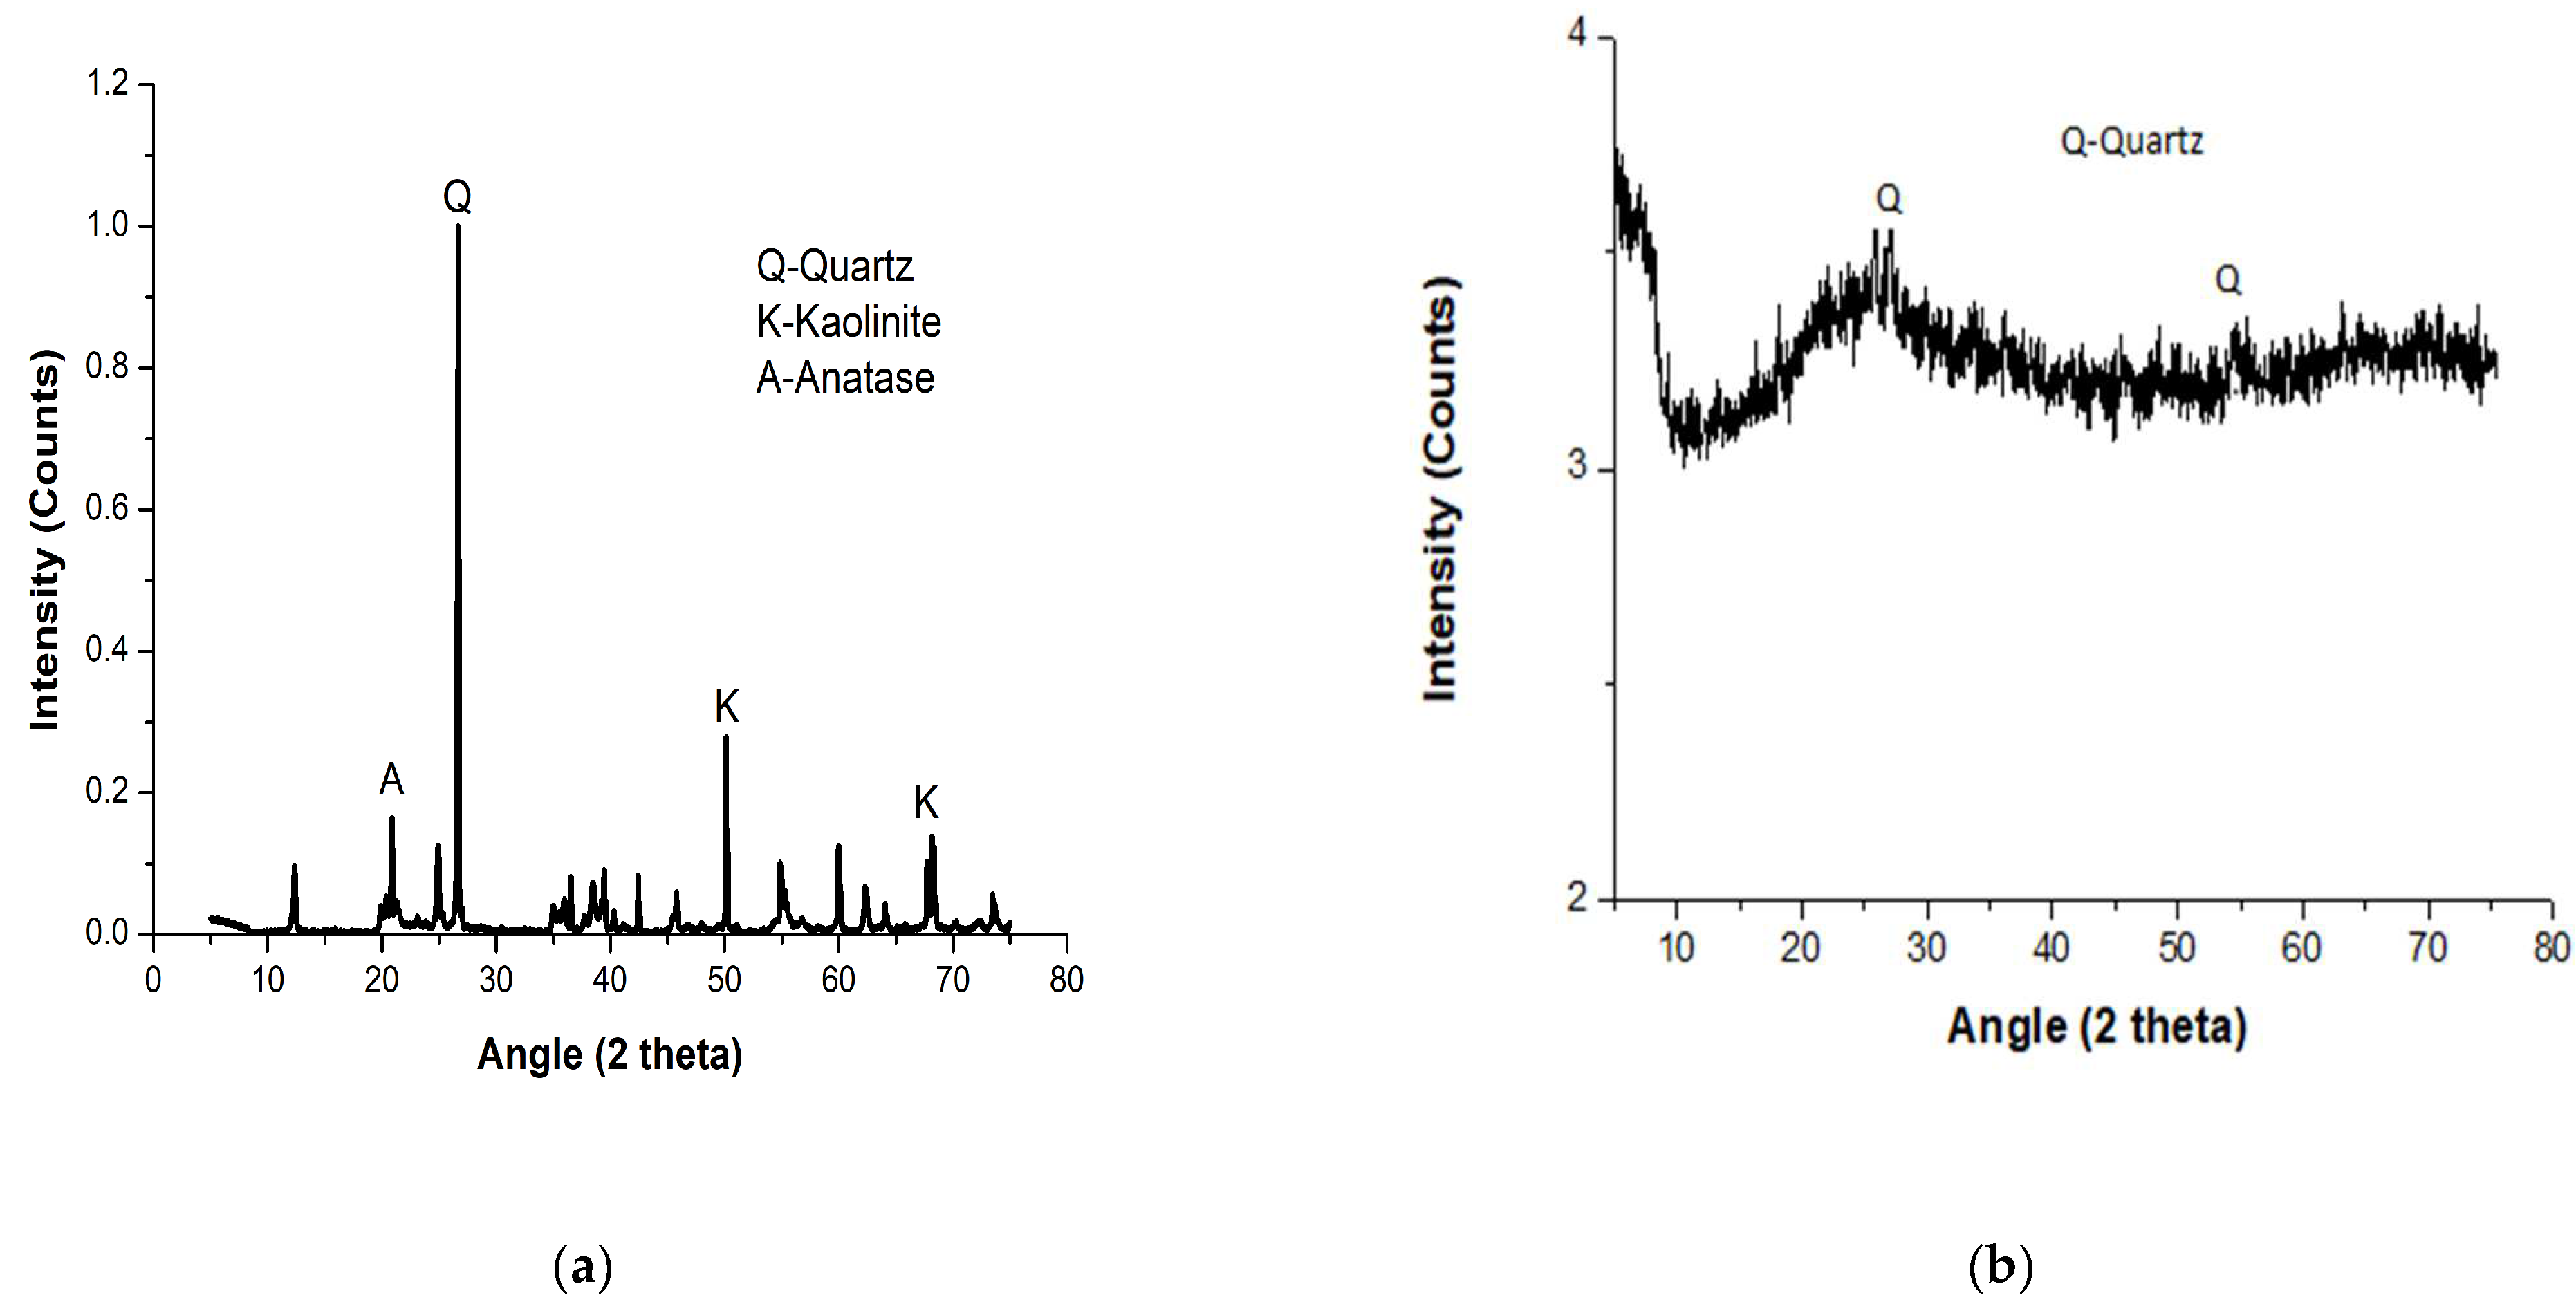
4.3. Crystallographic Phases of Ogun Samples of Kaolin and Metakaolin

Figure 7 displays the results of the X-ray diffraction spectroscopy (XRD) for the samples of kaolin and metakaolin. The crystalline phases exhibited by the XRD pattern for the Ogun kaolin sample mainly suggested the existence of kaolinite, quartz, and anatase. Peaks were identified and referenced with the International Center for Diffraction Data (ICDD) and Crystallography Open Database (COD) card numbers, as shown in Table 3. The outcome differs somewhat from that of a study where the initial kaolin clay primarily included kaolinite and quartz [20]. The high intensity count of the XRD pattern of the raw kaolin, which is seen in the diffractogram, indicates that it is crystalline.
An XRD test was also performed on the calcined kaolin (metakaolin) to verify that the kaolinite peaks had vanished following heat treatment. During the calcining procedure, the kaolinite peaks vanished, indicating a full transformation of kaolinite to metakaolin. Quartz was a component of the metakaolin that was not fully dissolved, as displayed in the XRD pattern in Figure 7b. Due to the low intensity count and wide peaks, the XRD diffractograms were found to be amorphous. After calcination, all the noticeable peaks at 2θ that were seen in the Ogun kaolin samples vanished. This behavior is expected due to the collapse of the structure caused by the OH group that accompanies the plate-like nature of kaolin, resulting in a disorganized arrangement [55]. One-half of the peaks at 2θ for the Ogun crystalline size were 48.26 nm. The outcome shows how well-rounded the sample was.

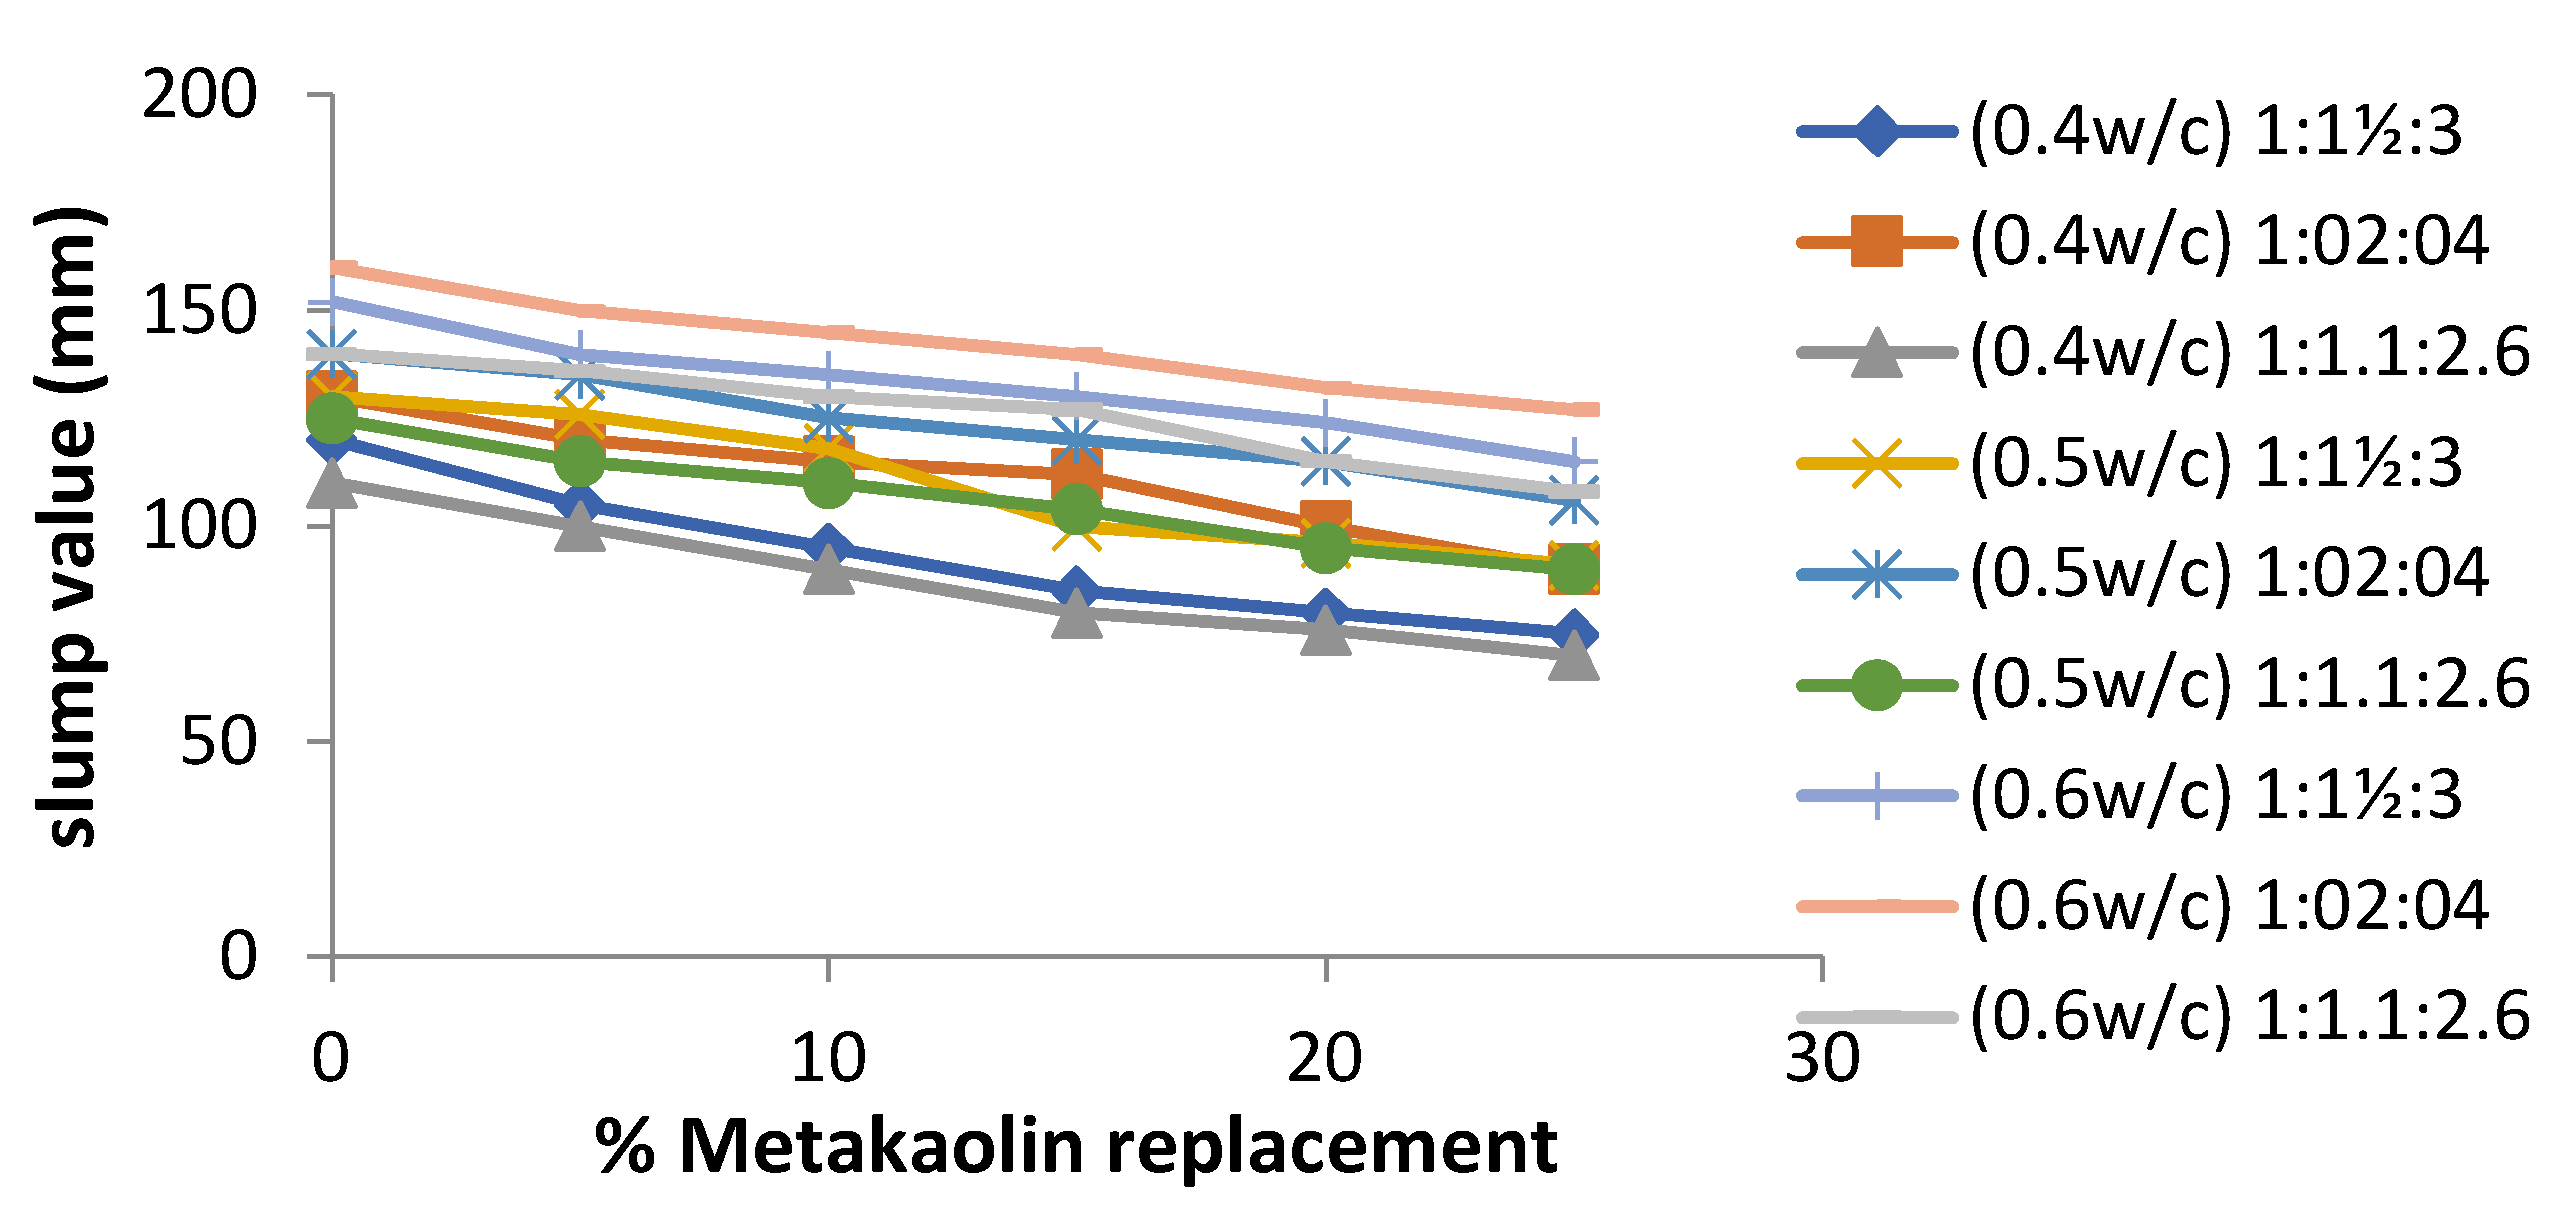
4.4. Workability of Cement-Metakaolin Concrete

The linear curve in Figure 8 depicts the workability of the cement-metakaolin concrete mix as assessed by the slump test. Metakaolin inclusion in the mix was shown to reduce the workability of the concrete, with the decline being greater at higher replacement levels. Metakaolin has a high capacity for absorption; thus, additional water is required to retain the homogeneity and workability of the concrete mix.

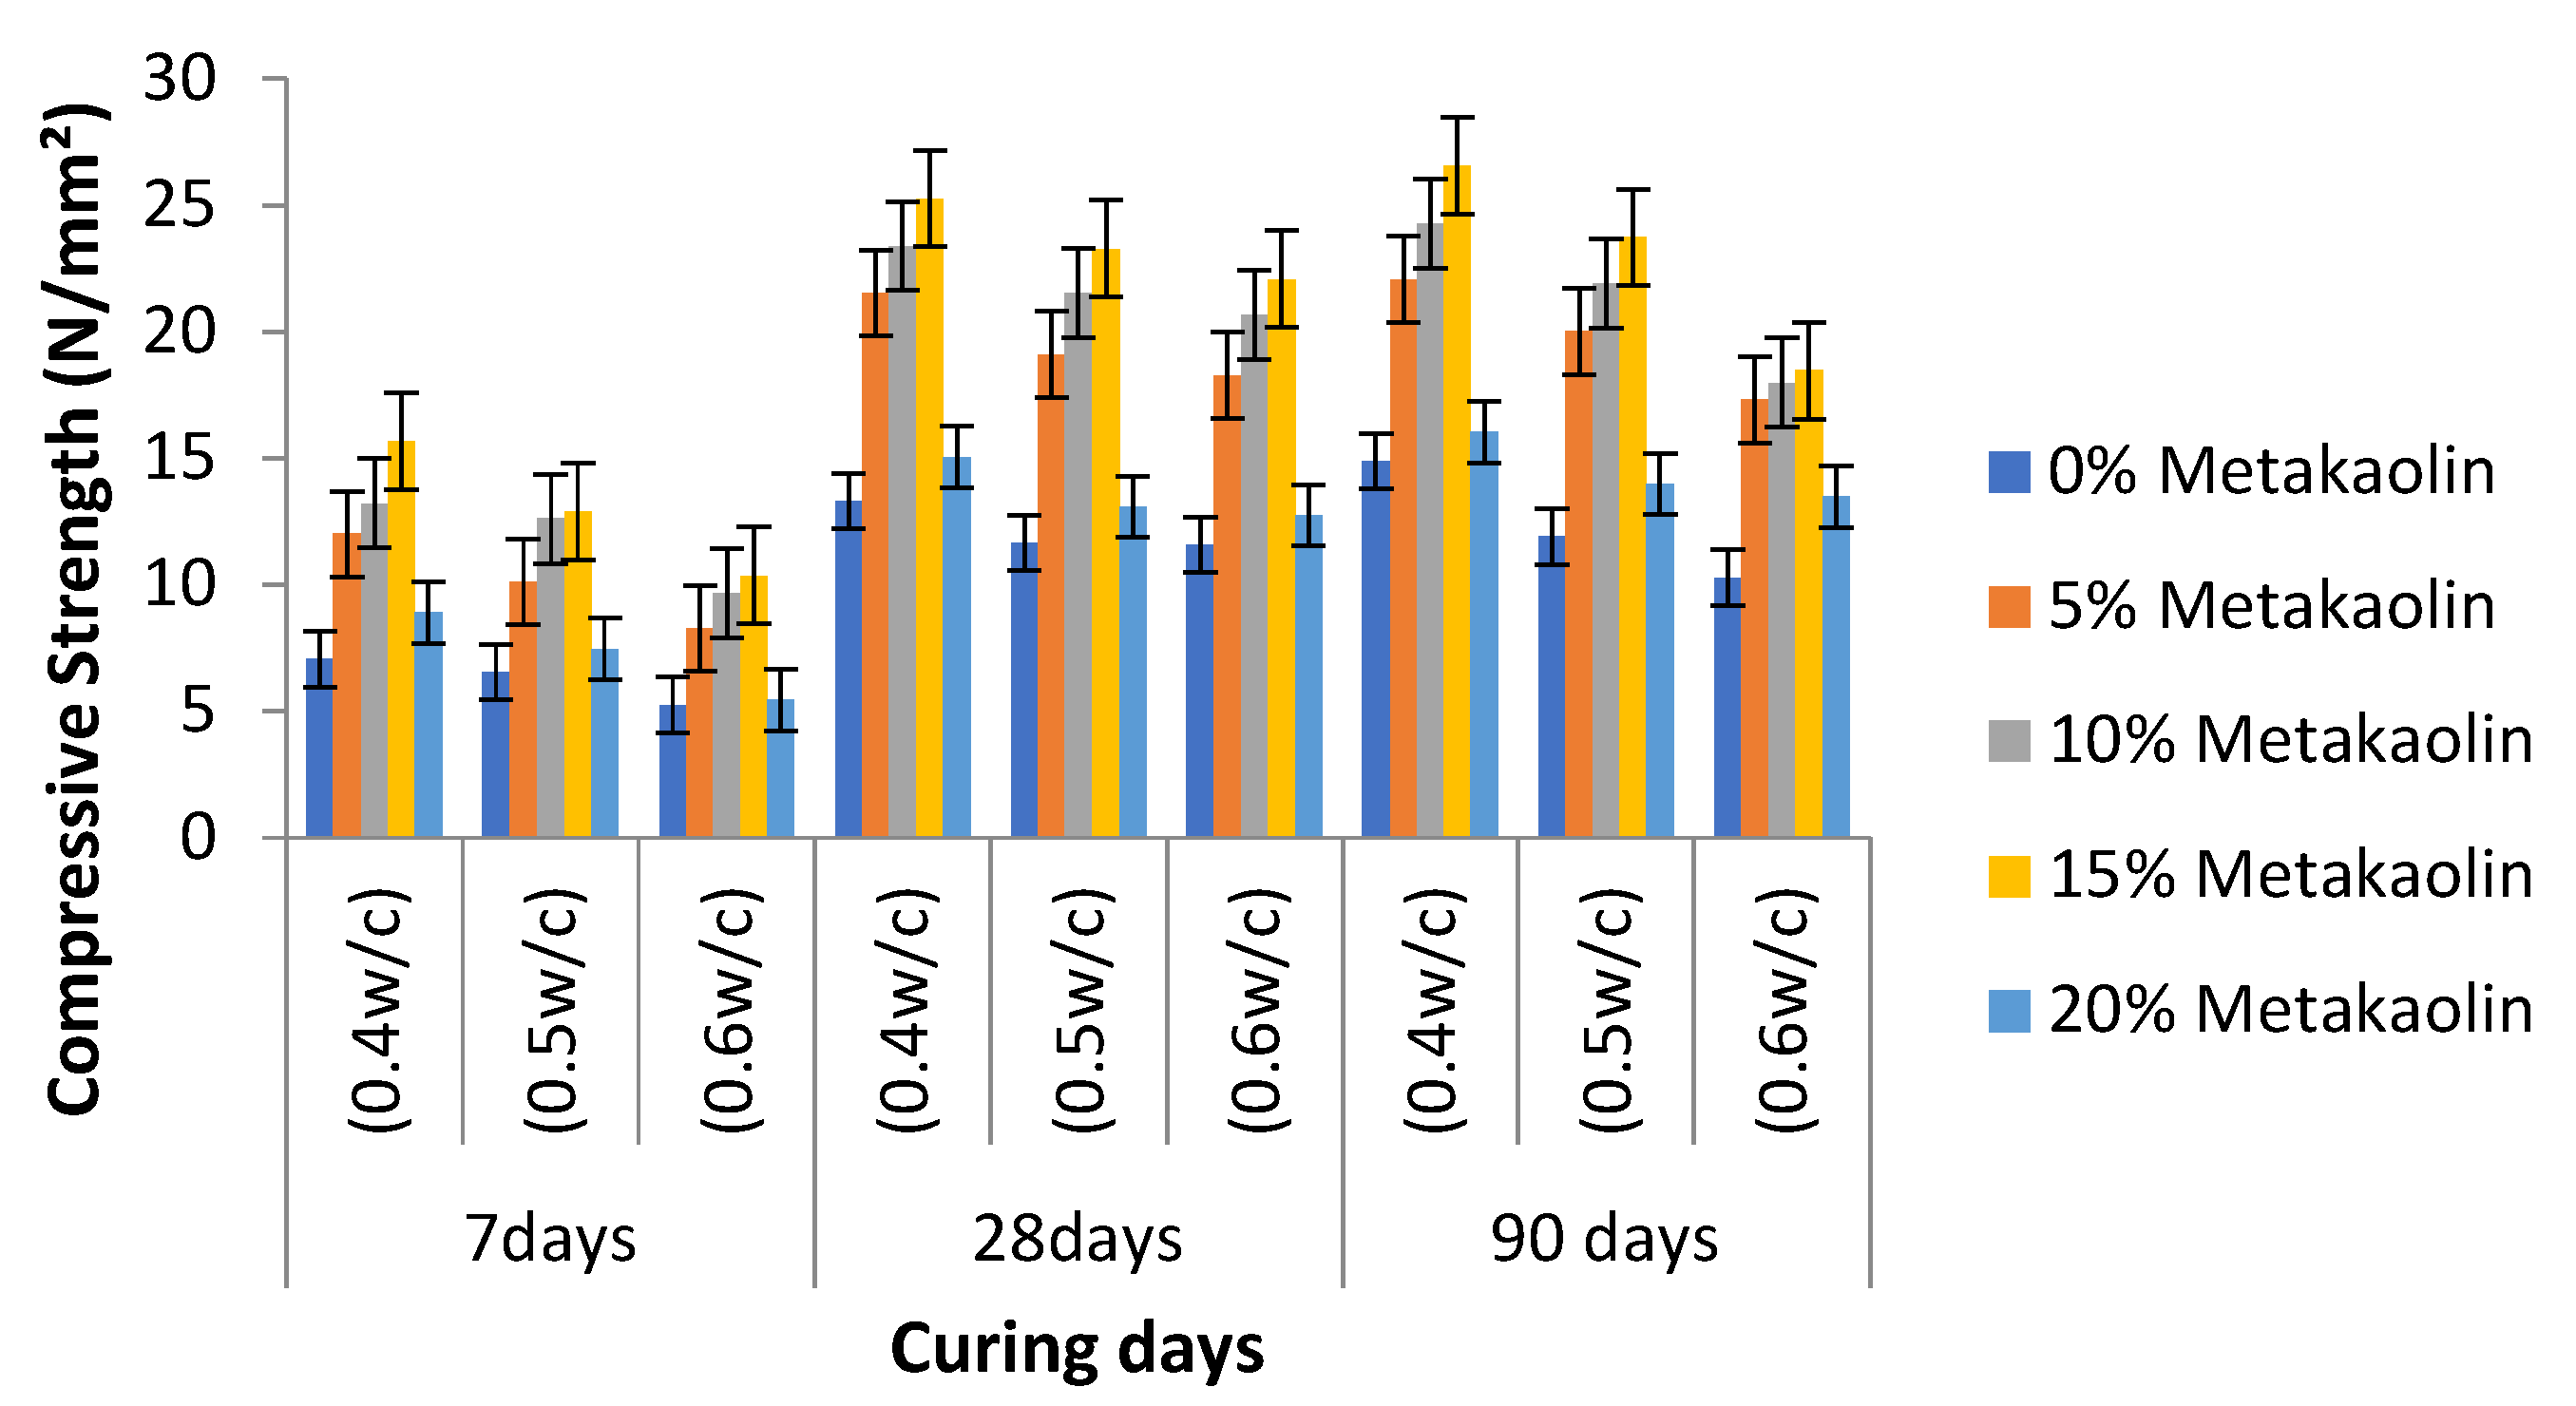
4.5. Compressive Strength of Cement-Metakaolin Concrete

The compressive strength of the control specimen at 1:1½:3 was 25.2 N/mm2 and ranged between 22.6 and 32.6 N/mm2 for cement-metakaolin concrete. For the 1:2:4 mix ratio, the compressive strength of the control specimen was 22.2 N/mm2, and it ranged between 19.9 and 30.2 N/mm2 for cement-metakaolin concrete. At 90 days, the specimens containing metakaolin had compressive strengths that were greater than those of the control samples at all mix ratios. The maximum compressive strength value was observed at 15 wt.% replacement level across all mix ratios and water–cement ratios. Compressive strengths improved when the water–cement ratio was lowered in all combinations, as anticipated. This means that the water–cement ratio of 0.4 produced the highest compressive strength, and results are presented in Figure 9. The results from this study are in line with the findings of Ding and Li [56] that compressive strength increased in mixes containing metakaolin as a cement replacement, and the 65-day strength was 6–8% greater than the 28-day strength. Furthermore, the high silica (SiO2) content of the metakaolin, as determined by the chemical composition test, is consistent with the quartz content present in the material, as revealed in the XRD pattern, which contributes to the improvement in the strength of the concrete [57].

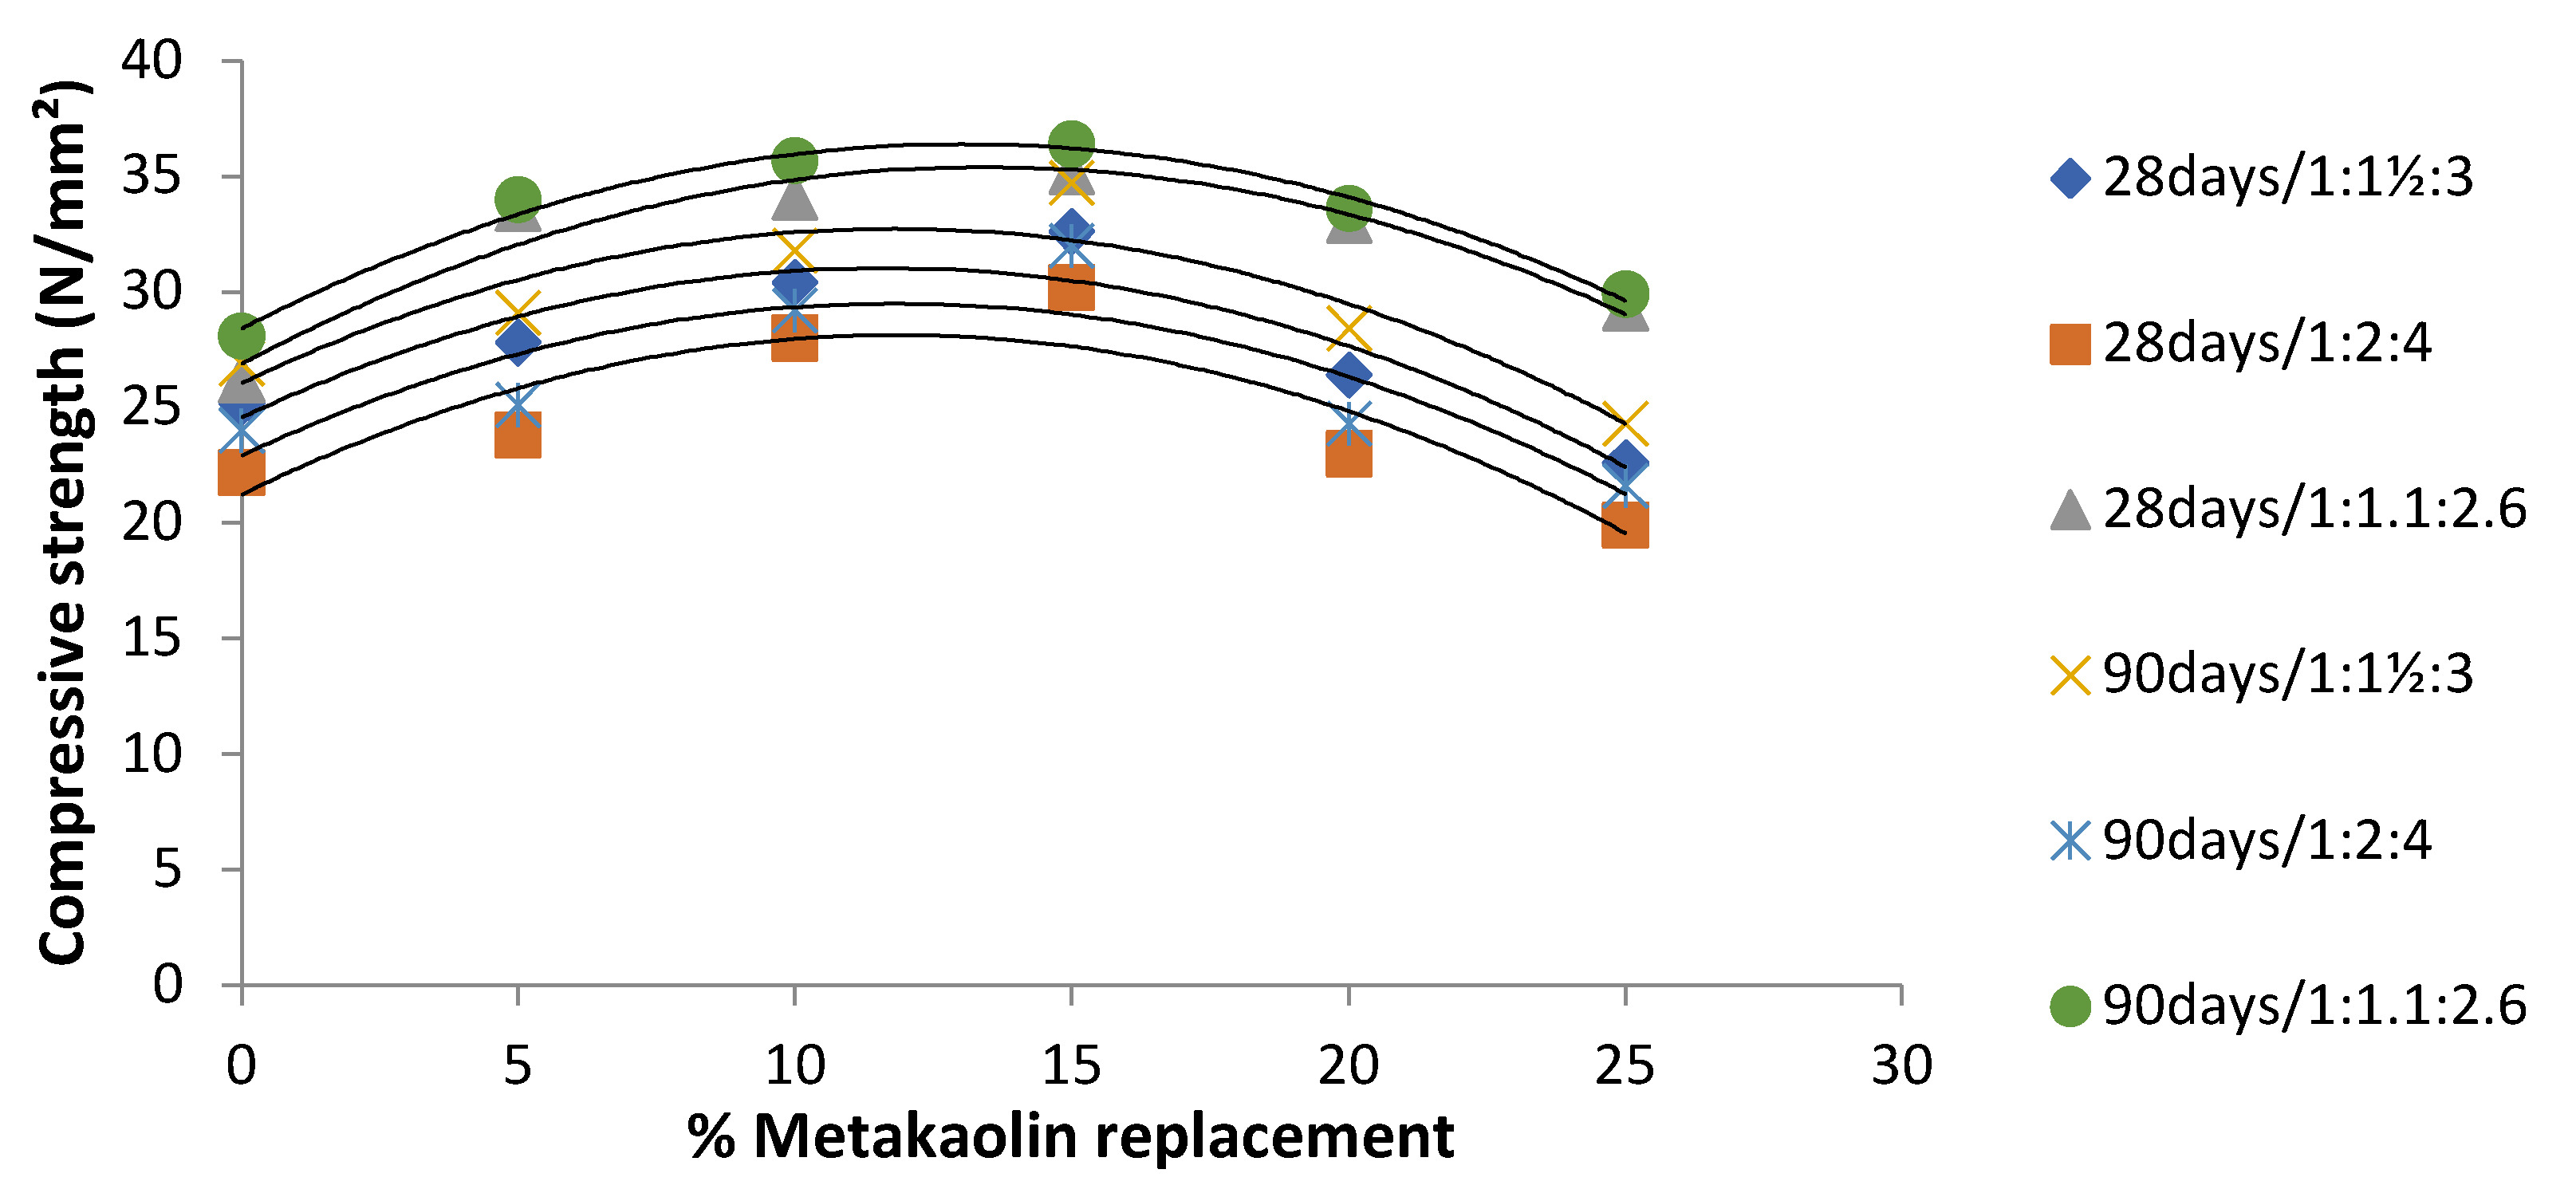
4.6. Compressive Strength of Cement-Metakaolin Mortar

The compressive strength for the control (OPC mortar) at the 0.4 water–cement ratio in the mortar application was 7.05, 13.31, and 14.87 N/mm2 at 7, 28, and 90 days of curing, respectively. However, with a 15 wt.% substitution with metakaolin, the compressive strength was 15.67, 25.26, and 26.54 N/mm2 at 7, 28, and 90 days of curing, respectively. The compressive strengths of the cement-metakaolin mortar were found to be greater than the OPC mortar at all curing ages. Cement replacement with a 15 wt.% content of metakaolin yielded the maximum enhancement of the pore refinement of the pastes. The maximum compressive strengths were attained with a lower water–cement ratio of 0.4. The compressive strengths of cement-metakaolin mortar decrease as the mass ratio of water to cement rises. This outcome is presented in Figure 10.
Because of metakaolin’s quick reaction time and the potential to speed up cement hydration, it is believed that adding more metakaolin in cement-metakaolin concrete and cement-metakaolin mortar increases the compressive strength up to 15%. The dilution effect occurred above the 15% replacement level. When Portland cement and metakaolin are combined and allowed to hydrate, the resultant cement-metakaolin concrete gradually loses free calcium hydroxide (Ca(OH)2) over time as the pozzolanic reaction evolves [58]. This indicates that during the hydration phase, metakaolin reacts with CH to produce calcium silicate hydrate (C-S-H). This formation makes the microstructure of cement-metakaolin paste more compact, reducing porosity, and improving compressive strength by reducing the size of the pores in the crystalline hydration products. The chemical reaction obtained in cement-metakaolin concrete is expressed in Equation (5) [59].
Mk (Al2Si2O7) + CH + H → C-S-H, C4AH13, C3AH6, C2ASH8

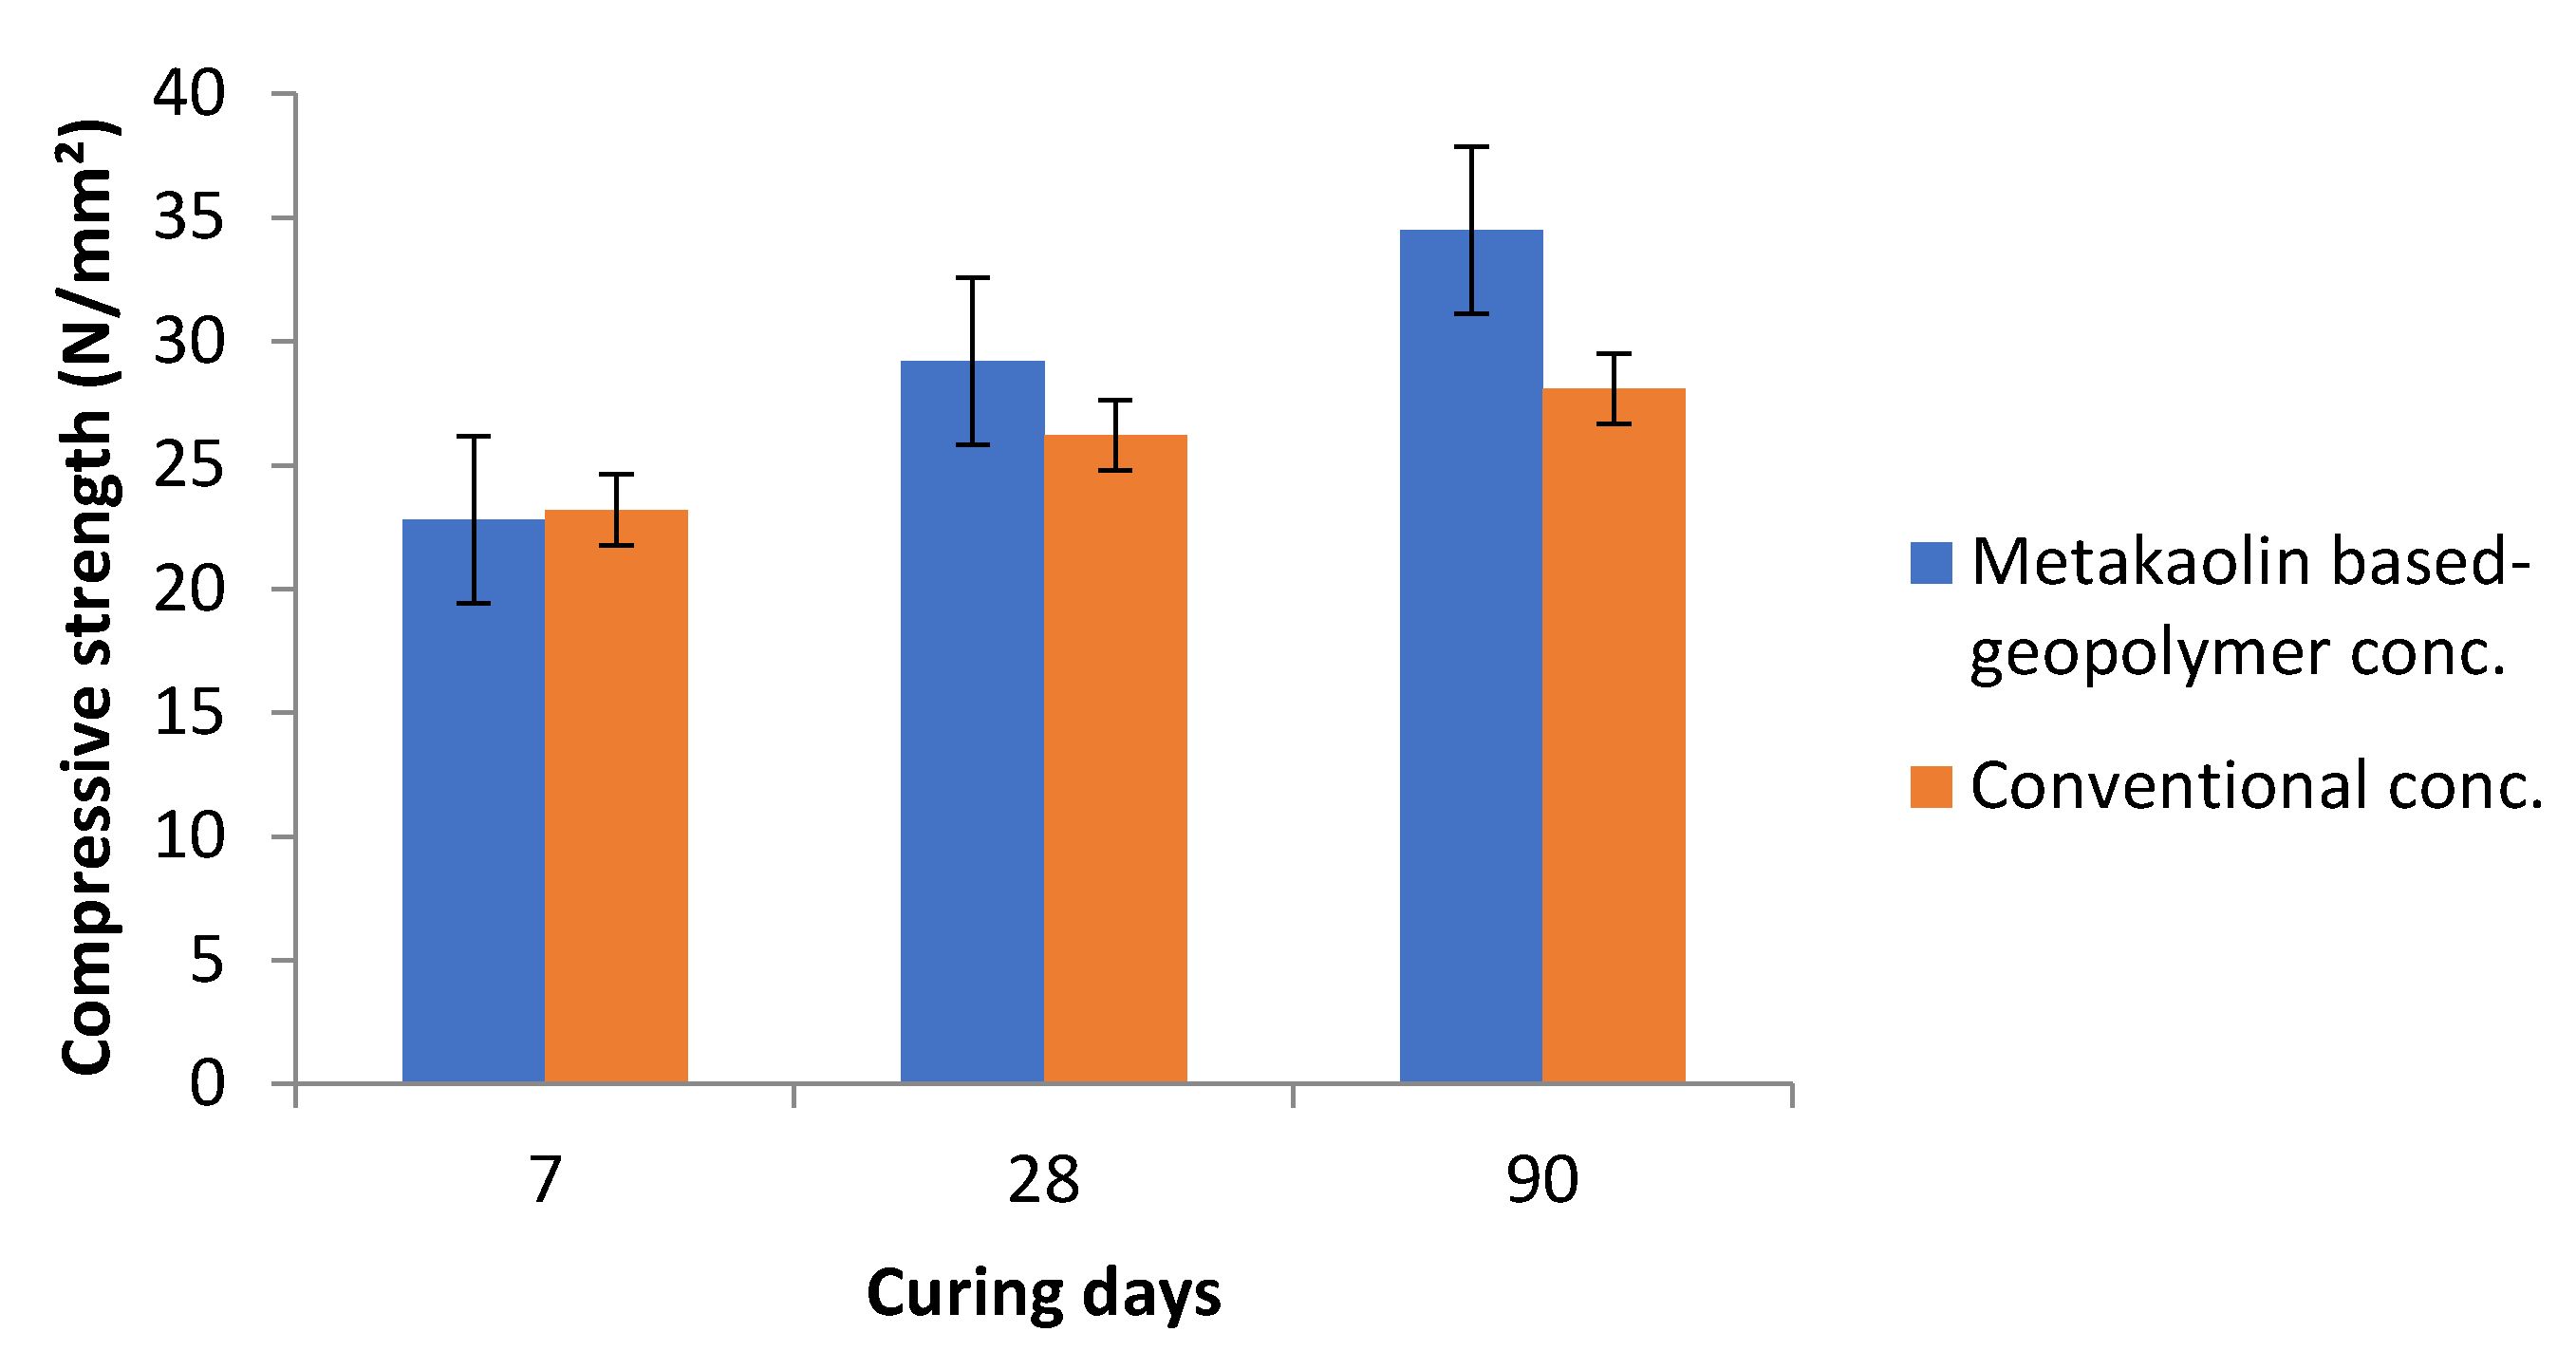
4.7. Compressive Strength of Metakaolin as a Geopolymer in Concrete Production

The result showing the comparison of the compressive strengths of metakaolin-based geopolymer concrete, and the conventional (ordinary Portland cement, OPC) concrete is shown in Figure 11. It was observed that the compressive strength of the metakaolin-based geopolymer concrete increased significantly compared to the conventional (OPC) concrete.
This result is consistent with the report of Yao [60], which demonstrated that ambient curing accelerates the dynamics of the polymerization process, producing geopolymers with increased strength. Concrete produced from metakaolin-based geopolymer strengthened more quickly than OPC concrete. At 28 days, the compressive strengths of metakaolin-based geopolymer concrete showed an 11.5% increase in strength over the conventional concrete. This also justifies the report of Amin et al. [18] that the compressive strength of high-strength metakaolin geopolymer concrete had a 7.3% increase over the OPC concrete, which was attributed to the high alumina content.

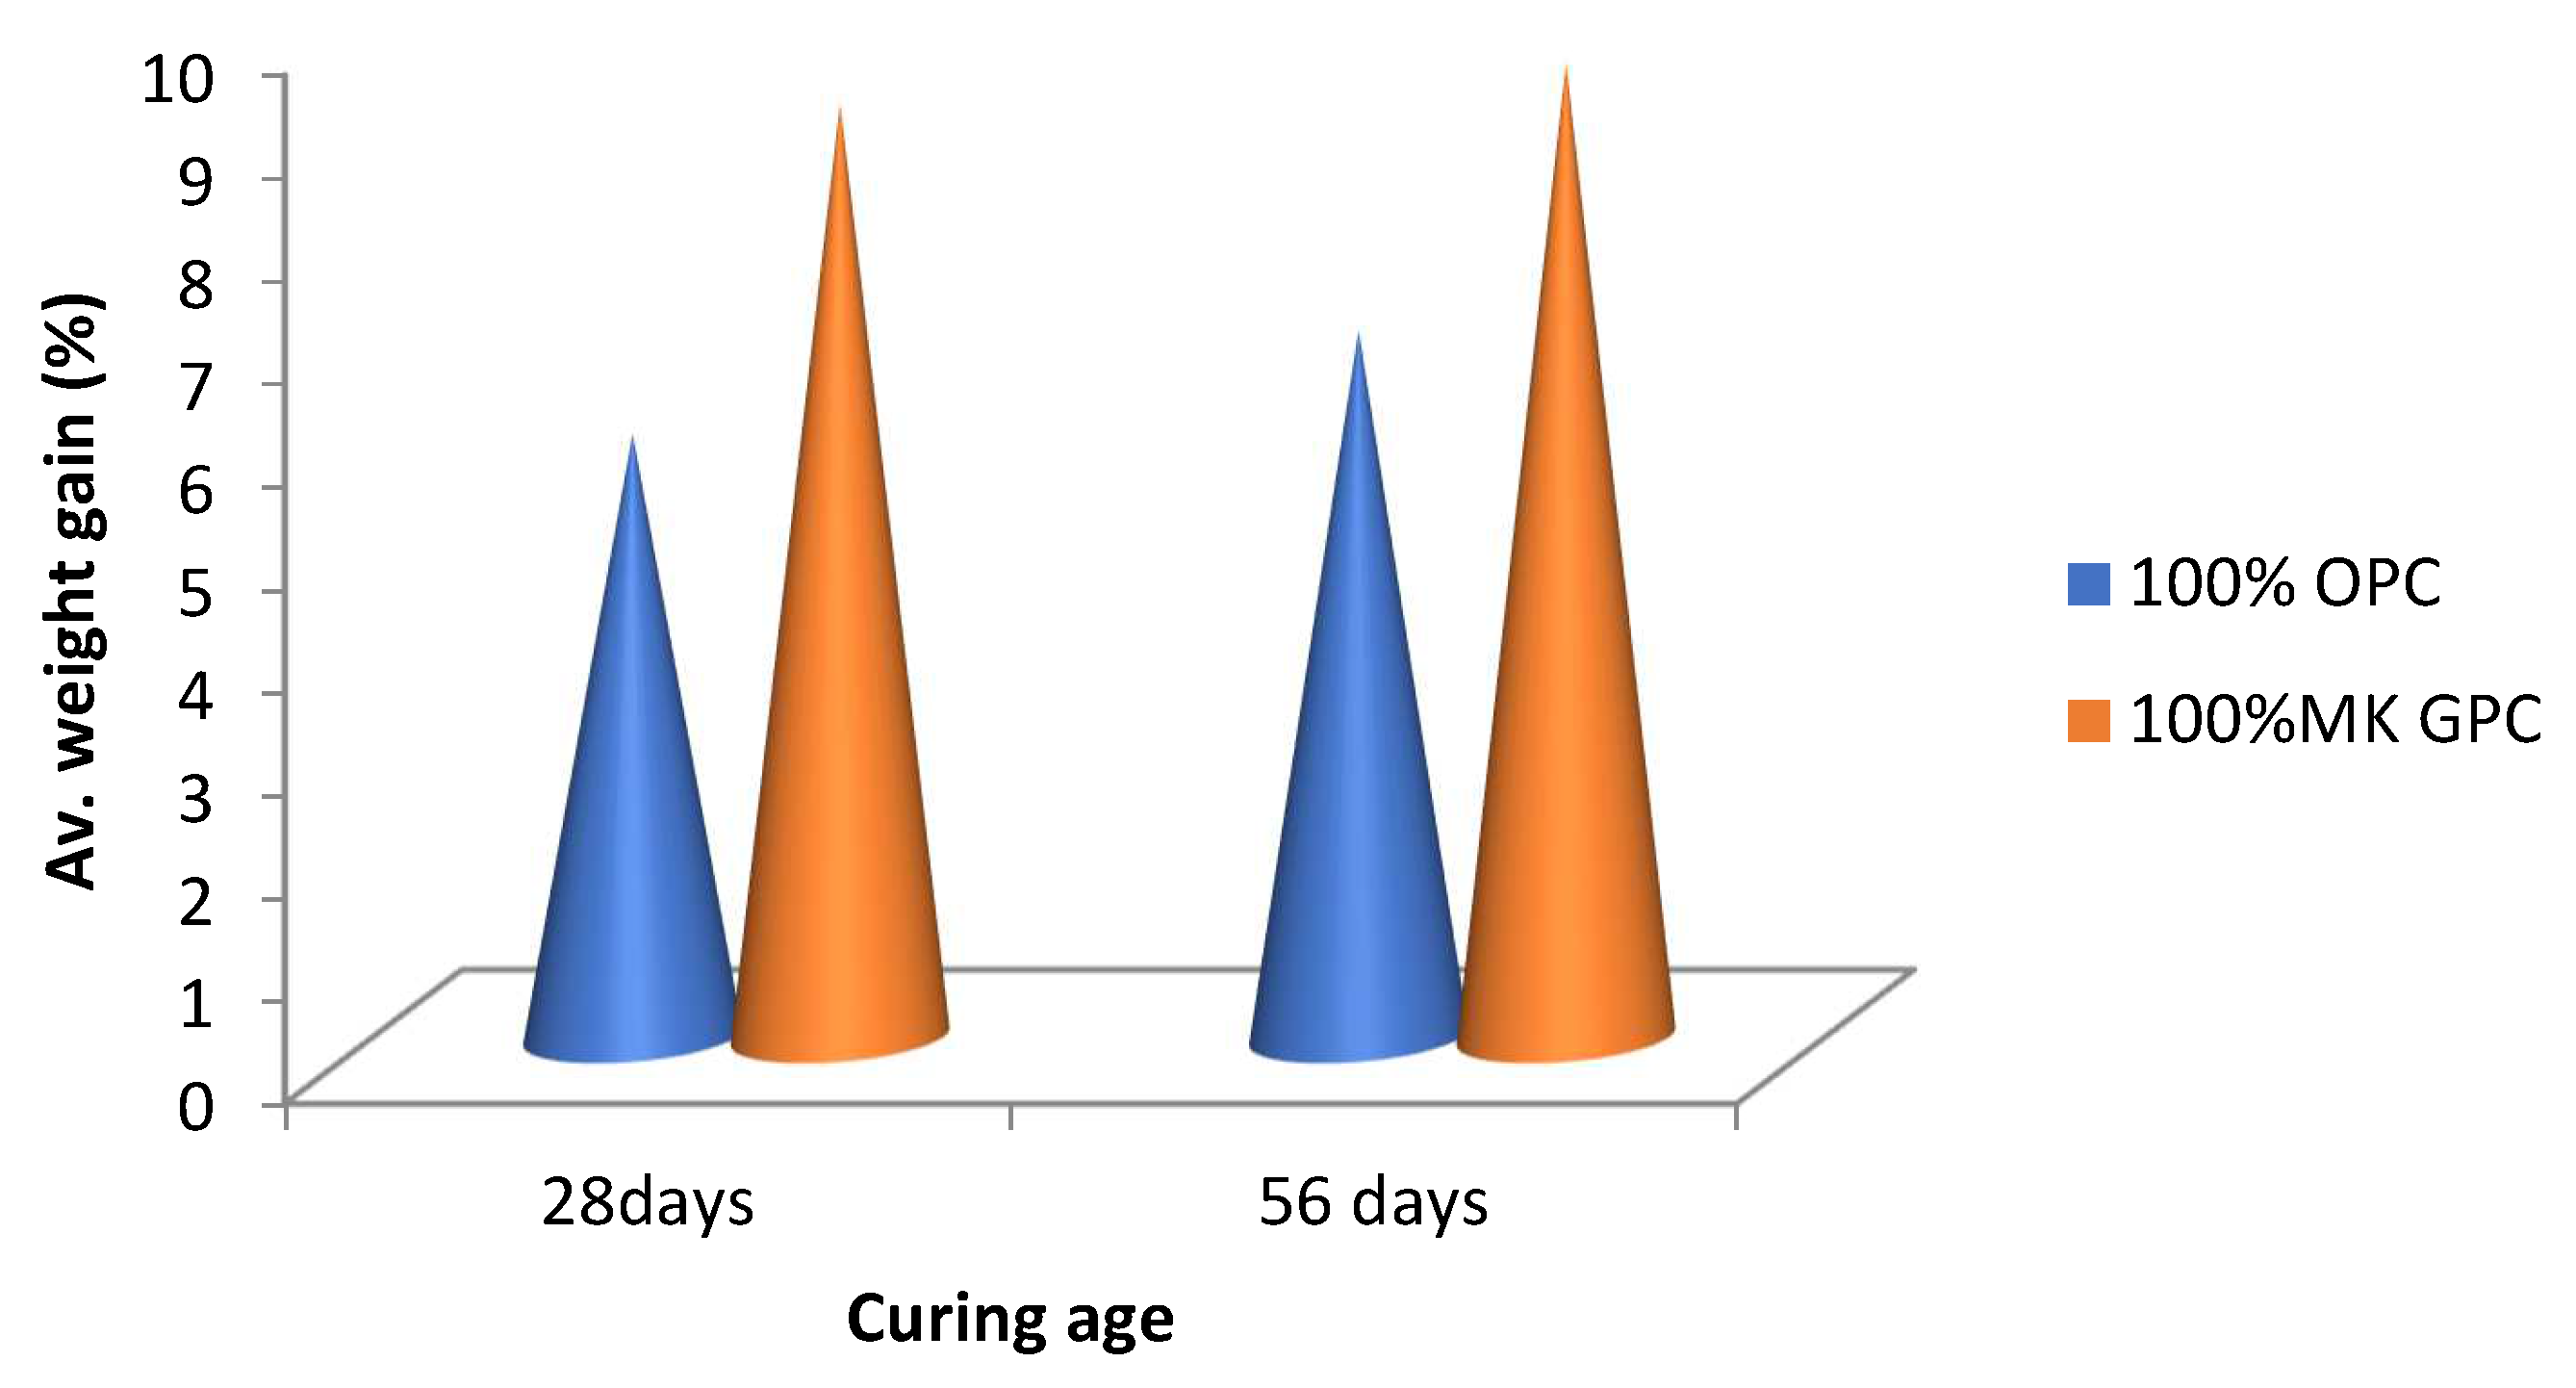
4.8. Water Absorption Capacity of Metakaolin-Based Geopolymer Concrete

The average water absorption capacity of the metakaolin-based geopolymer concrete and OPC concrete specimens at 28 and 56 days of curing is shown in Figure 12. When compared to OPC concrete specimens, which had absorption capacities of 5.86% and 6.87% at 28 and 56 days of curing age, respectively, the metakaolin-based geopolymer concrete specimens exhibit high absorption capacities of 9.07% and 9.47%. This may be explained by the water content of the Mk-GPC specimens leaking out during oven drying. This supports Rangan’s [61] assertions that water is released during the formation of geopolymer (that is, during curing and the further drying period of the matrix), leaving behind nano-pores. Albidah et al. [62] also reported a similar trend, showing that the water absorption percentage increases in metakaolin-based geopolymer concrete, varying consistently between 4.6% and 7% when compared with cement concrete mixes. Shekarchi et al. [63] concluded that by using the standard concrete mixture with 15% metakaolin, water absorption increased by 28%.

4.9. Statistical Analysis

The ANOVA results for the compressive strengths of the cement-metakaolin concrete and metakaolin-based geopolymer concrete are presented in Table 4. The ANOVA test showed that all the linear terms and interactions of the percentage replacement with metakaolin, curing time, and curing days are statistically significant (p < 0.01) to the compressive strength of cement-metakaolin concrete.
However, in the case of metakaolin-based geopolymer concrete, the ANOVA test showed that all other terms, except the water–cement ratio, remain statistically significant to the compressive strength of the metakaolin-based geopolymer concrete.
The resulting equations for the strength prediction model for cement-metakaolin concrete regarding the mixes used are summarized by Equations (6)–(8), respectively, and Equation (9) for the cement-metakaolin mortar.
Strength (1:1½:3) = 37.01668 + 0.993048x1 − 0.04175x12 + 0.500196x2 − 0.00396x22 − 86.8333x3 + 69.4444x32
Strength (1:2:4) = 18.06902 + 0.84804x1 − 0.0356x12 + 0.424197x2 − 0.00337x22 − 9.41667x3 − 10.8333x32
Strength (1:1.1: 2.6) = 21.10372 +1.428048x1 − 0.05262x12 + 0.22992x2 − 0.00181x22 − 0x3 + 0x32
Strength (mortar) = 11.21811 + 1.778854x1 − 0.08261x12 + 0.573756x2 − 0.00486x22 − 23.8067x3 + 4.66667x32
where; x1 = percentage replacement; x2 = curing days; x3 = water–cement ratio.
The model also compared favorably with the experimental results. R2 values were between 91.4–94.5% for cement-metakaolin concrete, 93.1% for cement-metakaolin mortar, and 99.7% for metakaolin-based geopolymer concrete. The p-values were <0.05 in all study samples. The significance F values were between 1.27 × 10⁷ and 5.33 × 1026 for cement-metakaolin concrete, and 1.49 × 10²⁰ for cement-metakaolin mortar. The standard error values were also very small in all samples. All these statistical aspects showed the goodness of fit of the model.
The assumptions for ANOVA were checked using the Pareto charts, as shown in Figure 13a1–a3, and it was observed that of all the independent variables, the percentage replacement had the largest effect on the compressive strength (dependent variable) in all concrete mixes. The comparison of the experimental and predicted charts is shown in Figure 13b1–b3. This shows that both the results obtained from the experiment and the results predicted by the model correlated, as could be seen by the similar patterns exhibited.

5. Conclusions

The construction industry contributes 25% of the world’s total carbon dioxide emissions and accounts for 40% of global energy consumption, according to the Intergovernmental Panel on Climate Change (IPCC). Despite being relatively short, the construction phase of a building’s life cycle has a greater carbon dioxide emission density than the periods of operation and maintenance. In the transportation industry, diverse building projects, including subgrade, pavement, bridges, and tunnels, also produce a significant amount of CO2 emissions. Due to widespread and rapid urbanization, particularly in emerging nations, the amount of cement used as a building material in civil engineering works has expanded substantially.
There is an urgent need to minimize carbon dioxide emissions into the atmosphere to lessen the impact of global climate change, which is caused by the greenhouse effect linked to carbon dioxide. Although many existing technologies, such as energy efficiency improvements, waste heat recovery, the substitution of fossil fuel with renewable energy sources, and the production of low-carbon cement and supplementary cementitious materials (metakaolin, fly ash, silica fume, copper slag, sewage sludge, ground-granulated blast furnace slag) are already in use to achieve CO2 emissions reduction in the cement industry. It is crucial to utilize any of the sustainable cement alternatives when making concrete and mortar in the building, transportation, and construction industries. This study used calcined kaolin (metakaolin) as a cement substitute. This is because, compared to the high percentage of CO2 that is released during the manufacture of cement, less water is released during the creation of metakaolin. In cement-metakaolin concrete and mortar, metakaolin was incorporated to partially replace cement at varying replacement levels. Metakaolin was also employed exclusively in place of cement in geopolymer concrete. The primary materials (kaolin and metakaolin) utilized in the investigation were characterized using SEM, EDS, and XRD. The evaluation, analysis, and discussion of the test findings acquired for this study allowed for the following conclusions:
  • Kaolinite was present in crystalline form in the sample, as revealed by the XRD pattern and SEM image. The undissolved quartz present in the metakaolin was responsible for the enhanced compressive strength exhibited by the metakaolin mixes. The chemical composition test also showed that the study metakaolin has good pozzolanic and geopolymer characteristics due to its high concentrations and cumulative percentages of silica and alumina (93.39%).
  • Metakaolin has a high capacity for absorption, as seen in the workability test; thus, the use of a superplasticizer is required, as additional water affects the strength of the concrete mix.
  • Metakaolin admixed specimens showed greater strength responses than the OPC (control) specimens in cement-metakaolin mortar, as well as in cement-metakaolin concrete. For compressive strengths at all mix ratios, the optimum performance was seen at 15 wt.% of metakaolin substitution. This could be explained by the fact that metakaolin admixed mixes include more calcium silicate hydrates (CSH), a strength enhancer. In all combinations, compressive strengths increased when the water–cement ratio was decreased.
  • In geopolymer concrete, compressive strengths of metakaolin-based geopolymer concrete at 28 days curing showed an 11.5% increase in strength over the conventional (OPC) concrete.
  • Metakaolin-based geopolymer concrete specimens exhibited high water absorption capacities, with a 55.78% and 37.85% increase over the conventional (OPC) concrete at 28 and 90 days curing, respectively.
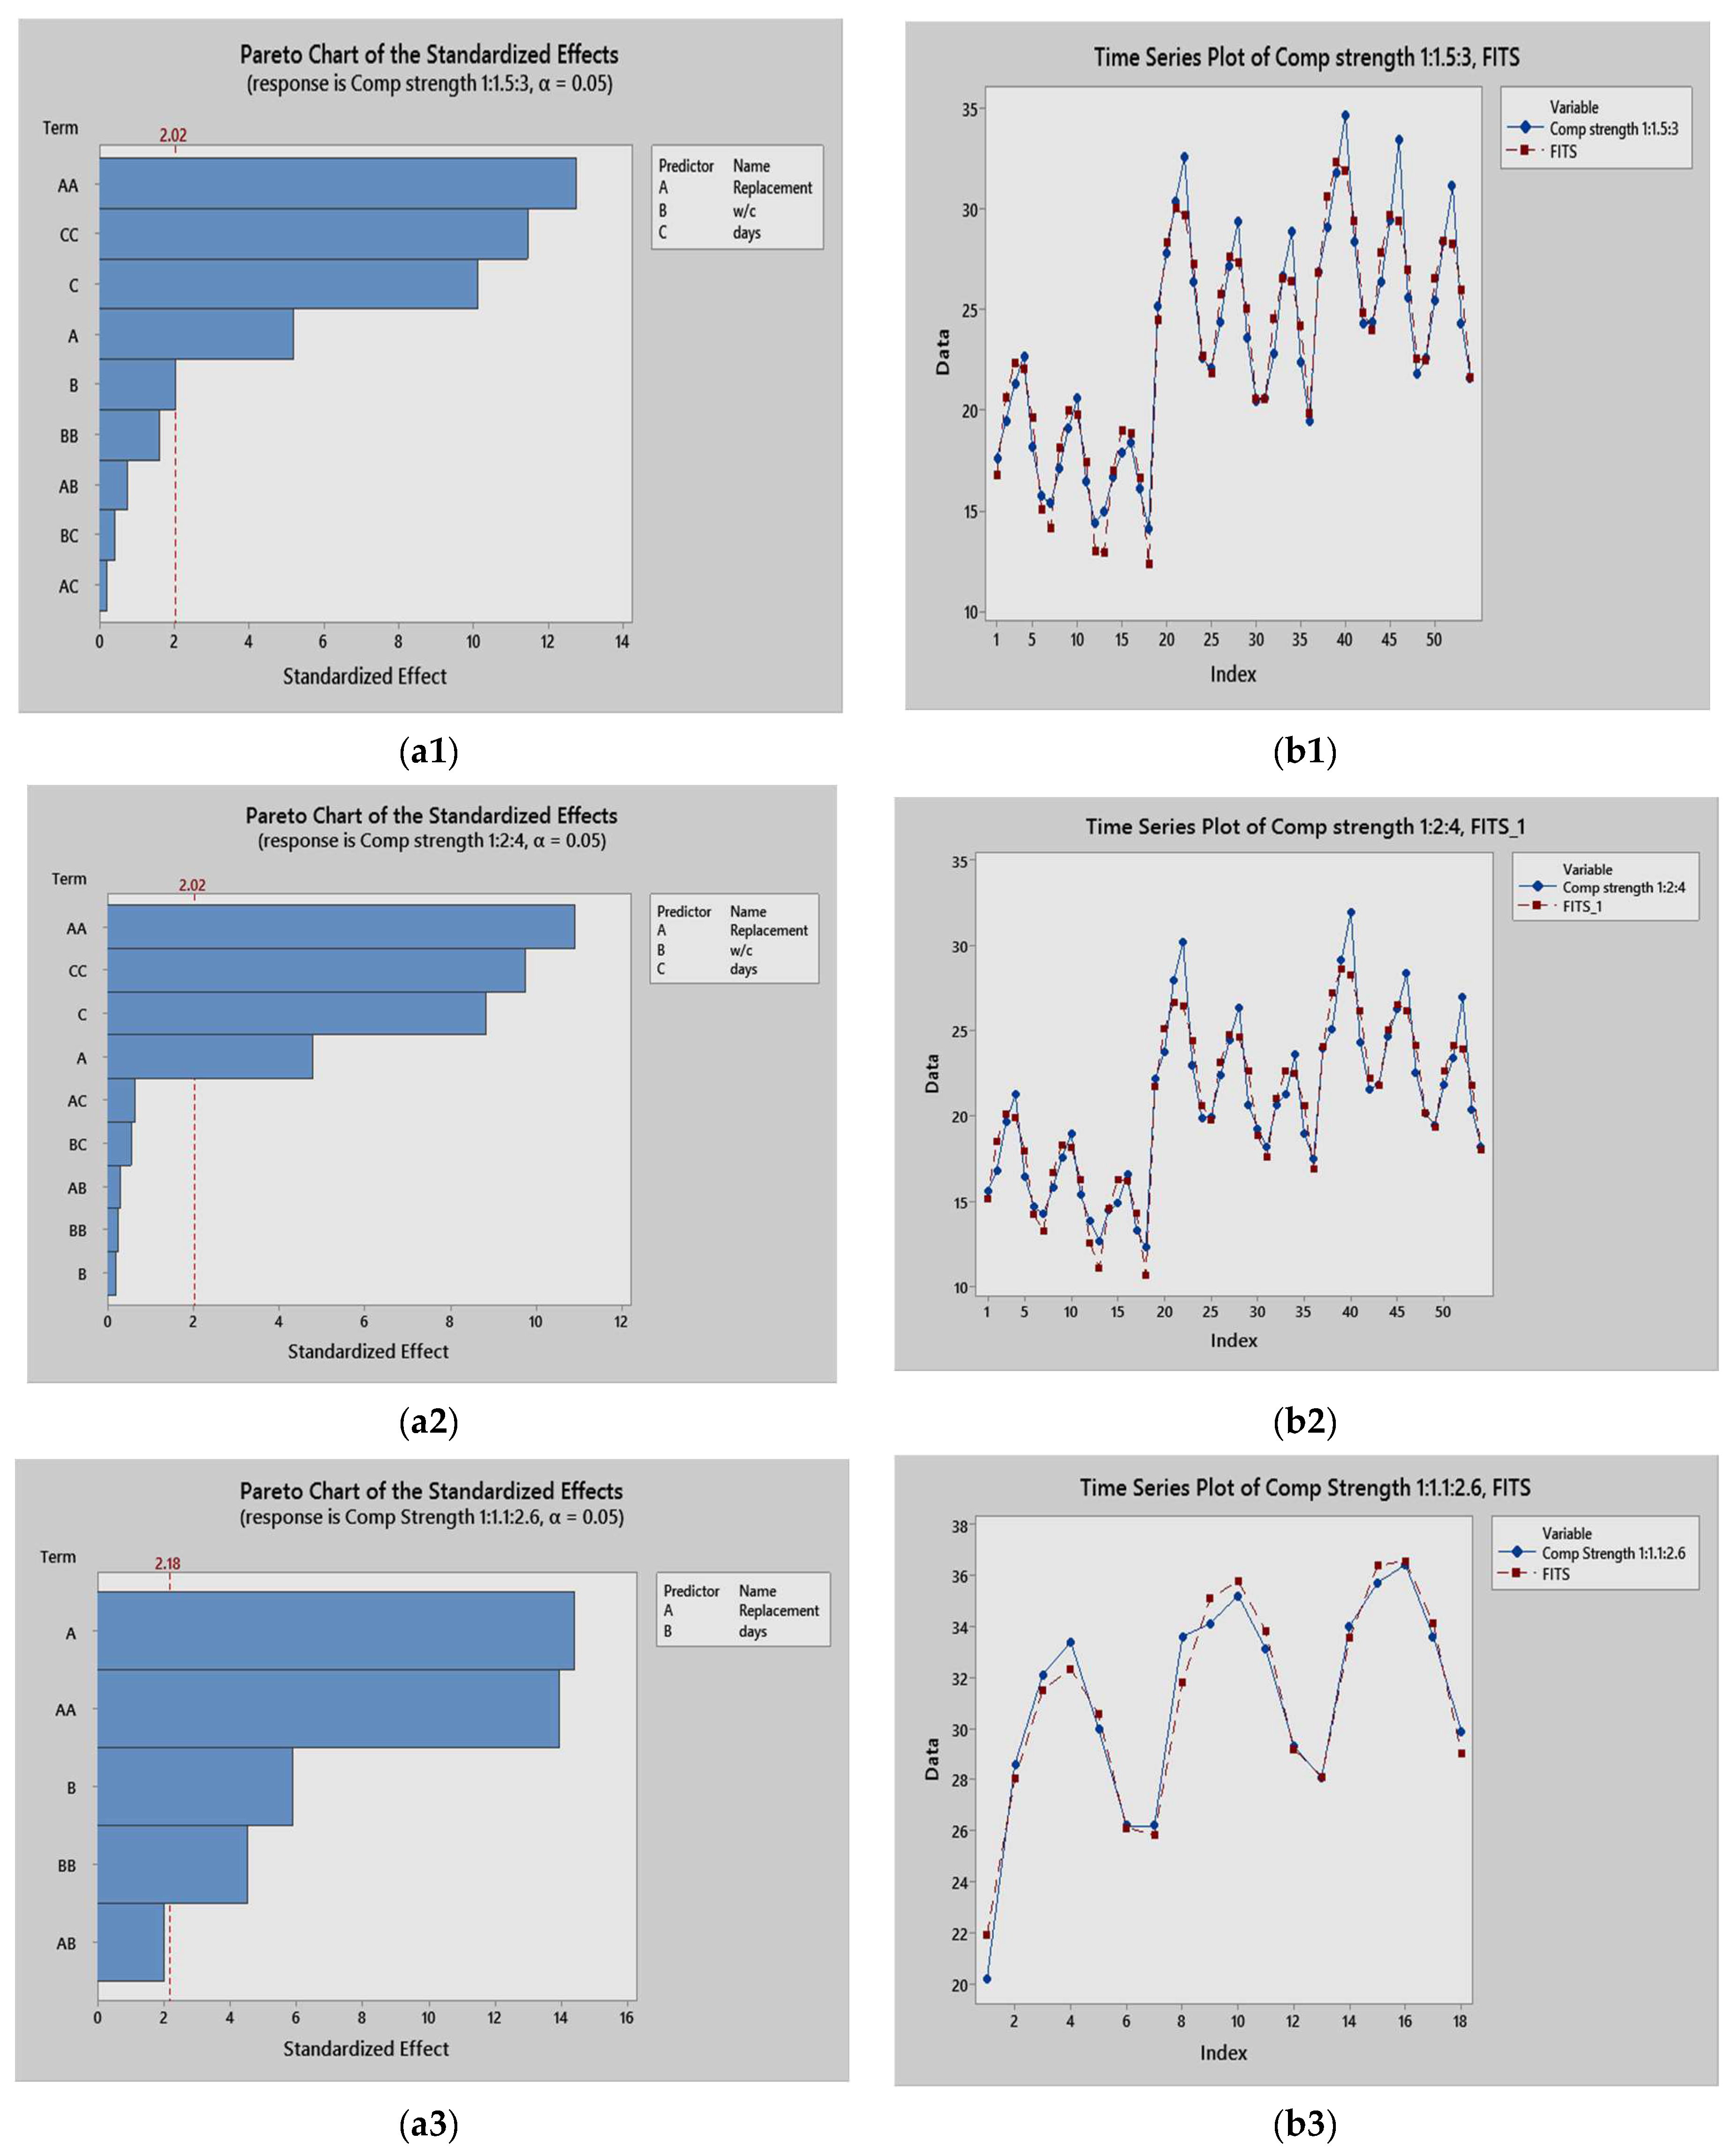
  • Results from the ANOVA test showed that the percentage replacement with metakaolin, curing time, and the calcining temperature all have significant effects on the compressive strength of the studied concrete specimens. The percentage replacement with metakaolin was significant, and had the greatest effect on the compressive strength. The empirical models developed in the study are useful for predicting the compressive strength.
  • The use of low calcium-based materials, such metakaolin, in concrete production reduces manufacturing temperature and fuel consumption, which then leads to reduction in carbon emissions. When compared to conventional concrete, the inclusion of metakaolin in concrete production as a pozzolan or a geopolymer is projected to create roughly 70% and 100% less carbon dioxide [64].
  • According to the results of the compressive strengths obtained from the experiments in this study, metakaolin-based geopolymer concretes are excellent for use in precast structural components and concrete goods, including power poles, sleepers for railroads, and interlocking blocks.

Author Contributions

Conceptualization, Y.O.A. and S.O.A.; methodology, Y.O.A., O.A.O. and S.O.A.; investigation, Y.O.A. and S.O.A.; resources, O.A.O., O.P.G. and E.F.O.; data curation, Y.O.A. and D.V.O.; writing—original draft preparation, Y.O.A.; writing—review and editing, O.A.O., S.O.A. and Y.O.A.; visualization, Y.O.A., O.P.G. and S.O.A.; supervision, S.O.A. and O.A.O.; project administration, O.A.O., E.F.O. and D.V.O. All authors have read and agreed to the published version of the manuscript.

Funding

The Article Processing Charge was funded by O.A.O., Durban University of Technology, Durban, South Africa.

Institutional Review Board Statement

Not applicable.

Informed Consent Statement

Not applicable.

Conflicts of Interest

The authors declare no conflict of interest.

References

  1. Alhorr, Y.; Eliskandarani, E.; Elsarrag, E. Approaches to reducing carbon dioxide emissions in the built environment: Low carbon cities. Int. J. Sustain. Built Environ. 2014, 3, 167–178. [Google Scholar] [CrossRef]
  2. International Energy Agency. Global Energy Review: CO2 Emissions in 2021. Available online: https://www.iea.org/reports/global-energy-review-co2-emissions-in-2021-2 (accessed on 12 May 2022).
  3. Teixeira, E.R.; Mateus, R.; Camões, A.; Branco, F.G. Quality and durability properties and life-cycle assessment of high volume biomass fly ash mortar. Constr. Build. Mater. 2020, 197, 195–207. [Google Scholar] [CrossRef]
  4. Tosti, L.; van Zomeren, A.; Pels, J.R.; Comans, R.N.J. Technical and environmental performance of lower carbon footprint cement mortars containing biomass fly ash as a secondary cementitious material. Resour. Conserv. Recycl. 2018, 134, 25–33. [Google Scholar] [CrossRef]
  5. Cumulative CO2 Emissions. Supplemental Data of Global Carbon Project 2021 (1.0), Our World in Data Based on the Global Carbon Project 2021. Available online: https://ourworldindata.org/co2-emissions (accessed on 14 May 2022).
  6. Vigneshwaran, A.; Fayaz, K. Experimental study on the behaviour of self-compacting cured concrete using chemical admixture and metakaolin. In Proceedings of the International Conference on Emerging Trends in Engineering, Science and Sustainable Technology (ICETSST-2017), Erode, India, 17–18 February 2017; pp. 18–25. [Google Scholar]
  7. Khan, M.N.N.; Jamil, M.; Karim, M.R.; Zain, M.F.M.; Kaish, A.B.M.A. Filler effect of pozzolanic materials on the strength and microstructure development of mortar. KSCE J. Civ. Eng. 2017, 21, 274–284. [Google Scholar] [CrossRef]
  8. Sabir, B.B.; Wild, S.; Bai, J. Metakaolin and calcined clays as pozzolans for concrete: A review. Cem. Concr. Compos. 2001, 23, 441–454. [Google Scholar] [CrossRef]
  9. Hemalatha, T.; Ramaswamy, A. A review on flyash characteristics-towards promoting high volume utilization in developing sustainable concrete. J. Clean. Prod. 2017, 147, 546–559. [Google Scholar] [CrossRef]
  10. Mindess, S.; Young, F.J.; Darwin, D. Concrete, 2nd ed.; Prentice Hall: Upper Saddle River, NJ, USA, 2003; pp. 234–236. [Google Scholar]
  11. Batis, G.; Pantazopoulou, P.; Tsivilis, S.; Badogiannis, E. The effect of metakaolin on the corrosion behavior of cement mortars. Cem. Concr. Compos. 2005, 27, 125–130. [Google Scholar] [CrossRef]
  12. Ma, C.K.; Awang, A.Z.; Omar, W. Structural and material performance of geopolymer concrete: A review. Constr. Build. Mater. 2018, 186, 90–102. [Google Scholar] [CrossRef]
  13. Freire, A.L.; José, H.J.; Moreira, R.D.F.P.M. Potential applications for geopolymers in carbon capture and storage. Int. J. Greenh. Gas Control. 2022, 118, 103687. [Google Scholar] [CrossRef]
  14. Nazari, A.; Bagheri, A.; Sanjayan, J.G.; Dao, M.; Mallawa, C.; Zannis, P. Thermal shock reactions of Ordinary Portland cement and geopolymer concrete: Microstructural and mechanical investigation. Constr. Build. Mater. 2019, 196, 492–498. [Google Scholar] [CrossRef]
  15. Kathirvel, P.; Kaliyaperumal, S.R.M. Influence of recycled concrete aggregates on the flexural properties of reinforced alkali activated slag concrete. Constr. Build. Mater. 2016, 102, 51–58. [Google Scholar] [CrossRef]
  16. Zabihi, S.M.; Tavakoli, H.; Mohseni, E. Engineering and microstructural properties of fiber-reinforced rice husk–ash based geopolymer concrete. J. Mater. Civ Eng. 2018, 30, 04018183. [Google Scholar] [CrossRef]
  17. Heah, C.Y.; Kamarudin, H.; Al Bakri, A.M.; Binhussain, M.; Luqman, M.; Nizar, I.K. Effect of curing profile on kaolin-based geopolymers. Phys. Procedia 2011, 22, 305–311. [Google Scholar] [CrossRef]
  18. Amin, M.; Elsakhawy, Y.; Abu el-hassan, K.; Abdelsalam, B.A. Behavior evaluation of sustainable high strength geopolymer concrete based on fly ash, metakaolin, and slag. Case Stud. Constr. Mater. 2022, 16, e00976. [Google Scholar] [CrossRef]
  19. Abiodun, Y.O.; Sadiq, O.M.; Adeosun, S.O.; Oyekan, G.L. Mineralogical Properties of Kaolin and Metakaolin from Selected Areas in Nigeria and Its Application to Concrete Production. West Indian J. Eng. 2019, 42, 57–64. Available online: https://sta.uwi.edu/eng/wije/vol4201_jul2019/documents/M0719019v42n1p576YOAbiodunJuly2019.pdf (accessed on 18 June 2022).
  20. Ilic, B.R.; Mitrovic, A.A.; Milicic, L.R. Thermal treatment of kaolin clay. Hem. Ind. 2010, 64, 351–356. [Google Scholar] [CrossRef]
  21. Biljana, R.; Alexandra, A.; Ljiljana, R. Thermal Treatment of Kaolin Clay to Obtain Metakaolin; Institute for Testing of Materials: Belgrade, Serbia, 2010; Volume 64, pp. 351–356. Available online: http://www.doiserbia.nb.rs/img/doi/0367-598x/2010/0367-598X1000014I.pdf (accessed on 21 June 2022).
  22. U.S. Geological Survey. Mineral Commodity Summaries 2020: U.S. Geological Survey, 2020. Available online: https://doi.org/10.3133/mcs2020 (accessed on 12 May 2022). [CrossRef]
  23. Yunsheng, Z.; Wei, S. Semi-empirical AM1 calculations on 6-memebered alumino-silicate rings model: Implications for dissolution process of metakaoline in alkaline solutions. J. Mater. Sci. 2007, 42, 3015–3023. [Google Scholar] [CrossRef]
  24. Yunsheng, Z.; Wei, S.; Zongjin, L.; Yantao, J. Study of polycondensation process of metakaolin-based geopolymeric cement using semi-empirical AM1 calculations. Adv. Cem. Res. 2009, 21, 67–73. [Google Scholar] [CrossRef]
  25. Gambo, S.; Ibrahim, K.; Aliyu, A.; Ibrahim, G.; Abdulsalam, H. Performance of metakaolin based concrete at elevated temperature. Niger. J. Technol. 2020, 9, 732–737. [Google Scholar] [CrossRef]
  26. Mohammed, M.H.; Mohammed, A.A. Using of metakaolin to produce colored geopolymer concrete. In Proceedings of the 3rd International Conference in Physical Science and Advanced Materials (PAM 2021), Istanbul, Turkey, 24–28 September 2021. J. Phys. Conf. Ser. 2021, 2114, 012018. [Google Scholar] [CrossRef]
  27. Abdelli, K.; Tahlaiti, M.; Belarbi, R.; Oudjit, M.N. Influence of the pozzolanic reactivity of the blast furnace slag and metakaolin on mortars. Energy Procedia 2017, 139, 224–229. [Google Scholar] [CrossRef]
  28. Adjei, S.; Elkatatny, S.; Ayranci, K. Effect of Elevated Temperatures on the Microstructure of Metakaolin—Based Geopolymer. ACS Omega 2022, 7, 10268–10276. [Google Scholar] [CrossRef]
  29. Energy Council. Efficient Use of Energy Utilizing High Technology: An Assessment of Energy Use in Industry and Buildings; World Energy Council: London, UK, 1995. [Google Scholar]
  30. Cahn, D.; Greer, W.; Mikols, E.; Moir, R. Atmospheric CO2 and the US cement industry. World Cement 1997, 28, 64–68. [Google Scholar]
  31. Canada Portland Cement Association. Cement, Concrete and Climate Change, 1993 CSCE/CPCA Structural Concrete Conference 19–21 May 1993; Toronto Hilton International: Toronto, ON, Canada, 1993. [Google Scholar]
  32. Okoye, F.N.; Durgaprasad, J.; Singh, N.B. Flyash/kaolin based Geopolymer Concretes and their mechanical properties. Const. Build. Mater. 2015, 98, 739–744. [Google Scholar] [CrossRef]
  33. Market Analysis Report. Limestone Market Size, Share & Trends Analysis Report by End-use. Advanced Materials 2018. Available online: https://www.grandviewresearch.com/industry-analysis/limestone-market (accessed on 2 June 2022).
  34. BDA. Brick Industry Sustainability. Available online: http://www.brick.org.uk/resources/brick-industry/sustainability/2010 (accessed on 17 June 2022).
  35. Worrell, E.; Galitsky, C. Energy Efficiency Improvement and Cost Saving Opportunities for Cement Making; Ernest Orlando Lawrence Berkeley National Laboratory, University of California: Berkeley, CA, USA, 2008. Available online: https://www.osti.gov/servlets/purl/927882 (accessed on 8 June 2022).
  36. Andrew, R.M.; Peters, G.P. The Global Carbon Project’s Fossil CO2 Emissions Dataset Zenodo 2021. Available online: https://doi.org/10.5281/zenodo.5569235 (accessed on 12 June 2022). [CrossRef]
  37. Rodionova, M.V.; Poudyal, R.S.; Tiwari, I.; Voloshin, R.A.; Zharmukhamedov, S.K.; Nam, H.G.; Zayadan, B.K.; Bruce, B.D.; Hou, H.J.M.; Allakhverdiev, S.I. Biofuel production: Challenges and opportunities. Int. J. Hydrog. Energy 2017, 42, 8450–8461. [Google Scholar] [CrossRef]
  38. Sayre, R. Microalgae: The Potential for Carbon Capture. BioScience 2010, 60, 722–727. [Google Scholar] [CrossRef]
  39. Lundgren, T.; Marklund, P.O. Economics of Biofuels: An Overview. In Encyclopedia of Energy, Natural Resource, and Environmental Economics; Shogren, J.F., Ed.; Elsevier: Waltham, MA, USA, 2013; pp. 184–187. [Google Scholar] [CrossRef]
  40. Medeiros, D.L.; Sales, E.A.; Kiperstok, A. Energy production from microalgae biomass: Carbon footprint and energy balance. J. Clean. Prod. Integr. Clean. Prod. Into Sustain. Strateg. 2015, 96, 493–500. [Google Scholar] [CrossRef]
  41. Ghasemi, Y.; Rasoul-Amini, S.; Naseri, A.T.; Montazeri-Najafabady, N.; Mobasher, M.A.; Dabbagh, F. Microalgae biofuel potentials (Review). Appl. Biochem. Microbiol. 2012, 48, 126–144. [Google Scholar] [CrossRef]
  42. Olofsson, M.; Lindehoff, E.; Frick, B.; Svensson, F.; Legrand, C. Baltic Sea microalgae transform cement flue gas into valuable biomass. Algal Res. 2015, 11, 227–233. [Google Scholar] [CrossRef] [Green Version]
  43. Iglina, T.; Iglin, P.; Pashchenko, D. Industrial CO2 Capture by Algae: A Review and Recent Advances. Sustainability 2022, 14, 3801. [Google Scholar] [CrossRef]
  44. Portillo, E.; Alonso-Farinas, B.; Vega, F.; Cano, M.; Navarrete, B. Alternatives for oxygen-selective membrane systems and their integration into the oxy-fuel combustion process: A review. Sep. Purif. Technol. 2019, 229, 115708. [Google Scholar] [CrossRef]
  45. Eveloy, V. Hybridization of solid oxide electrolysis-based power-to-methane with oxyfuel combustion and carbon dioxide utilization for energy storage. Renew. Sustain. Energy Rev. 2019, 108, 550–571. [Google Scholar] [CrossRef]
  46. Cau, G.; Tola, V.; Ferrara, F.; Porcu, A.; Pettinau, A. CO2 -free coal-fired power generation by partial oxy-fuel and post-combustion CO2 capture: Techno-economic analysis. Fuel 2018, 214, 423–435. [Google Scholar] [CrossRef]
  47. Shaddix, C.R.; Molina, A. Particle imaging of ignition and devolatilization of pulverized coal during oxy-fuel combustion. Proc. Combust. Inst. 2009, 32, 2091–2098. [Google Scholar] [CrossRef]
  48. Andersen, J.; Rasmussen, C.L.; Giselsson, T.; Glarborg, P. Global combustion mechanisms for use in CFD modeling under oxy-fuel conditions. Energy Fuel 2009, 23, 1379–1389. [Google Scholar] [CrossRef]
  49. Tran, K.Q.; Trinh, T.N.; Bach, Q.V. Development of a biomass torrefaction process integrated with oxy-fuel combustion. Bioresour. Technol. 2016, 199, 408–413. [Google Scholar] [CrossRef]
  50. Niu, S.B.; Chen, M.Q.; Li, Y.; Xue, F. Evaluation on the oxy-fuel combustion behavior of dried sewage sludge. Fuel 2016, 178, 129–138. [Google Scholar] [CrossRef]
  51. Huang, X.; Ai, N.; Li, L.; Jiang, Q.; Wang, Q.; Ren, J.; Wang, J. Simulation of CO2 Capture Process in Flue Gas from Oxy-Fuel Combustion Plant and Effects of Properties of Absorbent. Separations 2022, 9, 95. [Google Scholar] [CrossRef]
  52. BS 12390; Part 3: Testing Hardened Concrete: Compressive Strength of Test Specimens. British Standard Code of Practice, British Standards Institution: London, UK, 2009.
  53. Davidovits, J. Handbook of Geopolymer Chemistry and Applications; Geopolymer Institute Press: Saint-Quentin, France, 2008; Volume 2, pp. 277–278. [Google Scholar]
  54. BS 1881; Part 122: Testing Fresh Concrete: Method for Determination of Water Absorption. British Standard Code of Practice, British Standards Institution: London, UK, 1983.
  55. Abiodun, Y.O.; Sadiq, O.M.; Adeosun, S.O. Microstructural, mechanical and pozzolanic characteristics of metakaolin-based geopolymer. Geol. Geophys. Environ. 2020, 46, 57–69. [Google Scholar] [CrossRef]
  56. Ding, J.T.; Li, Z.J. Effects of metakaolin and silica fume on properties of concrete. ACI Mater. J. 2022, 99, 393–398. [Google Scholar]
  57. Lenka, S.; Panda, K.C. Effect of metakaolin on the properties of conventional and self compacting concrete. Adv. Concr. Constr. 2017, 5, 31–48. [Google Scholar] [CrossRef]
  58. Kostuch, J.A.; Walter, G.V.; Jones, T.R. High performance concretes containing metakaolin—A review. In Proceedings of the International Conference—Concrete, Dundee, Scotland, UK, 7–9 September 2000; Volume 2, pp. 1799–1811. [Google Scholar]
  59. Singh, B.; Ishwarya, G.; Gupta, M.; Bhattacharyya, S.K. Geopolymer concrete: A review of some recent developments. Constr. Build. Mater. 2015, 85, 78–90. [Google Scholar] [CrossRef]
  60. Yao, X.; Zhang, Z.; Zhu, H.; Chen, Y. Geopolymerization process of alkali-metakaolinite characterized by isothermal calorimetry. Thermochim. Acta 2009, 493, 49–54. [Google Scholar] [CrossRef]
  61. Rangan, V.B. Fly Ash-Based Geopolymer Concrete. In Proceedings of the International Workshop on Geopolymer Cement and Concrete, Villa Clara, Cuba, 23–30 June 2019; Allied Publishers Private Limited: Mumbai, India, 2010; pp. 68–106. [Google Scholar]
  62. Albidah, A.; Alghannam, M.; Abbas, H.; Almusallam, T.; Al-Salloum, Y. Characteristics of metakaolin-based geopolymer concrete for different mix design parameters. J. Mater. Res. Technol. 2021, 10, 84–98. [Google Scholar] [CrossRef]
  63. Shekarchi, M.; Bonakdar, A.; Bakhshi, M.; Mirdamadi, A.; Mobasher, B. Transport properties in metakaolin blended concrete. Constr. Build. Mater. 2010, 24, 2217–2223. [Google Scholar] [CrossRef]
  64. Ababneh, A.; Matalkah, F.; Aqel, R. Synthesis of kaolin-based alkali-activated cement: Carbon footprint, cost and energy assessment. J. Mater. Res. Technol. 2020, 9, 8367–8378. [Google Scholar] [CrossRef]
Figure 1. Major producers of kaolin.
Atmosphere 13 01494 g001
Figure 2. World carbon dioxide emissions [5].
Atmosphere 13 01494 g002
Figure 3. Cement–metakaolin concrete cubes.
Atmosphere 13 01494 g003
Figure 4. Materials used in production of metakaolin-based geopolymer concrete.
Atmosphere 13 01494 g004
Figure 5. SEM (a) kaolin (b) Metakaolin.
Atmosphere 13 01494 g005
Figure 6. (a) EDS kaolin; (b) EDS Metakaolin.
Atmosphere 13 01494 g006
Figure 7. XRD patterns of the (a) kaolin and (b) metakaolin samples.
Atmosphere 13 01494 g007
Figure 8. Workability of cement-metakaolin concrete.
Atmosphere 13 01494 g008
Figure 9. Compressive strength of cement-metakaolin concrete.
Atmosphere 13 01494 g009
Figure 10. Compressive strength of cement-metakaolin mortar.
Atmosphere 13 01494 g010
Figure 11. Compressive strength comparison of metakaolin-based geopolymer concrete and ordinary Portland cement concrete.
Atmosphere 13 01494 g011
Figure 12. Water absorption capacity of metakaolin-based geopolymer concrete and OPC concrete.
Atmosphere 13 01494 g012
Figure 13. (a1a3): Pareto charts of the standardized effects of the independent variables on the dependent variable; (b1b3) experimental data versus predicted. (a1) 1:1½:3; (b1) 1:1½:3; (a2) 1:2:4; (b2) 1:2:4; (a3) 1:1.1:2.6; (b3) 1:1.1:2.6.
Atmosphere 13 01494 g013
Table 1. Summary of how using alternative technology/materials in cement manufacturing results in lower CO2 emissions.
Processes/MaterialsAlternative TechnologyReduction in CO2 Emissions
Raw materialsCalcium carbide slag
Steel slag, calcareous oil shale
374 kg of CO2 per ton of clinker
60 kg of CO2 per ton of clinker
Cement productionFluidized bed kiln20–30 kg of CO2 per ton of product
Emerging supplementary cementitious materialsGeopolymer cement300 kg of CO2 per ton of product
Industrial recyclingCO2 from cement process converted into high-energy algae biomassIn order to create 1 ton of dry algae biomass, 1800 kg of CO2 will be used.
Fuel technologiesOxygen enrichment and oxy-fuel404–676 kg of CO2 per ton of cement
Post-combustion carbon captureabsorption690–725 kg of CO2 per ton of clinker
Table 2. Chemical composition test on kaolin and metakaolin samples.
Chemical OxidesKaolinMetakaolin
SiO248.5053.49
Al2O332.7539.90
Fe2O34.280.52
CaO1.080.12
MgO0.490.21
Na2O0.160.11
K2O1.480.53
SO3-0.01
LOI9.264.51
Table 3. Crystalline phases of kaolin.
Peaks at 2θCompound NameCrystal SystemFormulaReference Code
19.3814AnataseTetragonalTi4O896-900-8216
27.0007QuartzHexagonalSi3O696-901-3322
50.2894; 68.5130KaoliniteAnorthicAl2Si2O9H496-900-9235
Table 4. ANOVA for the compressive strengths of cement-metakaolin concrete.
Mix 1:1½:3
dfSSMSFSignificance Fp-value
Regression61420.058236.6763110.50785.33 × 10−26
% Replacement2422.34211.1798.5986 0.0000
Curing days2400.438200.1993.4718 0.0001
Water–cement ratio2597.28298.64139.440 0.0001
Residual47100.66062.141715
Total531520.719
Mix 1:2:4
Regression61079.384179.897483.994131.99 × 10−230.0000
% Replacement2425.98212.9999.4450 0.0004
Curing days2326.98163.4976.3340 0.0001
Water–cement ratio2326.424163.21276.2037 0.0001
Residual47100.66392.141785
Total531180.048
Mix 1:1.1:2.6
Regression6278.183746.3639556.344971.27 × 10−7
% Replacement2141.987770.9938557.51806 0.0001
Curing days246.99123.495519.0357 0.0001
Water–cement ratio289.20544.602536.1362 0.0001
Residual1316.045751.234288
Total19294.2294
Cement-Metakaolin mortar
Regression61403.341233.890185.776391.49×10-20
% Replacement2524.269262.134593.1347 0.0000
Curing days2277.707138.853550.9228 0.0000
Water–cement ratio2601.365300.6825110.272 0.0000
Residual38103.61622.726743
Total441506.957
Metakaolin-based geopolymer concrete
Regression4134.833333.70833187.26854.7424 × 10−20.0000
% Replacement269.25834.629192.38 0.0052
Curing days117.334317.334396.301 0.01023
Water–cement ratio148.24148.241268.006 0.0201
Residual20.360.18
Total6135.1933
Publisher’s Note: MDPI stays neutral with regard to jurisdictional claims in published maps and institutional affiliations.

