Abstract
Smallholder farmers in East and West Hararghe zones, Ethiopia frequently face problems of climate extremes. Knowledge of past and projected climate change and variability at local and regional scales can help develop adaptation measures. A study was therefore conducted to investigate the spatio-temporal dynamics of rainfall and temperature in the past (1988–2017) and projected periods of 2030 and 2050 under two Representative Concentration Pathways (RCP4.5 and RCP8.5) at selected stations in East and West Hararghe zones, Ethiopia. To detect the trends and magnitude of change Mann–Kendall test and Sen’s slope estimator were employed, respectively. The result of the study indicated that for the last three decades annual and seasonal and monthly rainfall showed high variability but the changes are not statistically significant. On the other hand, the minimum temperature of the ‘Belg’ season showed a significant (p < 0.05) increment. The mean annual minimum temperature is projected to increase by 0.34 °C and 2.52 °C for 2030, and 0.41 °C and 4.15 °C for 2050 under RCP4.5 and RCP8.5, respectively. Additionally, the mean maximum temperature is projected to change by −0.02 °C and 1.14 °C for 2030, and 0.54 °C and 1.87 °C for 2050 under RCP4.5 and RCP 8.5, respectively. Annual rainfall amount is also projected to increase by 2.5% and 29% for 2030, and 12% and 32% for 2050 under RCP4.5 and RCP 8.5, respectively. Hence, it is concluded that there was an increasing trend in the Belg season minimum temperature. A significant increasing trend in rainfall and temperature are projected compared to the baseline period for most of the districts studied. This implies a need to design climate-smart crop and livestock production strategies, as well as an early warning system to counter the drastic effects of climate change and variability on agricultural production and farmers’ livelihood in the region.
1. Introduction
Anthropogenic warming has reached approximately 1 °C above the pre-industrial level, and if the current rate continues, it is likely to reach 1.5 °C between 2030 and 2052 [1]. In Africa, precipitation and temperature have shown declining and increasing trends, respectively [2]. In Ethiopia, mean annual temperature has risen by 1.3 °C between 1960 and 2006 and is projected to increase up to 1.8 °C by 2050s and 3.7 °C by the end of the century, under a high-emission scenario (RCP8.5). However, a high level of spatial-temporal variability and uncertainty in precipitation was observed and projected in the future [3,4]. This could cause various threats to agriculture, health, water supply, livelihoods, and economic growth [5].
Rainfall and temperatures are the most fundamental climate parameters that determine the environmental condition of a particular region [6,7]. A small mean change in those climate parameters threatens food production, especially in low-income and agriculture-based economies [8,9]. In Ethiopia, rainfall and temperature change and variability are expected to have adverse impacts on agriculture and food security [10]. In the past, the country faced unpredictable rain in some years and complete failure of seasonal rain in another that is linked to climate variability [11]. For instance, in 1983/84 main rainfall season failure resulted in a reduction of the GDP by 9.7% and agricultural outputs by 21%, also in 2015/16 10 million and in 2017 5 million people were food insecure as a result of El Nino induced drought and by 2045 the country’s GDP is expected to reduce by 10% due to climate change [12].
In the East and West Hararghe zones, Ethiopia has been affected by the impact of climate change-induced drought, erratic and rainfall reduction, and increasing temperature [13,14]. Reference [15] indicated that eastern and southeastern parts of Ethiopia were severely affected by recurrent droughts, erratic rainfall, and increasing temperature conditions between 1981–2009. February to May (Belg) rainy season was lower than the mean by rainfall amount in the region was up to 60%. As a result, cereal yield was estimated to be below average, with crop failures reported in some areas [16].
Few studies have been conducted on the past trend of rainfall and temperature in Ethiopia. For instance [17], one of the semi-arid areas (Mekelle, Northern Ethiopia) between 1980–2010 showed an increasing trend in minimum temperature for October through January while there were non-significant trends in maximum temperature for the Belg season (April to June) and annual rainfall. Reference [18] also reported annual mean temperature increasing trend and rainfall decreasing trends in Chiro district between 1980–2010. A study by [19] stated that annual rainfall showed high variability and minimum and maximum temperatures an increasing trend in Mieso area, eastern Ethiopia between 1974–2009.
Regarding the predicted temperature change, a similar result was obtained but the results differed for rainfall. However, prediction results depend on emission scenarios, climate models and local conditions [20]. A study by [21] in the Central Rift Valley of Ethiopia reported a mean annual rainfall change of −40% to +10% and a temperature increase by 1.4–4.1 °C in 2080. Reference [22] also reported an increase in mean maximum and minimum temperature ranging from 1.55–6.07 °C and 0.11–2.81 °C, respectively, in northwestern Ethiopia in the 2080s compared to the base period considered (1979–2008). Reference [4] also reported that the eastern part of Ethiopia is often hit hardby severe droughts.
The research studies conducted so far in various regions of the country, including the eastern part, focused on past climate change and variability. However, there is a need to analyze projected climate change/variability to design and implement climate change adaptation strategies that could improve the resilience of farmers for the long term change. Therefore, temperature and rainfall trend analysis in the eastern region of Ethiopia can help to trace the extent and magnitude of climate change and variability and to incorporate climate information into long-term planning. It was hypothesized that rainfall and temperature changes varied for the past three decades and are projected to vary in the future. This study, therefore, analyzed past and projected trends of rainfall and temperature parameters in Eastern and Western Hararghe zones, Ethiopia.
2. Methodology
2.1. Description of the Study Area
The study was conducted in East and West Hararghe zones, Ethiopia. In the region, five stations—namely: Haramaya, Chiro, Gursum, Badessa, and Mieso—which are located in Oromia Regional State were selected for the study (Figure 1). The region receives bi-modal rainfalls that include Belg rainy season from February to May and Kiremit rainy season from June to September. The altitude of the study area ranges from 500–3600 m above sea level. The wide range of agro-climatic zone of the region allowed the production of different types of crops including, cereals, legumes, oilseed, vegetables, fruits, and cash crops such as coffee (Coffee arabical L.) and khat (Catha edulis Forsk) [23].
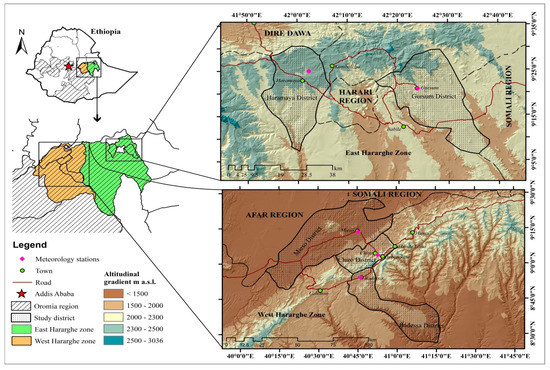
Figure 1.
Location map of the study districts.
2.2. Data Sources
Daily rainfall and temperature data from 1988–2017 for 16 stations were obtained from the National Meteorological Agency (NMA) of Ethiopia. Among the 16 stations, only five of them—namely: Haramaya, Gursum, Chiro, Badessa, and Mieso—were selected based on a relatively long period of the data records, less than 10% missing value, and having the required climate parameters data as suggested by [24] (Table 1). The World Meteorological Organization has recommended 30 years as the minimum data required for searching evidence of climatic change in hydro-climatic time series [25].

Table 1.
Characteristics of stations for recorded rainfall and temperature data in East and West Hararghe zones, Ethiopia.
2.3. Data Quality Assessment
2.3.1. Outlier Detection
The Tukey fence was used to screen outliers greater or less than a threshold value that can affect the detection of inhomogeneity [26]. The range is corresponding to
where, Q1 and Q3 are, the lower and upper quartile points, respectively and IQR is the interquartile range. 1.5 is the constant valueand the outliers are set to the limit value corresponding to ±1.5 × IQR.
2.3.2. Homogeneity Test
A cumulative deviation test was used to detect inhomogeneity in meteorological time series [26]. Reference [27] noted that tests for homogeneity can be based on the adjusted partial sums or cumulative deviations from the mean and it is given as
The partial sum of the given series ( will fluctuate around zero if there is no systematic deviation of the values with respect to their mean. On the other hand, the value of could be positive or negative if a break is present near the year k. The rescaled adjusted partial sum is obtained by dividing the difference between the maximum and the minimum of the values by the sample standard deviation and given as
The critical value R/, was suggested by [27] and for n = 30 a value of 1.5, and 1.4 for 5%, and 10% probability level, respectively.
2.3.3. Test of Randomness and Persistence
The time-series data were tested for randomness and independence using the autocorrelation function (r1) as described in
where, is an observation, is the following observation, is the mean of the time series, and n is the number of data [28]. The autocorrelation coefficient value of was tested against the null hypothesis at a 95% confidence interval, using a two-tailed test
For the data series that showed significant correlation, a pre-whitened method was followed based on the procedure described by [29], which was obtained as: where are data points of the series. Outlier detection, homogenization, and autocorrelation tests were done using XLSTAT statistical software.
2.4. Analytical Procedure
To fill the missing value following the Markov chain model and summarize past daily rainfall and temperature data into annual, seasonal, and month on a regional and local level INSTAT software version 3.37 were used [30]. It is statistical package that includes a range of facilities to simplify the processing of climate data.
2.4.1. Trend Analysis
Mann–Kendall Trend Test
To assess the trend in rainfall and temperature data Mann–Kendall trend test was applied [31,32]. A Mann–Kendall test is a non-parametric approach, which is less sensitive to outliers and tests for a trend of climatic elements without specifying whether the trend is linear or non-linear and widely applied in various trend detection studies [33,34]. Mann–Kendall’s test statistic is given as
The sign function is given as
where S is the Mann–Kendal’s test statistics; and are the sequential data values of the time series in the years i and j (j > i) and N is the length of the time series. A positive S value indicates an increasing trend and a negative value indicates a decreasing trend in the data series. The variance of S, for the situation where there may be ties (i.e., equal values) in the x values, is given by
where m is the number of tied groups in the data set and is the number of data points in the tied group. For n larger than 10, approximates the standard normal distribution and computed as
The presence of a statistically significant trend will be evaluated using the value. In a two-sided test for trend, the null hypothesis Ho should be accepted if at a given level of significance. is the critical value of from the standard normal table—e.g., for 5% significance level, the value of is 1.96.
Sen’s Slope Estimator Test
The non-parametric method described by [35] was also used to estimate the magnitude of trends in the data time series. The slope of “n” pairs of data estimated by using the following formula
where is Sen’s slope estimator, and data value at time j and i, (j > i), respectively. The “n” values of are ranked from the smallest to largest and the median of “n” values of is Sen’s slope which is given as
A negative value represents a decreasing trend; a positive value represents an increasing trend over time.
2.4.2. Variability analysis
The Coefficient of Variation (CV%)
The coefficient of variation is used to evaluate the variability of rainfall data relative to its standard deviation and is normally presented as a percentage [36]
where is the coefficient of variation; is the standard deviation and long term mean rainfall. According to [37] the values of CV (<20) consider less variable, (20–30) moderately variable, and (>30) highly variable.
Rainfall Anomaly and Precipitation Concentration Index
Rainfall anomaly index is used to analyze the frequency and intensity of the dry and wet years in the past, and calculated as the difference between the annual total of a particular year and the long-term average rainfall records and divided by the standered deviation of the long-term data. Positive rainfall anomalies indicate greater than long-term mean rainfall (wet year), while negative rainfall anomalies are less than long-term mean rainfall (dry year). Precipitation concentration index is used to describe the monthly rainfall distribution, and values of less than 10 indicate the uniform monthly distribution of rainfall, between 11–20 indicate high concentration and above 21 indicate very high concentration. In this study, the rainfall anomaly and precipitation concentration index were calculated using precintcon package in R software.
2.5. Future Climate Projection
General circulation models (GCMs) are the most widely used model to simulate local climate trends relative to global scale [38] through the production of climate scenarios and time horizons. For this study, future projected climate data of rainfall and temperature for the near future and mid-century were explored and analyzed based on downscaled products from CMIP5 (Coupled Model Inter-comparison Project Phase 5) dataset, from 17 general circulation models (GCMs) under RCP4.5 and 8.5 using MarkSim weather generator [39] which have been statistically bias-corrected. In this study, both concentration pathways from 17 GCM in 2030 and 2050 were analyzed for five stations of East and West Hararghe zones, Ethiopia (Table 2). To summarize projected daily rainfall and temperature data into annual, seasonal, and monthly INSTAT software version 3.37 were used [30]. The t-test was also conducted on projected data to estimate rainfall and temperature change and compare with the historical observed data.
Table 2.
Description of selected 17 global climate models (GCMs) from Coupled Model Inter-comparison Project Phase 5 (CMIP5).
3. Results and Discussion
3.1. Past Rainfall Trend at the Local and Regional Level
The result of annual rainfall total indicated that 2002 was the driest year and 2010 was the wettest year over the 1988–2017 period in East and West Hararghe zones, Ethiopia. The main rainy season (‘Kiremit’) contributed more than 50% to the annual rainfall totals followed by Belg season. Concerning the monthly rainfall, July, August, and September contributed lion’s share to the annual rainfall total (Table 3). The months of December, January, and November were considered as the driest months with the least contribution to the annual rainfall total. This is due to the fact that the main rainy season in East and West Hararghe zones, Ethiopia is from June to September followed by Belg season from February to May. Consistent with this result, Reference [53] reported that Kiremit and Belg rainfall had contributed largely to the annual rainfall totals in northern highlands of Ethiopia between 1983–2014. The results also corroborate the findings of [54] who reported the maximum contribution of August and July followed by September to the annual rainfall from 1981–2017 in Amhara region.
Table 3.
Descriptive statistics and Mann–Kendall test of rainfall total in East and West Hararghe zones, Ethiopia (from 1988–2017).
The result of the Mann–Kendall test revealed that trend of annual and seasonal mean rainfall in the region was not statistically significant. With regards to monthly mean rainfall, February and March showed a significant (p < 0.05) decreasing change. In East and West Hararghe zones, Ethiopia, in February the Belg season begins followed by March therefore significant decreasing trend in mean rainfall of those months may have affected livestock and Belg season crop production. Consistent with the result of this study, Reference [55] reported an insignificant trend in both annual and seasonal rainfall totals from 1979–2013 in the northern and south-western regions of Ethiopia. Consistent with this, Reference [14] reported that over 20% of the East and West Hararghe Zones are Belg rain-dependent.
The coefficient of variation result of annual and seasonal rainfall showed high variability especially in Belg season (CV > 30%) in East and West Hararghe zones, Ethiopia (Table 3 and Figure 2). The highest monthly rainfall variability was observed in January, February, November, and December (CV > 100%). Consistent with this result, Reference [18] reported that Kiremit and annual rainfall was less variable than Belg rainfall between 1980 and 2010 in Chiro district, East and West Hararghe zones, Ethiopia. Similarly, Reference [56] indicated that Belg season is characterized by significant inter and intra-seasonal variability in various regions of Ethiopia. A study by [54] also showed high variability in seasonal rainfall which caused droughts and floods over different years in the Amhara Regional State between 1981–2017. Reference [57] stated that the movement and intensity of the African Inter Tropical Convergent Zone (ITCZ) varies year after year, causing inter annual variability of seasonal rainfall over Ethiopia.
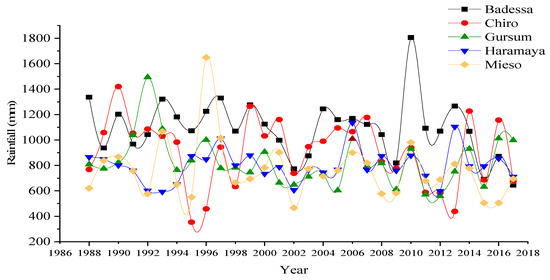
Figure 2.
Long-term mean annual rainfall variability across districts in East and West Hararghe zones, Ethiopia for the period (1988–2017).
3.2. Rainfall Variability
3.2.1. Precipitation Concentration Index
Analysis of precipitation concentration index (PCI) values revealed that all study districts have recorded a 10–20% mean annual index, which indicates a high concentration of rainfall. Additionally, the trend of the PCI index of Gursum and Haramaya district showed a significant difference at p < 0.05 (Table 4). The high rainfall concentration, as well as undulating and rugged topography of the area, may lead to soil erosion, waterlogging, soil fertility and yield reduction, etc. Consistent with this result, Reference [58] reported a high and irregular concentration of annual rainfall in the period between 1900–2014 in the northeastern highlands of Ethiopia. Furthermore, Reference [59] reported high PCI values in the central highlands of Ethiopia and more intense rainfall and runoff, soil erosion, and waterlogging conditions which affect cereal production and food security.
Table 4.
Descriptive statistics and Mann–Kendall test of rainfall anomaly and rainfall concentration index in East and West Hararghe zones, Ethiopia (from 1988–2017).
3.2.2. Rainfall Anomaly Index(RAI)
The result of annual negative rainfall anomalies during the periods between 1988–2017 in selected districts of East and West Hararghe zones, Ethiopia showed a minimum of 40% (in Chiro) and a maximum of 63% (in Gursum) index(Table 4). Annual negative anomaly exceeded that of a positive anomaly in all districts except in Chiro there was also high variability, a dry year was followed by another two or three dry years, then replaced by wet years. The frequency of negative anomalies in the study area increased since the early 2000s especially in Gursum and Haramaya districts (Figure 3). However, the Mann–Kendall trend test indicated that the rainfall anomy index of the district showed a non-significant change.
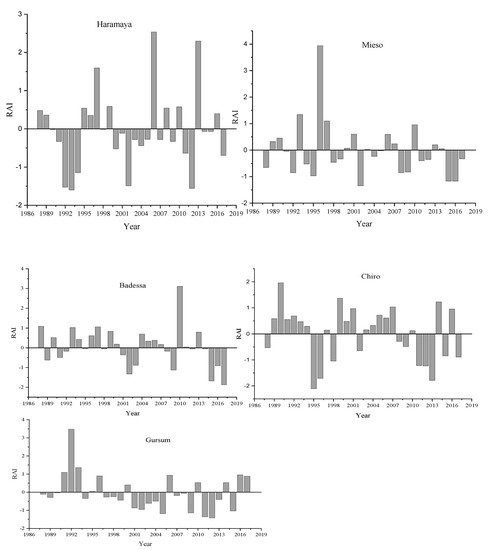
Figure 3.
Annual rainfall anomaly index of the study districts in East and West Hararghe zones, Ethiopia for the period (1988–2017).
The result implies that due to more years of drought crop production and food security conditions of the region have been affected. Consistent with this result [60] reported that East and West Hararghe are recurrently affected by below-average rainfall resulting in drought and over a million people relying on emergency relief assistance. Additionally, Reference [61] reported that in the East and West Hararghe zones, Ethiopia is a food deficit area due to change and variability in rainfall and temperature.
3.3. Past Minimum and Maximum Temperature Trends
The mean annual minimum and maximum temperature in the region for the last 30 years was 12.8 °C and 27.2 °C, respectively. The higher mean minimum temperature was recorded in Kiremit than Belg season while it was the opposite for maximum temperatures (Table 5 and Table 6). A high variability compared with maximum temperature was showed in coefficient of variation of mean annual, season, and monthly minimum temperature (Figure 4). Similarly, Reference [62] stated that coefficient variation is much higher for minimum temperature than the maximum temperature in all study districts of western Amhara, Ethiopia between 1979–2008.
Table 5.
Descriptive statistics and Mann–Kendall trend test result for annual, seasonal, and monthly minimum temperature (°C) (from 1988–2017) in East and West Hararghe zones, Ethiopia.
Table 6.
Descriptive statistics and Mann–Kendall test results for annual, seasonal, and monthly maximum temperature (°C) (from 1988–2017) in East and West Hararghe zones, Ethiopia.
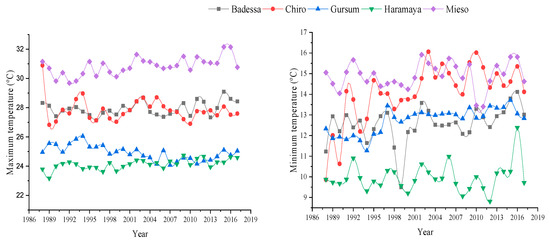
Figure 4.
Long-term mean annual maximum and minimum temperature variability across districts from 1988–2017 in East and West Hararghe zones, Ethiopia.
The Mann–Kendall trend of annual, Belg and Kiremit season minimum and maximum temperature showed an increasing trend. Regarding monthly minimum temperature, except for January, all months showed an increasing trend and August, September, and November were significant (p < 0.05) (Table 5). On the other hand, monthly maximum temperature showed decreasing and increasing trends; however, none of those were significant. In line with this result, Reference [63] stated that a non-significant warming trend of minimum temperature was observed during annual and Kiremit season between 1985–2019 in north East Ethiopia.
Significant increasing trends of mean minimum temperature especially in the main growing season, might have affected crop growth and development as well as yield across the district in East and West Hararghe zones, Ethiopia. This is because the high temperature during crop growing season leads to greater evapo-transpiration resulting in more water demand for the crops. This result is consistent with [64] who explained that high temperature affects many cellular processes related to plant growth and development, which is directly related to a decrease in photosynthetic efficiency and finally crop yield. An increase in temperature also results in a shift from using long-duration cultivars to the short maturing ones, which have lower yield potential [65].
3.4. Projected Temperature and Rainfall in East and West Hararghe Zones, Ethiopia
3.4.1. Minimum and Maximum Temperature
All the 17 models showed a similar change in projected annual, seasonal, and monthly mean maximum and minimum temperature. The t-test results also showed a significant change compared to baseline mean maximum and minimum temperature with respect to the time period and emission scenarios in the study districts (Table 7, Figure 5 and Figure 6).
Table 7.
Projected rainfall and temperature change and variability across stations in East and West Hararghe zones, Ethiopia.
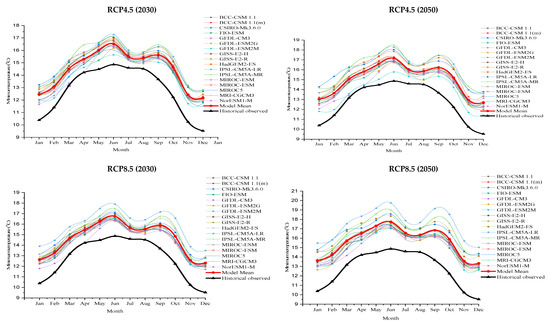
Figure 5.
Minimum temperature of 17 global climate models (GCMs), mean and historical observed (1988–2017) of five stations in East and West Hararghe zones, Ethiopia.
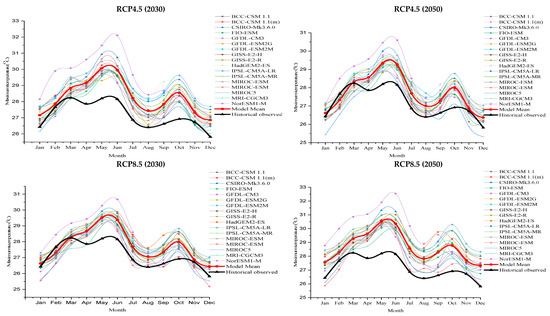
Figure 6.
Maximum temperature of 17 global climate models (GCMs), mean and historical observed (1988–2017) of five stations in East and West Hararghe zones, Ethiopia.
The annual mean minimum temperature is projected to increase by 0.34 °C and 2.52 °C for 2030, and by 0.41 °C and 4.15 °C for 2050 under RCP4.5 and 8.5, respectively in the study location. The lowest annual mean minimum temperature (0.34 °C) is projected in Gursum district by 2030s under RCP4.5 and the highest (4.15 °C) by 2050s under RCP8.5 in Haramaya district. The t-test results of the mean minimum temperature in all study districts under RCP4.5 and RCP8.5 and study period except in Chiro district under RCP4.5 significantly increased from the baseline period. In agreement with this result, Reference [66] reported that the mean minimum temperature in the 2050s will be expected to increase by 1.8 °C to 2.1 °C from the 1980−2009 baseline period under RCP4.5 and RCP8.5, respectively, in the sub-Humid Region of Uganda.
Meanwhile, a rise in the mean maximum temperature was projected by −0.02 °C and 1.14 °C for 2030, and by 0.54 °C and 1.87 °C for the 2050s under RCP4.5 and 8.5, respectively in the study area. In all the study districts, except Chiro, by 2030s under both RCP mean maximum temperature is projected to increase in eastern regions of Ethiopia. Similarly, Reference [4] reported a temperature increase across all emission scenarios in Ethiopia throughout the end of the 20th century. Reference [2] also reported for the mid-range emission scenario, the mean annual temperature will increase in the range of 0.9–1.1 °C by 2030, in the range of 1.7–2.1 °C by 2050 over Ethiopia compared to 1961–1990. Reference [67] reported that an increase in temperature may cause a decrease in yield between 2.5% and 10% across several agronomic species throughout the 21st century.
3.4.2. Rainfall
The annual, seasonal, and monthly rainfall total from 17 GCMs are projected to change by −2.4% and 29.1% for 2030, and by 3.5% and 32% for 2050 under RCP4.5 and RCP8.5, respectively (Table 7 and Figure 7). A non-significant (p > 0.05) change of total annual rainfall is projected in Badessa and Gursum under both RCP and periods. In contrast, for both RCPs and projection periods, total annual rainfall is projected to change significantly compared to the baseline period for the rest of the studied district.
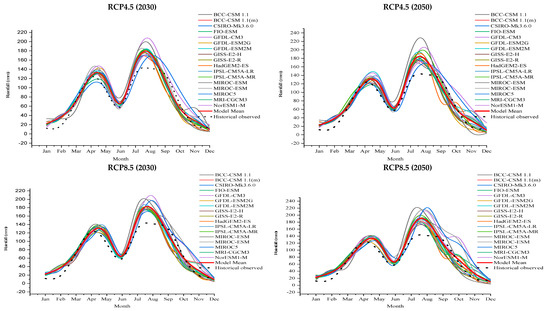
Figure 7.
Rainfall of 17 global climate models (GCMs), mean and historical observed (1988–2017) of five stations in East and West Hararghe zones, Ethiopia.
Spatiotemporal variability within and between locations was projected. The prediction result of all of the locations indicated that the increase in total annual rainfall by 2050s will be higher as compared to the increase by 2030s as well as under RCP8.5 than RCP4.5 in the region. Consistent with this result, Reference [68] reported a logical increase of rainfall in all future periods by 14.5% and an increase in mean annual streamflow by 4.7% by 2050s. According to the report of [69], rainfall for all RCPs was projected to increase by 4% to 12% by 2100 compared to the 1975–2005 baseline based on the ensemble-based average percentage change over Ethiopia.
4. Conclusions
Past and projected rainfall and temperature change and variability have been analyzed at the local and regional levels in East and West Hararghe zones, Ethiopia. The results of the study indicated that the mean annual minimum temperature of Belg season was significantly increased in the last 30 years. On the other hand, the change in mean annual and seasonal rainfall total and temperature for the period 1988–2017 was not statistically significant. Projected annual, seasonal, and monthly trends showed a rise in rainfall, and minimum and maximum temperature under RCP4.5 and RCP8.5 by 2030 and 2050 in most of the districts. From the near future period of the 2030s, under RCP4.5, it is evident that minimum temperature and rainfall showed a non-significant difference in some of the studied districts; however, it is changed under RCP8.5 by 2050s. The result of this study indicated that past rainfall and Belg minimum temperature have shown variability and increasing trend, respectively. Both rainfall and temperature projected a significant change compared to the baseline period. Therefore, the variability and change may have affected food production in the region. Hence, the application of this study’s outputs will help not only to understand the past climate in the region, but also to see the future change to undertake climate-smart adaptation options. It is recommended that future research should focus on the impact of temperature and rainfall change and variability on crop production.
Author Contributions
H.T. worked on data collection, data analysis, and writing—original draft; K.T., N.D., T.T. and M.H. helped in result interpretation and write-up. All authors have read and agreed to the published version of the manuscript.
Funding
Africa Center of Excellence for Climate Smart Agriculture and Biodiversity Conservation, Haramaya University, Ethiopia. The research is part of PhD study.
Institutional Review Board Statement
Not applicable.
Informed Consent Statement
Not applicable.
Data Availability Statement
Not applicable to this article as there is no data that were generated.
Acknowledgments
The authors thank the Ethiopian National Meteorological Agency (ENMA) and http://gismap.ciat.cgiar.org/MarkSimGCM/ (accessed on 1 June 2021). for providing past and future climate data, respectively of the study districts free of charge.
Conflicts of Interest
The authors declare no conflict of interest.
References
- IPCC (Intergovernmental Panel on Climate Change). Summary for Policymakers. In Global Warming of 1.5 °C: An IPCC Special Report on the Impacts of Global Warming of 1.5 °C above Pre-Industrial Levels and Related Global Greenhouse Gas Emission Pathways, in the Context of Strengthening the Global Response to the Threat of Climate Change, Sustainable Development, and Efforts to Eradicate Poverty; Masson-Delmotte, V., Zhai, P., Pörtner, H.O., Roberts, D., Skea, J., Shukla, P.R., Pirani, A., Moufouma-Okia, W., Péan, C., Pidcock, R., et al., Eds.; Press Cambridge: Cambridge, UK; New York, NY, USA, 2018; p. 24. [Google Scholar]
- IPCC (Intergovernmental Panel on Climate Change). Climate Change: Impacts, Adaptation, and Vulnerability: Part A: Global and Sectoral Aspects: Contribution of Working Group II to the Fifth Assessment Report of the Intergovernmental Panel on Climate Change; Field, C.B., Barros, V.R., Dokken, D.J., Mach, K.J., Mastrandrea, M.D., Bilir, T.E., Chatterjee, M., Ebi, K.L., Estrada, Y.O., Genova, R.C., et al., Eds.; Cambridge University Press: Cambridge, UK; New York, NY, USA, 2014; p. 1132. [Google Scholar]
- Haileab, Z. Climate Change in Ethiopia: Impacts, Mitigation and Adaptation. Int. J. Res. Environ. Stud. 2018, 2, 66–84. [Google Scholar] [CrossRef]
- World Bank Group. Climate Risk Profile: Ethiopia; World Bank Group: Washington, DC, USA, 2020; p. 24. [Google Scholar]
- Liu, Y.; Liu, R.; Shiu, S.C.; Li, C.J.; Zhang, J. Trend of Regional Precipitation and Their Control Mechanisms during 1979–2013. Adv. Atmos. Sci. 2016, 33, 164–174. [Google Scholar] [CrossRef]
- Kumar, R.; Gautam, H.R. Climate Change and its Impact on Agricultural Productivity in India. Climatology and Weather Forecasting. J. Clim. Weather Forecast. 2014, 2, 109. [Google Scholar] [CrossRef]
- Panda, A.; Sahu, N. Trend Analysis of Seasonal Rainfall and Temperature Pattern in Kalahandi, Bolangir and Koraput districts of Odisha, India. Atmos. Sci. Lett. 2019, 20, e932. [Google Scholar] [CrossRef]
- Tesfaye, S.; Taye, G.; Birhane, E.; van der Zee, S.E. Observed and model-simulated twenty-first-century hydro-climatic change of Northern Ethiopia. J. Hydrol. Reg. Stud. 2019, 22, 100595. [Google Scholar] [CrossRef]
- Taye, M.; Simane, B.; Zaitchik, B.F.; Selassie, Y.G.; Setegn, S. Rainfall Variability across the Agro-Climatic Zones of a Tropical Highland: The Case of the Jema Watershed, Northwestern Ethiopia. Environments 2019, 6, 118. [Google Scholar] [CrossRef]
- Mekonnen, Z.; Woldeamanuel, T.; Kassa, H. Socio-ecological Vulnerability to Climate Change/Variability in Central Rift Valley, Ethiopia. Adv. Clim. Chang. Res. 2019, 10, 9–20. [Google Scholar] [CrossRef]
- Ministry of Foreign Affairs of the Netherland. Climate Change Profile Ethiopia; Ministry of Foreign Affairs: Hague, The Netherland, 2018. [Google Scholar]
- USAID. Climate Change Risk in Ethiopia: Country Fact Sheet; USAID: Washington, DC, USA, 2016. [Google Scholar]
- Shumetie, A.; Alemayehu, M. Effect of Climate Variability on Crop Income and Indigenous Adaptation Strategies of Households. Int. J. Clim. Chang. Strateg. Manag. 2018, 10, 580–595. [Google Scholar] [CrossRef]
- WFP (World Food Program). Ethiopia Food Security Outlook; WFP: Rome, Italy, 2019. [Google Scholar]
- Mulugeta, M.; Tolossa, D.; Abebe, G. Description of Long-term Climate Data in Eastern and Southeastern Ethiopia. Data Br. 2017, 12, 26–36. [Google Scholar] [CrossRef]
- FAO (Food and Agriculture Organization). Cereal Supply and Demand Brief Diminishing Maize Production Prospects in the United States Dampen the Global Cereal Production Outlook This Year; FAO: Rome, Italy, 2019; pp. 3–5. [Google Scholar]
- Girmay, A. Spatiotemporal Climate Change Trend and Adaptation Through Environmental Rehabilitation in Ethiopia. In Proceedings of the Conference: International Conference on SLM and Watershed Management (SLMWM), Beijing, China, 21–23 October 2013; pp. 1–19. Available online: https://www.researchgate.net/publication/283014124 (accessed on 10 October 2020).
- Sorech, E.M. Trend Analysis and Challenges of Adaptations to Climate Change in Hararghe, Ethiopia. Environ. Pollut. Clim. Chang. 2017, 1, 1–6. [Google Scholar] [CrossRef]
- Tamiru, S.; Tesfaye, K.; Mamo, G. Analysis of Rainfall and Temperature Variability to Guide Sorghum (Sorghum Bicolar) Production in Miesso Areas, Eastern Ethiopia. Int. J. Sustain. Agric. Res. 2015, 2, 1–11. [Google Scholar] [CrossRef][Green Version]
- Hegerl, G.C.; Zwiers, F.W.; Braconnot, P.; Gillett, N.P.; Luo, Y.; Marengo Orsini, J.A.; Nicholls, N.; Penner, J.E.; Stott, P.A. Understanding and Attributing Climate Change. In Climate Change 2007: The Physical Science Basis. Contribution of Working Group I to the Fourth Assessment Report of the Intergovernmental Panel on Climate Change; Solomon, S., Qin, D., Manning, M., Chen, Z., Marquis, M., Averyt, K.B., Tignor, M., Miller, H.L., Eds.; Cambridge University Press: Cambridge, UK; New York, NY, USA, 2007; pp. 664–746. [Google Scholar]
- Kassie, B.T.; Rötter, R.P.; Hengsdijk, H.; Asseng, S.; Van Ittersum, K.H.; Van Keulen, H. Climate variability and change in the Central Rift Valley of Ethiopia: Challenges for Rainfed Crop Production. J. Agric. Sci. 2014, 152, 58–74. [Google Scholar] [CrossRef]
- Ayalew, D.; Tesfaye, K.; Mamo, G.; Yitaferu, B.; Bayu, W. Outlook of future climate in northwestern Ethiopia. Agric. Sci. 2012, 3, 608–624. [Google Scholar] [CrossRef]
- Tessema, Y.A.; Aweke, C.S.; Endris, G.S. Understanding the Process of Adaptation to Climate Change by Smallholder Farmers: The case of east Hararghe Zone, Ethiopia. Agric. Food Econ. 2013, 1, 13. [Google Scholar] [CrossRef]
- Seleshi, Y.; Zanke, U. Recent Changes in Rainfall and Rainy days in Ethiopia. Int. J. Clim. 2004, 24, 973–983. [Google Scholar] [CrossRef]
- IPCC (Intergovernmental Panel on Climate Change). IPCC Special Report; IPCC: Geneva, Switzerland, 1999. [Google Scholar]
- Ngongondo, C.S.; Lena, C.X.; Alemaw, B.; Chirwa, T. Regional Frequency Analysis of Rainfall Extremes in Southern Malawi using the Index Rainfall and L-moments Approaches. Stoch. Environ. Res. Risk Assess. 2011, 25, 939–955. [Google Scholar] [CrossRef]
- Buishand, T.A. Some Methods for Testing the Homogeneity of Rainfall Records. J. Hydrol. 1882, 58, 11–27. [Google Scholar] [CrossRef]
- Storch, H. Misuses of Statistical Analysis in Climate Research. In Analysis of Climate Variability; Von Storch, H., Navarra, A., Eds.; Springer: Berlin/Heidelberg, Germany, 1995. [Google Scholar] [CrossRef]
- Partal, T.; Kahya, E. Trend analysis in Turkish precipitation data. Hydrol. Process. 2006, 20, 2011–2026. [Google Scholar] [CrossRef]
- Stern, R.; Rijks, D.; Dale, I.; Knock, J. Instat Climatic Guide; University of Reading: Reading, UK, 2006. [Google Scholar]
- Mann, H.B. Nonparametric Tests Against Trend. J. Econom. Soc. 1945, 13, 245–259. [Google Scholar] [CrossRef]
- Kendall, M.G. Rank Correlation Methods, 4th ed.; Charles Griffin: London, UK, 1975. [Google Scholar]
- Asfaw, A.; Simane, B.; Hassen, A.; Bantider, A. Variability and Time Series Trend Analysis of Rainfall and Temperature in North-Central Ethiopia: A case study in Woleka sub-basin. Weather Clim. Extrem. 2018, 19, 29–41. [Google Scholar] [CrossRef]
- Ketema, A.; Siddaramaiah, D.G. Trend and Variability of Hydrometeorological Variables of Tikur Wuha Watershed in Ethiopia. Arab. J. Geosci. 2020, 13, 142. [Google Scholar] [CrossRef]
- Sen, P.K. Estimates of the Regression Coefficient Based on Kendall’s Tau. J. Am. Stat. Assoc. 1968, 63, 1379–1389. [Google Scholar] [CrossRef]
- Canchola, J.A.; Tang, S.; Hemyari, P.; Paxinos, E.; Marins, E. Correct use of per cent coefficient of variation (% CV) formula for log-transformed data. MOJ Proteom. Bioinform. 2017, 6, 316–317. [Google Scholar] [CrossRef]
- Hare, W. Assessment of Knowledge on Impacts of Climate Change-Contribution to the Specification of Art. 2 of the UNFCCC: Impact on Ecosystem, Food Production, Water and Socio-economic System. Potsdam, Berlin, 2003. Available online: https://www.researchgate.net/publication/242460387 (accessed on 20 September 2020).
- Sachindra, D.A.; Huang, F.; Barton, A.; Perera, B.J. Statistical downscaling of general circulation model outputs to precipitation part 2: Bias-correction and future. Int. J. Climatol. 2014, 34, 3282–3303. [Google Scholar] [CrossRef]
- Jones, P.G.; Thornton, P.K. Generating Downscaled Weather Data from a Suite of Climate Models for Agricultural Modelling Applications. Agric. Syst. 2013, 114, 1–5. [Google Scholar] [CrossRef]
- Wu, T.A. Mass-flux cumulus parameterization scheme for large-scale models: Description and test with observations. J. Clim. Dyn. 2012, 38, 725–744. [Google Scholar] [CrossRef]
- Colliera, M.A.; Jeffrey, S.J.; Rotstayna, L.D.; Wongb, K.K.-H.; Dravitzkia, S.M.; Moesenederc, C.; Hamalainen, C.; Syktusb, J.I.; Suppiaha, R.; Antony, J.; et al. The CSIRO-Mk3.6.0 Atmosphere-Ocean GCM: Participation in CMIP5 and data publication. In Proceedings of the 19th International Congress on Modelling and Simulation, Perth, Australia, 12–16 December 2011; pp. 2691–2697. [Google Scholar]
- Song, Z.; Qiao, F.; Song, Y. Response of the equatorial basin-wide SST to non-breaking surface wave-induced mixing in a climate model: An amendment to tropical bias. J. Geophys. Res. Oceans 2012, 117, 1–8. [Google Scholar] [CrossRef]
- Donner, L.J.; Bruce, L.; Hemler, R.S.; Horowitz, L.W.; Ming, Y.; Zhao, M.; Golaz, J.C.; Ginoux, P.; Lin, S.; Schwarzkopf, J.; et al. The dynamical core, physical parameterizations, and basic simulation characteristics of the atmospheric component AM3 of the GFDL global coupled model CM3. J. Clim. 2011, 4, 3484–3519. [Google Scholar] [CrossRef]
- Dunne, J.P.; John, J.G.; Shevliakova, S.; Stouffer, R.J.; Krasting, J.P.; Malyshev, S.L.; Milly, P.C.D.; Sentman, L.T.; Adcroft, A.J.; Cooke, W.; et al. GFDL’s ESM2 global coupled climate-carbon Earth system models. Part II: Carbon system formulation and baseline simulation characteristics. J. Clim. 2013, 26, 2247–2267. [Google Scholar] [CrossRef]
- Schmidt, G.A.; Ruedy, R.; Hansen, J.E.; Aleinov, I.; Bell, N.; Bauer, M.; Bauer, S.; Cairns, B.; Canuto, V.; Cheng, Y.; et al. Present-day atmospheric simulations using GISS Model E: Comparison to in situ, satellite, and reanalysis data. J. Clim. 2006, 19, 153–192. [Google Scholar] [CrossRef]
- Collins, W.J.; Bellouin, N.; Gedney, N.; Halloran, W.J.; Collins, N.; Bellouin, N.; Gedney, N.; Halloran, P.; Hinton, T.; Hughes, J.; et al. Development and evaluation of an Earth-system model—HadGEM2. Geosci. Model Dev. Discuss. 2011, 4, 997. [Google Scholar] [CrossRef]
- Dufresne, J.-L.; Foujols, M.-A.; Denvil, S.; Caubel, A.; Marti, O.; Aumont, O.; Balkanski, Y.; Bekki, S.; Bellenger, H.; Benshila, R.; et al. Climate change projections using the IPSL-CM5 Earth System Model: From CMIP3 to CMIP5. Clim. Dyn. 2013, 40, 2123–2165. [Google Scholar] [CrossRef]
- Watanabe, S.; Hajima, T.; Sudo, K.; Nagashima, T.; Takemura, T.; Okajima, H.; Nozawa, T.; Kawase, H.; Abe, M.; Yokohata, T.; et al. MIROC-ESM 2010: Model description and basic results of CMIP5-20c3m experiments. Geosci. Model Dev. 2011, 4, 845–872. [Google Scholar] [CrossRef]
- Watanabe, M.; Suzuki, T.; O’Ishi, R.; Komuro, Y.; Watanabe, S.; Emori, S.; Takemura, T.; Chikira, M.; Ogura, T.; Sekiguchi, M.; et al. Improved climate simulation by MIROC5: Mean states, variability, and climate sensitivity. J. Clim. 2010, 23, 6312–6335. [Google Scholar] [CrossRef]
- Yukimoto, S.; Adachi, Y.; Hosaka, M.; Sakami, T.; Yoshimura, H.; Hirabara, M.; Tanaka, T.Y.; Shindo, E.; Tsujino, H.; Deushi, M.; et al. A new global climate model of the Meteorological Research Institute: MRI-CGCM3: Model description and basic performance. J. Meteorol. Soc. Jpn. 2012, 90, 23–64. [Google Scholar] [CrossRef]
- Kirkevåg, A.; Iversen, T.; Seland, Ø.; Debernard, J.B.; Storelvmo, T.; Kristjánsson, J.E. Aerosol-cloud-climate interactions in the climate model CAM-Oslo. Tellus Ser. A Dyn. Meteorol. Oceanogr. 2008, 60, 492–512. [Google Scholar] [CrossRef][Green Version]
- Seland, O.; Iversen, T.; Kirkevag, A.; Storelvmo, T. Aerosol-climate interactions in the CAM-Oslo atmospheric GCM and investigation of associated basic shortcomings. Tellus Ser. A Dyn. Meteorol. Oceanogr. 2008, 60, 459–491. [Google Scholar] [CrossRef]
- Asmame, B. Temporal Variability and Trend Analysis of Temperature and Tainfall in the Northern Highlands of Ethiopia. Phys. Geogr. 2020, 42, 434–451. [Google Scholar] [CrossRef]
- Meseret, M.; Taye, G. Analysis of Spatial Variability and Temporal Trends of Rainfall in Amhara Region, Ethiopia. J. Water Clim. Chang. 2020, 11, 1505–1520. [Google Scholar] [CrossRef]
- Eshetu, G.; Johansson, T.; Garedew, W. Rainfall Trend and Variability Analysis in Setema-Gatira area of Jimma, Southwestern Ethiopia. Afr. J. Agric. Res. 2016, 11, 3037–3045. [Google Scholar] [CrossRef]
- Bekele-Biratu, E.; Thiaw, W.M.; Korecha, D. Sub-seasonal Variability of the Belg Rains in Ethiopia. Int. J. Climatol. 2018, 38, 2940–2953. [Google Scholar] [CrossRef]
- Segele, Z.T.; Lamb, P.J.; Leslie, L.M. Large-scale atmospheric circulation and global sea surface temperature associations with Horn of Africa June-September rainfall. Int. J. Climatol. 2009, 29, 1075–1100. [Google Scholar] [CrossRef]
- Arega, A.; Bazezew, A. Spatiotemporal variability and trends of rainfall and temperature in the Northeastern Highlands of Ethiopia. Model. Earth Syst. Environ. 2020, 6, 285–300. [Google Scholar] [CrossRef]
- Megersa, G.; Tesfaye, K.; Getnet, M.; Tana, T.; Jaleta, M.; Lakew, B. Rainfall Variability and its Implications for Wheat and Barley Production in Rainfall Variability and its Implications for Wheat and Barley Production in Central Ethiopia. Ethiop. J. Crop Sci. 2019, 7, 89–111. [Google Scholar]
- IDP (Internally Displaced Persons). Multi-Agency IDP Returnees Need Assessment Report East and West Hararghe Zones of Oromia, 2019 East and West Hararghe Zones; IDP: Oromia, Ethiopia, 2019. [Google Scholar]
- WFP/CSA. World Food Program and Central Statistical Agency of Ethiopia: Comprehensive Food Security and Vulnerability Analysis, Ethiopia, Addis Ababa; WFP: Rome, Italy, 2019. [Google Scholar]
- Taye, M.; Zewdu, F.; Ayalew, D. Characterizing the Climate System of Western Amhara, Ethiopia: A GIS Approach. Am. J. Res. Commun. 2013, 1, 319–355. Available online: www.usa-journals.com (accessed on 1 December 2021).
- Bahiru, W.; Assefa, E. Department Climatology and Weather Forecasting Temperature and Rainfall Trends in North-Eastern Ethiopia. Climatol. Weather Forecast. 2020, 8, 262. [Google Scholar] [CrossRef]
- Mathur, S.; Jajoo, A. Photosynthesis: Response to high-temperature stress. J. Photochem. Photobiol. B Biol. 2014, 137, 16–126. [Google Scholar] [CrossRef]
- Wylie, P. Managing Sorghum for High Yields: A Blueprint for Doubling Sorghum Production; Grains Research and Development Corporation: Barton, Australia, 2008. [Google Scholar]
- Egeru, A.; Barasa, B.; Nampijja, J.; Siya, A.; Makooma, M.T.; Gilbert, M.; Majaliwa, J. Past, Present and Future Climate Trends Under Varied Representative Concentration Pathways for a Sub-Humid Region in Uganda. Climate 2019, 7, 35. [Google Scholar] [CrossRef]
- Hatfield, J.L.; Boote, K.J.; Kimball, B.A.; Ziska, L.H.; Izaurralde, R.C.; Ort, D.; Thomson, A.M.; Wolfe, D. Climate impacts on agriculture: Implications for crop production. Agron. J. 2011, 103, 351–370. [Google Scholar] [CrossRef]
- Tessema, B.; Chamberlin, J.; Reidsma, P.; Silva, J.V.; Van Ittersum, M.K. Correction to Unravelling the Variability and Causes of Smallholder Maize Yield Gaps in Ethiopia. Food Secur. 2020, 12, 83–103. [Google Scholar] [CrossRef]
- EPCC (Intergovernmental Panel on Climate Change). Ethiopian Panel on Climate Change: First Assessment Report, Working Group I Report on Climate Change in Ethiopia; IPCC: Geneva, Switzerland, 2015. [Google Scholar]


Publisher’s Note: MDPI stays neutral with regard to jurisdictional claims in published maps and institutional affiliations. |
© 2021 by the authors. Licensee MDPI, Basel, Switzerland. This article is an open access article distributed under the terms and conditions of the Creative Commons Attribution (CC BY) license (https://creativecommons.org/licenses/by/4.0/).