Article

Beneficial Effect of Biochar on Irrigated Dwarf-Green Coconut Tree

1
Embrapa Agroindústria Tropical, Fortaleza 60511-110, Brazil
2
Embrapa Meio Ambiente, Jaguariúna 13918-110, Brazil
*
Author to whom correspondence should be addressed.
Atmosphere 2022, 13(1), 51; https://doi.org/10.3390/atmos13010051
Submission received: 30 November 2021 / Revised: 21 December 2021 / Accepted: 25 December 2021 / Published: 29 December 2021
(This article belongs to the Special Issue Agricultural Microclimate and Irrigation Water Management)

Abstract

:
The coconut tree is considered one of the greatest consumers of irrigation water, ranging from 100 to 240 L day−1. The objective of the present study was to evaluate the effect of biochar application on decreased irrigation water needs in a 2-year irrigated dwarf coconut palm orchard field experiment. Biochar was characterized chemically and by electron microscope images. Biochar morphology presented several micropores indicating water retention potential. Amounts of biochar were tested (0, 5, 10, 20, 40 g of biochar per kg of soil), representing 0.0; 0.5; 1.0; 2.0; and 4.0 kg per plant. Micro sprinkler irrigation started following the planting of the 90-day old hybrid dwarf coconut seedlings. The impacts of the application of the biochar on the chemical attributes of the soil, biometry of the coconut plants, water storage in the 0–0.3 m soil layer, and the volume of irrigation water required by treatment were evaluated. After two years (2017 and 2018), the application of the biochar resulted in no statistically significant differences in the chemical attributes of the soil and biometric variables of plants between different treatments. The volume of annual irrigation water per plant versus biochar quantity demonstrated a decreasing effect, due to the increase of soil water storage. The dose of 40 g of biochar per kg of soil presented the highest two-year average soil water retention (0–0.3 m layer) among treatments (34, 36, 34, 38, and 45 mm, respectively), resulting in lower 2-year irrigation water demand (28, 36, 29, 28 and 20 L plant−1 day−1, respectively).

1. Introduction

The development of coconut plants depends on the emission of new leaves which decreases under water stress which also causes premature aging, fall of existing leaves, and reduced productivity [1]. The coconut tree is considered one of the fruit trees that consume irrigation water the most. The estimated volume for plants in production is 100 to 240 L day−1, depending on local weather conditions. However, there are reports of producers applying more than 500 L plant−1 day−1. A study on coconut irrigation water productivity in the state of Ceará, Brazil, found inadequate irrigation management on monitored farms [2,3]. Over-irrigation (23% water use above plant demand) practices resulted in low irrigation water use efficiency, with an average of 2.7 fruits and 1.2 L of coconut water per cubic meter of irrigation water applied, while averages of 1.9 fruits and 0.8 L of coconut water per cubic meter of water applied to the crop were also observed in Ceará [4].
Irrigation with a deficit of about 39%, for 8 months, resulted in greater water productivity, however, with a significant reduction of coconut water volume [3]. The relationship between physical production and the volume of irrigation water applied was 5.5 fruits and 2.0 L of coconut water per cubic meter [3]. Irrigation management by farmers sometimes leads to excessive application of water and other times with a deficit of irrigation water.
On the other hand, the productivity of irrigated coconut palms in India is doubled and economic returns vary from 1.6 to 2.2 times when compared to rainfed, indicating that irrigation is crucial for the crop to become profitable [1,5]. Greater fruit production in irrigated coconut orchards in Ceará was reported, when compared to rainfed, due to the fact that the carbohydrates produced in photosynthesis are rapidly translocated to the fruits [6]. However, a clear need to improve the irrigation management of the coconut crop at the farm level is evident.
The use of soil conditioners has shown an increase in soil water retention, modifying properties such as density and porosity, allowing water, both from rain and irrigation, to remain available for a longer time in the plant root zone. Among these conditioners, biochar (carbonized material from incomplete combustion of organic substance) can increase the water retention capacity in sandy soils, due to its porous structure, but the amount applied is relevant to obtain the positive effect [7]. Increased water retention for most types of tested biochar has been reported by [8]. Increased hydraulic conductivity in saturated soil, water retention capacity, and available water content is the most relevant effects of adding biochar to soils [9].
According to [10], biochar intra pores have the ability to increase the water storage of sand-biochar mixtures at potentials lower than −16.5 kPa. The water retention capacity of biochar can improve soil moisture retention, reduce nutrient leaching and increase water availability in the root zone, contributing to improved irrigation efficiency. Changes in soil structure, but not hydraulic properties, after the addition of 10 Mg ha−1 of biochar + 0.8% N in sandy loam soils have been reported by [11]. It must be observed that different diameters of biochar particles from the same source material differently affect the environmental objective of the application [12].
The coconut water agroindustry generates residues in the form of coconut husks that are left as drift in the field during harvest, which could be better used and destined for biochar production for agricultural purposes and, at the same time, prevent the spread of mosquitoes that transmit diseases such as dengue, which proliferate in abandoned coconut shells filled with accumulated rainwater.
The objective of the present study was to evaluate the effect of five different application rates of biochar from sun-dried green coconut husk (SDGH) as a soil water retention agent, in the implantation of irrigated dwarf coconut palm orchard to reduce irrigation water application, and to assess soil chemical attributes under field conditions.

2. Materials and Methods

The biochar raw material was green coconut husk that after harvest was sun-dried by natural exposure and then collected to be prepared using a rustic brick kiln with no oxygen. It was chemically characterized [13] and its microstructure was evaluated by scanning electron microscopy brand Tescan, model Vega 3, Prague, Czech Republic to determine the microporosity of the material. Analyzes of the vascular system, plant cell wall thickness, and material porosity were performed and images were recorded and interpreted.
The field experiment was conducted in the Curu Experimental Station, belonging to Embrapa Agroindústria Tropical, located in the municipality of Paraipaba-CE, Brazil, from January 2017 to December 2018. The climate in the region is of the Aw type (tropical with dry winter), according to the Köppen classification, and C1 (Dry Subhumid), according to the Thornthwaite classification [14]. Annual precipitation is around 1000 mm and the rainy season is concentrated in the months from February to May.
The soil in the experimental area presents medium to sandy texture in the 0–0.3 m layer and medium in the other layers. The textural class varied from sandy to loam sandy in horizon A, while horizon B presents a much more clayey texture. According to the soil analyzes and characterizations, the soil was classified according to the Brazilian soil classification system as a Red Yellow Dystrophic Argisoil [15]. The maximum organic matter content was 6.4 g kg−1; pH ranged from 5.6 to 6.3; Cation Exchange Capacity from 31.3 to 64.8 mmolc dm−3 and maximum Base Sum of 62% in the most superficial layer [16].
During the preparation of the experimental area, 1700 kg of dolomitic lime were applied 60 days before planting. Pits were opened with a circumference of 0.40 m and a depth of 0.40 m by a drill coupled to a tractor. Each plant was fertilized with 2000 g of simple superphosphate; 1450 g of potassium chloride, 1400 g of urea, and 212 g of FTE BR 12 micronutrients mixture (3.9% S, 1.8% B, 0.86% Cu, 2.0% Mn, and 9.0% Zn). The amount of fertilizer applied was based on soil analysis and expected plant yield. The biochar was ground to a particle size diameter of approximately 2 mm and applied in the pits to a depth of 0.4 m. The amount applied varied according to treatments. Then, 90-day old seedlings of hybrid green dwarf coconut were planted, spaced 8 m between rows and 8 m between plants, totaling 15 rows with 20 plants per row of 161.5 m. The plants additionally received, in the second year after planting, 350 g plant−1 of urea and 116 g plant−1 of potassium chloride monthly, and, in a single dose on the soil-plant cover, 268 g of FTE BR 12 micronutrients mixture (3.9% S, 1.8% B, 0.86% Cu, 2.0% Mn and 9.0% Zn) and 900 g of simple superphosphate.
The experimental design was completely randomized with 5 treatments (0, 5, 10, 20, 40 g of biochar per kg of soil), corresponding to rates of biochar (0.0; 0.5; 1.0; 2.0 and 4.0 kg plant−1) with 4 replications. Each replicate contained 15 plants per plot. Since one plant occupied 64 m2 (8 m × 8 m), the size of each replicate was 960 m2.
The irrigation system used a water distribution pipe scheme and an independent water register for each treatment in such a way that allowed differentiated irrigation, as the water was demanded by plants of each treatment.
The soil moisture was monitored using tensiometers (two sets per treatment) installed at a depth of 0.15 m, representing the soil layer from 0.0 to 0.3 m, and at 0.45 m, representing the soil layer from 0.0 to 0.6 m. Tension values greater than 20 kPa at the most superficial soil layer were adopted as an indication to start irrigation, following the recommendation of [17] who mentioned 10 to 25 kPa for sandy soils and 25 to 40 kPa for medium textures. The tension of 20 kPa corresponded to 0.06 cm3 cm−3 of soil water content, while the field capacity corresponded to 0.38 cm3 cm−3, indicating around 15.8% of soil moisture. This percentage is higher than cited by [18] in Yellow Argisoil in Sergipe State, Brazil.
Coconut seedlings were micro-sprinkler irrigated with a wet diameter of 2.8 m, an average flow rate of 73.23 L h−1, and application efficiency evaluated in the field of 81.85%. Irrigation was carried out considering the average monthly evapotranspiration estimated by the Penman-Monteith/FAO method [19] for the municipality of Paraipaba-CE, Brazil, and cultivation coefficients according to crop development stages by [2]. The irrigation system was activated manually for each treatment with individual water distribution each time the tensiometer installed at 0.15 m, in the respective treatment, reached 20 kPa and applied sufficient water for three days of crop evapotranspiration.
Precipitation at the experiment site was concentrated from February to May with a distinct monthly distribution pattern for each year (Figure 1), totalizing 1284 mm and 1217 mm in 2017 and 2018, respectively. The reference evapotranspiration (ETo) estimated by the Penman-Monteith/FAO method was 1363 mm and 1315 mm in those same years, respectively. Soil water from rainfall contributed to delaying the onset of irrigation by keeping soil water tension below 20 kPa.
After two years of biochar application, soil samples were collected using a stainless-steel auger from 0–0.2 m and 0.2–0.4 m layers for each replication of the experiment design. The impacts on soil chemical attributes (pH, EC, K+, Ca++, Mg++, Na+, Al3+, H + Al, Sodium Adsorption Ratio (SAR), Cation Exchange Capacity (CEC), Sum of Bases (SB), and Saturation of Bases (V)) were assessed. A total of 40 soil samples were analyzed in the laboratory. Each soil sample consisted of 12 sub-samples (4 sub-samples under 3 plants per replicate). This procedure was conducted for two layers of soil. Thus, two soil samples were taken from each replicate of 15 plants.
The biometric variables evaluated in three plants per plot were: number of leaves per plant, plant height, stem diameter, canopy diameter, and number of leaflets in the 14th emitted leaf, counted from the apex, located in the middle of the canopy, as recommended by [6].
Daily soil moisture tension was used to estimate the water content in the soil profile and to graph the soil water storage in the 0.0 to 0.3 m layer for each treatment during the period of the experiment. The water content was estimated using the Van Genuchten model (1980), according to Equation (1) and parameters determined from the soil water retention curve (Table 1).
Θ =   θ r + θ s θ r ( 1 + | a   Ψ m | n ) m
where:
  • θ—Soil water content based on volume (cm3 cm−3);
  • θr—Residual water volume (cm3);
  • θs—Saturation water volume (cm3);
  • Ψm—Soil water matric potential (kPa);
  • a, n and m—Curve fit parameters.
The analysis of variance of the evaluated plant biometric and soil fertility variables was carried out after checking the normality of the residues using the Shapiro-Wilk test and the homogeneity of the variances using the Bartlett test. If there was a significant effect of the treatment factor (biochar rate), evaluated via Anova’s F test, regression models were adjusted using the Expdes.pt package of the statistical software and programming environment R version 4.0.2. Same procedure was used to assess the effect of the biochar rate on the volume of water required for irrigation (water demand (WD) per plant) and the average daily soil water storage for the two years of observation were evaluated using regression models.

3. Results and Discussion

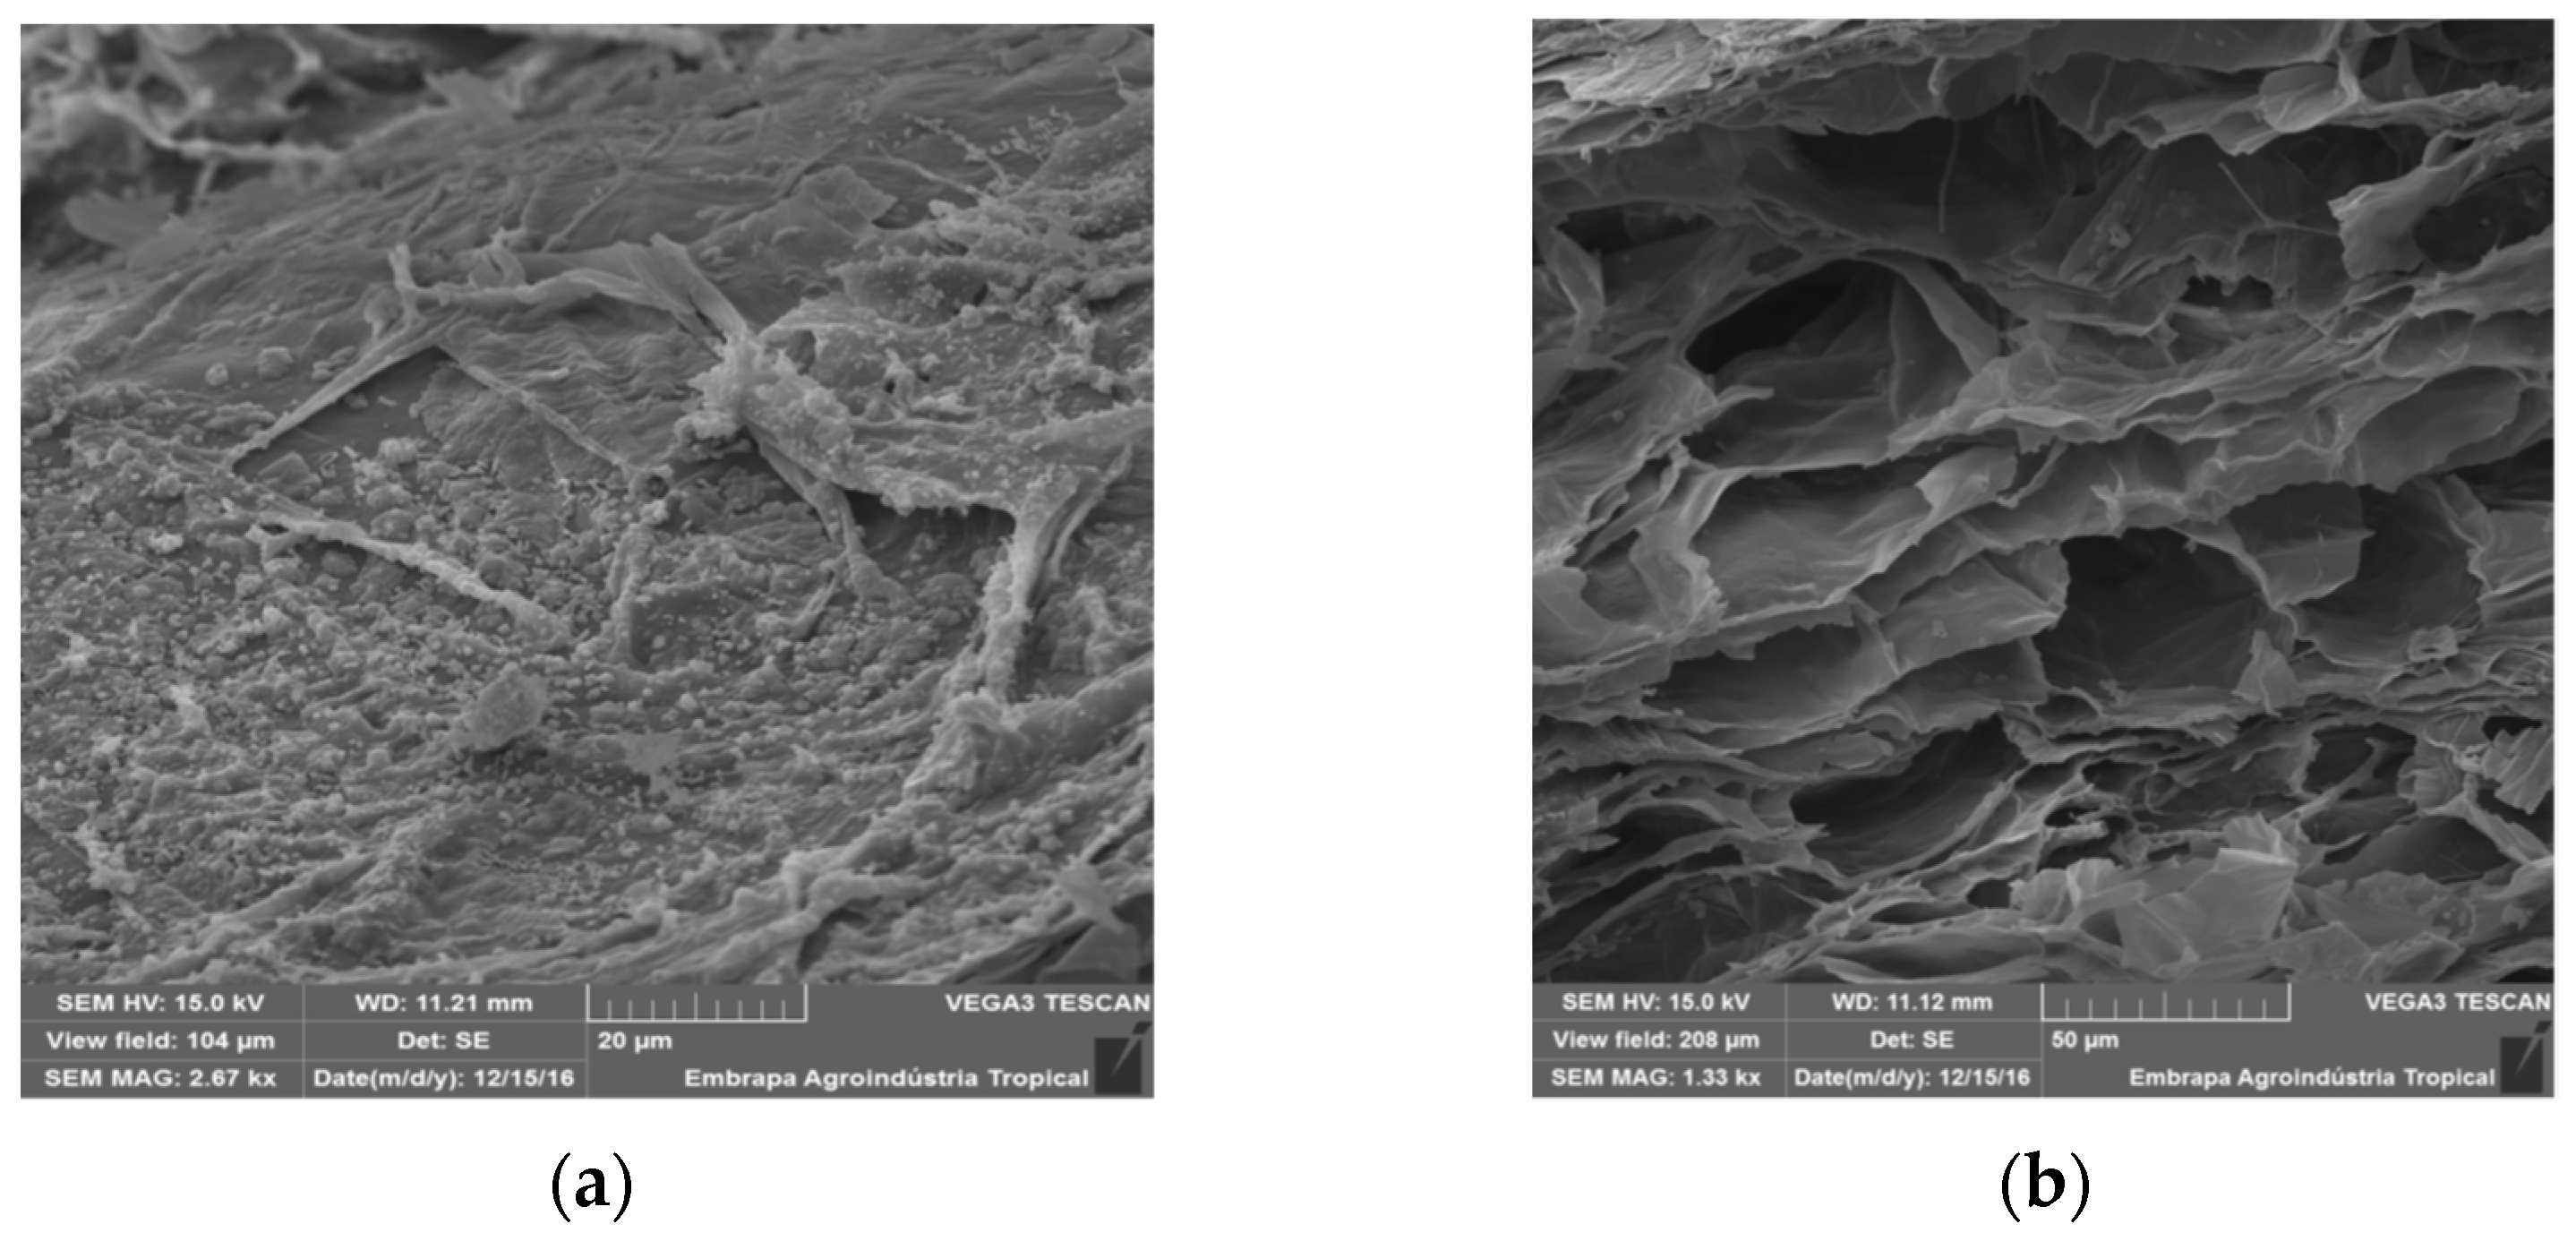
3.1. Sun-Dried Coconut Husk Biochar

The chemical characterization of SDCH (Table 2) indicates higher potassium (30 g kg−1), sodium (7 g kg−1), and higher electrical conductivity (4.01 dS m−1) when compared to other biochar such as cashew wood [20] which presents more similar levels of nitrogen and phosphorus to SDCH [21]. These differences in composition are reported by [22,23] who explained that the raw material and process conditions control the mineral content of biochar which may vary significantly between different types. The carbon content (TOC) of SDCH biochar (50.1%) is considered low, according to the classification of [23]: <60% (low), 60% to 80% (medium) and above 80% (high). A pH value above 7 has been reported as possible by [23]. The value of electrical conductivity (EC) of 4.01 dS m−1 does not represent a restriction on the cultivation of hybrid dwarf coconut palms, according to [24] who defined the upper limit of 6.5 dS m−1 for a complete establishment of dwarf coconut plants, with adequate water supply or water use with EC of 5.2 dS m−1 [25]. Coconut plants are, in fact, more susceptible to drought than to increased soil salinity [26].
In the images of SDCH biochar obtained by scanning electron microscopy, the different morphologies of the fruit’s epicarp and mesocarp are clearly observed (Figure 2). The epicarp presented itself as a region rich in sclerenchyma, very fibrous and with multiple recesses, with a microporous character. From the mesocarp, the parenchyma regions were visualized and cells had different sizes and regions of the vascular cambium, with highly lignified vessels, with dense and rigid walls. Both regions were shown to be extremely porous, with emphasis on the microporosity of the epicarp. It is concluded that SDCH biochar has macro and microporous regions, and the mesocarp has larger pores than the epicarp, which micropores may have a greater water retention capacity.

3.2. Soil Attributes Impacts

The analyzes of the chemical attributes of the soil (Table 3), two years after the application of biochar, showed no significant impact (Tukey test, p > 0.05) on such attributes (pH, EC, K+, Ca++, Mg++, Na+, Al3+, H + Al, SAR, CEC, SB, V) for both the 0–0.2 m and 0.2–0.4 m soil layers. In contrast, using much higher amounts of biochar made from chicken litter [27], using rates from 0 to 30 t ha−1 in soil columns of an oxisoil, verified that the different doses of biochar increased the levels of EC, pH, K+, and Na+, as well as SAR and Exchangeable Sodium Percentage (ESP). Impacts were more pronounced in the most superficial layer of the soil. Likewise, [21], worked with high doses of cashew wood biochar (0 to 10.5 t ha−1) in pots containing sandy soil. They demonstrated an increase in pH, K+, P, and ESP with increasing doses, even warning of the risk of soil salinization. Chinese pine biochar at doses of 0 to 16 g kg−1 of soil increased the content of organic carbon, N, and P in the most superficial layer of the soil [28]. A reasonable hypothesis is that in the present study, even the highest dose of biochar in tropical environmental conditions was not high enough to promote changes in the chemical attributes of the soil.

3.3. Plant Development
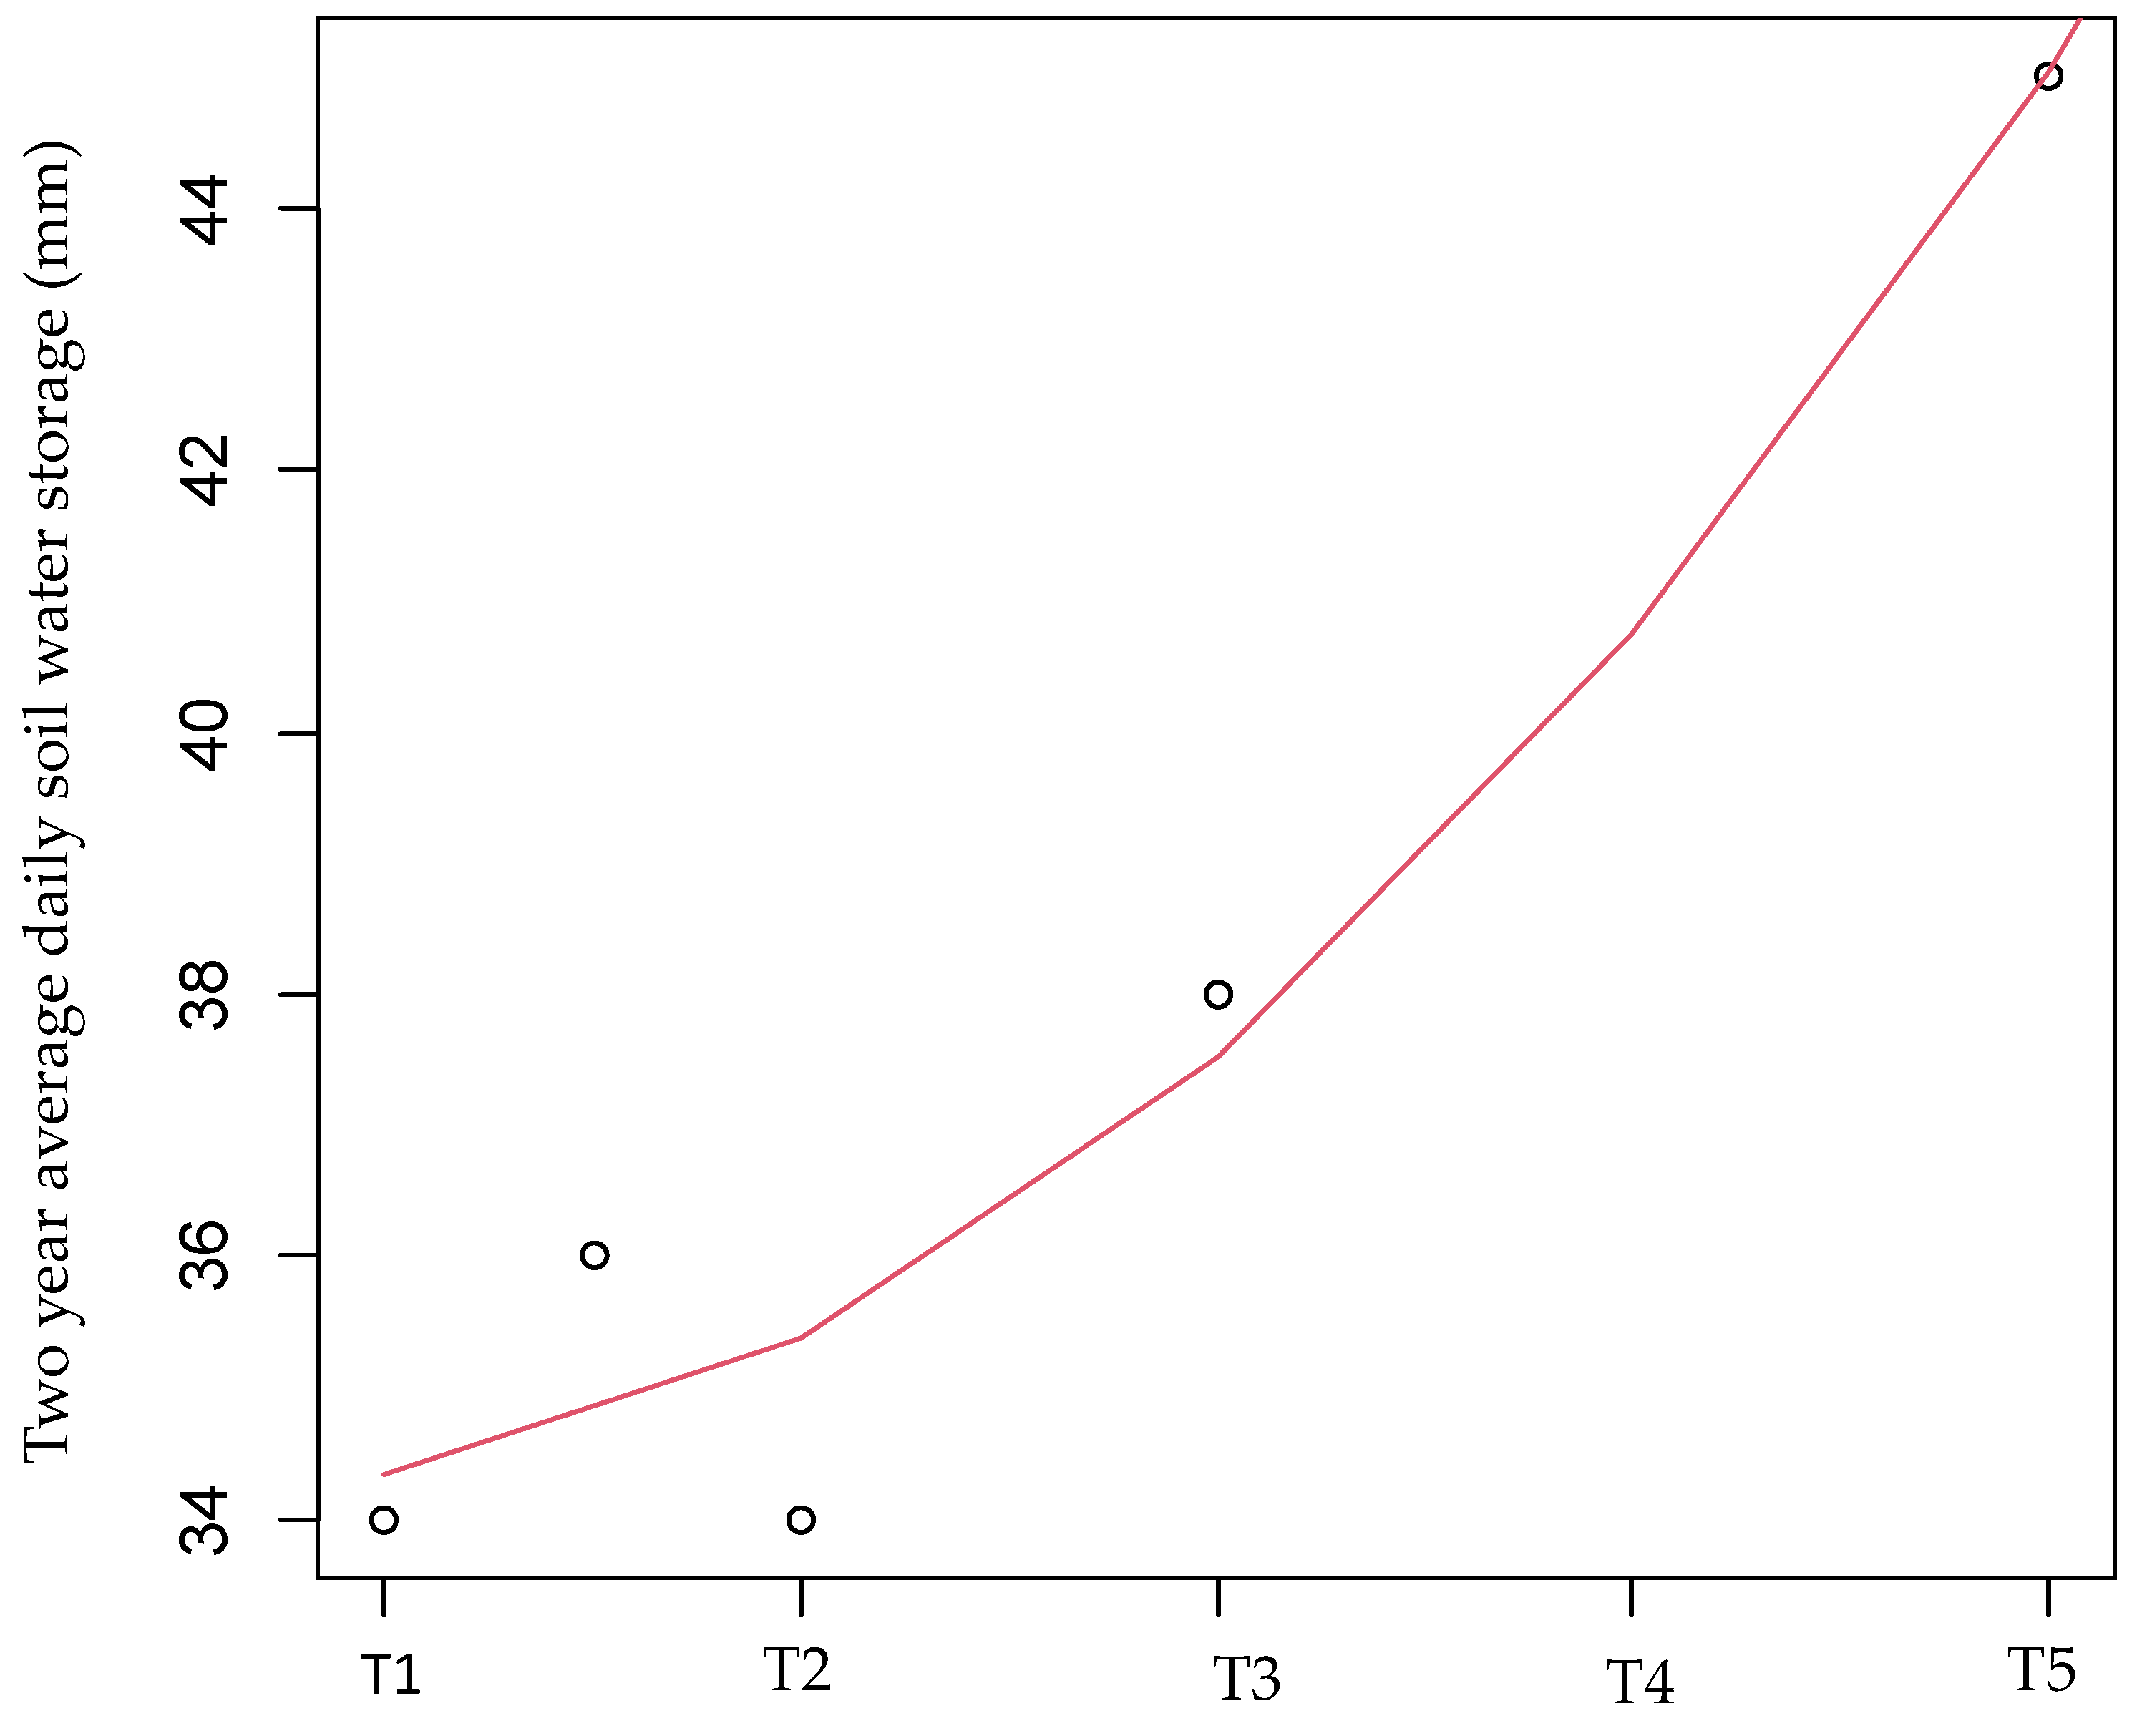
Regarding the biometric characteristics, there was no significant effect of the biochar dose (F-test, p > 0.05; Table 4), indicating homogeneous vegetative development on coconut plants (750 days after transplanting) submitted to different doses of biochar.
The average number of leaves ranged from 16.1 to 18.1 in December 2018. Two-year-old plants were not yet fully developed, a fact corroborated by [1] who stated that adult plants have 25 to 35 open leaves and flowering occurs after 2.5 to 3 years; 30 to 32 leaves in 42-year-old plants [29]; and, 23 to 32 leaves according to [30]. Plant height ranged from 4.4 to 5.0 m after two years, similar to height reported by [30] in India of plants without and with mulch (4.9 to 6.1 m) at five years of age. Stem diameter values ranged from 24.7 to 25.5 cm, less than reported by [30] (diameters from 34.0 to 46.3 cm) for adult plants and close to 27.32 ± 0.62 for irrigated giant coconut plants reported by [6]. The number of leaflets per leaf on the 14th leaf ranged from 143.9 to 153.0 (222 was the number reported by [6] for irrigated adult giant coconut palms).
The lack of effect of the biochar on biometric plant variables is explained by the irrigation management in the experiment that used the same level of water depletion in the soil (20 kPa) for all treatments as a criterion for irrigation starts. Homogeneous development of cashew trees under different biochar doses, when subjected to salvation irrigation controlled by the soil moisture tension measured by tensiometers was also observed by [31]. This is due to the fact that the water supply to plants occurs according to the loss of soil moisture at a similar level for all treatments. Furthermore, fruit tree development is slower when compared to annual crops, so plants have enough time to become homogeneous as reported by [32], who used 50 to 200 t ha−1 of biochar made from Fagus sp. and observed a positive effect of the dose on the height of potted oat (Avena sativa ssp. nuda) plants, harvested 5 months after planting. It is possible to conclude that a greater amount of biochar can exert an effect on plant development for annual crops and it is less noticeable in woody fruit trees with a longer development time.

3.4. Soil Moisture

The two-year average daily water storage (mm) in the soil profile (0.0 to 0.3 m layer) for each treatment is shown in Figure 3. This layer was monitored considering the biochar application depth and root depth [33] who stated that 77% of coconut roots are found at 0.60 m soil depth. There was an increasing quadratic effect (F-test, p < 0.05) of the dose of biochar on soil moisture (t-test, p = 0.02477, R2 = 0.9152, RME = 1.945 mm).

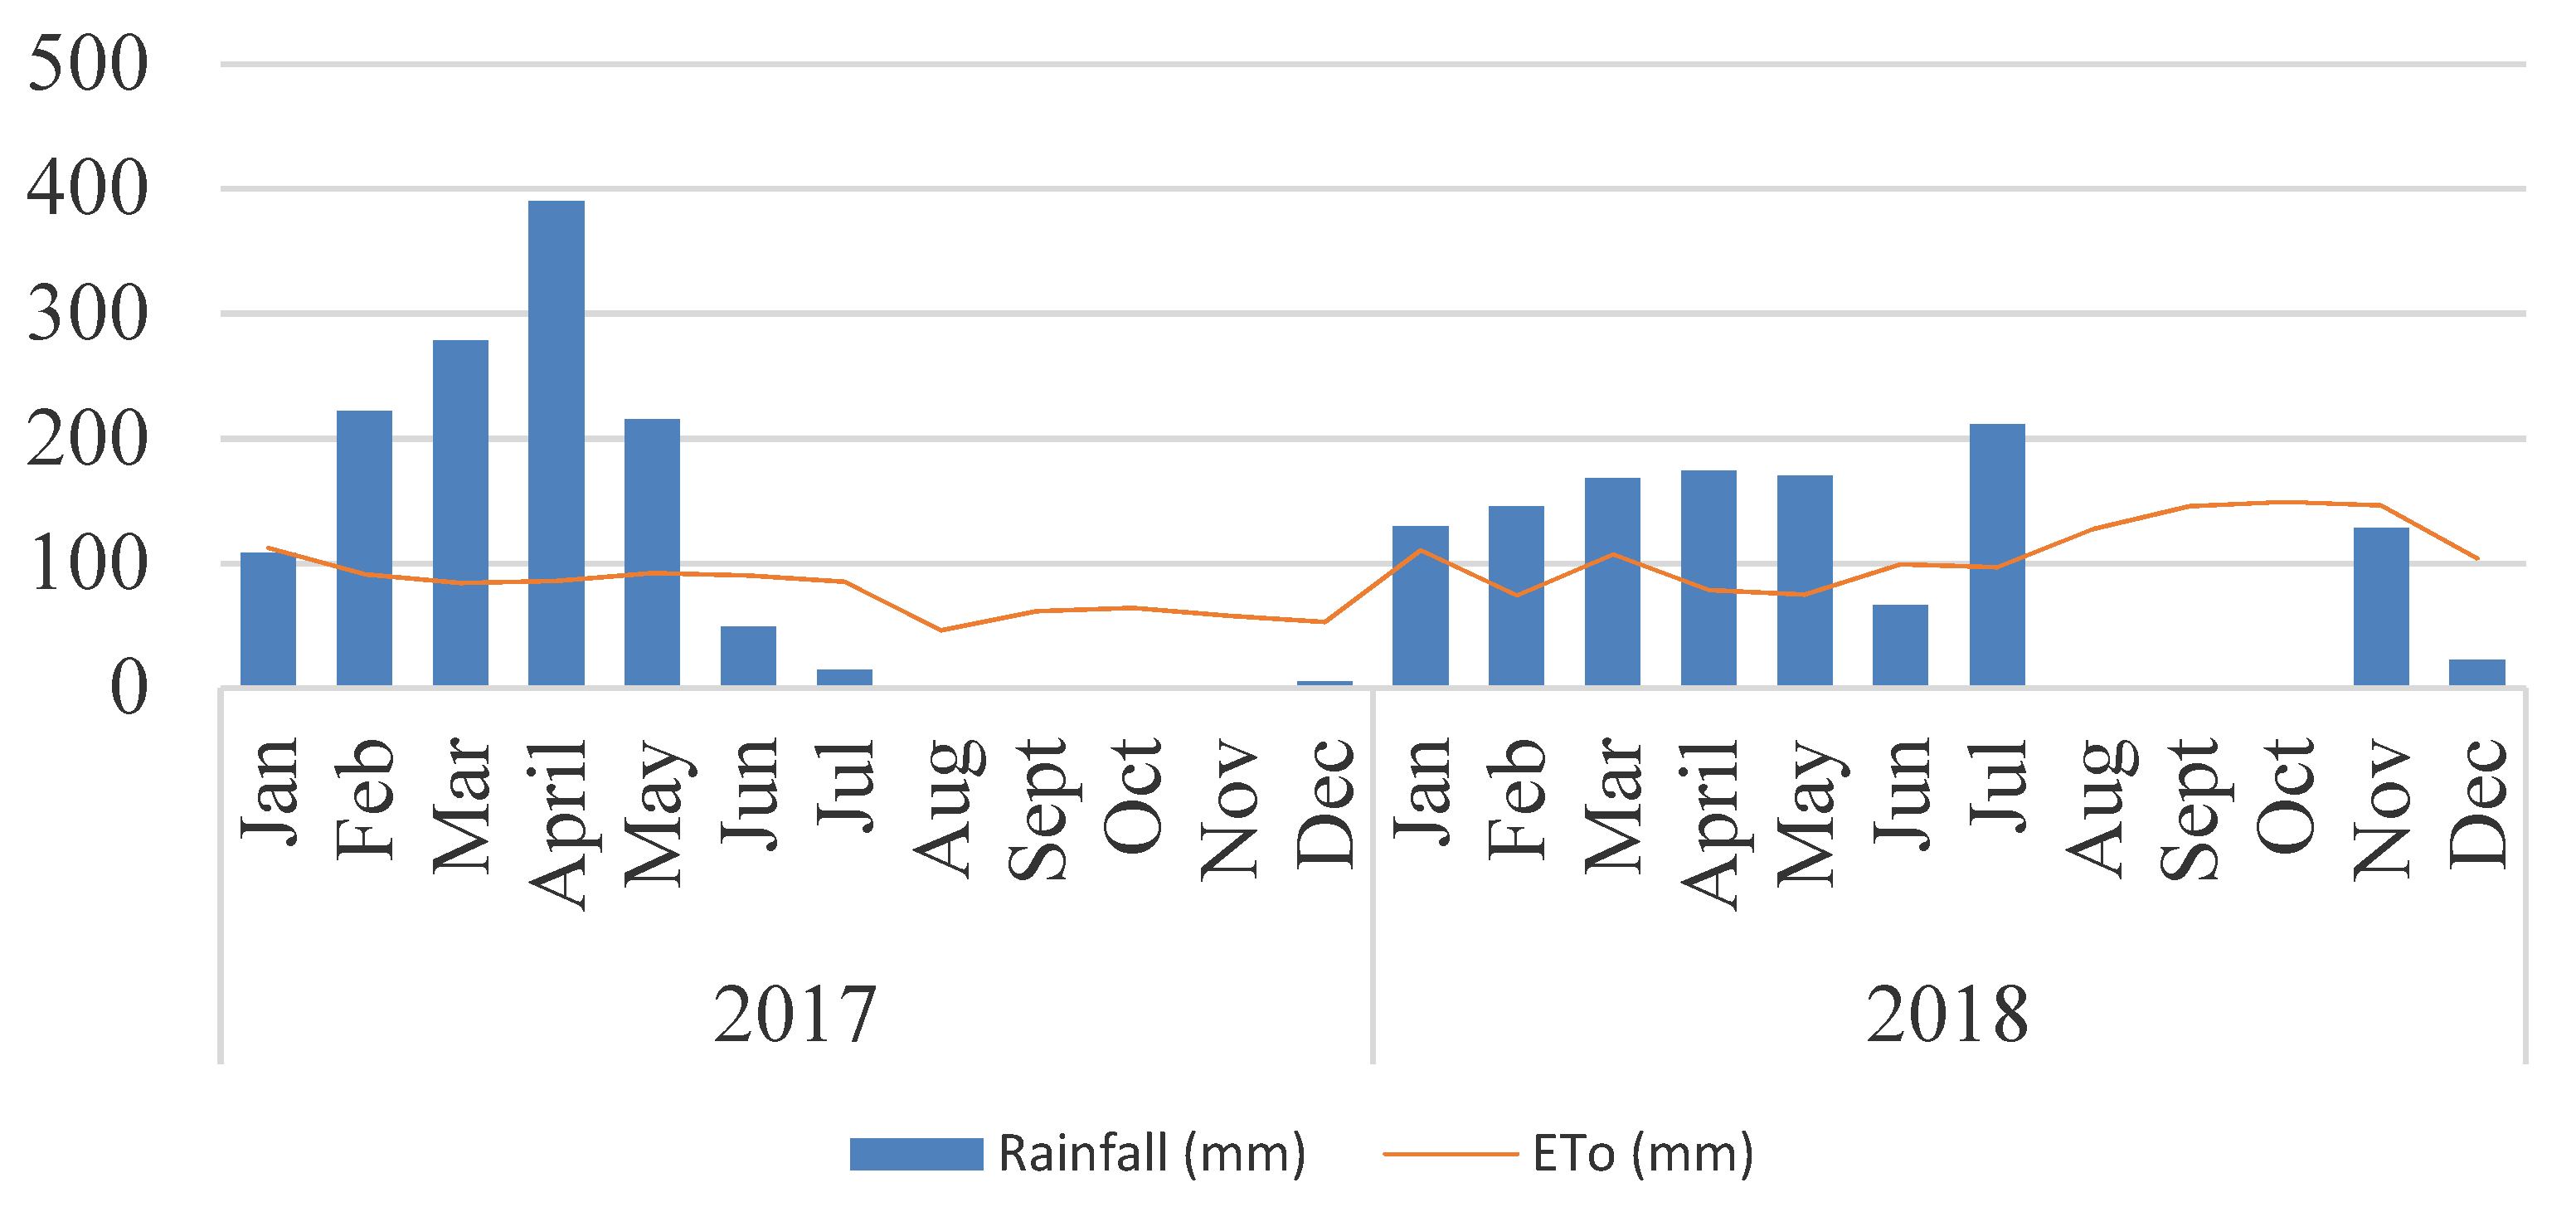
3.5. Irrigation Water

As a consequence of increased soil moisture storage with higher levels of biochar, the demand for irrigation water decreased. There was a significant effect of the biochar dose (t-test, p < 0.10) on the response (R2 = 0.70) and root mean square error (RQME) of 0.003237 (Figure 4). According to the fitted model the lower doses had little influence on the reduction of water consumption, with the greatest reduction for 4 kg plant−1 of biochar. This result suggests that to maximize the lower irrigation water demand effect, it is necessary to test quantities higher than those analyzed in this experiment. The estimated average daily consumption of irrigation water per plant in the initial 2 years of cultivation was 28, 36, 29, 28, and 20 L plant−1 day−1 for biochar doses of 0.0; 0.5; 1.0; 2.0 and 4.0 kg plant−1, respectively. These values are close to those reported by [2]: 25 L plant−1 day−1 for 11-month-old plants. Additionally, in an experiment with 10-month-old plants in India, [29] reported the application of 16 L plant−1 day−1 in the first year of the experiment, 32 L plant−1 day−1 in the second year, and 72 L plant−1 day- 1 in the third year [30].
Hydraulic conductivity of saturated soil is influenced by biochar dose, particle size, and soil texture [34]. A reduction in hydraulic conductivity (leading to greater water retention) was observed in sandy soils and with biochar particle sizes larger than 2 mm. In clayey soils, biochar caused an increase in hydraulic conductivity. [10] determined that biochar with greater intra porosity and irregular shape performs better for water retention in coarse-textured soils. [35] confirmed the effect of biochar in coarse-textured soils, contributing to the formation of fine and medium pores, beneficial to water retention. In this study, the addition of biochar resulted in a reduction in hydraulic conductivity as an increase in soil water storage was observed in the most superficial soil layer of a sandy texture. A similar result was observed by [34].
Biochar application resulted in no statistically significant differences for the chemical attributes of the soil between treatments nor for plants’ biometric variables. The annual irrigation water volume required per plant versus biochar amount demonstrated a linear decrease effect, as a consequence of an increased soil water storage as biochar application quantity increased. The dose of 4.0 kg plant−1 of biochar had the highest water retention, implying a lower demand for irrigation water in the first two years since field planting.

4. Conclusions

The application of biochar in the amounts adopted in this experiment did not influence the development of coconut plants while no significant impacts were observed on the soil chemical attributes, after 24 months since the application.
The quadratic increasing effect of the biochar dose on the soil water storage lead to, a decreasing linear effect on the irrigation water demand. The 4.0 kg plant−1 dose of SDGH biochar had the highest average water retention, implying a lower demand for irrigation water. The SDGH has potential use as a soil conditioner to increase soil water holding capacity. The linear behavior of the responses indicates that higher doses of biochar should be tested to estimate the dose that minimizes the water demand for irrigation of coconut plants.

Author Contributions

Conceptualization, R.G.; methodology, R.G., A.M., C.M. and C.T.; software, R.G., A.M., A.T.d.M. and J.d.S.; validation, A.M. and C.T.; formal analysis, A.M. and C.T.; investigation, R.G., T.A.A. and A.T.d.M.; resources, R.G.; data curation, R.G.; writing—original draft preparation, R.G.; writing—review and editing, R.G., C.T. and A.M.; visualization, R.G.; supervision, R.G.; project administration, R.G.; funding acquisition, R.G. All authors have read and agreed to the published version of the manuscript.

Funding

This research was funded by Brazilian Agriculture Research Corporation grant number [12.15.01.001.00.04]

Conflicts of Interest

The authors declare no conflict of interest.

References

  1. Carr, M.K.V. The water relations and irrigation requirements of coconut (Cocos nucifera): A review. Exp. Agric. 2011, 47, 27–51. [Google Scholar] [CrossRef]
  2. De Miranda, F.R.; Gomes, A.R.M.; Oliveira, C.H.C.; Montenegro, A.A.T.; Bezerra, F.M.L. Evapotranspiração e coeficientes de cultivo do coqueiro anão-verde na região litorânea do Ceará. Rev. Ciênc. Agron. 2007, 38, 129–135. [Google Scholar]
  3. De Miranda, F.R.; Rocha, A.B.S.; Guimarães, V.B.; da Silva, E.S.; Lima, G.d.C.M.; Santos, S.E.M. Eficiência do uso da água na irrigação do coqueiro anão. Irriga 2019, 24, 109–124. [Google Scholar] [CrossRef]
  4. Teixeira, A.H.C.; de Miranda, F.R.; Leivas, J.F.; Pacheco, E.P.; Garconc, E.A.M. Water productivity assessments for dwarf coconut by using Landsat 8 images and agrometeorological data. ISPRS J. Photogramm. Remote Sens. 2019, 155, 150–158. [Google Scholar] [CrossRef]
  5. Basavaraj, G. Yield estimation of coconut in Tumkur district of Karnataka. J. Plant. Crops 2016, 44, 133–140. [Google Scholar] [CrossRef]
  6. Santos, M.M.S.; Lacerda, C.F.; Neves, A.L.R.; de Sousa, C.H.C.; de Ribeiro, A.; Bezerra, M.A.; Araújo, I.C.d.S.; Gheyi, H.R. Ecophysiology of the tall coconut growing under different coastal areas of northeastern Brazil. Agric. Water Manag. 2020, 232, 106047. [Google Scholar] [CrossRef]
  7. Laghari, M.; Naidu, R.; Xiao, B.; Hu, Z.; Mirjat, M.S.; Nawaz, K.; Chen, Z.; Guo, D.; Jogi, Q.; Abudi, Z.N.; et al. Recent developments in biochar as an effective tool for agricultural soil management: A review. J. Sci. Food Agric. 2016, 96, 4840–4849. [Google Scholar] [CrossRef]
  8. Novotny, E.H.; Maia, C.M.B.d.F.; de Carvalho, M.T.; Madari, B.E. Biochar: Pyrogenic carbon for agricultural use—A critical review. Rev. Bras. Ciênc. Solo 2015, 39, 321–344. [Google Scholar] [CrossRef] [Green Version]
  9. Omondi, M.O.; Xia, X.; Nahay, O.A.; Liu, X.; Korai, P.K.; Pan, G. Quantification of biochar effects on soil hydrological properties using meta-analysis of literature data. Geoderma 2016, 274, 28–34. [Google Scholar] [CrossRef]
  10. Liu, Z.; Dugan, B.; Maisello, C.A.; Gonnermann, H.M. Biochar particle size, shape, and porosity act together to influence soil water properties. PLoS ONE 2017, 12, e0179079. [Google Scholar] [CrossRef] [Green Version]
  11. Moragues-Saitua, L.; Arias-González, A.; Gartzia-Bengoetxea, N. Effects of biochar and wood ash on soil hydraulic properties: A field experiment involving contrasting temperate soils. Geoderma 2017, 305, 144–152. [Google Scholar] [CrossRef]
  12. He, P.; Liu, Y.; Shao, L.; Zhang, H.; Lü, F. Particle size dependence of the physicochemical properties of biochar. Cremosphere 2018, 212, 385–392. [Google Scholar] [CrossRef]
  13. Miyazawa, M.; Pavan, M.A.; Muraoka, T.; Carmo, C.A.F.S.; Melo, W.J. Análise química de tecido vegetal. In Manual de Análises Químicas de Solos, Plantas e Fertilizantes, 2nd ed.; Silva, F.C., Ed.; Embrapa: Brasília, Brazil, 2009; pp. 191–234. [Google Scholar]
  14. Muniz, F.L.; Pereira, J.M.R.; Júnior, C.L.X.; Studar, M.D.C. Classificação climática para o estado do Ceará utilizando distintos sistemas de caracterização. In Proceedings of the XXII Simpósio Brasileiro de Recursos Hídricos, Florianópolis, Brazil, 26 November–1 December 2017; Associação Brasileira de Recursos Hídricos: Florianópolis, Brazil, 2017. [Google Scholar]
  15. EMBRAPA. Sistema Brasileiro de Classificação de Solos, 3rd ed.; Centro Nacional de Pesquisa de Solos: Brasília, Brazil, 2006; p. 353. [Google Scholar]
  16. Silva, F.C.; Abreu, M.F.; Pérez, D.V.; Eira, P.A.; Abreu, C.A.; van Raij, B.; Gianello, C.; Coelho, A.M.; Quaggio, J.A.; Tedesco, M.J.; et al. Métodos de análises químicas para avaliação da fertilidade do solo. In Manual de Análises Químicas de Solos, Plantas e Fertilizantes, 2nd ed.; Silva, F.C., Ed.; Embrapa: Brasília, Brazil, 2009; pp. 107–189. [Google Scholar]
  17. Amorim, J.R.A.; Resende, R.S.; de Miranda, F.R. Manejo da Irrigação Localizada na Cultura do Coqueiro-Anão por Meio de Tensiometria. Technical Communication. 2015. Available online: https://www.embrapa.br/en/busca-de-publicacoes/-/publicacao/1041871/manejo-da-irrigacao-localizada-na-cultura-do-coqueiro-anao-por-meio-de-tensiometria (accessed on 2 October 2020).
  18. Cintra, F.L.D.; Resende, R.S.; Leal, M.L.S.; Portela, J.C. Efeito de volumes de água de irrigação no regime hídrico de solo coeso dos tabuleiros e na produção de coqueiro. Rev. Bras. Ciênc. Solo 2009, 33, 1041–1051. [Google Scholar] [CrossRef] [Green Version]
  19. Allen, R.G.; Pereira, L.S.; RAES, D.; Smith, M. Crop evapotranspiration: Guidelines for computing crop water requirements. FAO, Irrigation and Drainage Paper 56. Fao Rome 1998, 300, D05109. [Google Scholar]
  20. Gondim, R.S.; Muniz, C.R.; Lima, C.E.P.; dos Santos, C.L.A. Explaining the water-holding capacity of biochar by scanning electron microscope images. Rev. Caatinga 2018, 31, 972–979. [Google Scholar] [CrossRef] [Green Version]
  21. Pimenta, A.S.; Miranda, N.d.O.; de Carvalho, M.A.B.; da Silva, G.G.C.; Oliveira, E.M.M. Effects of biochar addition on chemical properties of a sandy soil from northeast Brazil. Arab. J. Geosci. 2019, 12, 70. [Google Scholar] [CrossRef]
  22. Amonettte, J.E.; Joseph, S. Characteristics of biochar: Microchemical properties. In Biochar for Environmental Management; Lehmann, J., Joseph, S., Eds.; Earthscan: London, UK, 2009; pp. 33–52. [Google Scholar]
  23. Joseph, S.; Willigen, P. Developing a biochar classification and test methods. In Biochar for Environmental Management; Lehmann, J., Joseph, S., Eds.; Earthscan: London, UK, 2009; pp. 107–126. [Google Scholar]
  24. Silva, A.R.A.; Bezerra, F.M.L.; Lacerda, C.F.; Araújo, M.E.B.; de Lima, R.M.M.; Sousa, C.H.C. Establishment of young “dwarf green” coconut plants in soil affected by salts and under water deficit. Rev. Bras. Fruticult. 2016, 38, e-206. [Google Scholar] [CrossRef]
  25. Lima, B.L.C.; Lacerda, C.L.F.; Neto, M.F.; Ferreira, J.F.S.; Bezerra, A.M.E.; Marques, E.C. Physiological and ionic changes in dwarf coconut seedlings irrigated with saline water. Rev. Bras. Eng. Agrícola Ambient. 2017, 21, 121–127. [Google Scholar] [CrossRef] [Green Version]
  26. Silva, A.R.A.; Bezerra, F.M.L.; Lacerda, C.F.; Sousa, C.H.C.; Bezerra, M.A. Physiological responses of dwarf coconut plants under water deficit in salt-affected soils. Rev. Caatinga 2017, 30, 447–457. [Google Scholar] [CrossRef] [Green Version]
  27. Fernandes, J.D.; Chaves, L.H.G.; Mendes, J.S.; Chaves, I.B.; Tito, G.A. Alterations in soil salinity with the use of different biochar doses. Rev. Ciências Agrárias 2019, 42, 89–98. [Google Scholar] [CrossRef]
  28. Han, F.; Ren, L.; Zhang, X.-H. Effect of biochar on the soil nutrients about different grasslands in the Loess Plateau. Catena 2016, 137, 554–562. [Google Scholar] [CrossRef]
  29. Basavaraju, T.B.; Bhagya, H.P.; Prashanth, M.; Arulraj, S.; Maheswarappa, H.P. Effect of fertigation on the productivity of coconut. J. Plant. Crops 2014, 14, 198–204. [Google Scholar]
  30. Jayakumar, M.; Janapriya, C.; Surendran, M. Effect of drip fertigation and polythene mulching on growth and productivity of coconut (Cocos nucifera L.), water, nutrient use efficiency and economic benefits. Agric. Water Manag. 2017, 182, 87–93. [Google Scholar] [CrossRef]
  31. Gondim, R.S.; Serrano, L.A.L.; Maia, A.d.H.N.; da Silva, J.P. Hydrophilic polymer changes the water demand in the implementation of a dwarf cashew orchard. Rev. Eng. Agrícola 2020, 40, 344–351. [Google Scholar] [CrossRef]
  32. Schulz, H.; Dust, G.; Glaser, B. Positive effects of composted biochar on plant growth and soil fertility. Agron. Sustain. Dev. 2013, 33, 817–827. [Google Scholar] [CrossRef] [Green Version]
  33. Azevedo, P.V.; Sousa, I.F.; Silva, B.B.; Silva, V.P.R. Water-use efficiency of dwarf-green coconut (Cocos nucifera L.) orchards in northeast Brazil. Agric. Water Manag. 2006, 84, 259–264. [Google Scholar] [CrossRef]
  34. Lim, T.J.; Spokas, K.A.; Feyereisen, G.; Novak, J.M. Predicting the impact of biochar additions on soil hydraulic properties. Cremosphere 2016, 142, 136–144. [Google Scholar] [CrossRef]
  35. Villagra-Mendoza, K.; Horn, R. Effect of biochar addition on hydraulic functions of two textural soil. Geoderma 2018, 326, 88–95. [Google Scholar] [CrossRef]
Figure 1. Monthly rainfall and Penman-Monteith/FAO reference evapotranspiration during the period of the experiment at the experimental site.
Atmosphere 13 00051 g001
Figure 2. Images of biochar from sun-dried green coconut husk, obtained by scanning electron microscopy, brand Tescan, model Vega 3. (a) Epicarp of the fruit with details of the sclerenchyma, very fibrous and rich in recesses. (b). Fruit mesocarp showing parenchyma with plant cells of different sizes. (c) Longitudinal sections of the vascular cambium of the mesocarp, showing long, juxtaposed, thick-walled vessels. (d) Vessel bundle in the cross-section, with details for highly lignified vessels.
Atmosphere 13 00051 g002aAtmosphere 13 00051 g002b
Figure 3. Regression model (y = 0.05409x2 + 0.51586x + 34.32; R2 = 0.9152; p = 0.02.) to describe the relationship between treatments (T1—0.0 kg; T2—0.5 kg; T3—1.0 kg; T4—2.0 kg; and T5—4.0 kg of biochar per plant) and two-year average daily soil water storage in the 0.0 to 0.3 m layer of the soil profile in Paraipaba, CE, Brazil.
Atmosphere 13 00051 g003
Figure 4. Adjusted linear model (R2 = 0.70; p = 0.075) to describe the relationship between treatments (T1—0.0 kg; T2—0.5 kg; T3—1.0 kg; T4—2.0 kg; and T5—4.0 kg of biochar per plant) and log accumulated water volume applied per plant (L) in 2017 and 2018, Paraipaba (CE), Brazil.
Atmosphere 13 00051 g004
Table 1. Parameters of the van Genuchten equation for a soil depth of 0.15 m, Paraipaba-CE, Brazil.
Parameters
θs0.3916
θr0.0450
α0.4072
n2.8803
m0.6528
Table 2. Chemical composition of sun-dried green coconut husk biochar.
NPMgNaSKCuFeZnMnCOTpHEC
(g kg−1)(mg kg−1)(%) dS m−1
5.50.72.17.10.530.05.0347151350.17.154.01
Table 3. Means of soil chemical attributes 2 years after application of sun-dried green coconut husk biochar.
Soil Layer (cm)0–20CV * (%)20–40CV * (%)
Treatments (kg Plant−1)0.00.51.02.04.00.00.51.02.04.0
pH ns 5.65.45.65.55.35.25.75.45.45.05.08.7
EC nsdS m−11.93.42.62.52.327.72.22.62.02.51.833.2
K+ nsmmolc dm−37.78.77.07.27.413.66.76.26.76.06.019.5
Ca++ nsmmolc dm−314.211.614.013.813.220.911.08.09.88.68.137.2
Mg++ nsmmolc dm−39.99.011.59.09.317.85.45.66.14.85.329.7
Na+ nsmmolc dm−31.91.51.31.92.246.32.62.02.82.32.533.0
Log (Al3+) nsmmolc dm−31.71.51.61.61.610.30.90.70.70.90.628.9
H + Al nsmmolc dm−315.111.316.015.616.026.712.412.613.913.717.023.2
CEC nsmmolc dm−348.842.149.847.548.115.838.134.439.335.438.918.7
SB nsmmolc dm−333.730.833.831.932.114.525.721.825.421.721.923.9
SAR ns%0.400.220.240.380.4644.60.660.560.700.640.7036.7
V ns%69736867677.7676365615612.3
ns: There is no significant evidence of the dose-effect by the F test (p > 0.05). * Coefficient of variation of the experiment.
Table 4. Plant development biometric variables, 750 days after planting.
TreatmentsLeaf NumberPlant Height
(m)
Stem
Diameter
(cm)
Number of Leaflets in the 14th Emitted LeafCanopy Diameter
(m)
T116.1 a4.7 a25.2 a145.2 a4.3 a
T217.4 a5.1 a25.3 a150.8 a4.7 a
T316.7 a4.9 a25.5 a152.3 a4.7 a
T418.1 a5.0 a25.2 a153.0 a4.8 a
T516.2 a4.4 a24.7 a143.9 a4.3 a
CV * (%)9.47.55.24.25.8
T1—0.0 kg; T2—0.5 kg; T3—1.0 kg; T4—2.0 kg; and T5—4.0 kg of biochar per plant. Means followed by the same letter do not present significant differences between them by the Tukey test (p > 0.05). * Coefficient of variation of the experiment.
Publisher’s Note: MDPI stays neutral with regard to jurisdictional claims in published maps and institutional affiliations.

