
Changes of Extreme Agro-Climatic Droughts and Their Impacts on Grain Yields in Rain-Fed Agricultural Regions in China over the Past 50 Years

Abstract
:1. Introduction
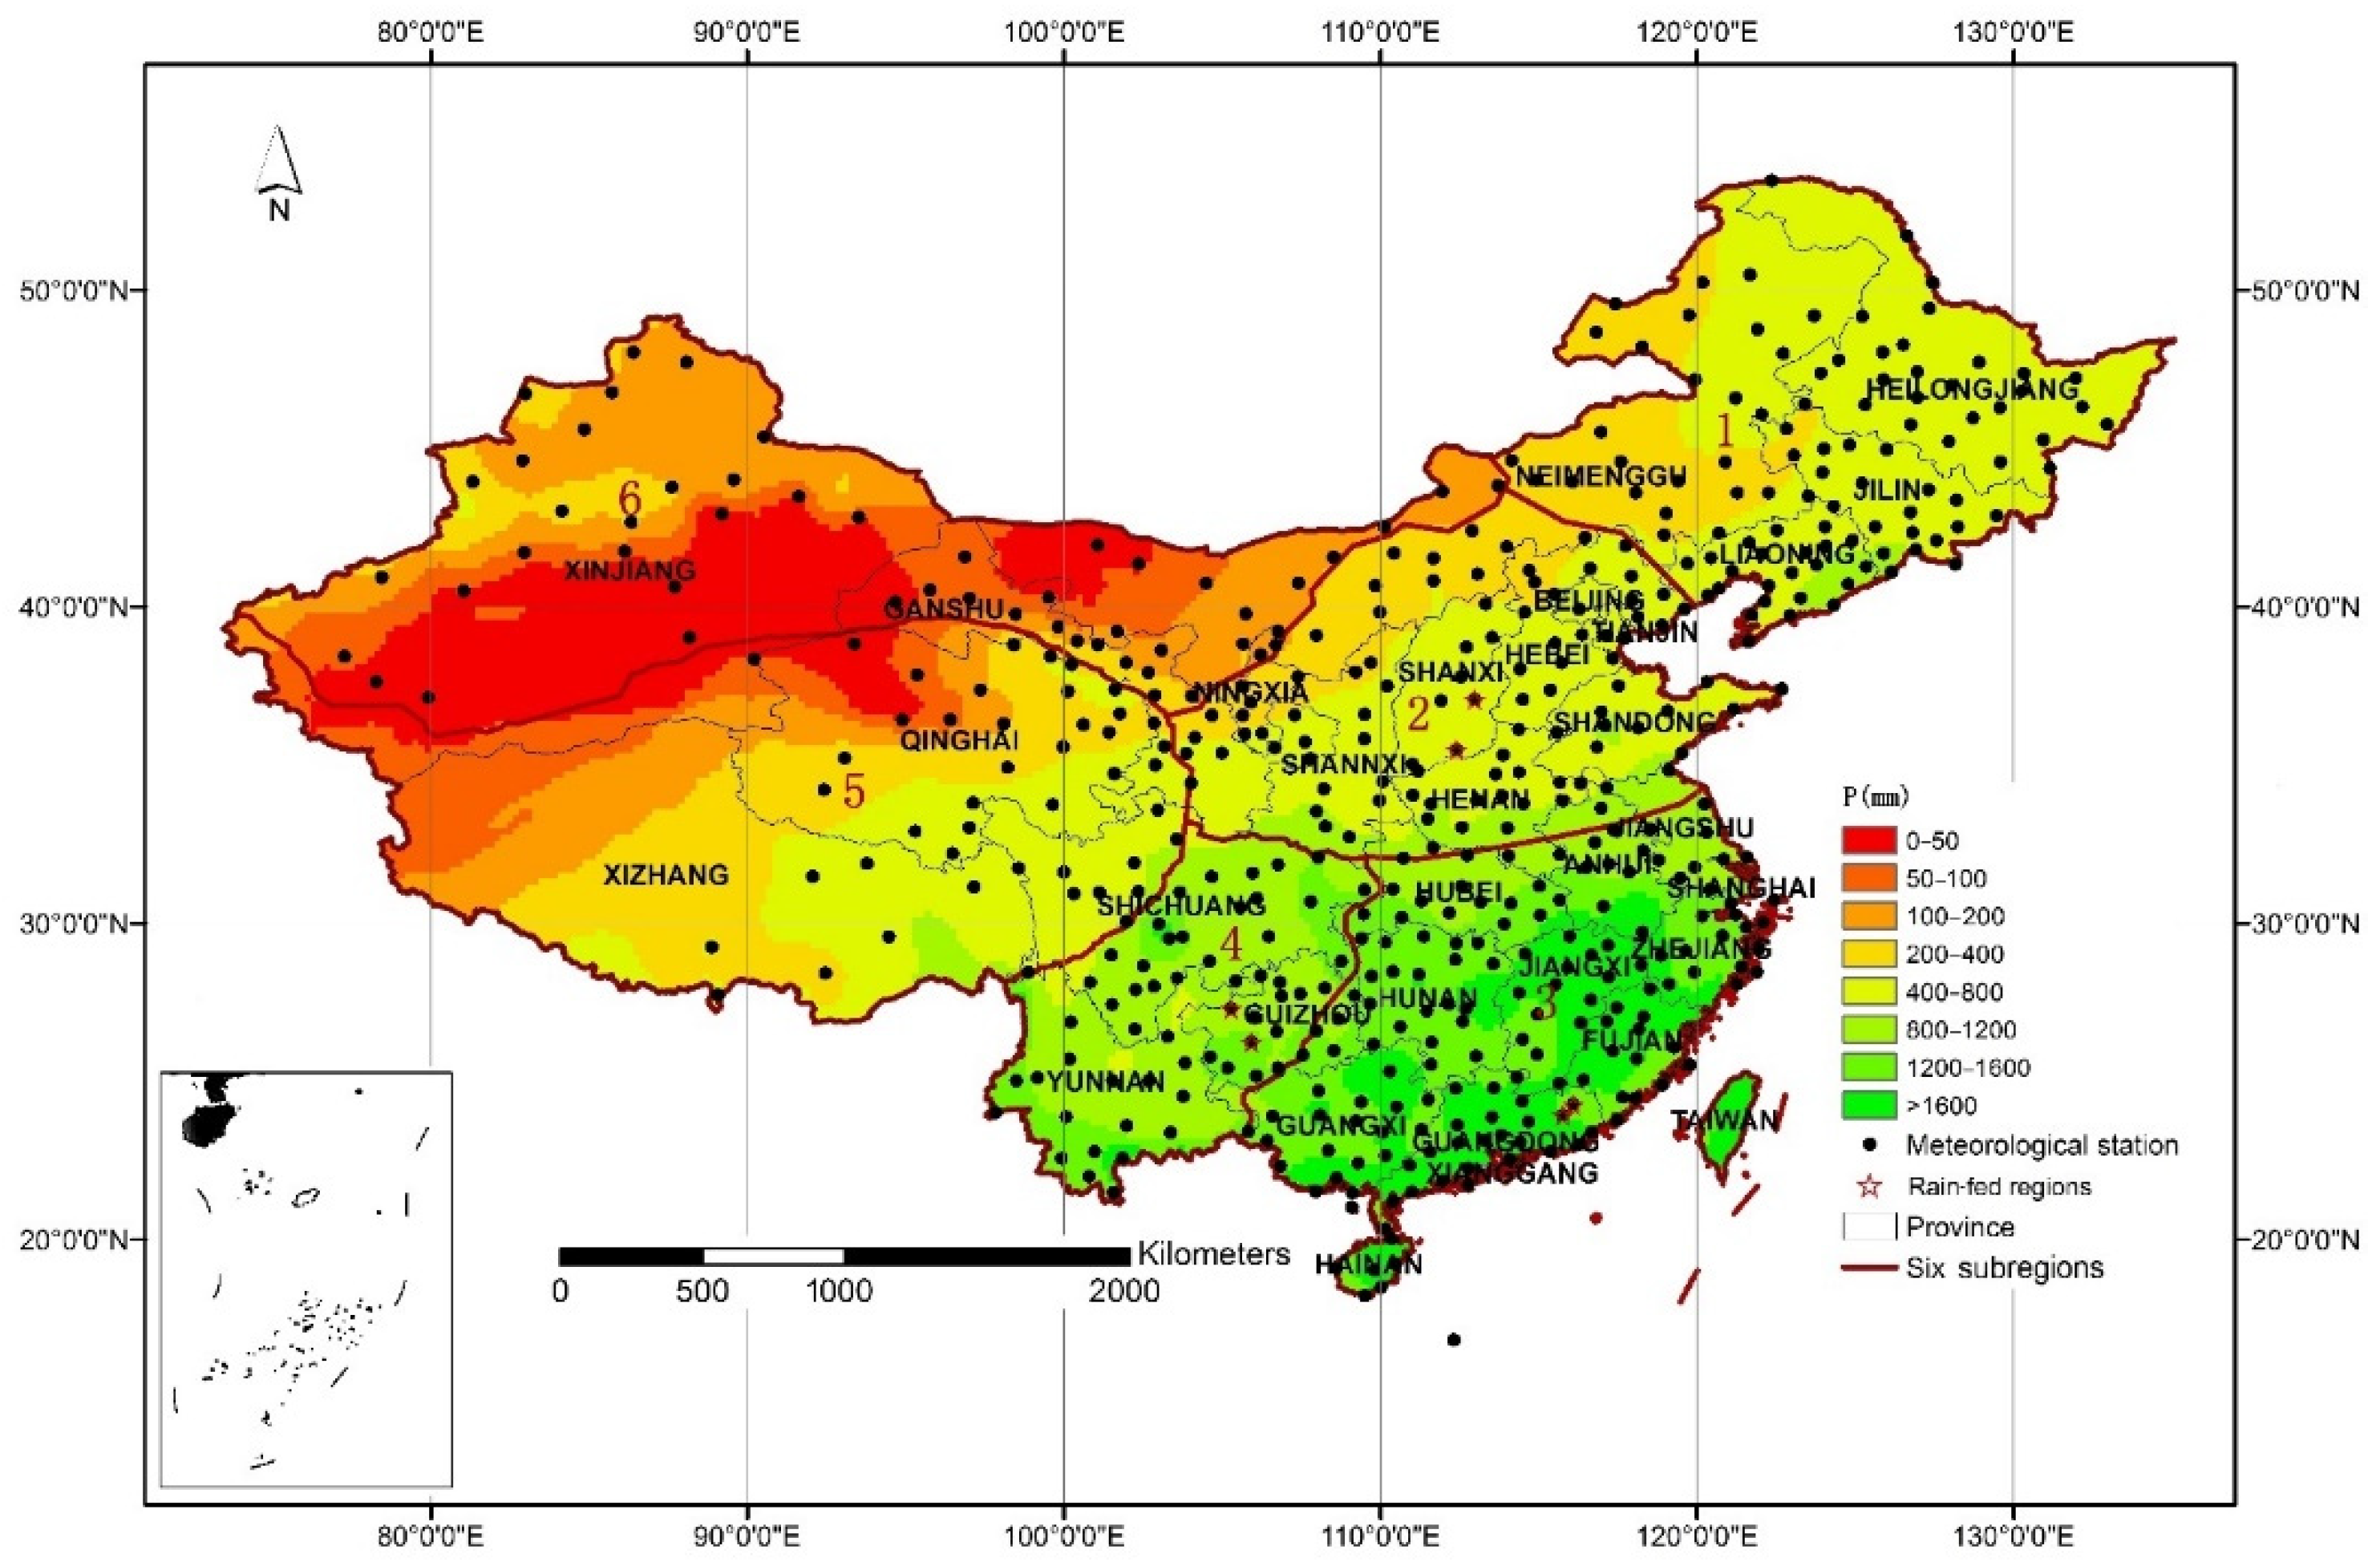
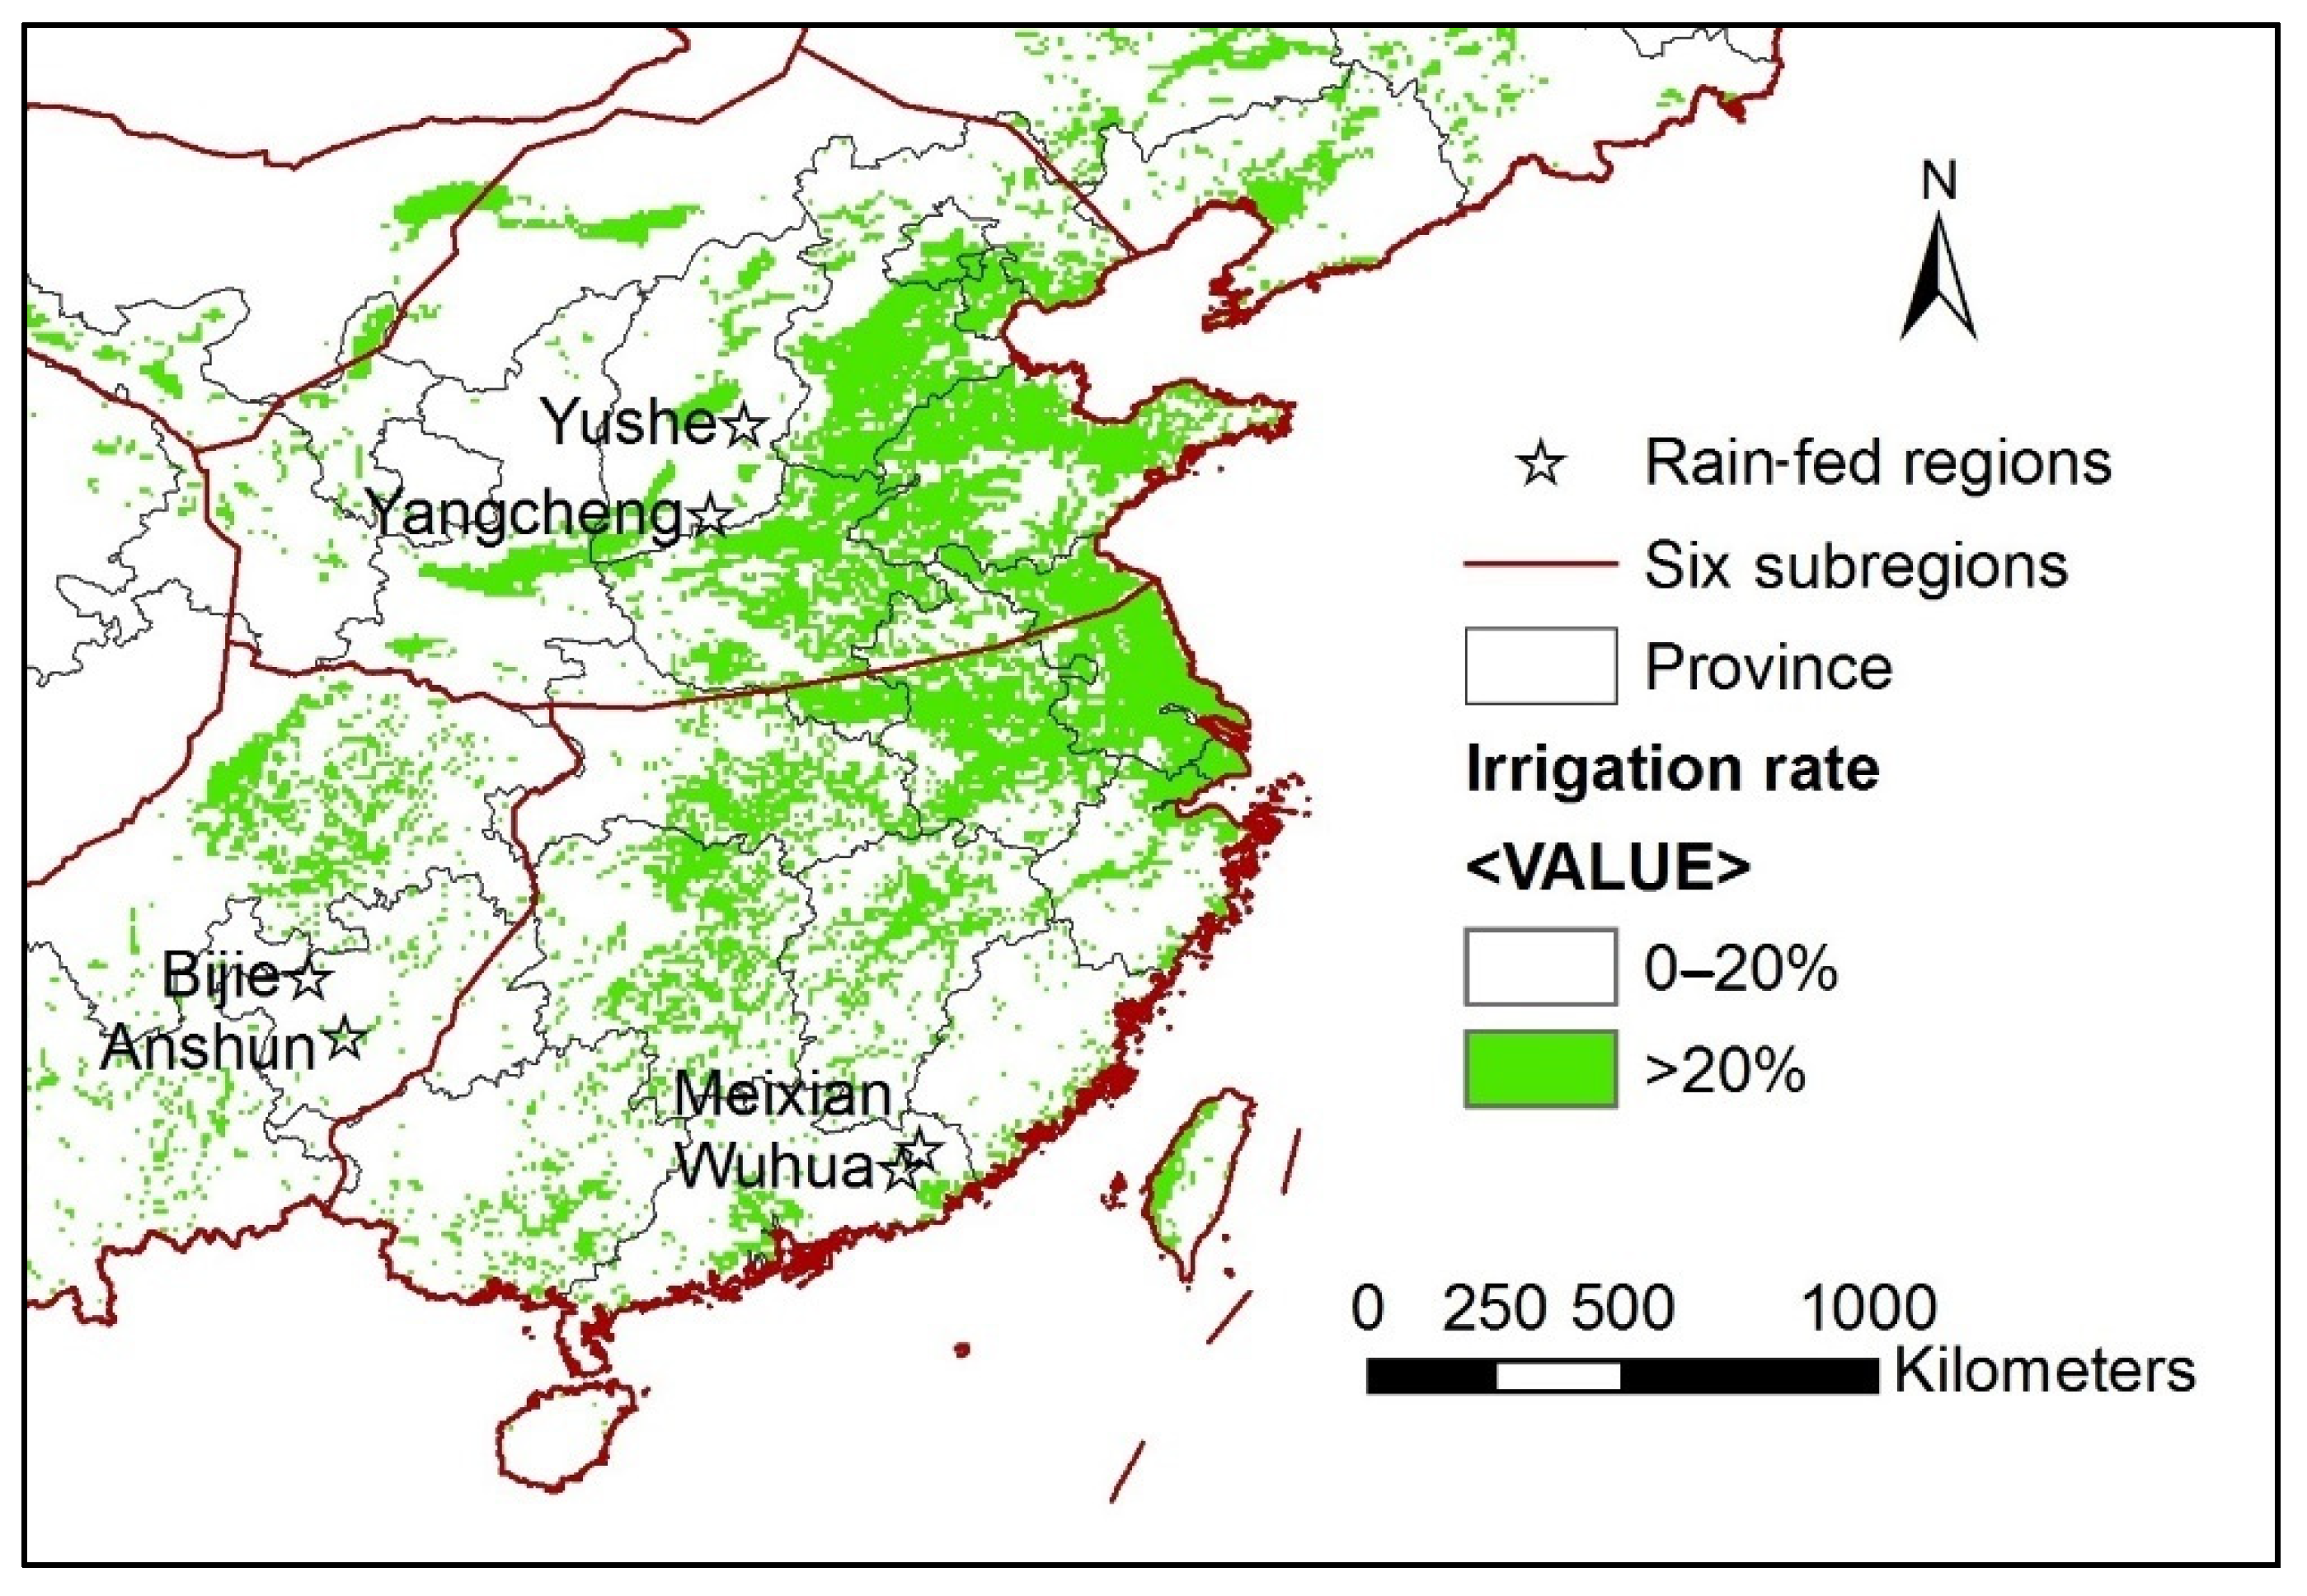
2. Study Area
3. Data and Methods (Description of the EAD Threshold Model)
3.1. Data
3.2. Methods
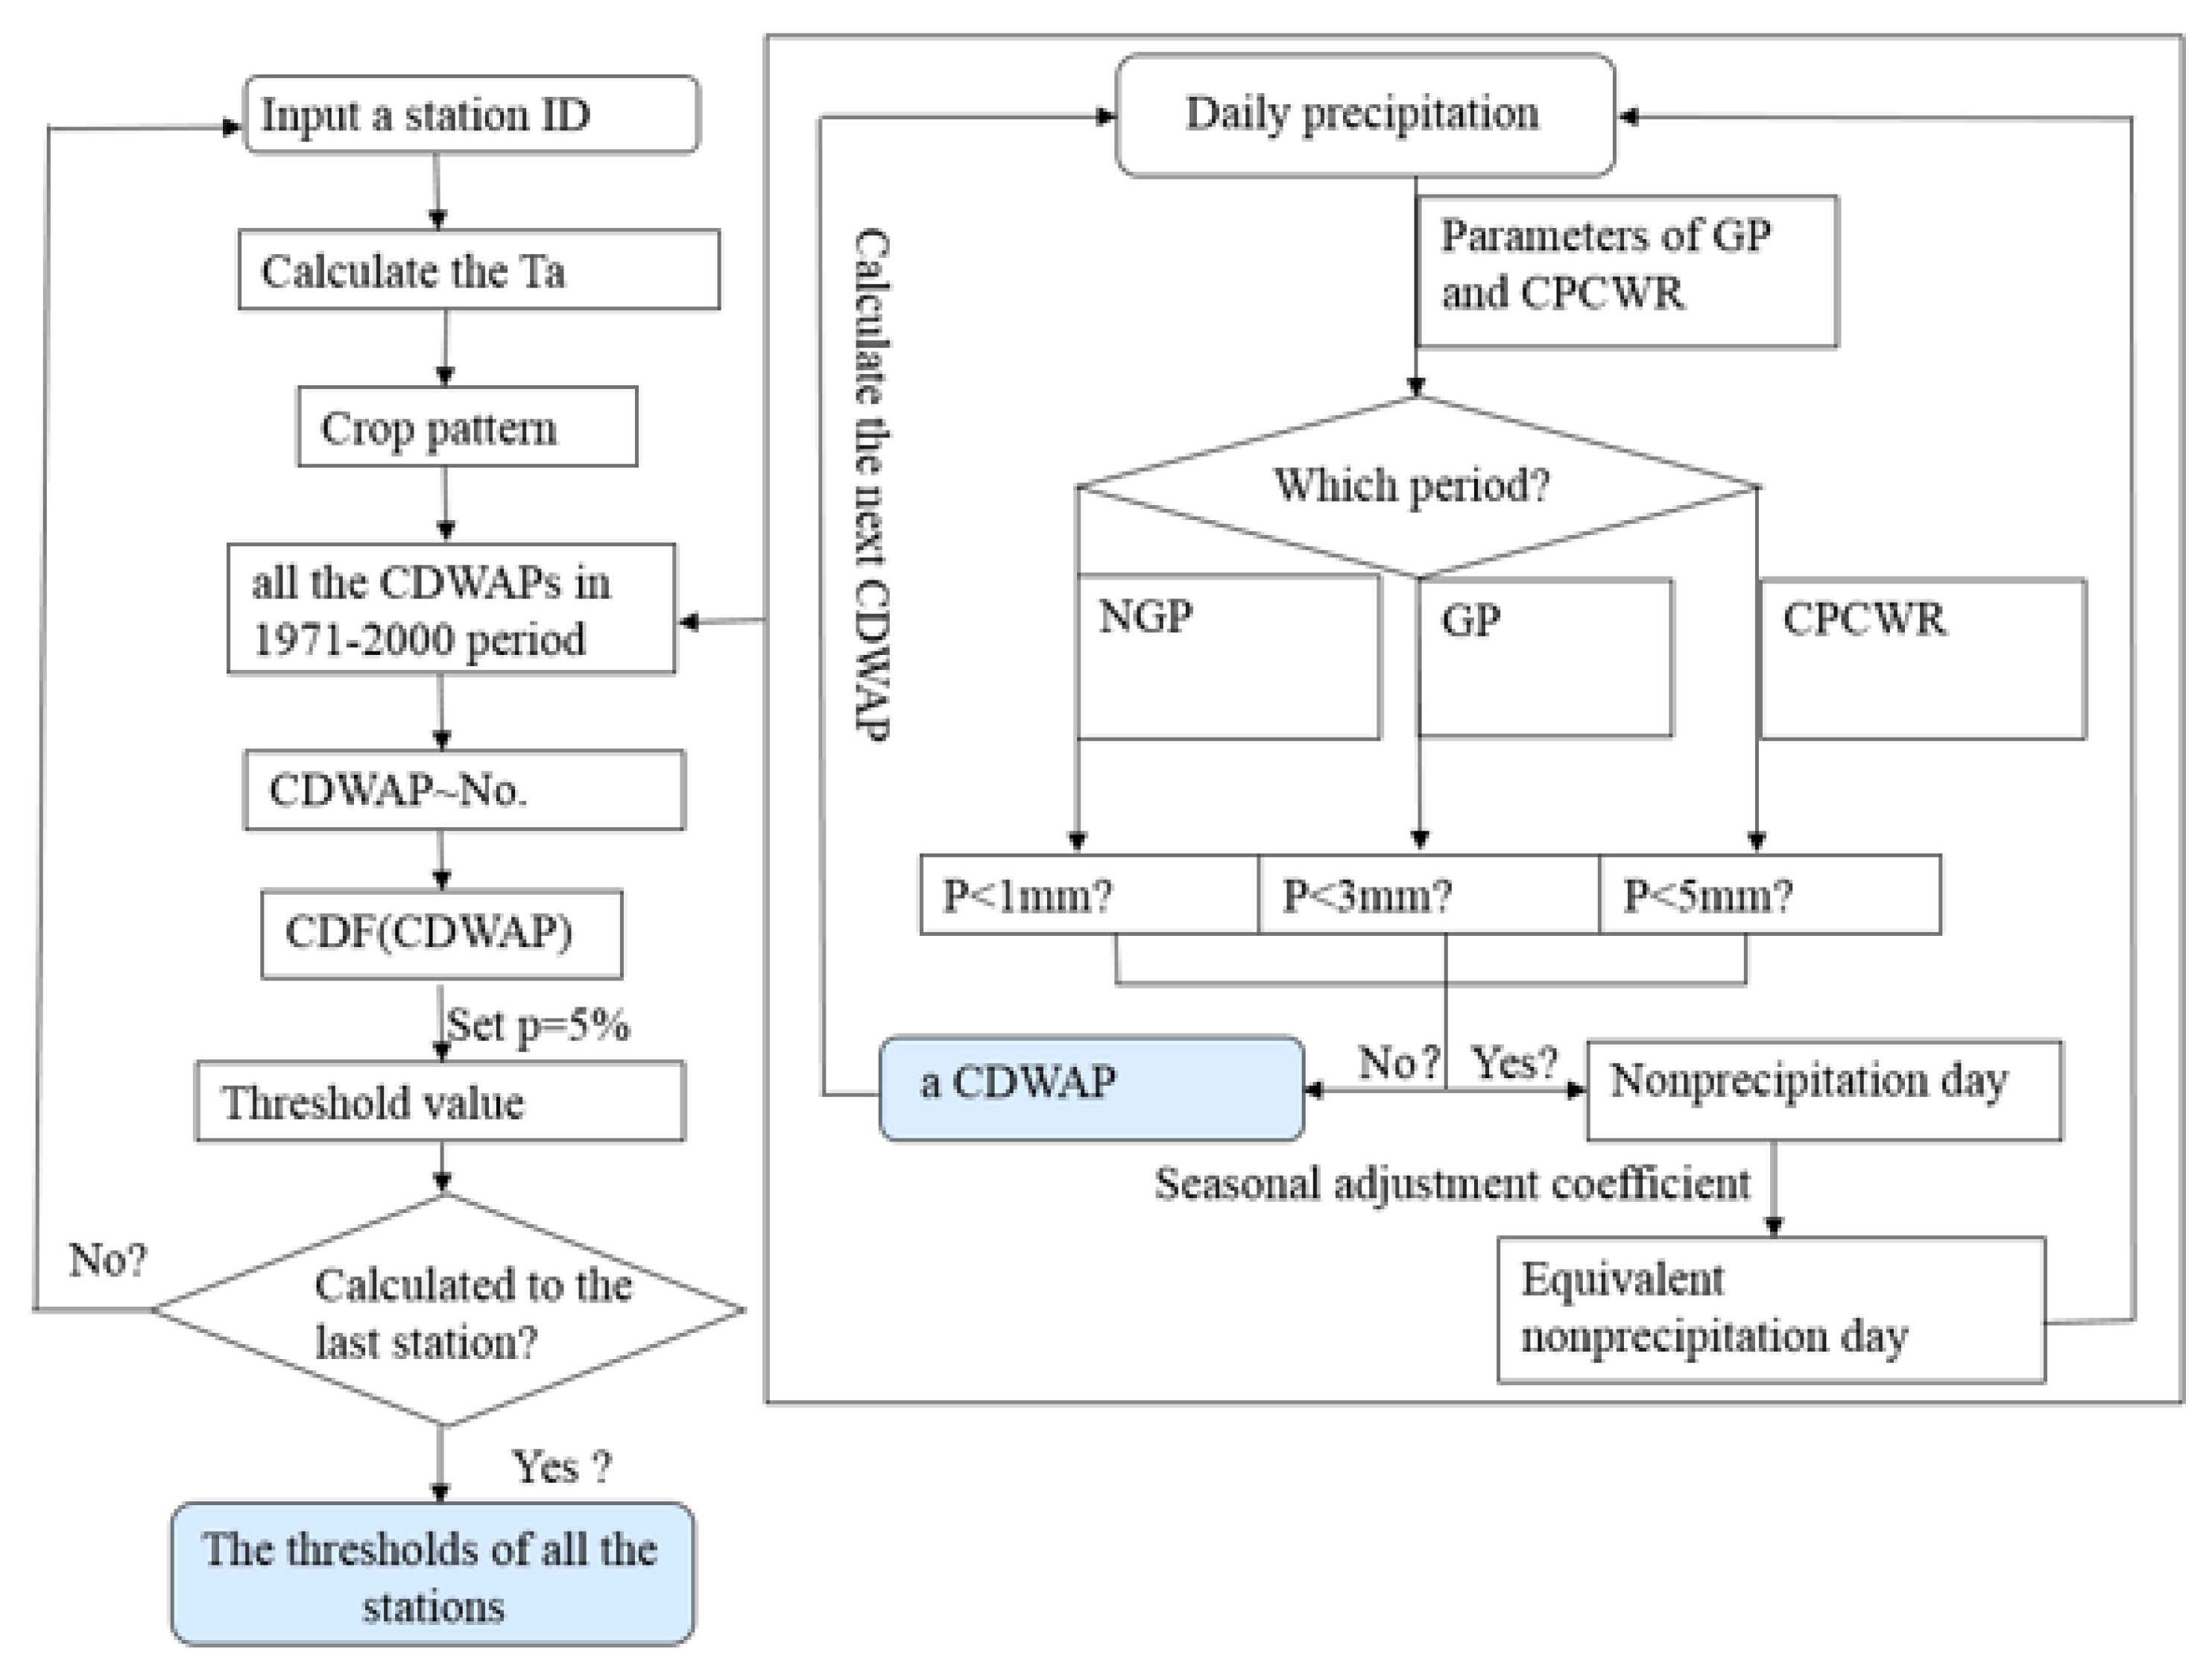
3.2.1. EAD Threshold Model
- Principle and structure of the model
- (1)
- The module used to select the agricultural drought index
- (2)
- The module used to identify crop types, cropping patterns, growing periods, and critical periods of crop water requirement
- (3)
- The module adopted to determine EAD thresholds using cumulative probability distribution functions
- 2.
- Calculation process of the EAD threshold model
3.2.2. Change-Point Analysis
3.2.3. Calculation of Climatic Yield
4. Results
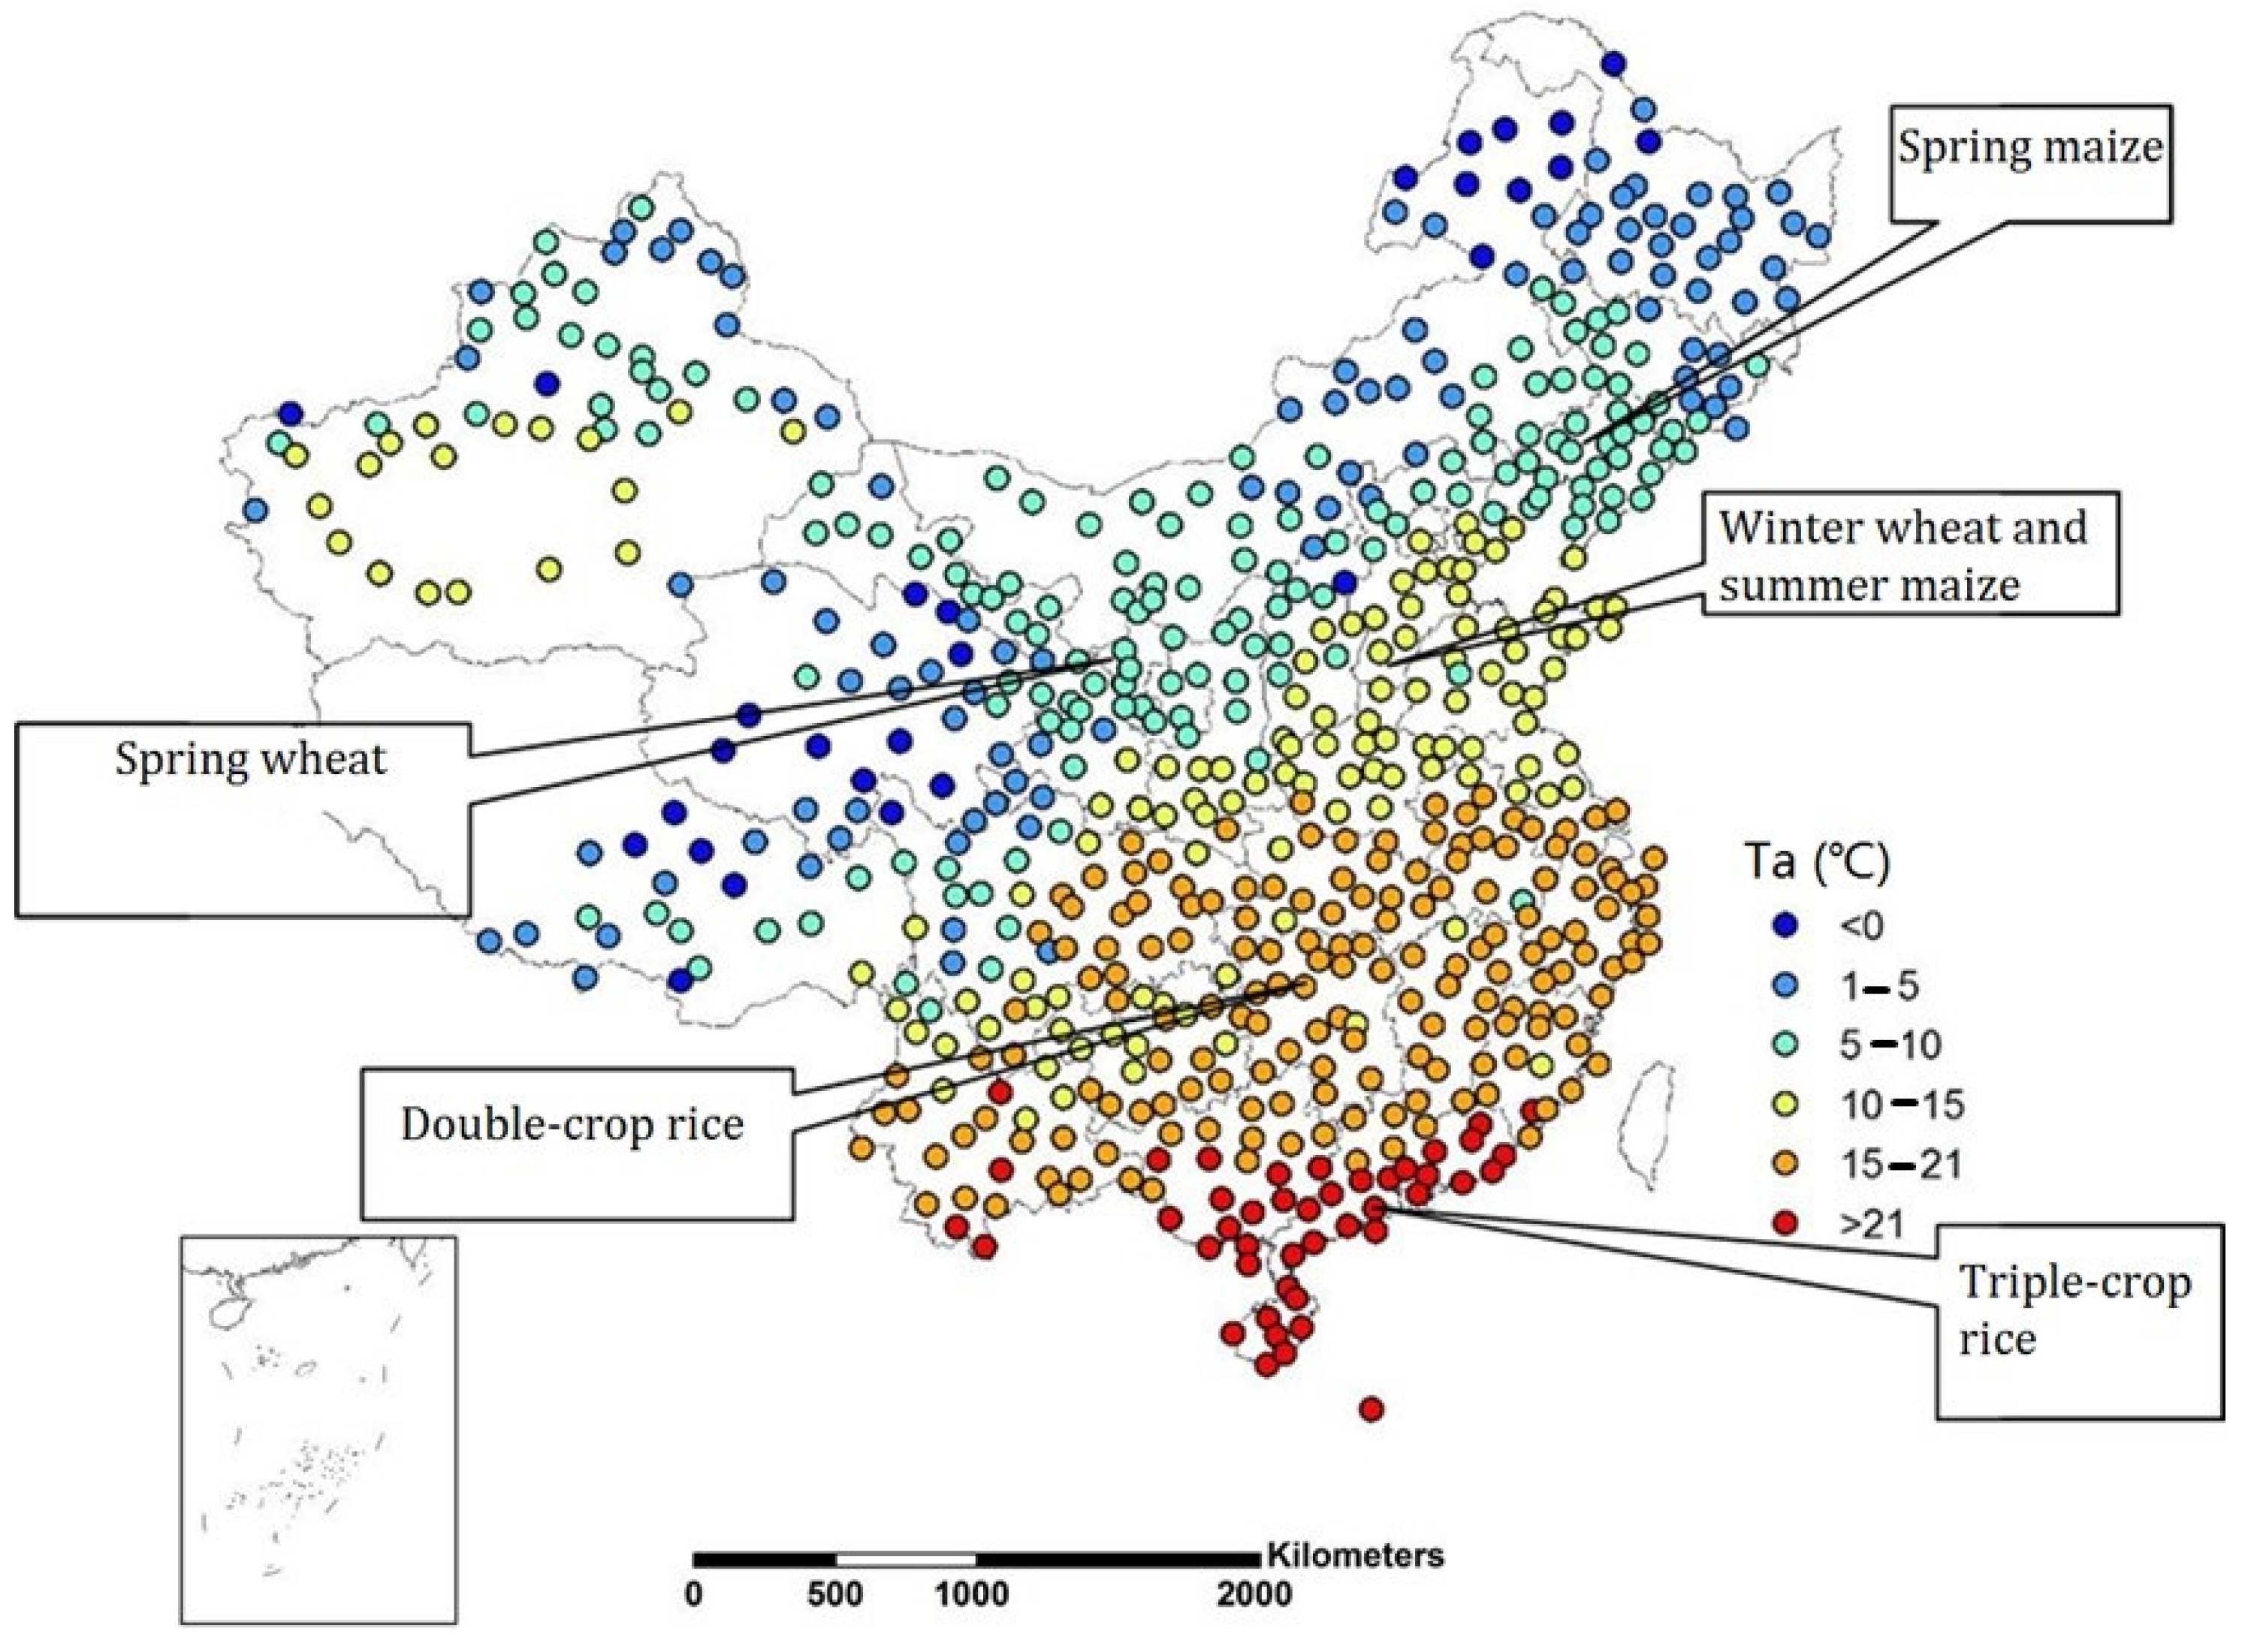
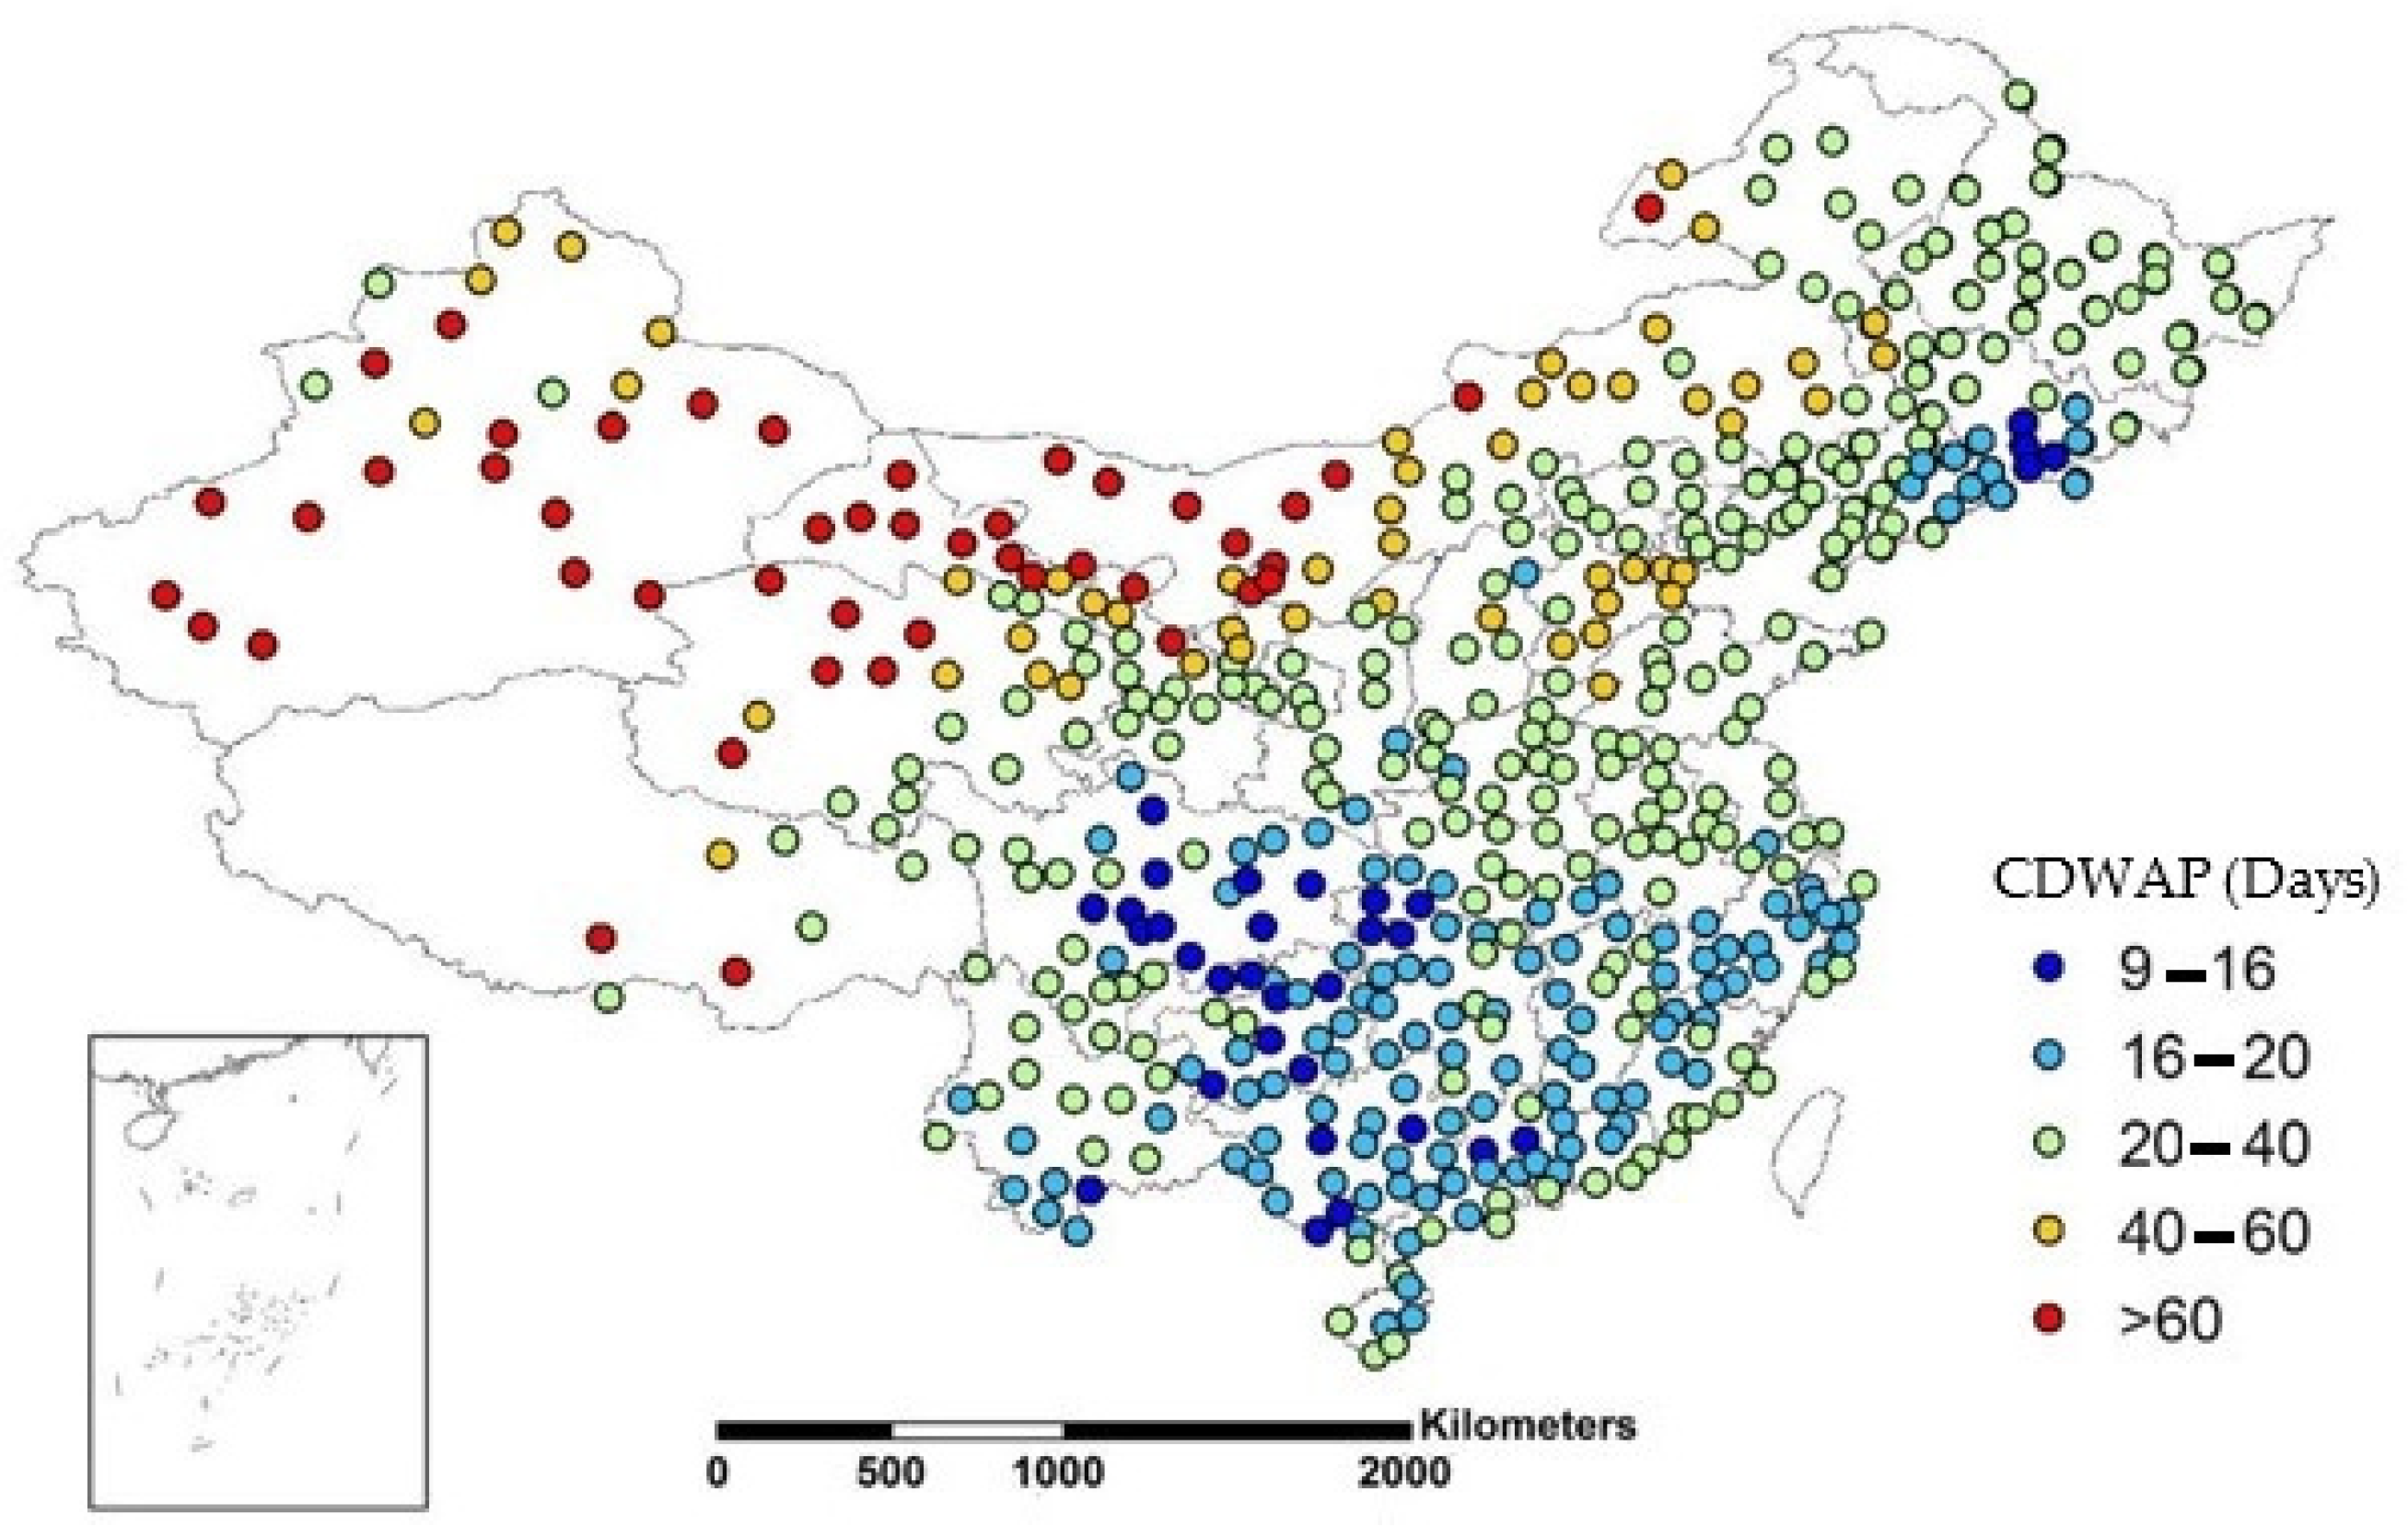
4.1. Spatial Pattern of EAD Thresholds
4.2. Spatial–Temporal Pattern of EAD Variation
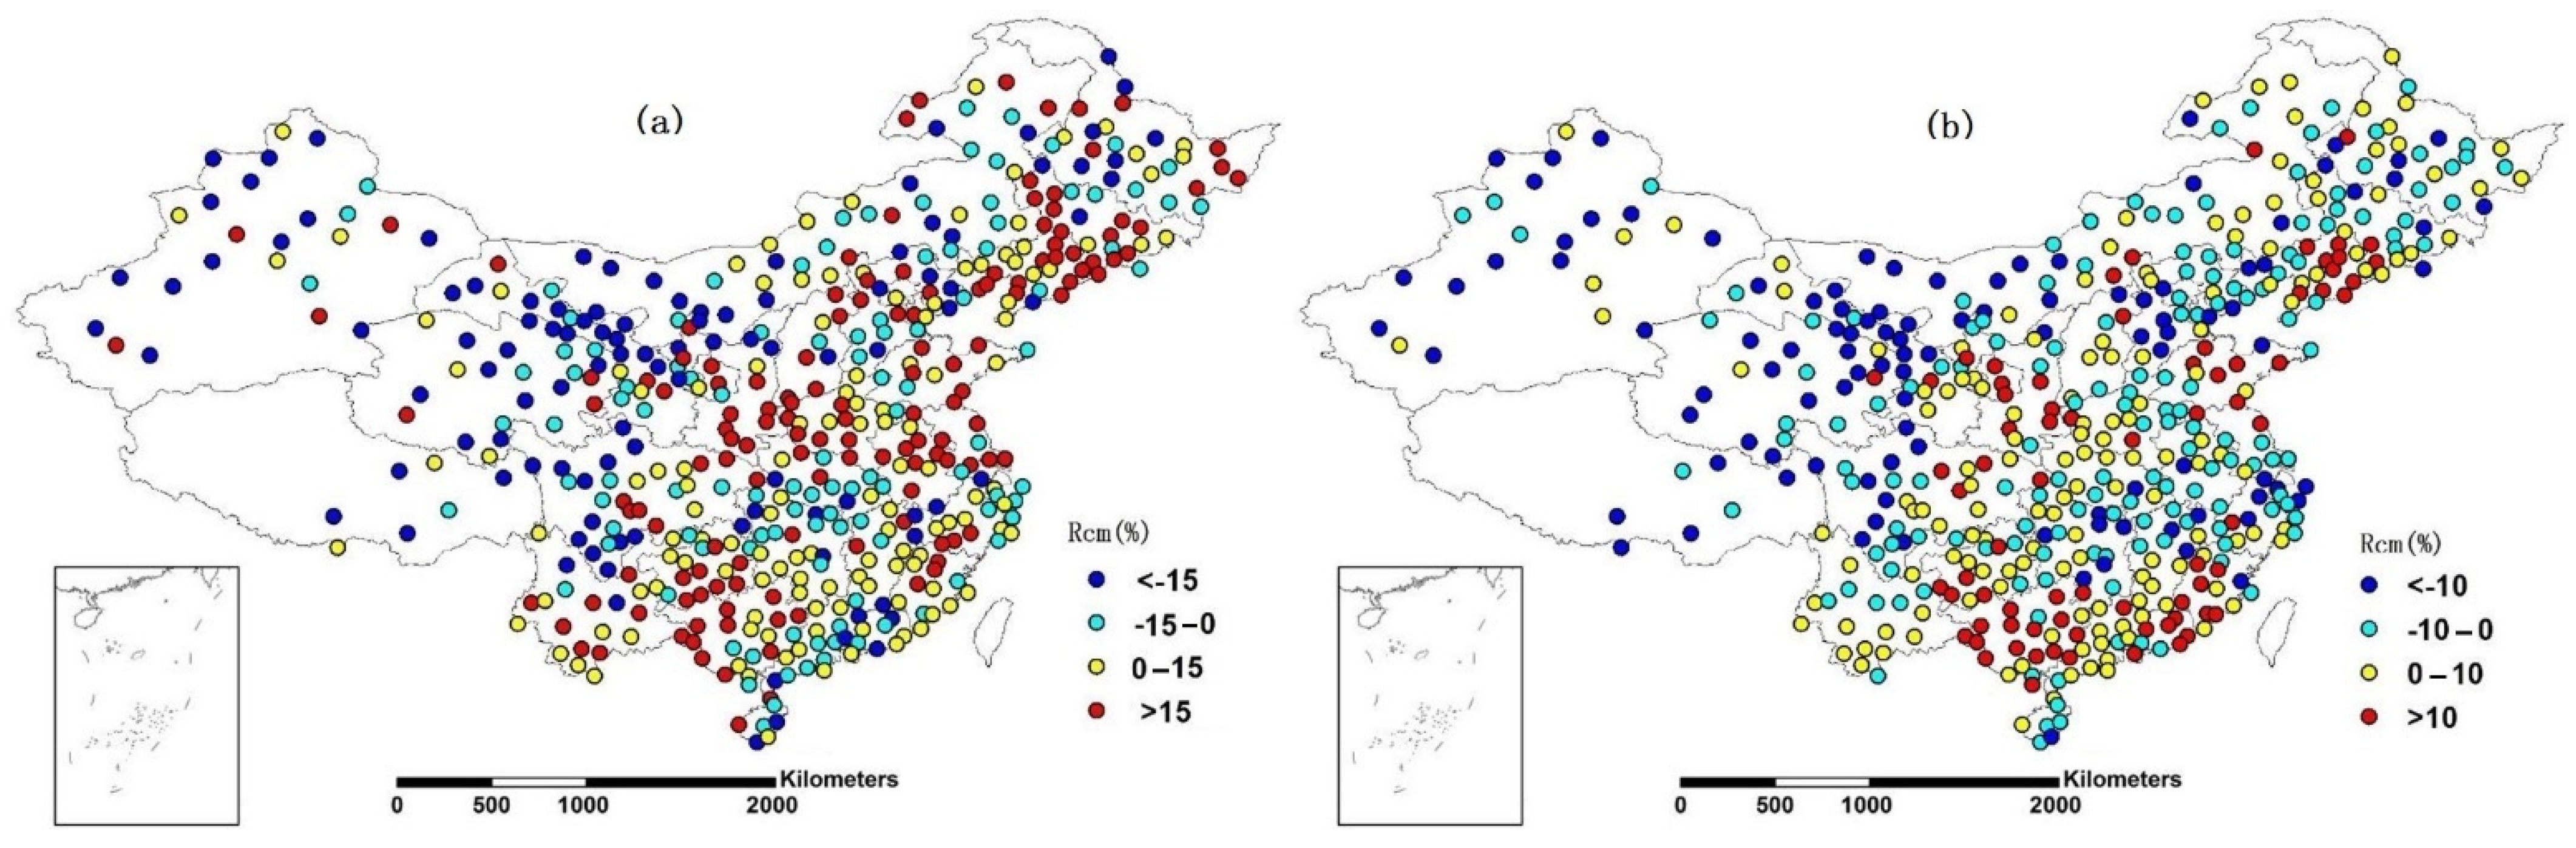
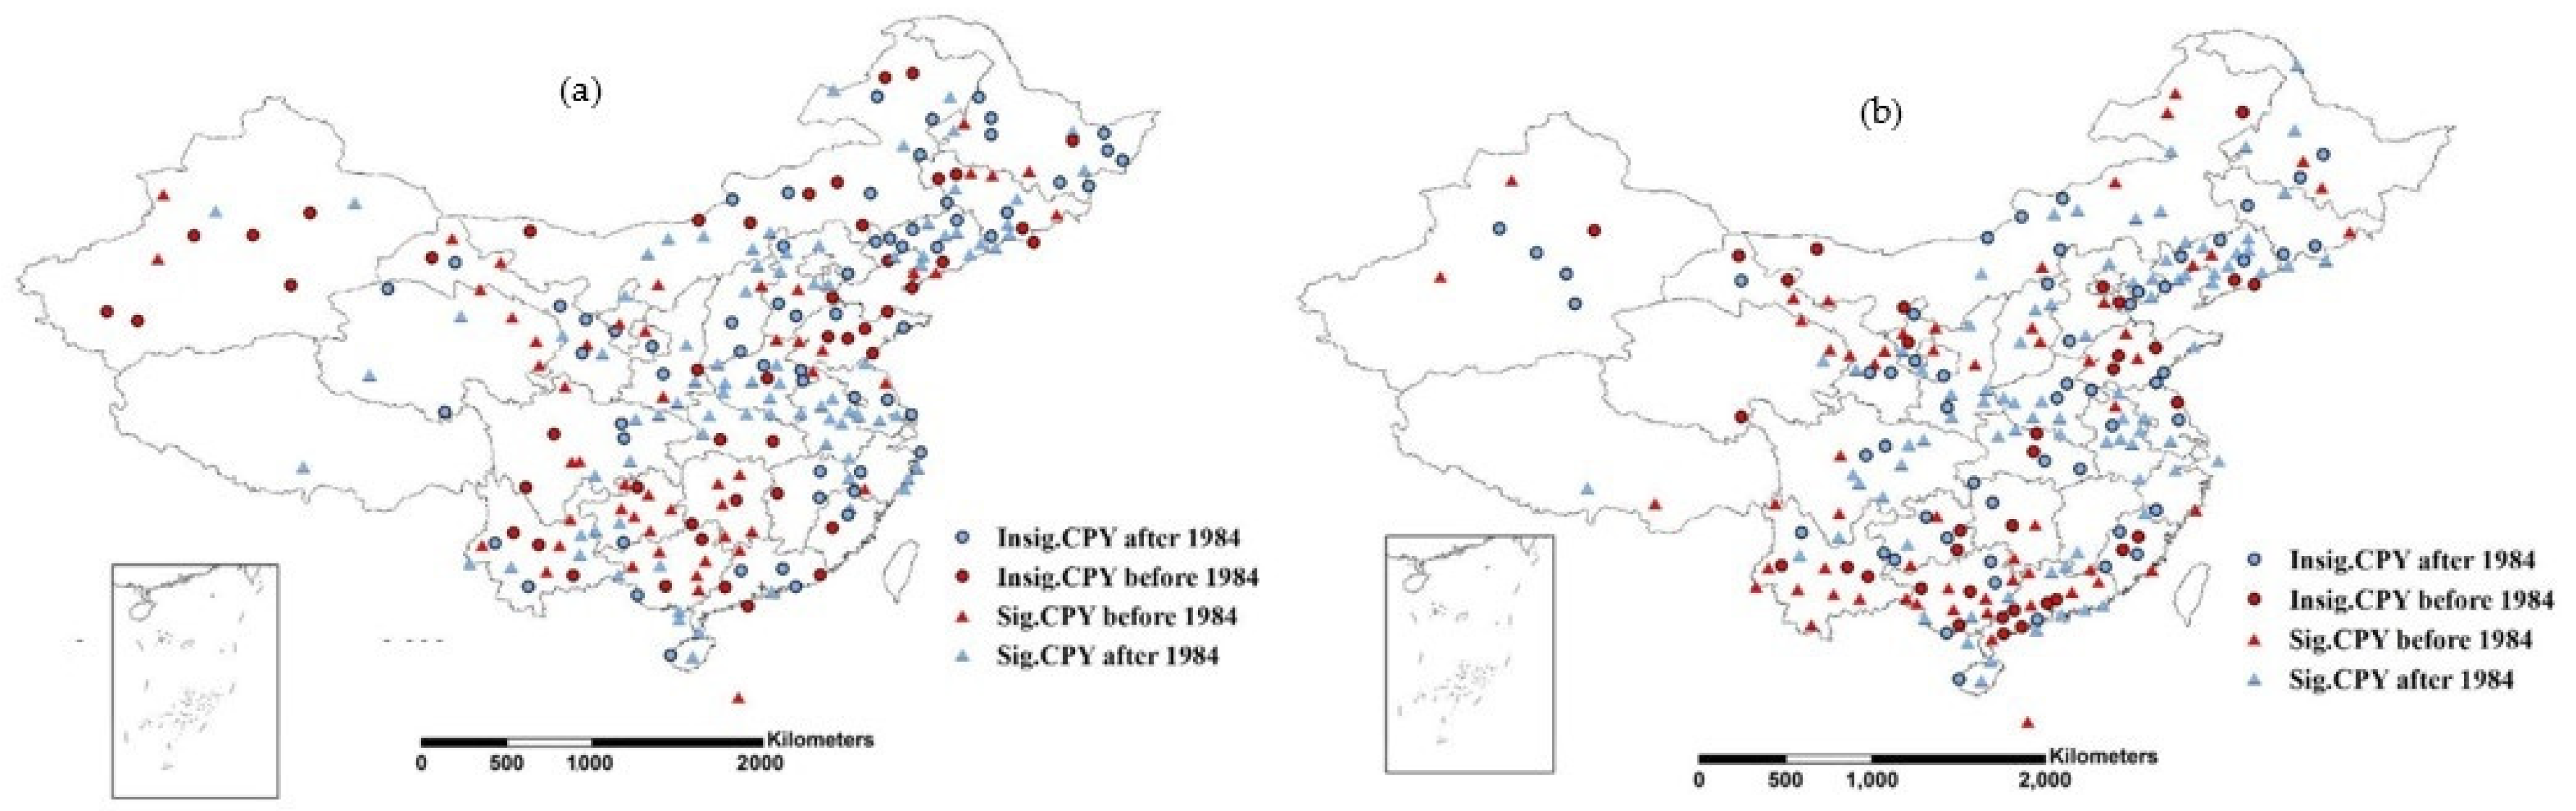
4.2.1. Station-Based Spatial Patterns of EAD Relative Change Rates
4.2.2. Spatial Patterns of Change-Point Years in Stations with Increasing EADs
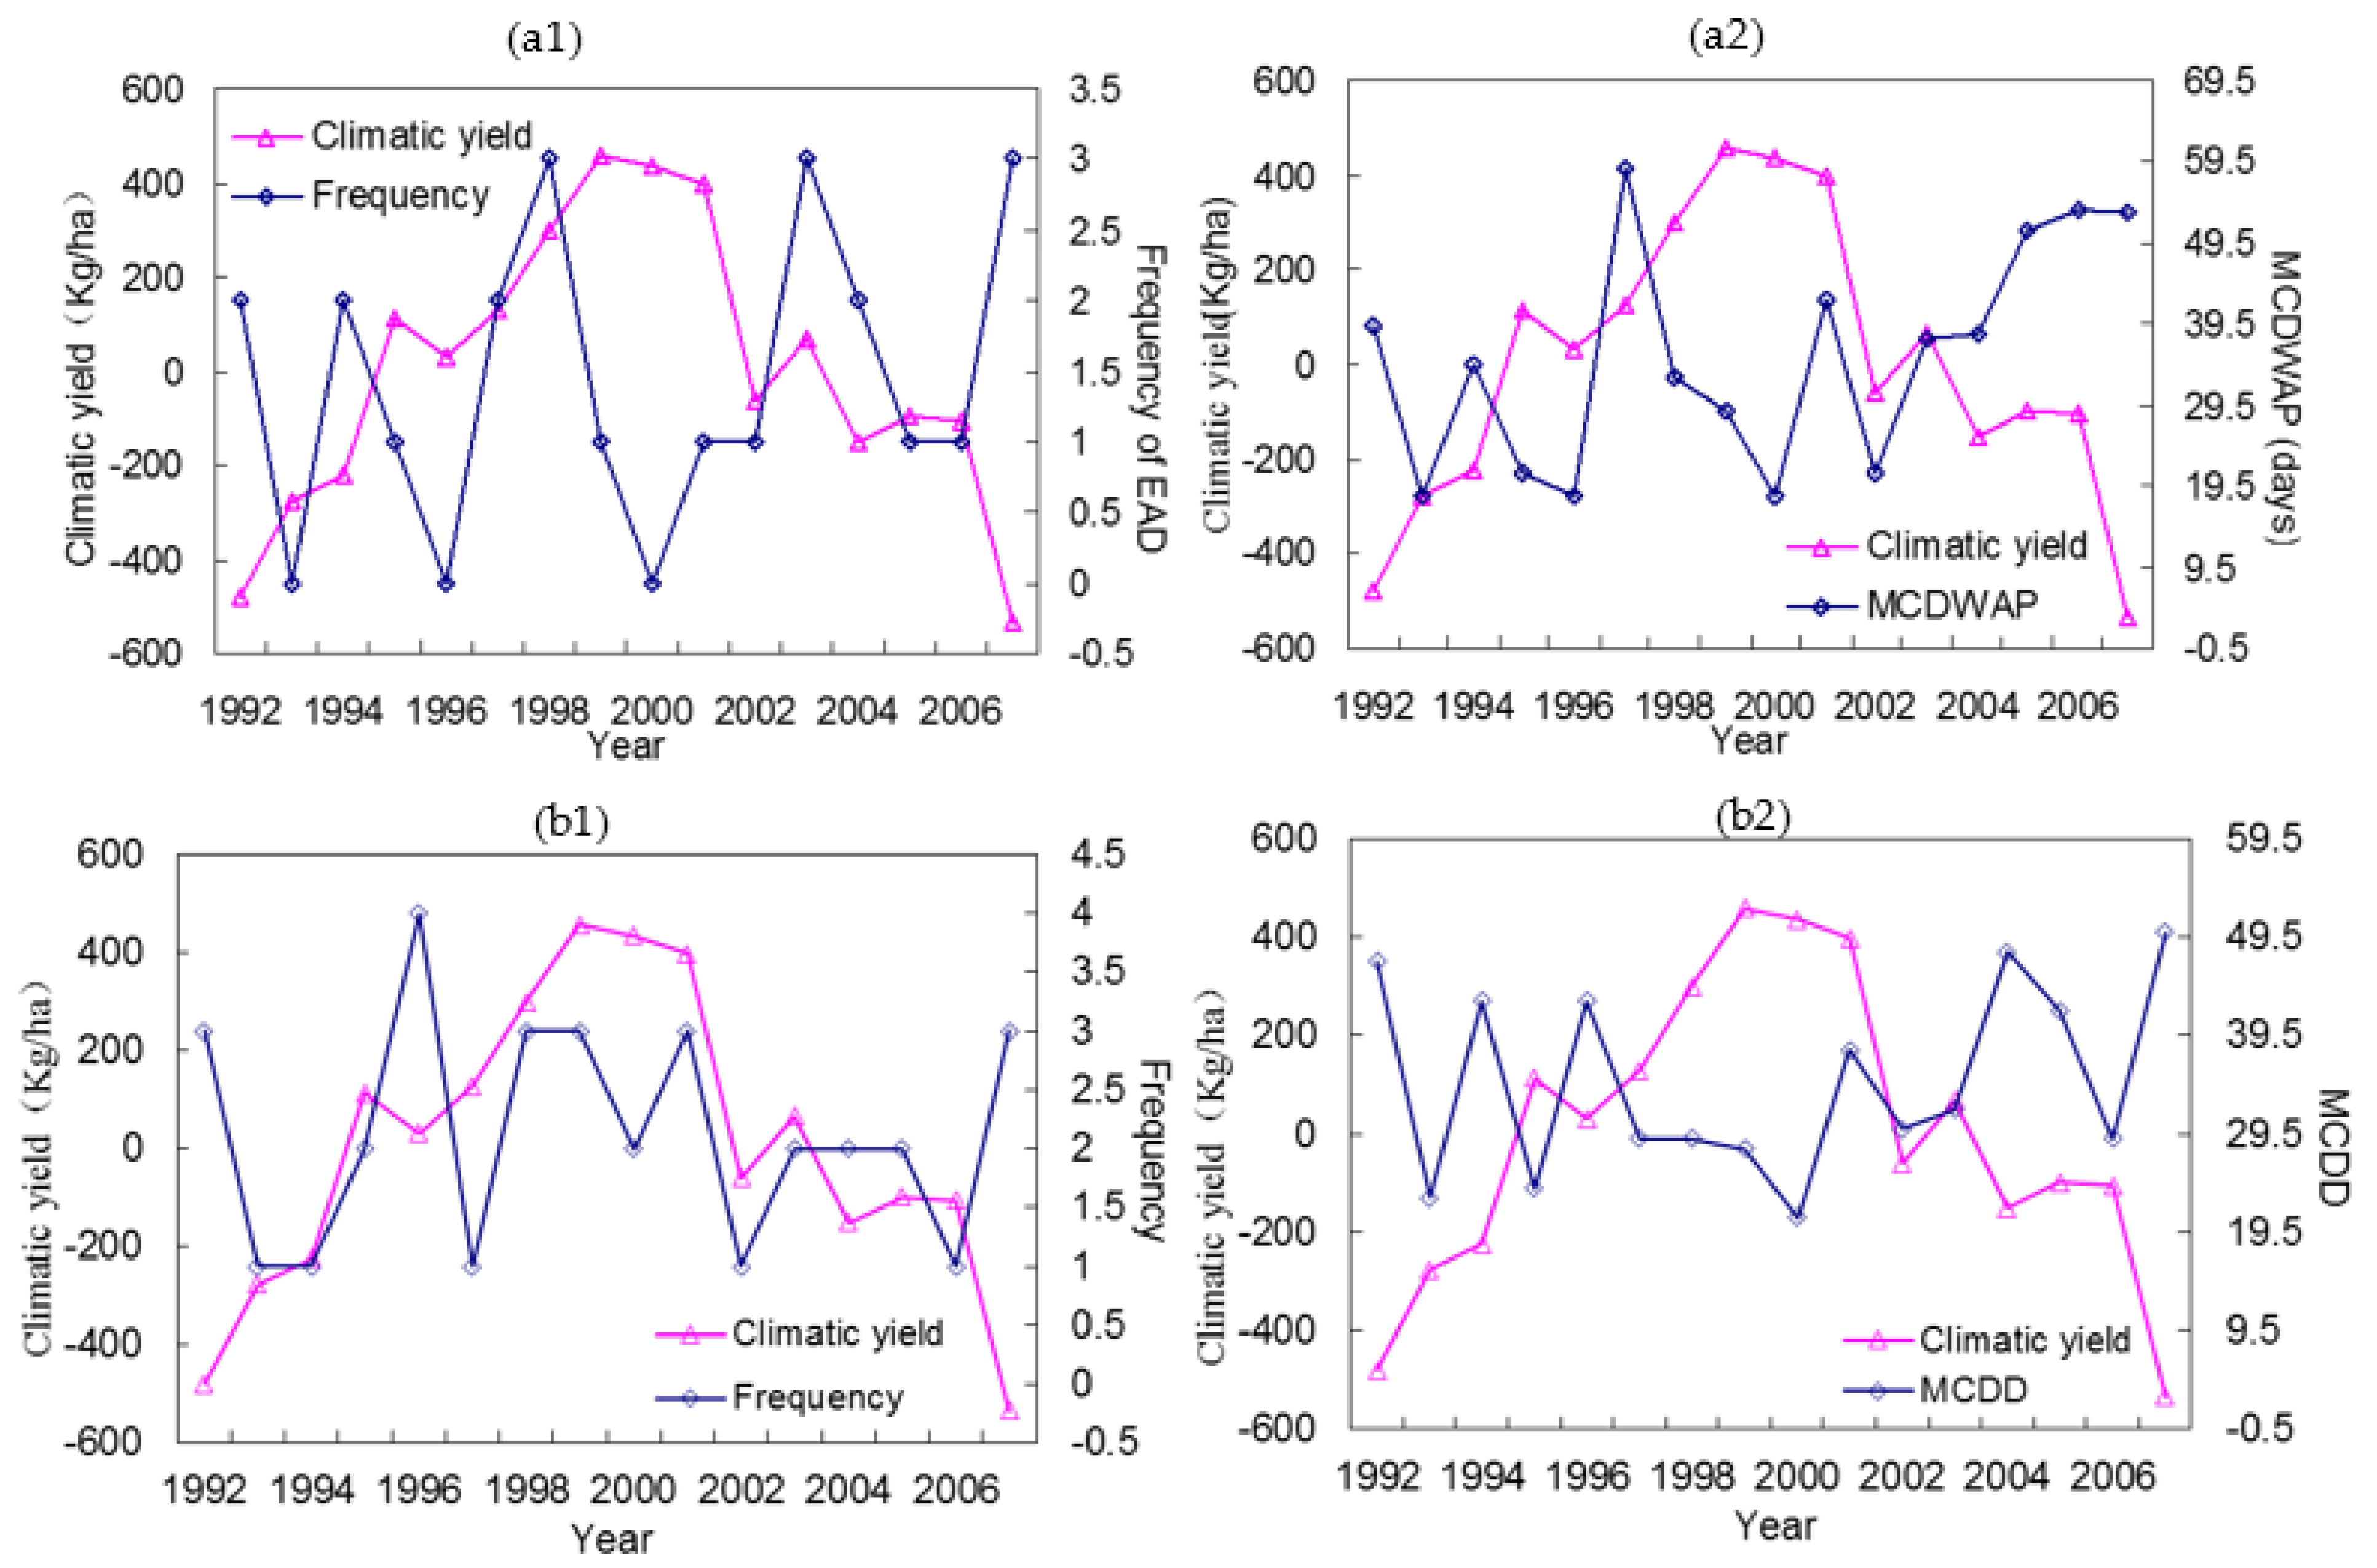
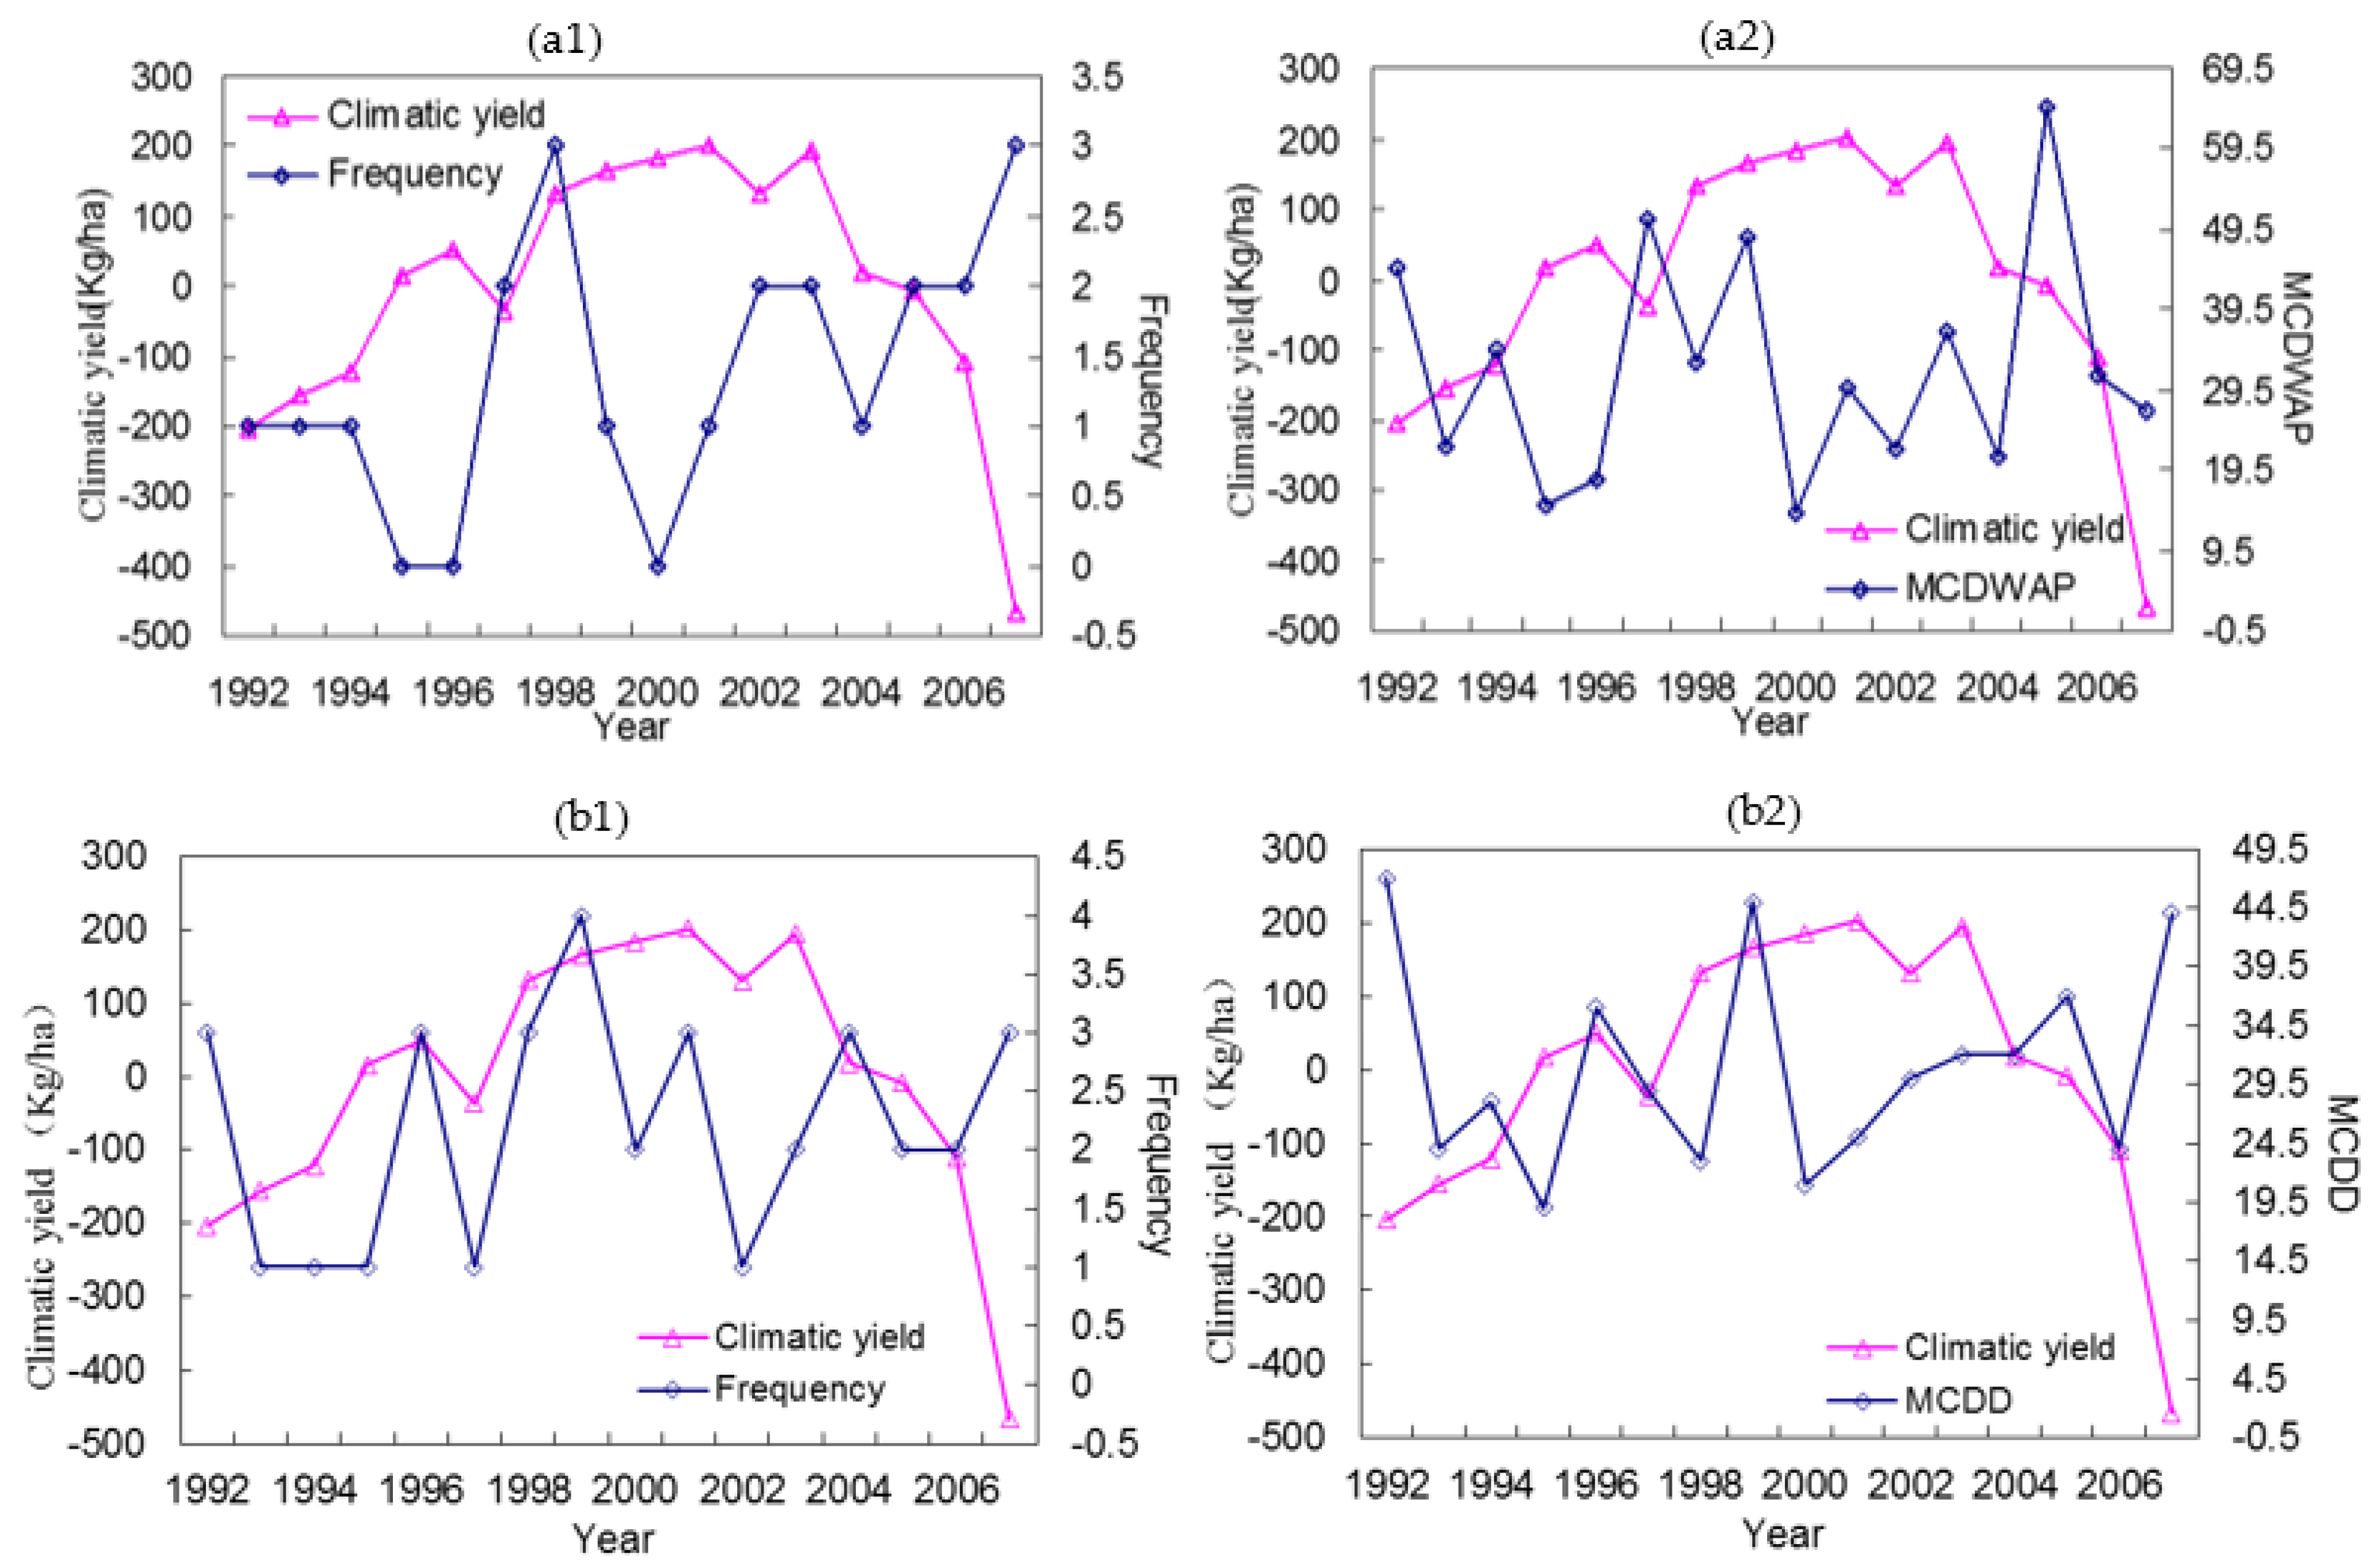
4.3. Case Study of Response of Grain Yields to EADs
4.3.1. Case Study in the NC Region
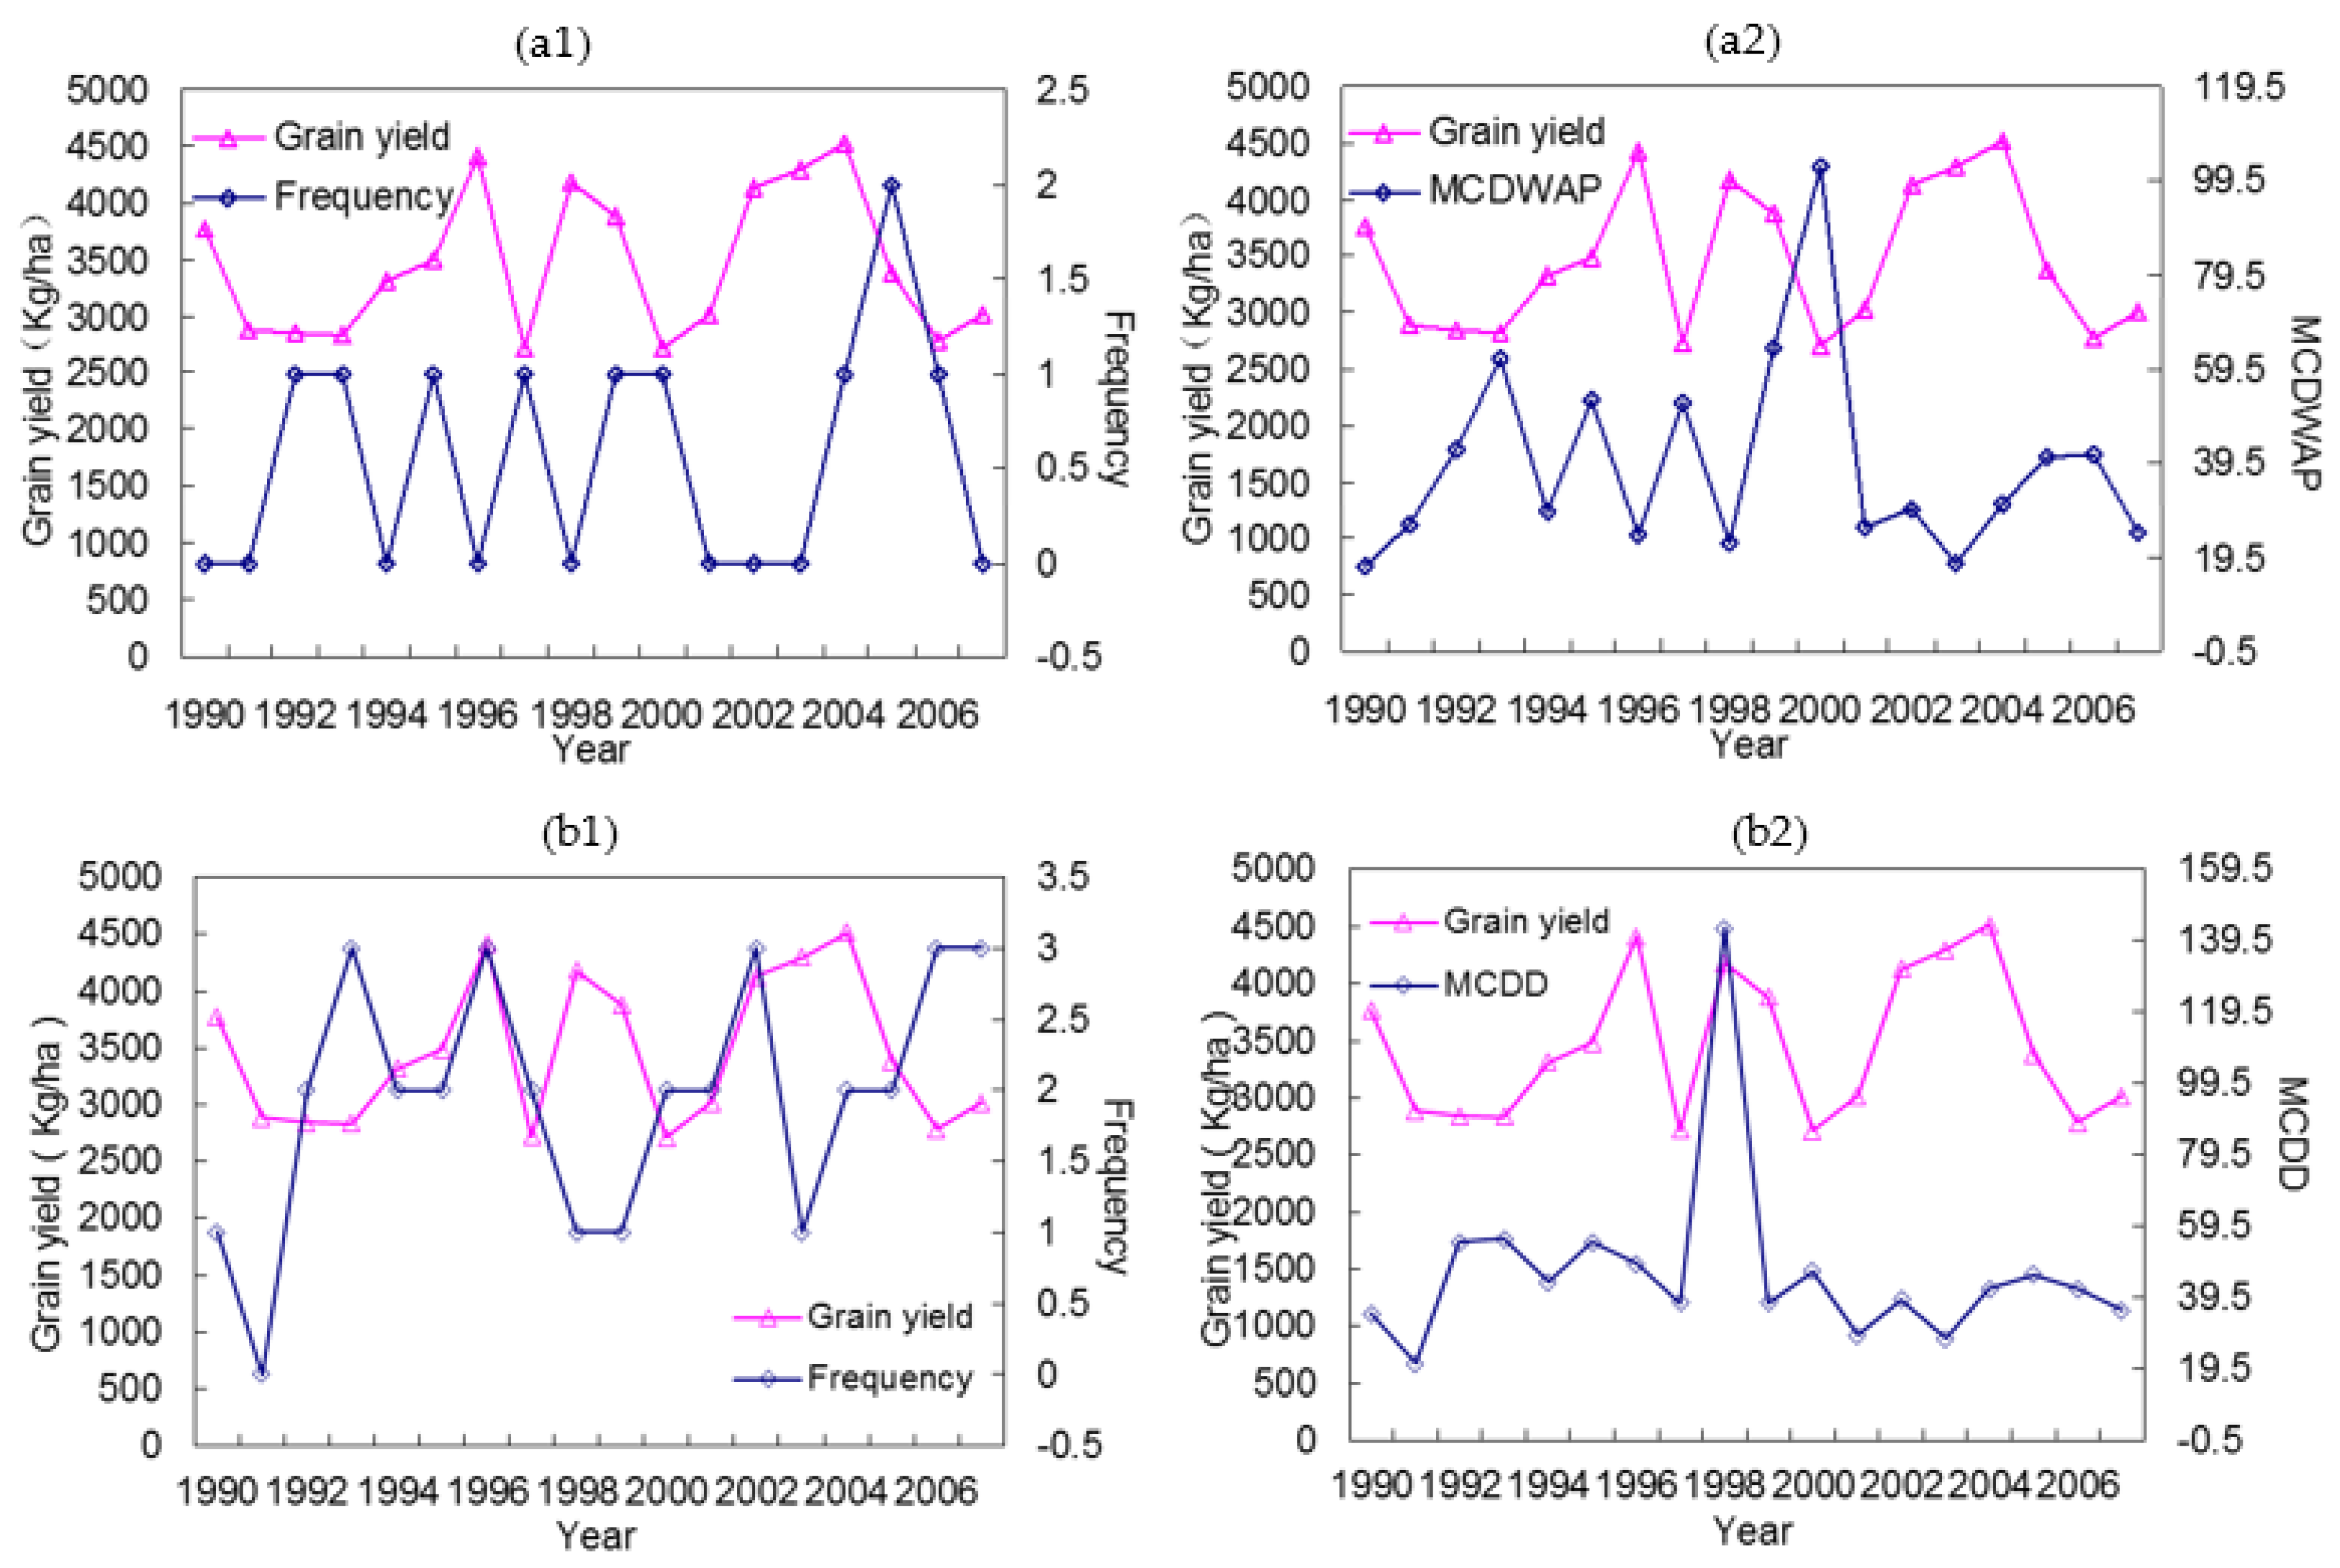
- (1)
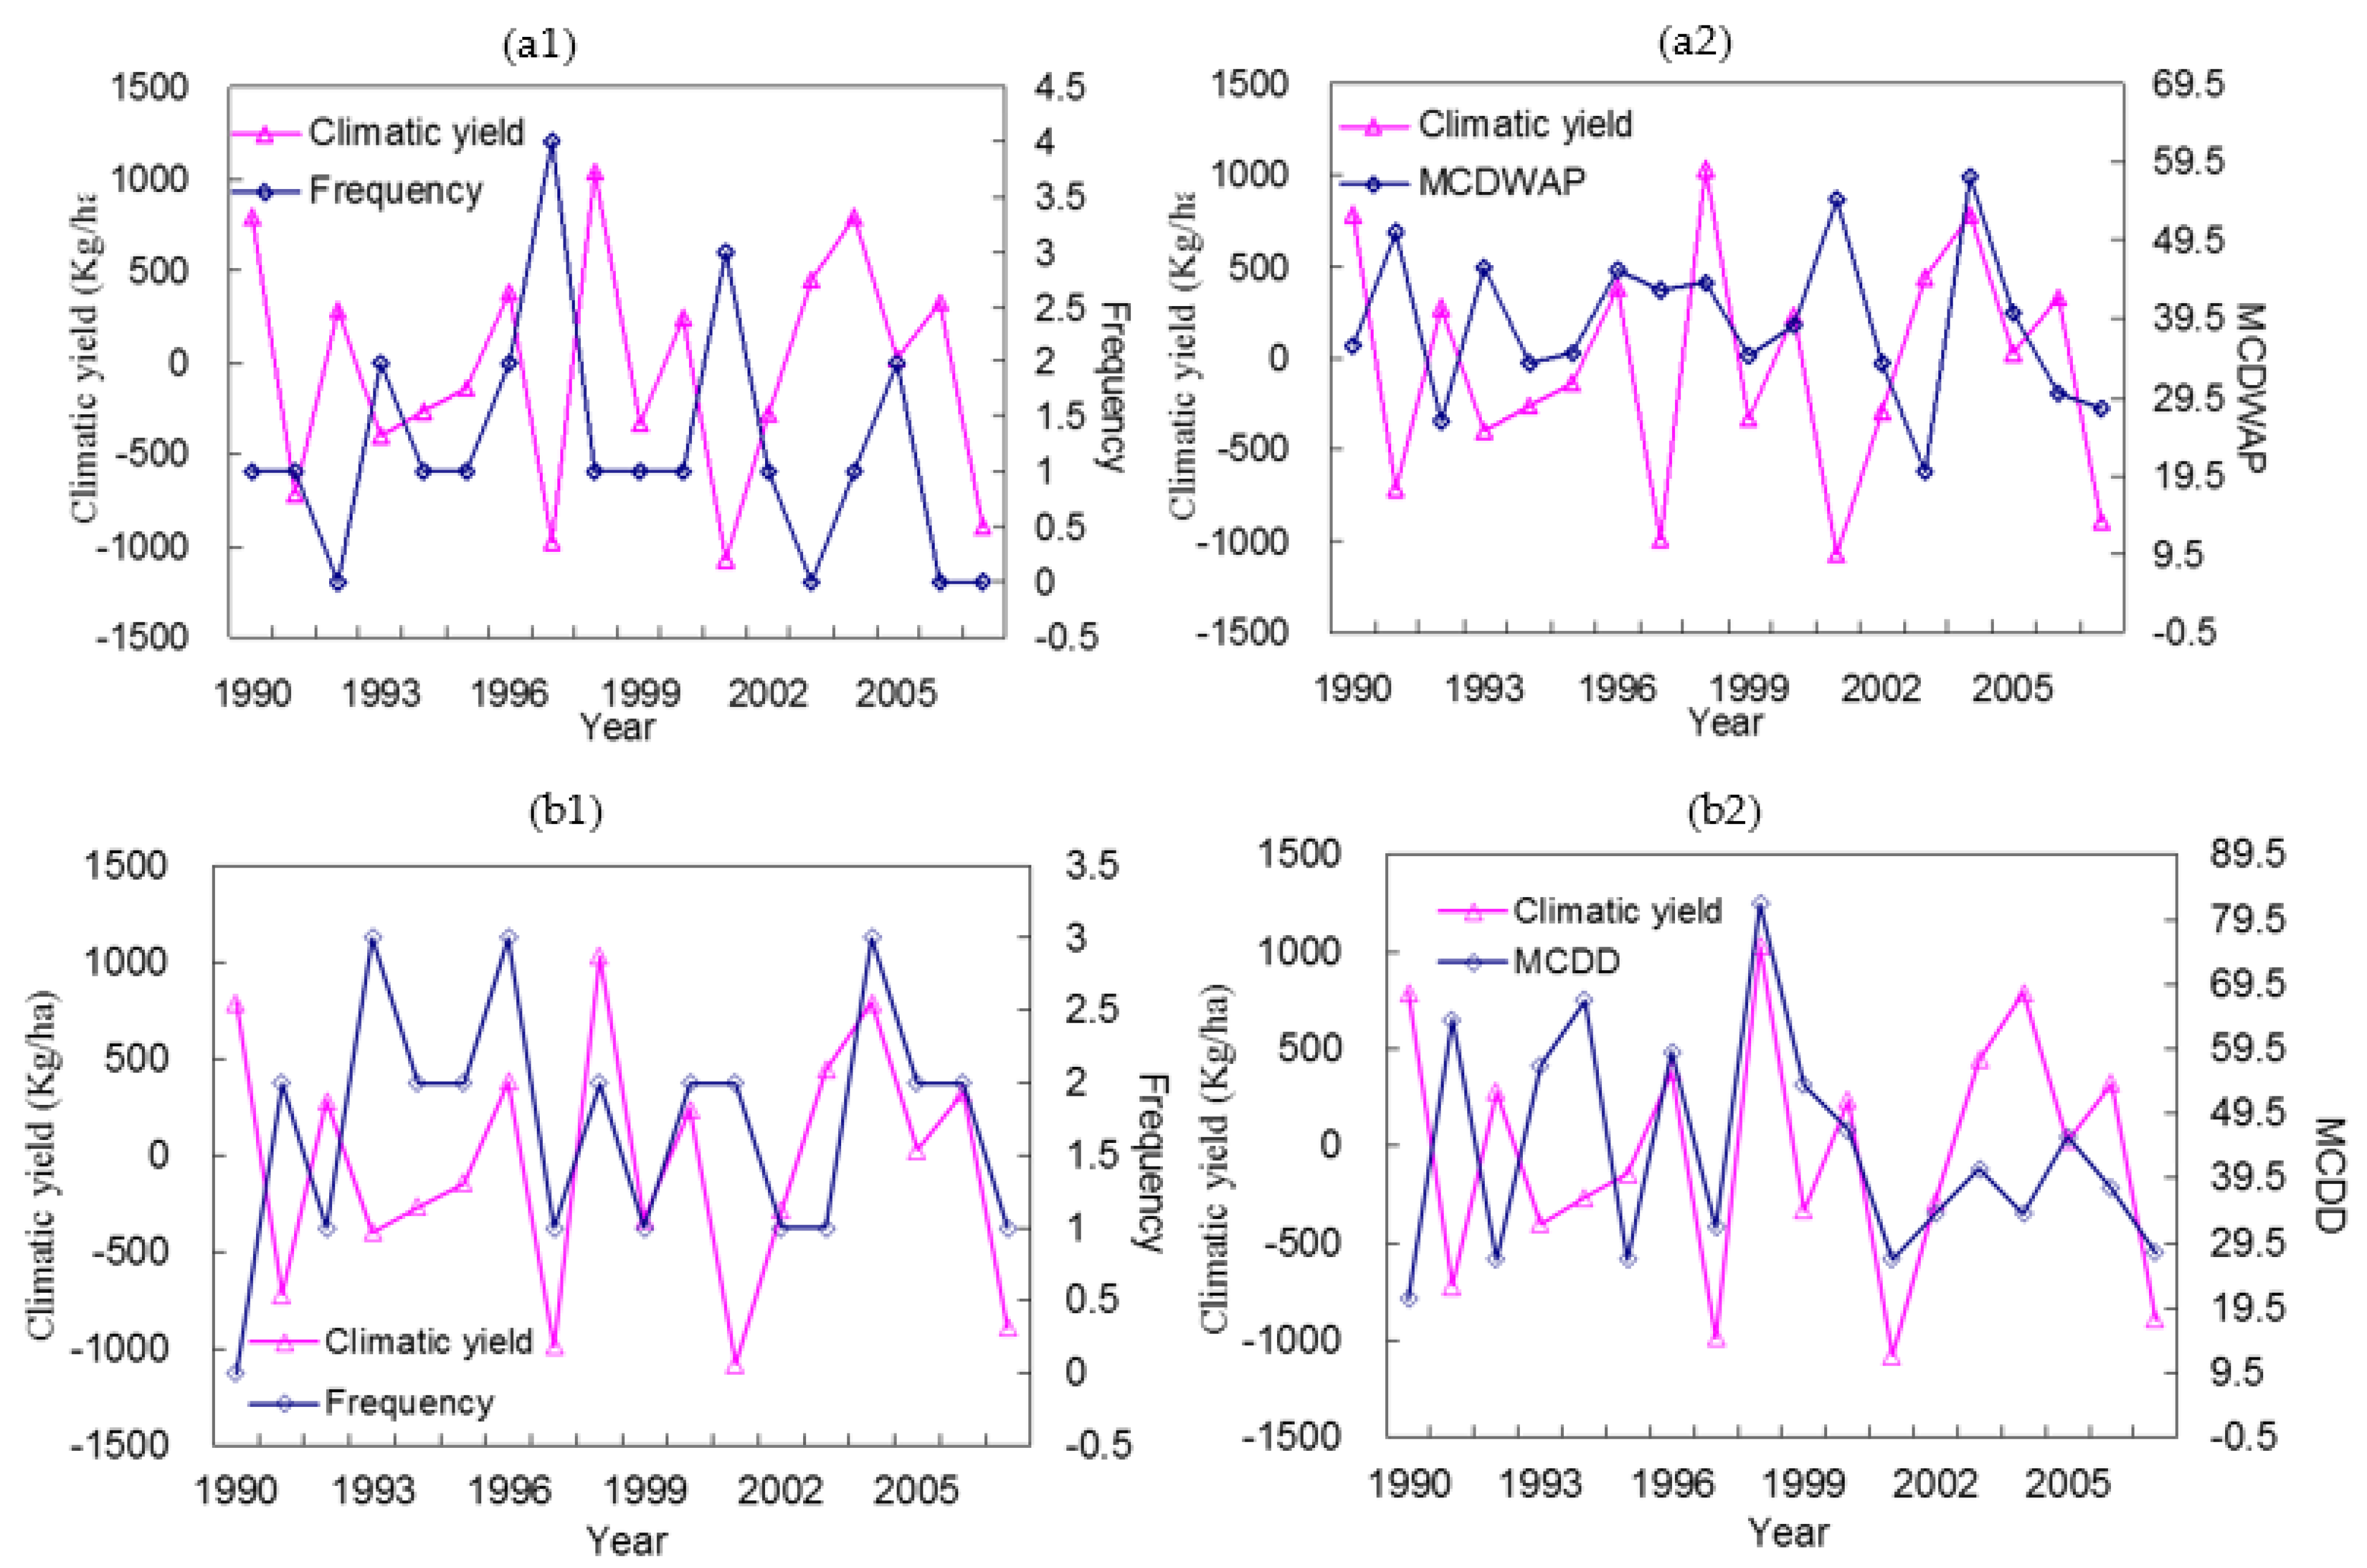
- Yushe County
- (2)
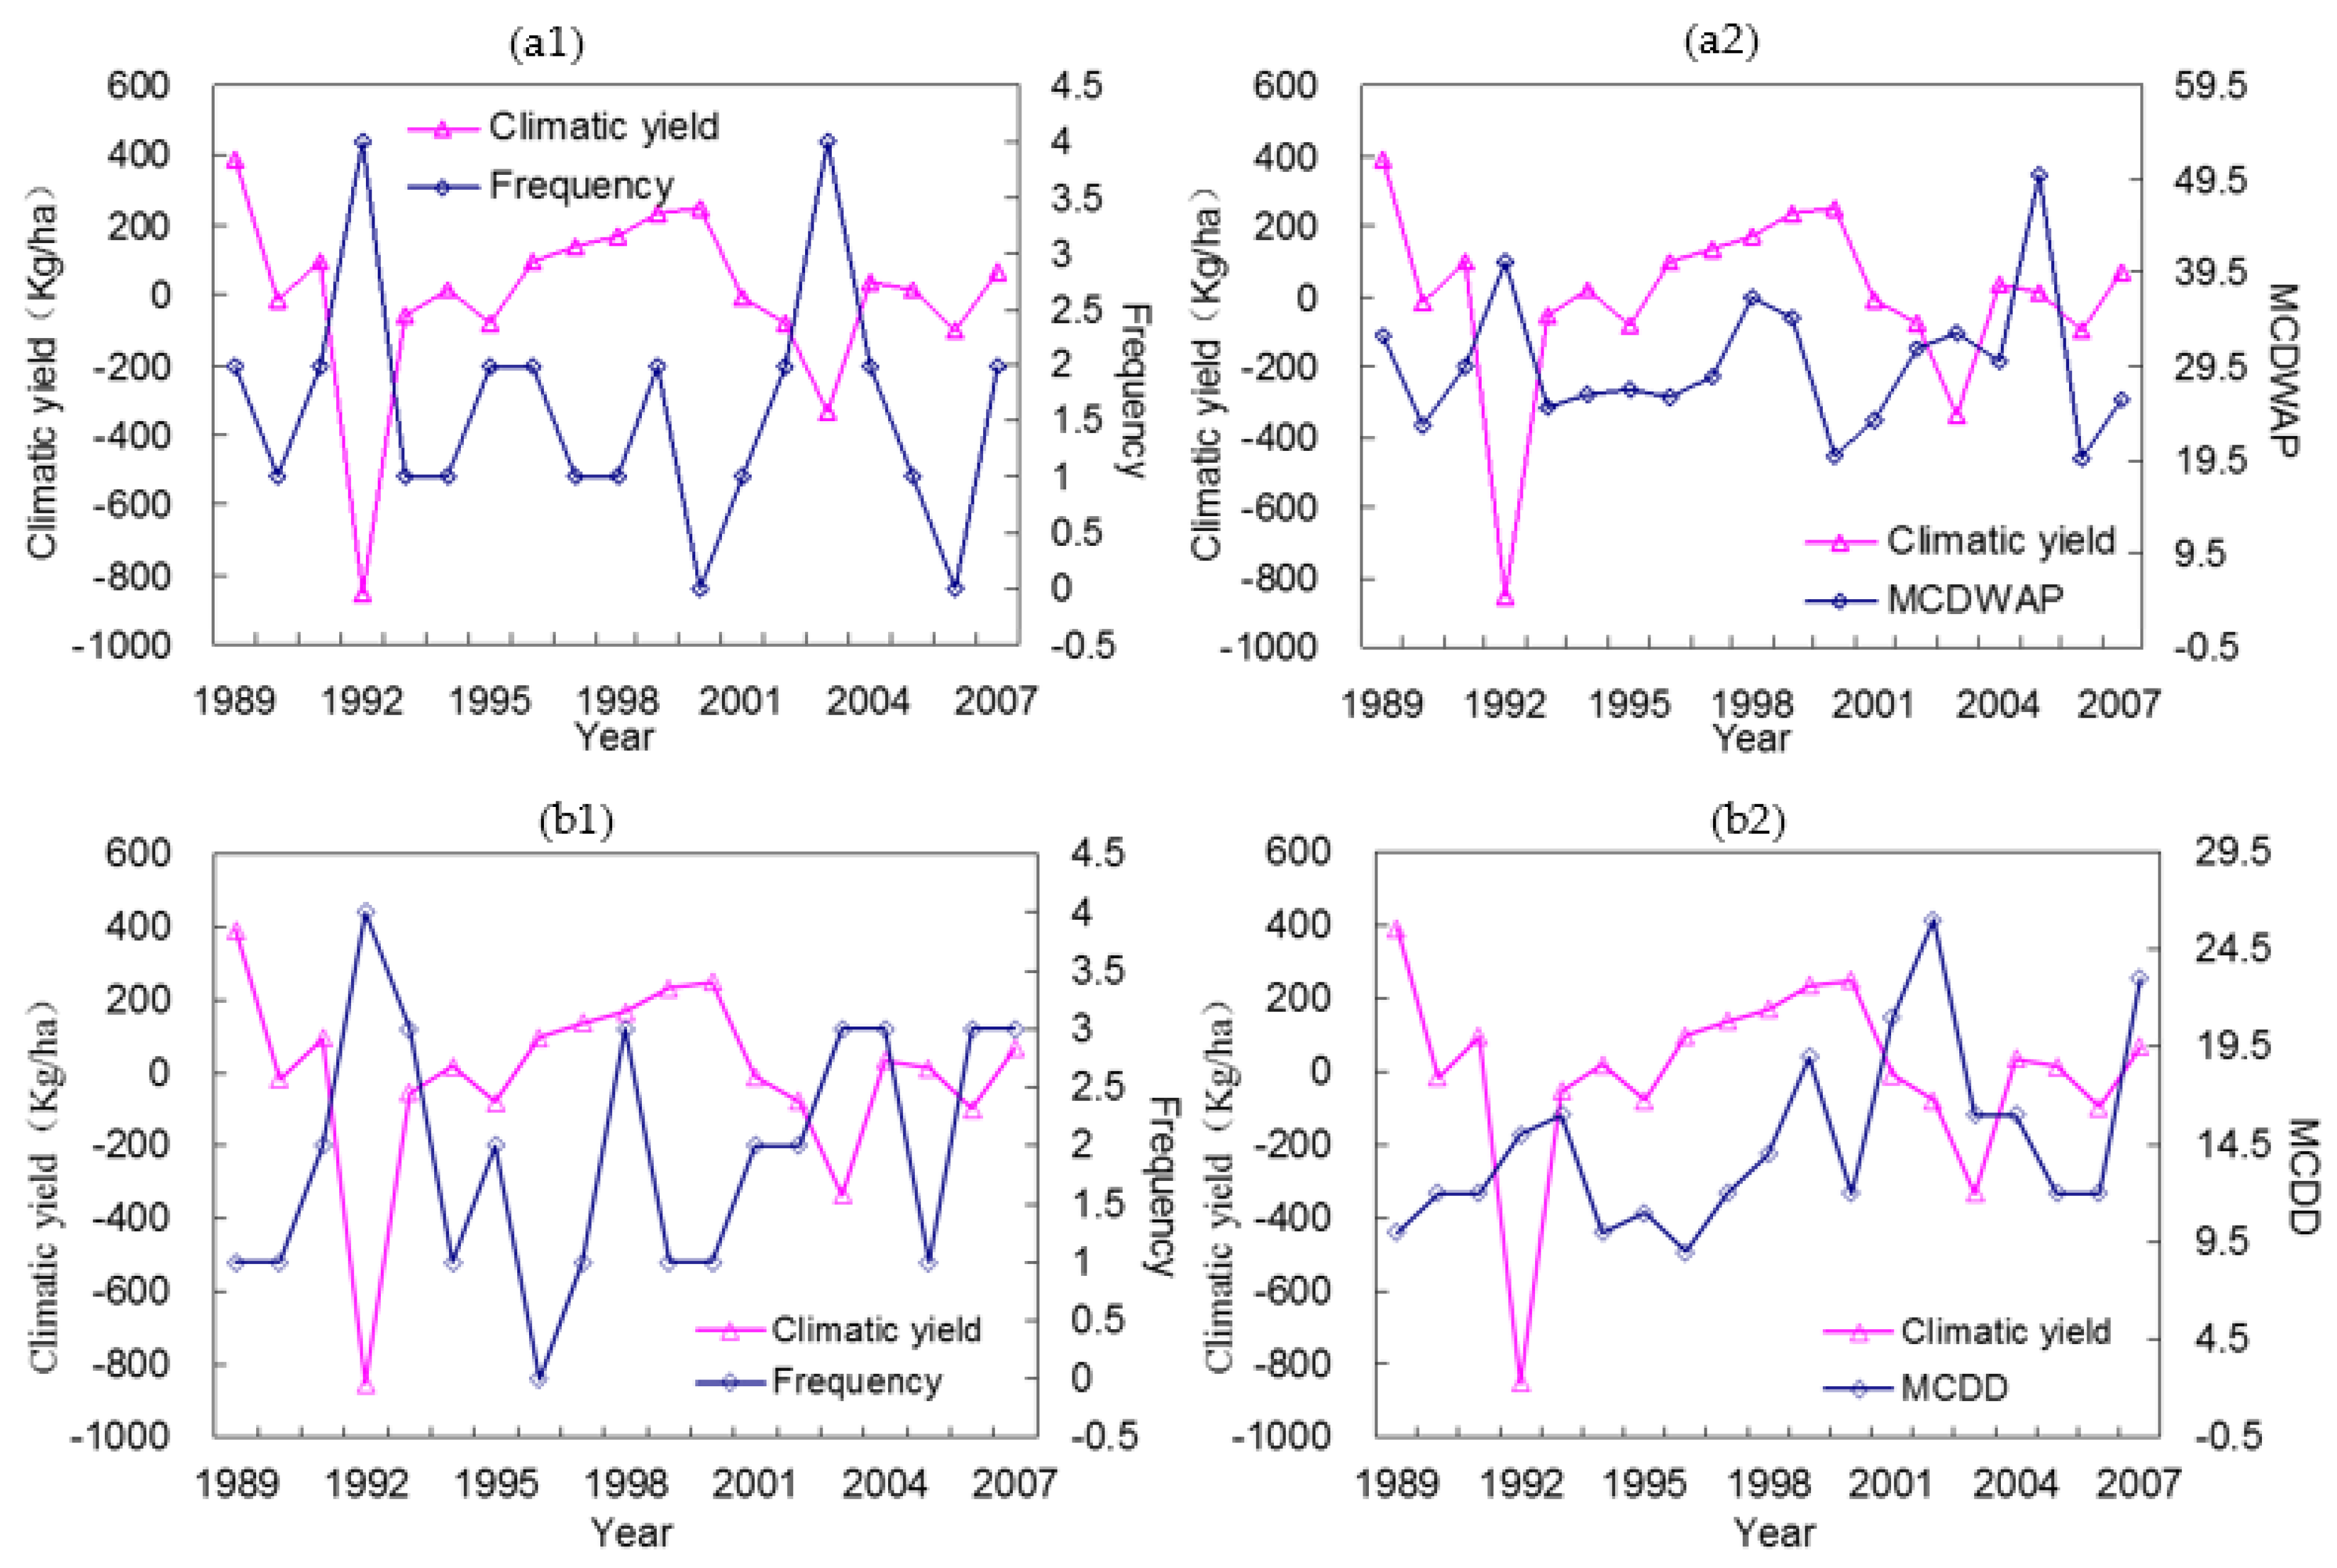
- Yangcheng County
4.3.2. Case Study in the SW Region
- (1)
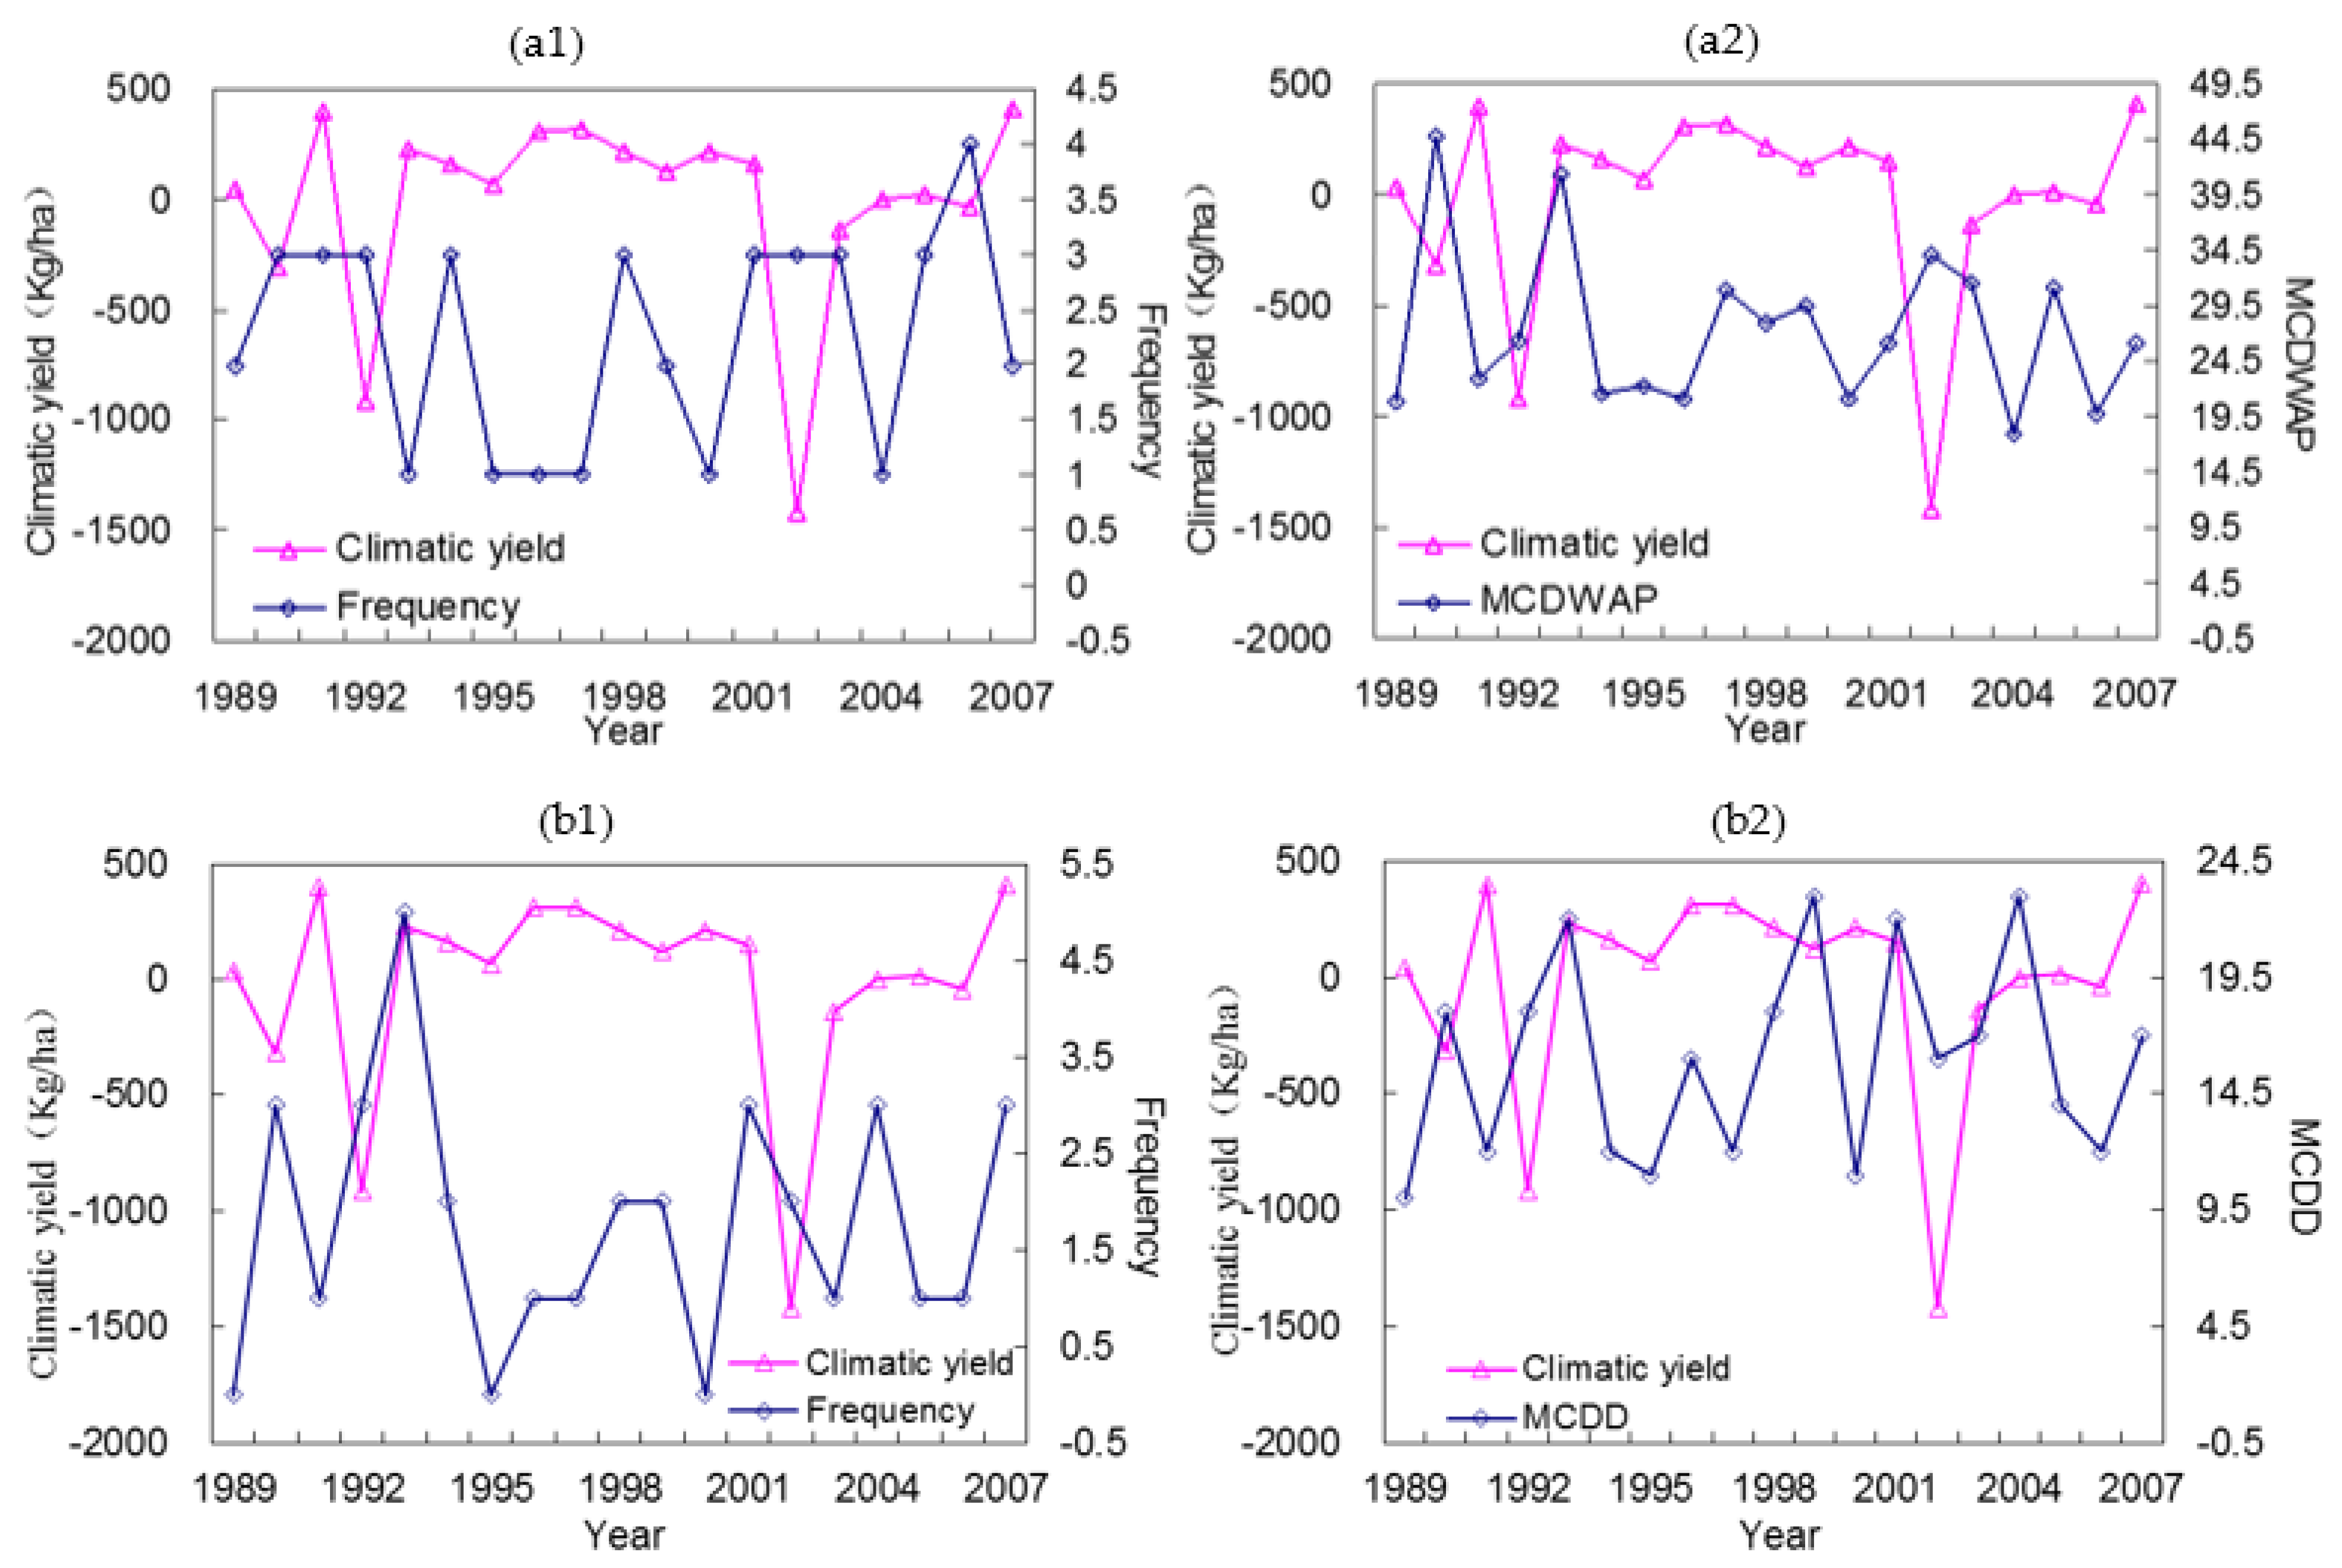
- Bijie City
- (2)
- Anshun City
4.3.3. Case Study in SE Region
- (1)
- Meixian District
- (2)
- Wuhua County
5. Discussion
5.1. Regional Mean Change Rates of EADs and EDs
5.2. Differences in Response Relationship of Grain Yield to EAD and ED
6. Conclusions
- (1)
- A threshold determination model of EADs was built based on the CDF of an agricultural drought index—the CDWAP. The CDWAP was established by combining meteorological data with the characteristics of the cropping patterns and the water requirement in different growing periods of crops. The CDF of CDWAP was obtained based on the relationship of CDWAP and its occurrence frequency. This model provides a basis for the impact study of climate extremes on grain yield reduction.
- (2)
- The threshold value of EADs in China gradually increased from southeast to northwest. The stations of the highest value were located in the desert areas in Northwest China, with the CDWAP more than 60 days, while the lowest value was in the middle reaches of the Yangzi River, with the CDWAP less than 16 days. The value in North China was between 20–40 days, and that in the southern humid area was generally less than 20 days.
- (3)
- The frequency and intensity of the EADs were on increasing trends in most of the regions in China except the QT and NW regions. The NC and SW regions showed the two highest increasing rates of the EADs; the frequencies and intensities of them were 11.3% and 2.2% for NC region, and 9.3%, 2.7% for SW region, respectively, but all were lower than the relative change rates of the EDs. Furthermore, the increasing rate of the frequency and intensity of EADs in NE China were a little higher than the results of the EDs, with the increasing rates of frequency and intensity in EADs being 5.7% and 0.7%, respectively.
- (4)
- There was a negative correlation between the grain yields and the EAD frequency and intensity; i.e., the low climatic yields often occurred in the year with relatively higher frequency or/and stronger intensity of EADs. The correlation between them became stronger in the more rain-fed areas and larger planting proportion of the main grain crops (wheat, rice, and maize) due to the premise of the threshold model.
Author Contributions
Funding
Institutional Review Board Statement
Informed Consent Statement
Data Availability Statement
Acknowledgments
Conflicts of Interest
References
- IPCC. Climate Change 2013: The Physical Science Basis; Cambridge University Press: Cambridge, UK, 2013. [Google Scholar]
- IPCC. Climate Change 2021: The Physical Science Basis; Cambridge University Press: Cambridge, UK, 2021. [Google Scholar]
- Zheng, D.; Li, M.; Huo, Z. Agricultural Disasters and Reduction Countermeasures; China Agricultural University Press: Beijing, China, 2013. [Google Scholar]
- Qiu, H.; Cao, M.; Hao, J.; Wang, Y.; Wang, Y. Relationship between Frequency and Magnitude of Drought Damage in China in 1950–2010. Sci. Geogr. Sin. 2013, 33, 576–580. [Google Scholar]
- Li, M.; Li, S.; Li, Y. Studies on Drought in the Past 50 Years in China. Chin. J. Agrometeorol. 2003, 24, 7–10. [Google Scholar]
- Zhang, Z.; Wang, P.; Chen, Y.; Zhang, S.; Tao, F.; Liu, X. Spatial pattern and decadal change of agro-meteorological disasters in the main wheat production area of China during 1991–2009. J. Geogr. Sci. 2014, 24, 387–396. [Google Scholar] [CrossRef]
- Meng, L.; Fordb, T.; Guo, Y. Logistic regression analysis of drought persistence in East China. Int. J. Climatol. 2017, 37, 1444–1455. [Google Scholar] [CrossRef]
- Zhang, J.; Shen, Y.J. Spatio-temporal variations in extreme drought in China during 1961–2015. J. Geogr. Sci. 2019, 29, 67–83. [Google Scholar] [CrossRef] [Green Version]
- Palmer, W.C. Meteorologieal Drought; Research Pape No 45; US Weather Bureau, NOAA Library and Information Service Division: Washington, DC, USA, 1965.
- Dai, A.; Trenberth, K.E.; Qian, T. A Global Dataset of Palmer Drought Severity Index for 1870–2002: Relationship with Soil Moisture and Effects of Surface Warming. J. Hydrometeorol. 2004, 5, 1117–1130. [Google Scholar] [CrossRef]
- Vicente-Serrano, S.M.; Beguería, S.; López-Moreno, J.I. A Multiscalar Drought Index Sensitive to Global Warming: The Standardized Precipitation Evapotranspiration Index. J. Clim. 2010, 23, 1696–1718. [Google Scholar] [CrossRef] [Green Version]
- Loukas, A.; Vasiliades, L.; Spiliotopoulos, M.; Bampzelis, D.; Dalezios, N.R. An Assessment of Regional Droughts in Greece Using Two Meteorological Drought Indices, Comecap 2002. In Proceedings of the 6th Hellenic Conference in Meteorology-Climatology and Atmospheric Physics, Ioannina, Greece, 26–28 September 2002. [Google Scholar]
- Livada, I.; Assimakopoulos, V.D. Spatial and temporal analysis of drought in greece using the Standardized Precipitation Index (SPI). Theor. Appl. Climatol. 2007, 89, 143–153. [Google Scholar] [CrossRef]
- Alexander, L.V.; Zhang, X.; Peterson, T.C.; Caesar, J.; Gleason, B.; Tank, A.M.G.K.; Haylock, M.; Collins, D.; Trewin, B.; Rahimzadeh, F. Global observed changes in daily climate extremes of temperature and precipitation. J. Geophys. Res. Atmos. 2006, 111, 1042–1063. [Google Scholar] [CrossRef] [Green Version]
- Zhang, X.; Alexander, L.; Hegerl, G.C.; Jones, P.; Tank, A.K.; Peterson, T.C.; Trewin, B.; Zwiers, F.W. Indices for monitoring changes in extremes based on daily temperature and precipitation data. Wiley Interdiscip. Rev. Clim. Change 2011, 2, 851–870. [Google Scholar] [CrossRef]
- Alexander, L.V. Global observed long-term changes in temperature and precipitation extremes: A review of progress and limitations in IPCC assessments and beyond. Weather Clim. Extrem. 2016, 11, 4–16. [Google Scholar] [CrossRef] [Green Version]
- Liu, M.; Shen, Y.; Qi, Y.; Wang, Y. Changes in Precipitation and Drought Extremes over the Past Half Century in China. Atmosphere 2019, 10, 203. [Google Scholar] [CrossRef] [Green Version]
- Asseng, S.; Martre, P.; Maiorano, A.; Rötter, R.P.; Leary, G.J.O. Climate change impact and adaptation for wheat protein. Glob. Change Biol. 2019, 25, 155–193. [Google Scholar] [CrossRef] [Green Version]
- Xiong, W.; Lin, E.; Ju, H.; Xu, Y. A Study of the Threshold of Climate Change Impact on Food Production in China. Adv. Clim. Change Res. 2005, 1, 84–87. [Google Scholar]
- Xiong, W.; Ju, H.; Xu, Y.; Lin, E. The Threshold of Temperature Increase Due to Climate Change for Chinese Agriculture and Its Uncertainties. Adv. Earth Sci. 2006, 021, 70–76. [Google Scholar]
- Tian, Z.; Liu, J.; Cao, M. Simulation of the Impact of Climate Change on Chinese Wheat Production in Huang-Huai-Hai Plain. J. Nat. Resour. 2006, 21, 598–607. [Google Scholar]
- Xiong, W.; Yang, J.; Lin, E.; Xu, Y. The Projection of Maize Yield in China under Climate Change Scenarios. Adv. Earth Sci. 2008, 23, 1092–1101. [Google Scholar]
- Xiong, W.; Lin, E.; Jiang, J.; Li, Y.; Xu, Y. An Integrated Analysis of Impact Factors in Determining China’s Future Grain Production. Acta Geogr. Sin. 2010, 65, 397–406. [Google Scholar]
- Meza, F.J.; Silva, D. Dynamic adaptation of maize and wheat production to climate change. Clim. Change 2009, 94, 143–156. [Google Scholar] [CrossRef]
- Hlavinka, P.; Trnka, M.; Semerádová, D.; Dubrovsky, M.; Alud, Z.; Mo Ny, M. Effect of drought on yield variability of key crops in Czech Republic. Agric. For. Meteorol. 2009, 149, 431–442. [Google Scholar] [CrossRef]
- Moriondo, M.; Giannakopoulos, C.; Bindi, M. Climate change impact assessment: The role of climate extremes in crop yield simulation. Clim. Chang. 2011, 104, 679–701. [Google Scholar] [CrossRef]
- Zhou, S.; Zhou, W.; Lin, G.; Qiao, H. The Impact of Future Climate Change on China’s Food Security. J. Nanjing Agric. Univ. 2013, 1, 61–70. [Google Scholar]
- Li, K.; He, X.; Xu, Y.; Zheng, D. Study on Classification of Adaptation Technologies to Climate Change in China. China Popul. Resour. Environ. 2016, 26, 18–26. [Google Scholar]
- Liu, L.; Liu, X.; Lun, F.; Wu, L. Research on China’s Food Security under Global Climate Change Background. J. Nat. Resour. 2018, 33, 927–939. [Google Scholar]
- Guo, J.; Zhang, B.; Gao, J.; Peng, J.; Luo, R. Advances on the impacts of climate change on agro-climatic resources and agricultural production in China. J. North. Agric. 2019, 47, 105–113. [Google Scholar]
- Tao, F.; Yokozawa, M.; Hayashi, Y.; Lin, E. Future climate change, the agricultural water cycle, and agricultural production in China. Agric. Ecosyst. Environ. 2003, 95, 203–215. [Google Scholar] [CrossRef]
- Trnka, M.; Dubrovsk, M.; Alud, Z. Climate Change Impacts and Adaptation Strategies in Spring Barley Production in the Czech Republic. Clim. Chang. 2004, 64, 227–255. [Google Scholar] [CrossRef]
- Zhao, R.; Wang, H.; Dong, Y. Impact of climate change on grain yield and its trend across Guanzhong region. Chin. J. Eco-Agric. 2020, 28, 467–479. [Google Scholar]
- Meng, Y.; Ba, Y.; Sun, Y.; Yuan, J. Impact of Climate Change on Maize Planting Area. Agric. Technol. 2020, 40, 109–111. [Google Scholar]
- Pang, Y.; Chen, C.; Xu, F.; Guo, X. Impact of climate change on potential productivities of main grain crops in the Sichuan Basin. Chin. J. Eco-Agric. 2020, 28, 17–28. [Google Scholar]
- Chen, C.; Pang, Y.; Xu, F.; Guo, X. Dry-wet evolution and its influencing factors in single cropping rice growing season in Southwest China. Chin. J. Eco-Agric. 2020, 28, 492–502. [Google Scholar]
- Cai, X.; Liang, G. Characteristics of Climate Change in Shuozhou City of Shanxi Province in 2019 Analysis of Impact on Crops. J. Agric. Catastrophol. 2020, 10, 134–136. [Google Scholar]
- Bai, F.; Yang, X.; Liu, Z.; Sun, S. Effects of sowing dates on grain yield of spring maize in the Three-Province of the Northeast China under climate change. Chin. J. Eco-Agric. 2020, 28, 480–491. [Google Scholar]
- Ling, X.; Zhang, Z.; Zhai, J.; Ye, S. A review for impacts of climate change on rice production in China. Acta Agron. Sin. 2019, 45, 323–334. [Google Scholar] [CrossRef]
- Kheir, A.M.S.; Baroudy, A.E.; Aiad, M.A.; Zoghdan, M.G.; Abd El-Aziz, M.A.; Ali, M.G.M.; Fullen, M.A. Impacts of rising temperature, carbon dioxide concentration and sea level on wheat production in North Nile delta. Sci. Total Environ. 2018, 651 Pt 2, 3161–3173. [Google Scholar] [CrossRef]
- Kheir, A.; Marwa Gamal Mohamed Ali, M.M.I.A. Climate change impact and adaptation on wheat yield, water use and water use efficiency at North Nile Delta. Front. Earth Sci. 2020, 14, 522–536. [Google Scholar]
- Ding, Z.; Ali, E.F.; Elmahdy, A.M.; Ragab, K.E. Modeling the combined impacts of deficit irrigation, rising temperature and compost application on wheat yield and water productivity. Agric. Water Manag. 2021, 244, 106626. [Google Scholar] [CrossRef]
- Asseng, S.; Kheir, A.; Kassie, B.T.; Hoogenboom, G. Can Egypt become self-sufficient in wheat? Environ. Res. Lett. 2018, 13, 094012. [Google Scholar] [CrossRef] [Green Version]
- Zhang, Y.; Wang, S.; Wang, F. Research on the Possible Effect of Climate Change on Growth and Yield of Wheat in China. Q. J. Appl. Meteorol. 2000, 11, 264–270. [Google Scholar]
- Alud, Z.; Dubrovsky, M. Modelling climate change impacts on maize growth and development in the Czech Republic. Theor. Appl. Climatol. 2002, 72, 85–102. [Google Scholar]
- Yao, F.; Qin, P.; Zhang, J.; Lin, E. Uncertainties in assessing the effect of climate change on agriculture using model simulation and uncertainty processing methods. Chin. Sci. Bull. 2011, 56, 547–555. [Google Scholar] [CrossRef] [Green Version]
- Zhang, S.; Li, Q.; Ji, L.; Ma, J.; Wang, Z.; He, S.; Li, G. Climate Change and Its Impact on Potential Productivity: In Western Chongqing During 1970–2014. Chin. Agric. Sci. Bull. 2018, 034, 112–117. [Google Scholar]
- Yang, Z. Influence of extreme climate on food production security in China and its safeguard measures. Mod. Agric. Sci. Technol. 2010, 21, 329–330. [Google Scholar] [CrossRef]
- Han, L.; Zhang, Q.; Cheng, Y.; Chen, P. Research progress of agriculture drought disaster risk and prospect. J. Arid Land Resour. Environ. 2020, 34, 97–102. [Google Scholar]
- Ma, X.; Yang, S.; Shi, H.; Qin, L. An Analysis of the Influence of Climate Change on Crop Water Requirement in Northern Regions of China. Hans J. Agric. Sci. 2020, 10, 798–802. [Google Scholar]
- Kong, L.; Fu, S.; Han, X.; Liu, W. Spatiotemporal Variation of Long-term Meteorological Drought and Its Impacts on Grain Yield in Shaanxi Province Based on the Traditional Arid-Wet Index. Res. Soil Water Conserv. 2020, 27, 159–167. [Google Scholar]
- Peel, M.C.; Finlayson, B.L.; Mcmahon, T.A. Updated world map of the Köppen-Geiger climate classification. Hydrol. Earth Syst. Sci. 2007, 11, 259–263. [Google Scholar] [CrossRef] [Green Version]
- Wenyu, Y.; Naimei, T. Crop Cultivation: Book of Southern Part (Version 2); China Agricultural Press: Beijing, China, 2011. [Google Scholar]
- Yu, Z. Crop Cultivation: Book of Northern Part (Version 2); China Agricultural Press: Beijing, China, 2013. [Google Scholar]
- Liu, M. An Atlas of Physical Geography of China (Version 2); SinoMaps Press: Beijing, China, 1998. [Google Scholar]
- Li, Y. Agricultural Regionalization in China; China Agricultural Science and Technology Press: Beijing, China, 1997. [Google Scholar]
- Hu, L.; Ding, Y. Crop Cultivation: Version 2; Higher Education Press: Beijing, China, 2019. [Google Scholar]
- Available online: https://www.fao.org/aquastat/en/geospatial-information/global-maps-irrigated-areas/latest-version (accessed on 11 March 2011).
- Xue, Y.; Smith, T.M.; Reynolds, R.W. Interdecadal Changes of 30Yr SST Normals during 1871–2000. J. Clim. 2003, 16, 1601–1612. [Google Scholar] [CrossRef] [Green Version]
- Brown, L. The Conditional Level of Student’s t Test. Ann. Math. Stat. 1967, 38, 1068–1071. [Google Scholar] [CrossRef]
- Xu, L.; Ying, G.; Liu, M.; Hu, Q.; Chen, F. Analysis of Temperature Trends and Change Points in the Haihe River Basin Over the Last 50 Years. Resour. Sci. 2011, 33, 995–1001. [Google Scholar]
- Jiang, S.; Jin, J.; Xu, H.; Zhou, Y.; Wang, Y. Fluctuations effect analysis of grain yield per hectare based on empirical mode decomposition and set pair analysis. Trans. Chin. Soc. Agric. Eng. 2013, 29, 213–221. [Google Scholar]
- Liu, Z.; Huang, F.; Li, B. Analysis on characteristics and influential factors of grain yield fluctuation in China based on empirical mode decomposition. Trans. Chin. Soc. Agric. Eng. 2015, 31, 7–13. [Google Scholar]
- Du, J. Effects of Drought on Grain Yield of Main Grain Producing Areas in China and Countermeasures for Drought Resistance. Ph.D. Thesis, Chinese Academy of Agricultural Sciences, Beijing, China, 2020. [Google Scholar]
- Liu, M.; Liu, P.; Guo, Y.; Wang, Y.; Yu, Y. Change-Point Analysis of Precipitation and Drought Extremes in China over the Past 50 Years. Atmosphere 2019, 11, 11. [Google Scholar] [CrossRef] [Green Version]


| Crops | Critical Period of Water Requirement |
|---|---|
| Wheat | booting stage to heading stage |
| Rice | booting stage to flowering stage |
| Corn | booting stage to milk-ripe stage |
| Ta | Ta < 10 | 10 < Ta < 15 | 15 < Ta < 21 | Ta > 21 | |
|---|---|---|---|---|---|
| Crop Planting Patterns | Spring Corn (NC) | Spring Wheat (NW) | Winter Wheat and Summer Maize | Double-Crop Rice | Triple-Crop Rice |
| Growing period St. | 04–25 | 03–15 | 03–15 | 04–05 | 04–05 |
| CPCWR St. | 08–01 | 05–25 | 04–20 | 06–01 | 06–01 |
| CPCWR E. | 09–05 | 06–20 | 05–10 | 06–20 | 06–20 |
| CPCWR St. | 08–10 | 09–01 | 09–01 | ||
| CPCWR E. | 09–15 | 09–20 | 09–20 | ||
| CPCWR St. | 12–25 | ||||
| CPCWR E. | 02–05 | ||||
| Growing period E. | 09–10 | 08–05 | 09–30 | 10–20 | 03–05 |
| Rcm of EADF (%) | Rcm of EADI (%) | Rcm of EDF (%) | Rcm of EDI (%) | |
|---|---|---|---|---|
| NE | 5.67 | 0.67 | 4.99 | −0.92 |
| NC | 11.26 | 2.22 | 26.43 | 2.82 |
| SE | 7.13 | 1.78 | 64.24 | 14.73 |
| SW | 9.27 | 2.65 | 98.08 | 25.93 |
| QT | −17.78 | −12.00 | −1.83 | −11.21 |
| NW | −16.37 | −10.39 | −9.30 | −4.51 |
| R (p) | NC Region | SW Region | SE Region | ||||
|---|---|---|---|---|---|---|---|
| Yushe | Yangcheng | Bijie | Anshun | Meixian | Wuhua | ||
| Fr. | ED | −0.13 (0.60) | 0.08 (0.74) | −0.63 (0.01) | −0.14 (0.56) | 0.17 (0.52) | 0.08 (0.75) |
| EAD | −0.30 (0.05) | −0.45 (0.06) | −0.59 (0.01) | −0.37 (0.11) | −0.27 (0.31) | −0.29 (0.28) | |
| In. | ED | −0.23 (0.36) | 0.17 (0.49) | −0.15 (0.52) | −0.10 (0.68) | −0.59 (0.02) | −0.37 (0.16) |
| EAD | −0.47 (0.23) | −0.12 (0.63) | −0.24 (0.32) | −0.29 (0.23) | −0.27 (0.30) | −0.06 (0.81) | |
Publisher’s Note: MDPI stays neutral with regard to jurisdictional claims in published maps and institutional affiliations. |
© 2021 by the authors. Licensee MDPI, Basel, Switzerland. This article is an open access article distributed under the terms and conditions of the Creative Commons Attribution (CC BY) license (https://creativecommons.org/licenses/by/4.0/).
Share and Cite
Liu, M.; Guo, Y.; Wang, Y.; Hao, J. Changes of Extreme Agro-Climatic Droughts and Their Impacts on Grain Yields in Rain-Fed Agricultural Regions in China over the Past 50 Years. Atmosphere 2022, 13, 4. https://doi.org/10.3390/atmos13010004
Liu M, Guo Y, Wang Y, Hao J. Changes of Extreme Agro-Climatic Droughts and Their Impacts on Grain Yields in Rain-Fed Agricultural Regions in China over the Past 50 Years. Atmosphere. 2022; 13(1):4. https://doi.org/10.3390/atmos13010004
Chicago/Turabian StyleLiu, Min, Ying Guo, Yanfang Wang, and Jing Hao. 2022. "Changes of Extreme Agro-Climatic Droughts and Their Impacts on Grain Yields in Rain-Fed Agricultural Regions in China over the Past 50 Years" Atmosphere 13, no. 1: 4. https://doi.org/10.3390/atmos13010004
APA StyleLiu, M., Guo, Y., Wang, Y., & Hao, J. (2022). Changes of Extreme Agro-Climatic Droughts and Their Impacts on Grain Yields in Rain-Fed Agricultural Regions in China over the Past 50 Years. Atmosphere, 13(1), 4. https://doi.org/10.3390/atmos13010004