Abstract
Sea breezes are one of the most important weather processes affecting the environmental and climatic features over coastal areas, and the sea breeze from the Pearl River Estuary (PRE) has significant effects on the Pearl River Delta (PRD) region. We simulated a typical sea breeze process that occurred on 27 December 2020 in the PRD region using the Weather Research and Forecasting (WRF) model to quantify the effects of topography and city clusters on the development of the sea breeze circulation. The results show that: (1) the topography on the west coast of the PRD tends to block the intrusion of the sea breeze and detour it along the eastern part of the terrain in the southeast of Jiangmen. The depth of sea breeze along the position of the detour is increased by 120 m, the penetration distance is increased by 40 km, the maximum intensity of sea breeze decreases by ~0.4 m/s, and the time of maximum speed delays for 4 h. However, on the east coast, the topography promotes the sea breeze, resulting in an occurrence about 4 h earlier due to the heating effects. The depth and the speed of the sea breeze are increased by 466 m and 1.2 m/s, respectively. (2) Under the influence of Urban Heat Island Circulation (UHIC), the sea breezes reach cities near the coast an hour earlier and are later inhibited from propagating further inland. Moreover, a wind convergence zone with a speed of 3–5 m/s and a width of about 25 km is formed along the boundary of suburbs and cities in the PRD region. As a result, two important convergence areas: Foshan–Guangzhou, and Dongguan–Shenzhen are formed. (3) Overall, the topography has a more remarkable impact on the mesoscale wind field especially in the mountain and bay areas, resulting in an average speed disturbance of 2.8 m/s. The urban heat island effect is relatively small and on average it causes only ± 0.9–1.8 m/s wind speed perturbations in the periphery of two convergence areas and over PRE.
1. Introduction
Sea and land breezes are regional secondary circulations with a pronounced diurnal cycle due to uneven non-adiabatic heating between sea and land [1,2,3]. The diurnal variation of sea and land breeze leads to changes of meteorological fields, such as three-dimensional wind field, turbulence, and temperature, which are crucial to the transportation of atmospheric materials, energy, and photochemical reaction conditions [4,5,6,7,8]. In addition, sea and land breezes also impose a significant impact on the formation, diurnal variation, and location of precipitation in coastal areas [9,10]. Therefore, sea and land breezes play an important role in the weather and climate over coastal areas. Due to heterogeneous underlying surface conditions, sea breezes vary greatly in different regions.
Compared with land breezes, sea breezes influence coastal weather more significantly and thus, attract more attention from researchers. Since sea breezes are caused by the thermal contrast of the sea and land subsurface, the thermodynamic influence of the underlying surface, including topography and urban heat island effect in the development and evolution process of the sea breeze is of particular importance. Topography affects the moving direction and development of sea breezes through dynamic processes: blocking, forced uplift, bypassing, etc. [11,12,13,14,15,16,17,18]. Meanwhile, the topography also affects sea breezes through thermal processes which may impose forcing in the same or counteracting of the sea breeze circulations [19,20,21]. For example, a coupling of valley winds and sea breeze circulation in the Beijing–Tianjin–Hebei region in China strengthens the sea breeze [21]. Another example is that the Durance Valley in France decreases the temperature gradient along the valley and thus weakens the sea breeze circulation [19].
Urban heat island circulation (UHIC) is another important factor affecting the sea breeze circulation, especially in economically developed urban agglomerations represented by the Pearl River Delta (PRD). The urban–rural thermal differences lead to UHIC [22,23,24], which can affect up to two or three times the size of the urban area and vary with the city scale [25]. The higher the urbanization of the subsurface, the easier it is to identify the sea breeze front, however, its speed of it may be slowed [26,27]. UHIC superimposes on the sea winds and causes complex mesoscale three-dimensional circulation [28,29], accompanied by a weakening of the urban temperature [7,8,25]. In addition, the changes of sensible and latent heat fluxes under the urban thermal structure directly influence the intensity, structure, and propagation distance of sea breezes [14,30]. Although there have been several studies on sea breezes in the PRD region [31,32,33,34,35], there is still a lack of knowledge about how the complex topography and the urban agglomerations in PRD individually and synergistically affect the sea breeze processes in this region.
In this study, we designed three modeling experiments to investigate the topographic and urban effects and their synergistic effects on the sea breeze process that occurred in PRD on 27 December 2020 with the Weather Research and Forecasting (WRF) model. Section 2 describes the characteristics of the case, model setup, and the design of the sensitivity experiments. Section 3 presents the validation of the model results and analyzes the topographic and urban contributions to the sea breeze evolution process. Finally, the main conclusions of this paper are summarized in Section 4.
2. Data and Method
2.1. Data and Case Introduction
Based on the synoptic situation (Figure 1), temperature and wind observations from 1441 surface automatic weather stations (AWS, the location of AWS is indicated in Figure 2), a typical sea breeze process in the PRD on 27 December 2020 was selected for simulation. The land heating effect and the extension inland of the sea breeze reached the maximum in December of that year. Figure 1 shows the surface weather chart of the Hong Kong Observatory on 0800 LST 27 December 2020 (https://www.hko.gov.hk/sc/wxinfo/currwx/wxcht.htm (accessed on 21 December 2021). Note that local times are used in this paper). This process is mainly influenced by a cold high pressure over the mainland of China and a Philippine cyclone. The PRD region is in the front of the high pressure and controlled by the northeast monsoon, with fair and less cloudy weather occurring over PRD. As the cold high pressure weakened and moved eastward it reached a minimum of 1018 hPa at 1400 LST on the 27th, which were favorable for the generation of UHIC and the development of sea breezes [36]. Subsequently, the high pressure at 2000 LST was intensified and caused an intrusion of easterly winds and the cease of the sea breeze.
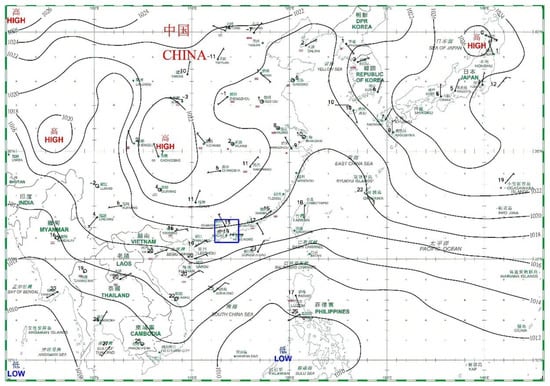
Figure 1.
Hong Kong surface weather chart from Hong Kong Observatory at 0800 LST 27 December 2020, the blue rectangle is the Pearl River Delta (PRD) region in China.
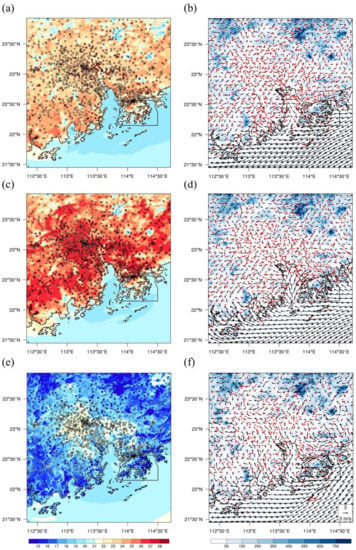
Figure 2.
Simulated (the shaded) and observed (filled dots) 2 m temperature ((a,c,e) unit: °C); Simulated (black vector) and observed (red vector) 10 m wind field ((b,d,f) unit: m/s) superimposed on topographic height (blue shade); The times are 1200 LST (a,b), 1600 LST (c,d), and 2200 LST (e,f) on 27 December 2020, respectively.
The distributions of temperature and wind field in the sea breeze process are shown in Figure 2. The sea breezes in PRD included the sea breezes at Pearl River Estuary (PRE) and the sea breezes progressing northward from the southern sea of PRD. The observed temperature difference between sea and land was 4–5 °C at 1200 LST. The thermal differences established the sea breeze at PRE. The sea breeze propagated northward from the southern sea of PRD, forming the sea breezes at the east and west coast of the PRD, respectively. At 1600 LST, the sea breeze over the PRE reached a strong stage and the difference in temperature between sea and land was 4–6 °C The east coast of the PRE exhibited a westerly wind with a speed of over 3 m/s. The propagation of sea breeze on the west coast was blocked at the west boundary of Zhongshan City influenced by the West River breeze (Figure 2c,d). The location of the West River is shown in Figure 3d). The temperature difference between sea and land in the PRE region weakened to 1–2 °C at 2200 LST, and the temperature in the southern coast of the PRD region was even lower than the ocean (Figure 2e), which cut off the formation of the sea breeze. The combination of the mountain breeze circulation and the intrusion of easterly background winds in the eastern PRD tended to end the sea breeze (Figure 2f).
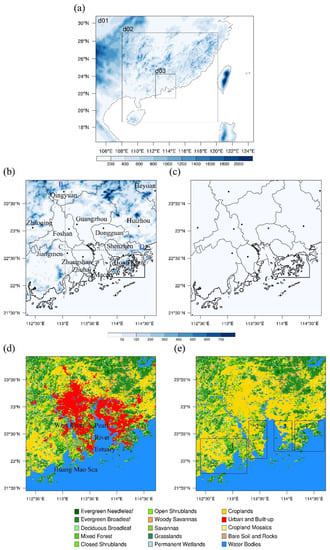
Figure 3.
(a) Model domains and the terrain height (m), (b) terrain height (m) in d03 for CTRL and NoUrb. Black dots show the locations of city centers, (c) terrain height (0 m) in d03 for NoTer, (d) land-use in d03 for CTRL and NoTer, and (e) land use in d03 for NoUrb. The dotted line AB is at 113.05° E and CD is at 22.66° N. The four numbered solid line boxes in Figure 3e mark the west coast of PRD, the west coast of PRE, the east coast of PRE, and the east coast of PRD, in sequence.
2.2. Model and Experiment Design
2.2.1. Model Configuration
To investigate the influence of the mountainous topography and the urban clusters on sea breeze processes in the PRD region, the WRF version 4.2.1 (https://www2.mmm.ucar.edu/wrf/users/tutorial/tutorial_presentations_2021.htm (accessed on 16 December 2021)) was employed to simulate the sea breeze process from 1800 UTC on 25 December 2020 to 0000 UTC on 28 December 2020. The first 22 h in each simulation experiment were regarded as model spin-up time and discarded. The simulation domain was centered at (23.7, 114.7) with 150 (east-west) × 120 (north-south) horizontal grid points with a grid spacing of 15 km for the outer domain (d01), 451 × 421 grid points with a grid spacing of 3 km for the intermediate domain (d02), and 286 × 343 grid points with a grid spacing of 1 km for the innermost domain (d03). The vertical resolution included 46 layers. The MODIS_30s land-use type data were used to specify the model land surface. The topographic data (TOPO_30s) from WRF V4.2.1 were used to derive the terrain height for d01 and d02, and National Aeronautics and Space Administration (NASA) Shuttle Radar Topography Mission (SRTM) 3s data for d03. The National Centers for Environmental Prediction (NCEP) Final Analysis (FNL) data with a 1° by 1° resolution were used as the initial field and boundary conditions for the WRF models. The lateral boundary conditions and sea surface temperatures were both updated every 6 h. The WRF physical schemes adopted in this study included the Yonsei University (YSU) boundary layer scheme [37], Noah land surface scheme [38], Thompson microphysics scheme [39], RRTMG longwave [40], and RRTMG shortwave [41] radiation scheme and Monin–Obukhov surface layer scheme [42]. The Grell–Freitas cumulus scheme [43] was activated for the d01.
2.2.2. Experiment Design
To quantify the effects of topography and urban cities on the sea breeze development, two sensitivity experiments were designed in this study: a No-Terrain experiment (NoTer) and a No-Urban experiment (NoUrb). In both experiments, the model configuration and parameterization scheme were identical to those of the control test (CTRL), except for an artificial modification of the terrain height and underlying surface type, as shown in Table 1 and Figure 3. For the NoTer experiment, the mountain terrain in d03 and the corresponding area d02 was simultaneously removed and buffer zones were constructed based on the linear terrain buffer weighting factors Fs(n) [44]:
where HGT1 is the modified terrain height, HGT0 represents the original terrain height, , n is the order of the model grid layer from outside to inside, and N is the number of buffer circles, which is finally decided by the sensitivity experiment in this paper.
HGT1 = FS(n) × HGT0

Table 1.
Control and sensitivity experiments.
3. Model Results
The sea breezes in the PRD region were mainly divided into four branches in this study: the sea breezes from the west and east coasts of PRD and from the west and east coasts of PRE (Figure 3e).
3.1. Validation of the CTRL Experiment
The results of the CTRL experiment were validated using 2 m temperature and 10 m wind observations from automatic weather stations (Figure 2). In general, CTRL reproduced the sea breeze circulation over the PRD region reasonably well. The occurrence time and location of the sea breeze front, including a period of wind speed growth and an abrupt change in the wind direction, simulated by the CTRL experiment were generally consistent with the observations. The CTRL experiment and observations showed similar high-temperature areas at the southern coast of the PRD and the urban agglomeration areas. The simulated temperature was more evenly distributed than the observation and it was about 1 °C cooler in Dongguan, Zhongshan, and Jiangmen at 1200 and 1600 LST 27 December 2020 (Figure 2a,c). At 2200 LST, in both the observations and CTRL, the temperatures in the urban areas were 2 °C higher than that in the suburbs, which showed that the urban effects were still evident. However, at this time, the land temperature became lower than the sea and hence, the sea breeze was about to disperse (Figure 2e).
For winds, CTRL captured the observed initial development of the sea breeze circulations over the PRE and the east and west coasts of PRD at 1200 LST and a plain–mountain circulation generated near the major peripheral mountain (Figure 2b). At 1600 LST, the model simulated the sea breeze propagating from the west coast of PRE to the junction of Jiangmen and Zhongshan and those from the east coast of PRE to the middle city of Shenzhen. Both agreed with the observation very well (Figure 2d). The model slightly overestimated the winds in the PRE region, possibly due to the land–surface parameterization approximation and the smooth topography in the WRF model [45]. At 2200 LST, the mountain wind circulation driven by the outer PRD mountains developed and became dominant in the region at 2200 LST, and the sea breezes tended to end in both observations and simulated results (Figure 2f).
The simulation of CTRL showed very complicated and highly variable circulations of the sea breeze owing to the forcing of coastlines, hilly topography, and large-scale urban cluster structure in the PRD region. Thus it is very desirable to analyze the thermal and dynamical forcing properties of these factors and their roles in modifying the sea breeze circulation and shaping the complex regional mesoscale circulations in this region.
3.2. Effects of Topography on the Sea Breeze of PRD
The PRD region is featured by complex coastlines and topography. It is surrounded by hills and mountains to its west, north, and east, resulting in a unique trumpet structure of “three sides surrounded by mountains and one side by the sea” [4,46]. The trumpet topography at PRE plays an important role in modulating the variation of the sea and land breezes in the region [1,4,30,31,46]. In this section, the initial period (1000 LST) and the well-developed period (1600 LST) of the sea breeze in the PRD region are selected to analyze the influence of the regional topography on the sea breeze.
The 10 m wind of CTRL and the wind difference between CTRL and NoTer (i.e., CTRL-NoTer) are shown in Figure 4a–d. At 1000 LST, there was a southerly flow towards the mountains in most of the PRD region in CTRL-NoTer, indicating well-established valley wind circulation (Figure 4c). Nevertheless, at this time the valley breeze circulation had no significant effect on the sea breeze, except for the east coast of PRD where the topography tends to promote the occurrence of the sea breeze and guide it inland with an enhanced onshore flow of about 1 m/s on land. Moreover, a center of the onshore wind speed greater than 4.5 m/s was developed near the east coast of PRE. At 1600 LST, the difference between CTRL and NoTer became obvious, the sea breeze of CTRL propagated to the middle of the east coast region of the PRD, while the sea breeze of NoTer was still near the coastline (Figure 4d, see Section 3.4).
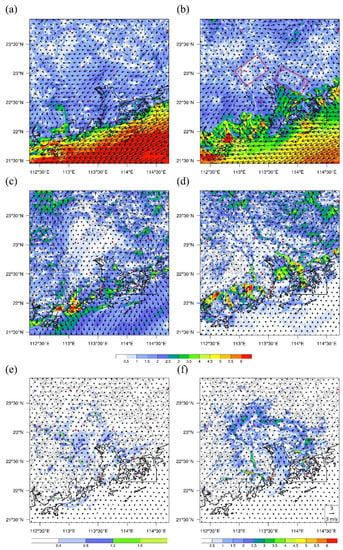
Figure 4.
The 10 m wind vectors and wind speed (the color shade; unit: m/s) of CTRL (a,b), CTRL minus NoTer (c,d), CTRL minus NoUrb (e,f). The red dots mark the city centers and the two red boxes in Figure 4b indicate the Foshan–Guangzhou (box 1) and Dongguan–Shenzhen (box 2) convergence zones. The white dashed box in Figure 4c,d shows the terrain of southeastern Jiangmen City, the left column is for 1000 LST and the right is 1600 LST.
Over the western coast of PRE, there existed an offshore wind with a wind speed of approximately 1 m/s at 1000 LST. At 1600LST, there was still westerly and the velocity near the coastline can reach up to 3 m/s because of the increased speed after the mountain removal. The westerly wind with 3.5–6 m/s in the west boundary of Zhongshan showed the sea breeze in NoTer was ahead of that of CTRL.
On the western PRD coast, the effect of topographic blocking was dominant. At 1000 LST (Figure 4c), the coastal mountains in the PRD prevented the sea breeze from progressing to the north, causing the northerly winds greater than 2 m/s at sea, especially the wind speed near the Huangmao Sea exceeded 6 m/s in CTRL-NoTer. During the northward penetration of the sea breeze along the west coast of PRD, the mountains in the southeast of Jiangmen (the location of this terrain is shown in Figure 4c,d) played an important obstructing role, leading to the sea breeze detouring around the terrain, and accelerating northward mainly from the eastern part of the mountains at 1600 LST (Figure 4d). However, the sea breeze spread westward as a whole in the absence of the mountain (i.e., NoTer), because of being hindered by the enhanced sea breeze on the west coast of PRE. Consequently, the sea breeze of CTRL took the lead in the eastern part of this terrain, while in the western part the sea breeze of NoTer was further inland (see Section 3.4). This difference is due to the altered energy balance in the hilly mountainous area, where the topography increases the upward sensible, latent heat fluxes and the downward soil heat fluxes [14,47], leading to larger temperature and pressure gradients between sea and land and forcing a stronger sea breeze.
In general, the topographies on the east and west coast of the PRD have opposite effects on the sea breezes. The reason may be attributed to the more intricate topographic structure over the east coast (with hilly terraces and alluvial plains), while the west coast is dominated by deltaic plains with steeper topography located in the south close to the sea. This difference became more obvious during the mature period of the sea breeze. Previous studies [48] also found that in the Hong Kong area the hills on the east coast of the PRE are characterized by a heat source during the daytime, which enhances the topographic thermal forcing.
3.3. Effects of Urban Agglomeration on the Sea Breeze of PRD
Previous studies demonstrated that urban heat islands (UHI) of coastal cities can influence regional circulation and modify the sea breeze driven by the temperature difference between land and sea [31]. Figure 4e shows that during the morning hours (1000 LST), the wind perturbations generated by urban heat island circulation (UHIC) in the PRD region were mainly located in the periphery of Foshan, Jiangmen, Dongguan, and Shenzhen. There was a 0.4–2 m/s convergent airflow towards city centers of the Foshan, Guangzhou, and Jiangmen, and 0.4–2 westerly and 0.4–1.2 m/s southerly winds over Shenzhen and Dongguan, respectively. The UHIC weakened the winds in front of the sea breeze and enforced the sea breeze moving deep inland.
In the afternoon (1600 LST) the surface temperature in urban clusters increased, especially in Foshan and Guangzhou, and continuously enhanced the UHI effect (1–3 °C, Figure 5a). The heat difference between the urban and suburban areas formed the urban-rural convergence zones in the city periphery, with a UHIC wind speed of 2–3.5 m/s (Figure 4f). The effect of UHIC in the region is featured by two important convergence zones: the Foshan–Guangzhou and Dongguan–Shenzhen convergence zones (red boxes in Figure 4b). At this time, only the near-shore sea breezes were affected by the UHIC. In the western part of PRD, the sea breeze in front of CTRL was farther inland than NoUrb. UHIC resulted in 4–6 m/s southerly winds (i.e., CTRL-NoUrb) in the south of Jiangmen, indicating that the UHIC of Jiangmen City promotes the sea breeze to move northward (Figure 4f). In addition, urban heating enhanced the temperature gradient between the West River and the surrounding land, which increased the local wind speed by ~4 m/s and hindered the continued westward sea breeze invasion over the west coast of the PRE.
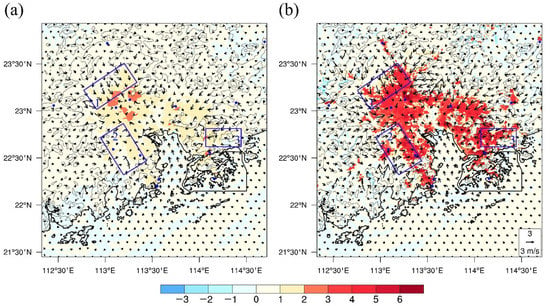
Figure 5.
The differences of 2 m temperature (color shade, °C) and 10 m wind (vectors, m/s) between CTRL and NoUrb at 1600 LST (a) and 1800 LST (b). The blue dots mark the locations of the main city centers. The three blue solid boxes are Foshan–Guangzhou (box 1), Jiangmen–Zhongshan (box 2), and Shenzhen (box 3) urban-rural wind, respectively.
The urban heating effect reached the strongest urban-rural temperature contrast at 1800 LST. The temperature differences between the urban areas and the suburban areas were as high as 3–6 °C (Guangzhou, Dongguan, and Shenzhen in particular), creating a stronger peri-urban temperature gradient. Correspondingly, the wind speeds and the width of the UHIC convergence zones increased to 3–5 m/s and 25 km (Figure 5b).
To further analyze the UHIC effects on the movement and intensity of the sea breeze, the Hovmöller charts of 10 m wind components along two lines, roughly normal to the sea breeze front, were constructed. Line AB passes near the city centers including Jiangmen, Foshan, and Qingyuan, the major cities on the western coast in PRD, and the profile CD passes through the PRE (see Figure 3b for the locations of the lines). Figure 6 shows the 10 m wind of the Hovmöller (HM) diagram. Comparing Figure 6a,c, there was little difference in the sea breeze at sea between CTRL and NoUrb. Over the western coast of PRD, the urban heating weakened the northerly winds in the south of Jiangmen by 0.5–1.5 m/s, which were in front of the sea breeze of CTRL. The UHIC increased the sea breeze by 0.5–1 m/s as it passed the south of Jiangmen at 1800 LST. The sea breeze front of CTRL arrived at Jiangmen 1 h earlier than in NoUrb, indicating that the Jiangmen city helped “attract” the incoming sea breeze from the south. Subsequently, the superposition of the sea breeze and the weakening UHIC in the south of Foshan increased the sea breeze speed by 0.5 m/s. The pressure gradient force generated by the urban thermal effect in the north of Foshan blocked the sea breeze from invading further inland, and the sea breeze reached as far as 23.18° N.
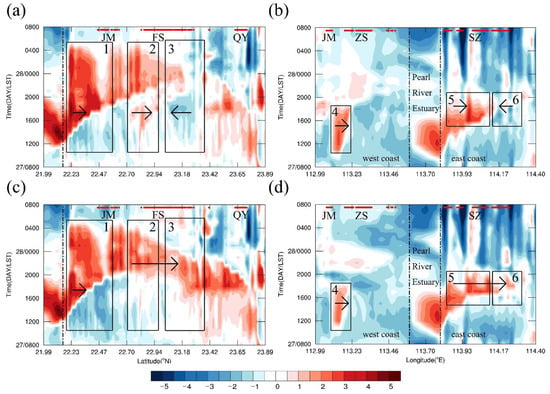
Figure 6.
Hovmöller chart of 10 m wind component (unit: m/s) along the crossline AB (a,c) and CD (b,d) for CTRL (a,b) and NoUrb (c,d) experiment, the shaded in the left column is v component, and the right is u component, the time axis is 0800 LST 27 December to 0800 LST 28 December, the black dotted lines indicate sea and land boundary, the red dots are city underlying surface and the letters are abbreviated for cities. Solid boxes 1–3 and 5–6 are UHICs in Jiangmen, southern and northern Foshan, western and eastern Shenzhen, respectively. Box 4 is the West River breeze. The arrows indicate the flow moving directions in the plane.
The sea breeze on the west coast of the PRE in CTRL continuously propagated westward from 0800 to 1800 LST. The thermal effect of Jiangmen and Zhongshan strengthened the sea breeze speed over the West River by 1 m/s. Whereafter the sea breeze was stagnant near the river and reached up to 113.23° E (the sea breeze in NoUrb propagated across the river to about 112.99° E). In addition, on the west coast of the PRE, the friction in the urban area in CTRL weakened the intruding easterly winds by 0.5–1 m/s.
On the east coast of the PRE (Figure 6b), the CTRL experiment initiated the sea breeze at 1000 LST. The sea breeze penetrated as far as 114.28° E at 1800 LST and then disappeared at 2200 LST under the influence of background easterly winds. Because of the UHIC effect in western Shenzhen, the sea breeze propagated to eastern Shenzhen 1 h earlier and the sea breeze speed was increased by 1.5 m/s. After that, the sea breeze moved slower due to the presence of 2.5 m/s UHIC obstructing airflow in eastern Shenzhen (Shenzhen section of the urban-rural convergence zone, indicated by box 3 in Figure 5). After removing the urban land use (NoUrb), the sea breeze spread over the whole eastern part of Shenzhen and progressed eastward nearly 25 km at around 1700 LST.
3.4. Synergistic Effect of Topography and Urban Cluster on the Sea Breeze
During the initial development of the sea breeze, on the east coast of PRE, the UHIC and topographic effect drove southwesterly winds at a speed of 0.4–2 m/s and 0.5–5 m/s, respectively (Figure 4). This superposing forcing promoted the sea breeze advancing northward. In contrast, on the western PRD coast, the mountains mainly enhanced the southerly airflow inland, together with the southerly wind of urban effect weakened the offshore background wind and propelled the sea breeze inland.
During the intense sea breeze period, along the western PRD coast, the acceleration of the flow detoured by the mountain to the south of Jiangmen was superimposed with the Jiangmen UHIC to drive the sea breeze northwards. The 1–3.5 m/s urban-rural wind (Figure 4f) in the northern Foshan-Guangzhou convergence zone, central Guangzhou, and Dongguan was weakened by the reverse 1–2 m/s residual valley winds (Figure 4d), and the sea breeze was hindered by the UHIC flow. The topography and cities helped the development of southward winds in the PRE, with maxima of about 5.5 m/s and 2 m/s, respectively, and induced the sea breeze to propagate northward.
Based on the method of Miao et al. [21] and in consideration of the undulating hills and terraces in the PRD region, a height with a large vertical velocity at around 300 height (the 6th model layer) was used to determine the sea breeze front. In order to take the variation of boundary layer height into account [4], the 10 m wind speed, u and v components, and boundary layer heights were also used as extra aids. The locations of the sea breeze fronts for CTRL, NoTer, and NoUrb are shown in Figure 7. At 1200 LST (Figure 7a), the sea breeze front of NoTer appeared at the coastal line and the leading front of the sea breeze was roughly parallel to the coastline. In the eastern PRD, at 1600 LST, the sea breeze front in NoTer lagged far behind CTRL and NoUrb, while in the western PRD, the sea breeze front was ahead of the other two experiments (Figure 7b). This is because the development of sea breeze along the eastern PRD coast is influenced by the topographic thermal effect, while the sea breeze on the west coast is mainly influenced by the blocking effect of topography (see Section 3.2 for detailed explanation). Thus, topography imposes an important effect on the initial development of the sea breeze in the PRD. At 2200 LST the sea breeze in NoTer fell behind of the other two experiments and vanished earlier too (Figure 7d).
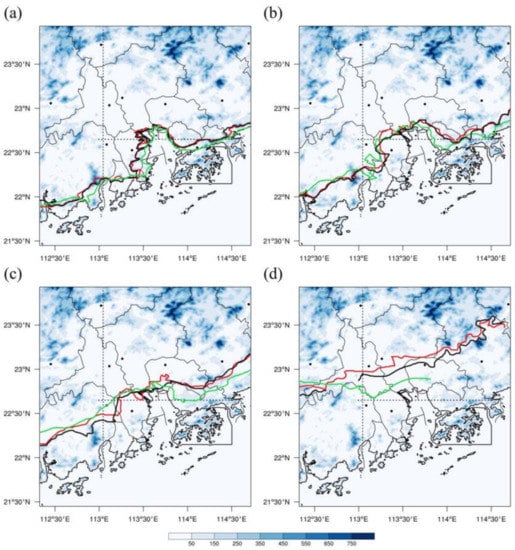
Figure 7.
The locations of the sea breeze front at 1200 LST (a), 1600 LST (b), 1800 LST (c), 2200 LST (d) on 27 December 2020 for CTRL (red line), NoUrb (black line), NoTer (green line) experiments. The dotted lines are consistent with lines AB and CD in Figure 3b.
As for the urban effects, at 1200 LST (Figure 7a), the position of the sea breeze fronts of CTRL and NoUrb were almost identical. The urban effects were more pronounced at 1600 LST (Figure 7b). The position of the sea breeze fronts in CTRL was closer to inland than NoUrb. The urban heating island effect of 1–3 °C accelerated the propagation of the sea breeze (Figure 5a). On the west coast of the PRE, the sea breeze in CTRL moved slower. The reason is that the river breeze from the West River impedes the advance of the sea breeze (Figure 6b, explained in Section 3.3). At 1800 LST, the sea breeze on the east coast of the PRE in CTRL was retarded by the UHIC of Shenzhen (Figure 6b) and Dongguan (Figure 7c), taking approximately the same position as that of NoUrb. The UHIC of Jiangmen City on the west coast in the PRD promoted the penetration of sea breeze to inland (see Section 3.3) and made the CTRL sea breeze front advance a farther distance, as does the north coast (Figure 7c). At 2200 LST, the terrain effect promoted a southerly wind with a speed of 2–5.5 m/s in the PRE (Figure 4d), and the UHIC in the south of Foshan–Guangzhou enhanced the sea breeze. The combined effect of topography and city made the CTRL sea breeze at the northern coast of PRE farther into the north (Figure 7d). Obviously, the topography has much larger effects on the sea breeze than the urban agglomerations.
Table 2 summarizes the characteristics of the sea breezes along the lines AB (representing the western PRD coast) and CD (representing the east and west coast of the PRE) for the three experiments. The mountains enhanced the sea breeze overall. On the eastern PRE coast, the topographic effect led to the sea breeze being initiated 4 h earlier, the thickness of the sea breeze increased by 466 m, the maximum wind speed enhanced by 1.2 m/s and its corresponding time delayed by 1 h. On the west coast of the PRE, the topography prompted the sea breeze to emerge 2 h earlier, whereas the maximum intensity was weakened by 0.7 m/s, and the depth was reduced by 7 m. On the western coast of the PRD, the depth of the sea breeze was increased by 120 m along line AB, the sea breeze penetration distance was increased by 40 km, and the time of maximum speed was delayed by 4 h. It is worth pointing out that the enhancement of the background wind after removing the topography caused the weakening of the maximum intensity of sea breeze (by ~0.4 m/s).

Table 2.
Statistics characteristics of the sea breeze of the three experiments (Line AB/Line CD in the east coast/Line CD in the west coast).
In a brief, on the east coast of PRE, where the topographic thermal effects are dominant, all characteristics of sea breeze are intensified, but on the west coast of PRE and of PRD, where the terrain blocking effects are primary, the enhancement of sea breeze features are weaker, and the maximum intensity is decreased.
The urban effect strengthened the sea breeze overall, with an increase in the sea breeze thickness by 261 m and the maximum intensity by 0.6 m/s on the east coast of the PRE. The cities also increased sea breeze thickness by 1 (123) m and the maximum sea breeze intensity by 0.2 (0.6) m/s as the sea breeze progressed westward on the west coast of PRE (northward on the western PRD coast). The urban effect resulted in the sea breeze onset 1 h earlier on the west coast of PRE.
Likewise, the maximum intrusion distance of the northward propagation of the sea breeze on the western coast of PRD increased by 4 km. This is because the UHIC of southern Jiangmen and Foshan accelerate sea breezes. In addition, although the Foshan–Guangzhou urban-rural wind circulation evidently (indicated by box 1 in Figure 5) blocked the sea breeze, this area is farther away from the coast and the UHIC was already weaker when it interacted with the sea breeze, so the overall UHIC performance was a boost to the sea breeze.
3.5. Statistical Properties of Wind Disturbances by Terrain and Urban Cluster
To quantitatively assess the overall wind disturbance by topographic forcing and urban agglomeration, the root mean squared difference (RMSD) of the wind speed for NoUrthe b and NoTer relative to CTRL was calculated separately for the whole day of the 27th (27th 0000 LST-28th 0000 LST) following
where N is the sampling time (when examining the spatial distribution) or the sampling point (when examining the time series), T is the wind speed for NoTer or NoUrb, and C is the wind speed of CTRL.
As shown in Figure 8, the topographic and urban effect led to large wind disturbances in the mountainous, coastal, urban-adjacent areas (especially near the two UHIC-induced convergence zones), and the PRE, with RMSD of wind speed up to 2.8 m/s. The disturbances were most significant in the periphery of Foshan–Guangzhou, and Dongguan–Shenzhen, and the PRE. This indicates that the influence of the topography plays a dominant role in the region near the mountains and bays in the PRD. The wind perturbation by the topography was 2–3 times more than that generated by UHIC although the urban effect was stronger in Foshan and Shenzhen.
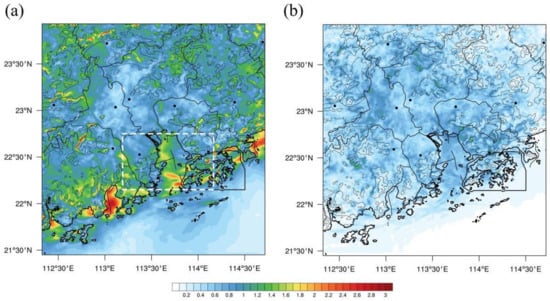
Figure 8.
Twenty-four-hour mean RMSD of 10 m wind speed for NoTer (a) and NoUrb (b) compared to CTRL (from 0000 LST 27 December to 0000 LST 28 December 2020). The white dotted box in Figure 8a shows the location of PRE (113.19–114.166° E, 22.15–22.75° N).
The variation of wind speed RMSD with time for NoTer or NoUrb (Figure 9) versus CTRL also showed that the influence of topography on PRD wind speed (0.74–1.16 m/s) was greater than the urban effect (0.18–0.66 m/s). The daily variation displayed a decreasing RMSD after the sunrise and the associated valley breeze circulation, reaching a trough of 0.74 m/s at 1500 LST. Subsequently, the topographic effect kept greater than 1 m/s with the diminution of the surface heating in PRD. The urban effect dropped to a minimum of 0.18 m/s at 1100 LST and reached its strongest value of about 0.66 m/s at 2000 LST, falling behind the time of the warmest urban heat island (at 1800 LST).
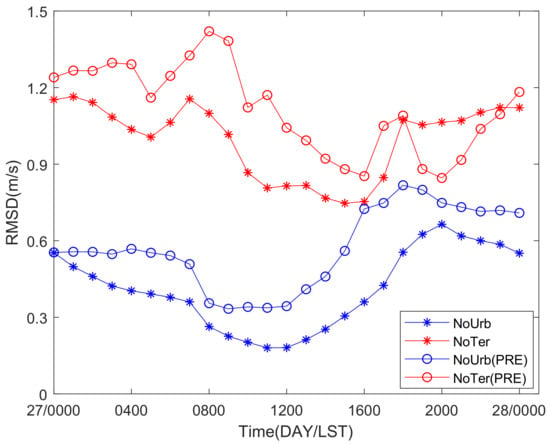
Figure 9.
The time evolution of spatial averaged wind speed RMSD of NoTer (red) and NoUrb (blue) versus CTRL for d03 (solid line with an asterisk) and PRE (shown in the white dotted box in Figure 8a, a solid line with circle), respectively.
Compared with the larger d03 area, the topography and urban effects in the PRE modified the wind more significantly (Figure 9). The terrain played a dominant role in disturbing the wind throughout the day on the 27th, and the wind speed RMSD caused by the topography was about twice of the city. During 1000–2200 LST, the main life span of the sea breeze, the topographic perturbance decreased, and the urban effect increased as the sea breeze expanded inland. After the sea breeze was well developed (1600 LST), the topographic and UHIC contributions to the wind perturbations were comparable, with a difference of merely 0.08–0.3 m/s.
4. Summary and Discussion
In this paper, the WRF model was employed to study the effect of the large-scale urban agglomeration and complex terrain on sea breezes during winter in the highly developed Pearl River Delta (PRD) region. The topographic forcing and urban heat island effect on the sea breeze development, including the spatial and temporal variations of winds, the extent of sea breezes, and the sea breeze front location and movement were quantitatively analyzed with sensitivity experiments of terrain-removal and land-use replacement. The main findings are as follows:
- (1)
- During the initial development of the sea breeze, the western coast of the PRD was dominated by the blocking effect of mountains to the sea breeze, while on the east coast the thermal effect of the hills dominated and promoted the sea breeze development evidently. The topography blocked the sea breeze from invading inland in the western PRD coast and changed the wind with a maximum of 6 m/s. During the later stage, the topography caused an onshore wind on the east coast with a speed center of 4.5 m/s, which enhanced the sea breeze there.
- (2)
- In the western PRD, the UHIC of the urban agglomeration indirectly promoted the sea breeze propagation by weakening the offshore background wind by 0.5–1.5 m/s during the daytime and made the sea breeze arrive at Jiangmen one hour earlier. On the east coast of the PRE, the Shenzhen UHIC superimposed with the sea breeze in the same direction, promoted wind speed of the sea breeze by 1.5 m/s, and advanced the arrival time in eastern Shenzhen by 1 h. The urban cluster produced a 3–6 °C warmer temperature than the suburban and an urban-rural convergence zone about 25 km wide with a wind speed of 3–5 m/s was developed. There were two important urban-induced convergence zones formed: one is at the Foshan–Guangzhou and the other was at Dongguan–Shenzhen. The Shenzhen–Dongguan and Jiangmen–Zhongshan sections of the convergence zone impeded the advance of sea breeze on the east and west coasts of the PRE, respectively.
- (3)
- Overall, the topography in PRD enhanced the sea breeze in the region. On the east coast of PRE, all properties of the sea breeze were intensified by the topography, whereas on the west coast of PRE and the most western regions of PRD, the enhancements of sea breeze features by topography were small. On the east coast of the PRE, the topographic effect resulted in a 4 h earlier development of the sea breeze, with its depth increased by 466 m, the maximum wind speed by 1.2 m/s, and the corresponding time of maximum velocity delayed by 1 h. On the west coast of the PRD (PRE), the depth of sea breeze was increased by 120 m (decreased by 7 m), the sea breeze penetration distance by 40 km, the maximum intensity of the sea breeze decreased by ~0.4 m/s (0.7 m/s), and the time of maximum speed delayed by 4 h (0 h). The urban effect also strengthened the sea breeze in general, increasing the sea breeze thickness by 261 m (123 m) and the maximum intensity by 0.6 m/s (0.6 m/s) on the east coast of the PRE (the western PRD coast). Moreover, the maximum intrusion distance on the west coast of the PRD increased by 4 km. The UHIC of southern Jiangmen and Foshan accelerated the sea breezes.
- (4)
- The areas that were most significantly affected by the topography in the PRD are in the vicinity of mountains and bays where the wind speed RMSD can reach more than 2.8 m/s. The urban-induced wind perturbation was only at about 1 m/s, mainly in the two convergence zones generated by the urban and in the sea of PRE. Near the bay and the mountain regions of the PRD region the topography effects dominated, whereas, for Foshan and Shenzhen, where the urban effects were stronger, the UHICs exhibited comparable effect to the topographic forcing. The topography effects were dominant but decreased with the development of the valley breeze circulation. In the PRE, where the sea breeze circulation was strong, the disturbance of wind speeds caused by topography was about twice that of the urban.
Author Contributions
Conceptualization, G.H., Y.L. (Yubao Liu) and G.Y.; methodology, G.H., Y.L. (Yubao Liu) and G.Y.; validation, G.H. and Y.L. (Yubao Liu); formal analysis, G.H.; investigation, G.H.; resources, Y.J. and Y.L. (Yuewei Liu); writing—original draft preparation, G.H.; writing—review and editing, G.H., Y.L. (Yubao Liu), G.Y., Z.S. and X.M.; visualization, G.H., Z.S., Z.H. and Y.L. (Yang Li); funding acquisition, Y.L. (Yubao Liu), Y.J. and Y.L. (Yuewei Liu). All authors have read and agreed to the published version of the manuscript.
Funding
This research was funded by the Northwestern Region’s Artificial Weather Modification Capacity Building Project (ZQC-R19176, ZQC-R19081) and partially supported by the SGCC Science and Technology Project: 5200-201955490A-0-0-00.
Institutional Review Board Statement
Not applicable.
Informed Consent Statement
Not applicable.
Data Availability Statement
Not applicable.
Acknowledgments
The modeling simulations were carried out on the supercomputer provided by the Nanjing University of Information Science and Technology.
Conflicts of Interest
The authors declare no conflict of interest.
References
- Lin, W.; Wang, A.; Wu, C.; Fong, S.; Ku, C. A case modeling of sea-land breeze in macao and its neighborhood. Adv. Atmos. Sci. 2001, 18, 1231–1240. [Google Scholar] [CrossRef]
- Hughes, M.; Hall, A.; Fovell, R.G. Dynamical controls on the diurnal cycle of temperature in complex topography. Clim. Dyn. 2007, 29, 277–292. [Google Scholar] [CrossRef]
- Rani, S.I.; Ramachandran, R.; Subrahamanyam, D.B.; Alappattu, D.P.; Kunhikrishnan, P.K. Characterization of sea/land breeze circulation along the west coast of Indian sub-continent during pre-monsoon season. Atmos. Res. 2010, 95, 367–378. [Google Scholar] [CrossRef]
- Ding, A.; Wang, T.; Zhao, M.; Wang, T.; Li, Z. Simulation of sea-land breezes and a discussion of their implications on the transport of air pollution during a multi-day ozone episode in the Pearl River Delta of China. Atmos. Environ. 2004, 38, 6737–6750. [Google Scholar] [CrossRef]
- Soler, M.R.; Arasa, R.; Merino, M.; Olid, M.; Ortega, S. Modelling Local Sea-Breeze Flow and Associated Dispersion Patterns Over a Coastal Area in North-East Spain: A Case Study. Bound. Layer Meteorol. 2011, 140, 37–56. [Google Scholar] [CrossRef]
- Hai, S.; Miao, Y.; Sheng, L.; Wei, L.; Chen, Q. Numerical Study on the Effect of Urbanization and Coastal Change on Sea Breeze over Qingdao, China. Atmosphere 2018, 9, 345. [Google Scholar] [CrossRef]
- He, B.; Ding, L.; Prasad, D. Wind-sensitive urban planning and design: Precinct ventilation performance and its potential for local warming mitigation in an open midrise gridiron precinct. J. Build. Eng. 2020, 29, 101145. [Google Scholar] [CrossRef]
- He, B.; Ding, L.; Prasad, D. Relationships among local-scale urban morphology, urban ventilation, urban heat island and outdoor thermal comfort under sea breeze influence. Sustain. Cities Soc. 2020, 60, 102289. [Google Scholar] [CrossRef]
- Huang, W.R.; Wang, S.Y. Impact of land–sea breezes at different scales on the diurnal rainfall in Taiwan. Clim. Dyn. 2013, 43, 1951–1963. [Google Scholar] [CrossRef]
- Chen, X.; Zhang, F.; Zhao, K. Diurnal Variations of the Land–Sea Breeze and Its Related Precipitation over South China. J. Atmos. Sci. 2016, 73, 4793–4815. [Google Scholar] [CrossRef]
- Monserrat, S.; Ramis, C. Dynamic stability of a three layer model with discontinous profile of wind and temperature. J. Atmos. Sci. 1990, 47, 2108–2114. [Google Scholar] [CrossRef]
- Millán, M.M.; Mantilla, E.; Salvador, R.; Carratalá, A.; Sanz, M.J.; Alonso, L.; Gangoiti, G.; Navazo, M. Ozone Cycles in the Western Mediterranean Basin: Interpretation of Monitoring Data in Complex Coastal Terrain. J. Appl. Meteorol. 2000, 39, 487–508. [Google Scholar] [CrossRef]
- Miller, S.T.K.; Keim, B.D.; Talbot, R.W.; Mao, H. Sea breeze: Structure, forecasting, and impacts. Rev. Geophys. 2003, 41, 1011. [Google Scholar] [CrossRef]
- Miao, J.; Kroon, L.J.M.; de Arellano, J.V.-G.; Holtslag, A.A.M. Impacts of topography and land degradation on the sea breeze over eastern Spain. Meteorol. Atmos. Phys. 2003, 84, 157–170. [Google Scholar] [CrossRef]
- Crosman, E.T.; Horel, J.D. Sea and Lake Breezes: A Review of Numerical Studies. Bound. Layer Meteorol. 2010, 137, 1–29. [Google Scholar] [CrossRef]
- Abatan, A.A.; Abiodun, B.J.; Omotosho, B.J. On the characteristics of sea breezes over Nigerian coastal region. Theor. Appl. Clim. 2013, 116, 93–102. [Google Scholar] [CrossRef]
- Qian, T.; Epifanio, C.C.; Zhang, F. Topographic Effects on the Tropical Land and Sea Breeze. J. Atmos. Sci. 2012, 69, 130–149. [Google Scholar] [CrossRef]
- Barthlott, C.; Kirshbaum, D.J. Sensitivity of deep convection to terrain forcing over Mediterranean islands. Q. J. R. Meteorol. Soc. 2013, 139, 1762–1779. [Google Scholar] [CrossRef]
- Bastin, S.; Drobinski, P.; Dabas, A.; Delville, P.; Reitebuch, O.; Werner, C. Impact of the Rhône and Durance valleys on sea-breeze circulation in the Marseille area. Atmos. Res. 2005, 74, 303–328. [Google Scholar] [CrossRef]
- Jeong, J.H.; Song, S.K.; Lee, H.; Kim, Y.K. Effects of high-resolution land cover and topography on local circulations in two different coastal regions of Korea: A numerical modeling study. Meteorol. Atmos. Phys. 2012, 118, 1–20. [Google Scholar] [CrossRef]
- Miao, Y.; Liu, S.; Zheng, Y.; Wang, S.; Chen, B. Numerical Study of the Effects of Topography and Urbanization on the Local Atmospheric Circulations over the Beijing-Tianjin-Hebei, China. Adv. Meteorol. 2015, 2015, 397070. [Google Scholar] [CrossRef]
- Freitas, E.D.; Rozoff, C.M.; Cotton, W.R.; Dias, P.L.S. Interactions of an urban heat island and sea-breeze circulations during winter over the metropolitan area of São Paulo, Brazil. Bound. Layer Meteorol. 2006, 122, 43–65. [Google Scholar] [CrossRef]
- Ribeiro, F.N.D.; de Oliveira, A.P.; Soares, J.; de Miranda, R.M.; Barlage, M.; Chen, F. Effect of sea breeze propagation on the urban boundary layer of the metropolitan region of Sao Paulo, Brazil. Atmos. Res. 2018, 214, 174–188. [Google Scholar] [CrossRef]
- Bryant, E. Local climate processes in the Illawarra. Wollongong Stud. Geogr. 1982, 11, 1–4. [Google Scholar]
- He, B. Potentials of meteorological characteristics and synoptic conditions to mitigate urban heat island effects. Urban Clim. 2018, 24, 26–33. [Google Scholar] [CrossRef]
- Lin, C.; Chen, F.; Huang, J.; Chen, W.; Liou, Y.; Chen, W.; Liu, S. Urban Heat Island effect and its impact on boundary layer development and land-sea circulation over northern Taiwan. Atmos. Environ. 2008, 42, 5635–5649. [Google Scholar] [CrossRef]
- Leroyer, S.; Belair, S.; Husain, S.; Mailhot, J. Subkilometer Numerical Weather Prediction in an Urban Coastal Area: A Case Study over the Vancouver Metropolitan Area. J. Appl. Meteorol. Clim. 2014, 53, 1433–1453. [Google Scholar] [CrossRef]
- Hidalgo, J.; Masson, V.; Pigeon, G. Urban-breeze circulation during the CAPITOUL experiment: Numerical simulations. Meteorol. Atmos. Phys. 2008, 102, 243–262. [Google Scholar] [CrossRef]
- Chemel, C.; Sokhi, R.S. Response of London’s Urban Heat Island to a Marine Air Intrusion in an Easterly Wind Regime. Bound. Layer Meteorol. 2012, 144, 65–81. [Google Scholar] [CrossRef]
- Zeng, L.; Lin, W.; Fan, Q.; Feng, Y. Simulation of Wind Circulation and Pollutant Diffusion Over the Pearl River Delta Region. Environ. Model. Assess. 2012, 17, 539–553. [Google Scholar] [CrossRef]
- Lo, J.C.F.; Lau, A.K.H.; Chen, F.; Fung, J.C.H.; Leung, K.K.M. Urban Modification in a Mesoscale Model and the Effects on the Local Circulation in the Pearl River Delta Region. J. Appl. Meteorol. Clim. 2007, 46, 457–476. [Google Scholar] [CrossRef]
- Lu, X.; Chow, K.C.; Yao, T.; Fung, J.C.H.; Lau, A.K.H. Seasonal variation of the land-sea breeze circulation in the Pearl River Delta region. J. Geophys. Res. Atmos. 2009, 114, D17112. [Google Scholar] [CrossRef]
- Lu, X.; Chow, K.C.; Yao, T.; Lau, A.K.H.; Fung, J.C.H. Effects of urbanization on the land sea breeze circulation over the Pearl River Delta region in winter. Int. J. Clim. 2010, 30, 1089–1104. [Google Scholar] [CrossRef]
- Cheng, Y.; Fung, C.H.J. Characteristics of the Sea-Breeze Circulation in the Pearl River Delta Region and Its Dynamical Diagnosis. J. Appl. Meteorol. Clim. 2019, 58, 741–755. [Google Scholar] [CrossRef]
- Yeung, P.S.; Fung, J.C.H.; Ren, C.; Xu, Y.; Huang, K.; Leng, J.; Wong, M.M.F. Investigating Future Urbanization’s Impact on Local Climate under Different Climate Change Scenarios in MEGA-urban Regions: A Case Study of the Pearl River Delta, China. Atmosphere 2020, 11, 771. [Google Scholar] [CrossRef]
- Shreffler, J.H. Detection of centripetal heat-island circulations from tower data in St. Louis. Bound. Layer Meteorol. 1978, 15, 229–242. [Google Scholar] [CrossRef]
- Hong, S.; Noh, Y.; Dudhia, J. A New Vertical Diffusion Package with an Explicit Treatment of Entrainment Processes. Mon. Weather Rev. 2006, 134, 2318–2341. [Google Scholar] [CrossRef]
- Niu, G.; Yang, Z.; Mitchell, E.K.; Chen, F.; Ek, B.M.; Barlage, M.; Kumar, A.; Manning, K.; Niyogi, D.; Rosero, E.; et al. The community Noah land surface model with multiparameterization options (Noah-MP): 1. Model description and evaluation with local-scale measurements. J. Geophys. Res. Atmos. 2011, 116, D12109. [Google Scholar] [CrossRef]
- Thompson, G.; Field, P.R.; Rasmussen, R.M.; Hall, W.D. Explicit Forecasts of Winter Precipitation Using an Improved Bulk Microphysics Scheme. Part II: Implementation of a New Snow Parameterization. Mon. Weather Rev. 2008, 136, 5095–5115. [Google Scholar] [CrossRef]
- Mlawer, E.J.; Taubman, S.J.; Brown, P.D.; Iacono, M.J.; Clough, S.A. Radiative transfer for inhomogeneous atmospheres: RRTM, a validated correlated-k model for the longwave. J. Geophys. Res. Atmos. 1997, 102, 16663–16682. [Google Scholar] [CrossRef]
- Iacono, M.J.; Delamere, J.S.; Mlawer, E.J.; Shephard, M.W.; Clough, S.A.; Collins, W.D. Radiative forcing by long-lived greenhouse gases: Calculations with the AER radiative transfer models. J. Geophys. Res. Atmos. 2008, 113, D13103. [Google Scholar] [CrossRef]
- Jiménez, A.P.; Dudhia, J.; Fidel, G.R.J.; Navarro, J.; Montávez, J.P.; Elena, G.B. A Revised Scheme for the WRF Surface Layer Formulation. Mon. Weather Rev. 2012, 140, 898–918. [Google Scholar] [CrossRef]
- Grell, G.A.; Freitas, S.R. A scale and aerosol aware stochastic convective parameterization for weather and air quality modeling. Atmos. Chem. Phys. 2014, 14, 5233–5250. [Google Scholar] [CrossRef]
- Zhong, Z.; Su, B.; Zhao, M.; Tang, J. Numerical Experiments on the Effects of Lateral Boundary Topographic Buffer Zone in Regional Climate Model. Plateau Meteorol. 2004, 1, 48–54. [Google Scholar]
- Allende-Arandía, M.E.; Zavala-Hidalgo, J.; Torres-Freyermuth, A.; Appendini, C.M.; Cerezo-Mota, R.; Taylor-Espinosa, N. Sea-land breeze diurnal component and its interaction with a cold front on the coast of Sisal, Yucatan: A case study. Atmos. Res. 2020, 244, 105051. [Google Scholar] [CrossRef]
- Wang, G.; Guan, D.; Xiao, L.; Peart, M.R. Forest biomass-carbon variation affected by the climatic and topographic factors in Pearl River Delta, South China. J. Environ. Manag. 2019, 232, 781–788. [Google Scholar] [CrossRef]
- Segal, M.; Arritt, R.W. Nonclassical Mesoscale Circulations Caused by Surface Sensible Heat-Flux Gradients. Bull. Am. Meteorol. Soc. 1992, 73, 10. [Google Scholar] [CrossRef]
- Chen, X.; Wang, A.; Li, J.; Liu, J.; Lin, W.; Fong, S. Numerical Experiment Research on Sea and Land Breezes over Hong Kong. Sci. Meteorol. Sin. 2007, 5, 473–480. [Google Scholar]
Publisher’s Note: MDPI stays neutral with regard to jurisdictional claims in published maps and institutional affiliations. |
© 2021 by the authors. Licensee MDPI, Basel, Switzerland. This article is an open access article distributed under the terms and conditions of the Creative Commons Attribution (CC BY) license (https://creativecommons.org/licenses/by/4.0/).