Abstract
Many studies have shown that air pollutants have complex impacts on urban precipitation. Meteorological weather station and satellite Aerosol Optical Depth (AOD) product data from the last 20 years, combined with simulation results from the Weather Research and Forecasting model coupled with Chemistry (WRF-Chem), this paper focuses on the effects of air pollutants on summer precipitation in different regions of Beijing. These results showed that air pollution intensity during the summer affected the precipitation contribution rate (PCR) of plains and mountainous regions in the Beijing area, especially in the plains. Over the past 20 years, plains PCR increased by ~10% when the AOD augmented by 0.15, whereas it decreased with lower pollution levels. In contrast, PCR in mountainous areas decreased with higher pollution levels and increased with lower pollution levels. Our analysis from model results indicated that aerosol increases reduce the effective particle size of cloud droplets and raindrops. Smaller cloud raindrops more readily transport to high air layers and participate in the generation of ice-phase substances in the clouds, increasing the total amount of cloud water in the air in a certain time, which ultimately enhanced precipitation intensity on the plains. The removal of pollutants caused by increased precipitation in the plains decreased rainfall levels in mountainous areas.
1. Introduction
Complex interactions occur between air pollutants and precipitation. Precipitation has significant removal effects on air pollutants [1,2,3], and the removal efficiency is closely related to the intensity of precipitation [4,5]. At the same time, air pollutants also have an important impact on cloud formation [6,7,8]. The interaction between air pollutants and rainfall is bidirectional and inseparable, and this poses difficulties to their scientific study.
Many studies have indicated that the increase of aerosols caused by air pollution can reduce the particle size of cloud droplets and raindrops and finally reduce the precipitations [9,10,11,12,13]. However, under the condition of sufficient water vapor supply, a large number of cloud and rain droplets with reduced particle size may be brought to the upper air, further promoting the development of ice-phase cloud microphysical processes in the cloud, making the development of cloud more vigorous and promoting life cycle growth and the increase in precipitations and their intensity [14,15,16,17]. In addition, the emission of some special pollutants (such as black carbon) will also affect these dynamic conditions, energy distribution, and water vapor transmission in the process of cloud system development and eventually influence the distribution and intensity of precipitations [18,19,20]. Aerosol combined with the urbanization effect will also strengthen the formation of storms [21,22]. These effects of pollutant emission on precipitation are very complex and are related to the type of aerosol, water vapor, dynamic conditions, and precipitation.
As a super big city, Beijing has a high population density. Anthropogenic air pollutant emission is a factor impacting the environment that cannot be ignored. At the same time, aerosol changes also greatly participate in the occurrence and development of precipitation in Beijing [23,24,25]. Studies have shown that although the South-to-North Water Diversion Project has improved Beijing’s water resources [26], Beijing’s water resources are still greatly affected by precipitation, especially that from June to August in summer. Therefore, analyzing the impact of air pollution on summer precipitation in Beijing has important significance for urban water resources utilization. In this study, meteorological weather stations and satellite Aerosol Optical Depth (AOD) product collected in the recent 20 years were used to analyze the changes in precipitation characteristics caused by pollutants.
The Weather Research and Forecasting model coupled with the Chemistry model (WRF-Chem) simulated the emission, transport, mixing, and chemical transformation of trace gases and aerosols simultaneously with meteorology. The model has been used to investigate regional-scale air quality [27,28,29], for field program analyses [30], and to examine cloud-scale interactions between clouds and chemistry [17,18]. In this work, we focused on whether air pollution has different effects on summer precipitation in different regions of Beijing (mountainous and plain areas). We used the WRF-Chem model to simulate a typical summer precipitation process in Beijing by changing the intensity of pollutant emission, to check the air pollutants’ effects on cloud and rainfall, and then to further analyze their impact on cloud microphysics.
2. Materials and Methods
2.1. Observation Data
2.1.1. Precipitation Data
The hourly precipitation data of 20 national meteorological observation stations in Beijing were selected for analysis (data obtained from http://data.cma.cn/en (accessed on 2 January 2021)). According to data effectiveness and continuity, hourly precipitation data during June and August from 2000 to 2020 were selected (see Figure 1 for station locations and distributions). The terrain of Beijing is low in the southeast (plain) and high in the northwest (mountains), corresponding to the East-West Yanshan Mountain and North-South Taihang Mountain. The water vapor from summer precipitation comes primarily from the southeast and southwest. In addition to the influence of atmospheric circulation, topographic uplifts also affect precipitation formation. Accounting for the characteristics of summer precipitation, geographical location, and the different levels of air pollutant emission caused by human activities in Beijing, the 20 stations were divided into three categories: mountainous area (blue circles in Figure 1), foot of the mountains (green circles in Figure 1), and plain area (red circles in Figure 1; see Table 1 for site location details and classification information).
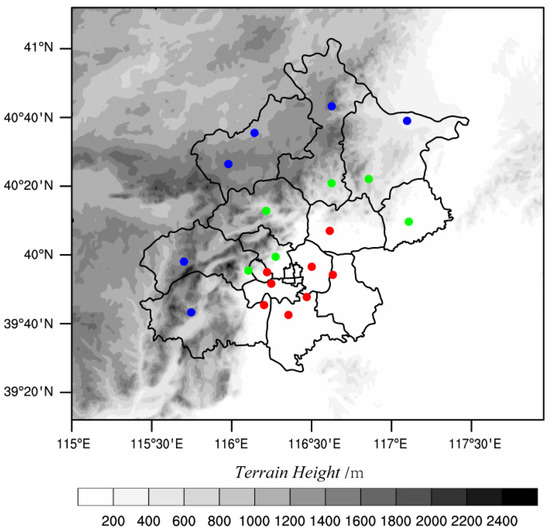
Figure 1.
Distribution of the 20 selected meteorological stations and topography of the Beijing area. The blue, green, and red circles in the figure correspond to the stations on the mountain, at the foot of the mountains, and plain areas, respectively.

Table 1.
Automatic weather station classification and location information.
Summer precipitation in Beijing occurs primarily as stratiform cloud precipitation and convective cloud precipitation. The probability of local convective precipitation in different regions of Beijing during the summer is random and equal, and the impact of stratiform cloud precipitation in each region is stable over the long run. To eliminate the influence of drought and flood years, this paper used the formula below to process the summer daily precipitation, and that data represent the precipitation contribution rate (PCR, %) of each station to the precipitation in all of Beijing.
where percent (sta,d) represents the PCR of the daily precipitation at station sta on day d to the total precipitation in Beijing on that day, rain (sta,d) is the total precipitation at station sta on day d, and rain (regionaltotal, d) represents the total precipitation at all stations on that day.
Percent (sta,d) = rain (sta,d)/rain (regiontotal,d) × 100%
The percentages (sta,d) were averaged according to the stations classified in Table 1 to obtain the annual average PCR of Beijing’s mountain, foot of the mountains, and plain areas in the summer.
2.1.2. Aerosol Optical Depth (AOD)
The MODIS AOD product (MCD19A2) was generated by Multi-Angle Implementation of Atmospheric Correction (MAIAC) [31], which has a higher spatial resolution (1 km) than other AOD products (data were downloaded from https://ladsweb.modaps.eosdis.nasa.gov (accessed on 20 February 2021)). The high spatial resolution of MCD19A2 shows more aerosol details [32]. In this paper, only the best-quality (QA.CloudMask = Clear, and QA.AdjacencyMask = Clear) retrievals of MCD19A2 were used [31,33]. Jia Chen et al. [34] verified the accuracy and effectiveness of the data product in Beijing, Tianjin, and Hebei regions and suggested that the data product directly indicates air pollution. The reliability of the product has been confirmed for Beijing, Tianjin, and Hebei.
In this study, combined with high-resolution terrain data, AOD data in the Beijing area were divided into data from mountainous and plain areas. We did not screen the AOD data related to areas at the foot of mountains since they are hard to define simply according to terrain’s height. The annual variations of mean AOD during Beijing summers (June to August, 2000 to 2020) in plain and mountainous regions were calculated.
2.2. Numerical Simulations
The Weather Research and Forecasting (WRF) Model is a next-generation mesoscale numerical weather prediction system designed for both atmospheric research and operational forecasting applications. WRF can produce simulations based on actual atmospheric conditions (information available online at http://www.wrf-model.org/index.php (accessed on 20 February 2021)). WRF-Chem is an online model coupling meteorological and chemical models consisting of various chemical modules based on the weather prediction model WRF [35]. The WRF-Chem model comprehensively analyzes aerosol changes caused by altering anthropogenic emission sources and analyzes the impact of aerosols on various environmental factors. Model simulations were conducted using the WRF-Chem v3.5.1 model with the Model for Simulating Aerosol Interactions and Chemistry (MOSAIC) aerosol model [36] and the Carbon Bond Mechanism (CBM-Z) photochemical mechanism [37]. The MOSAIC aerosol scheme uses a sectional approach to represent aerosol size distribution with several discrete size bins (four bins in this study) [38]. BC absorption improved when internally mixed with sulfate [39,40]. The Optical Properties of Aerosols and Clouds (OPAC) dataset [41] was used for the shortwave (SW) and longwave (LW) refractive indices of aerosols, except a constant of 1.53 + 0.003i was used for the SW refractive index of dust. The optical properties and direct radiative forcing of individual aerosol species in the atmosphere were diagnosed following the methodology described by Zhao et al. [42]. Aerosol aging processes such as nucleation, coagulation, and dry deposition were considered.
2.2.1. Case Introduction
The summer precipitation in Beijing is often affected by the water vapor brought by the southwest airflow along the mountains. Rainfall that occurred at night on 24 June 2012 was selected for simulation in this study. The wind field and relative humidity conditions at 850 hPa, 700 hPa, and 500 hPa at 1200 UTC on 24 June 2012 are shown in Figure 2. The figure shows that moisture came from the south with the southwest airflow. Beijing has good water vapor and dynamic conditions. After long-distance transportation, low-level moisture (850 hPa) came from the plains to the mountainous areas via topographic uplift in Beijing. The westerly wind was relatively dry and not the main source of moisture.
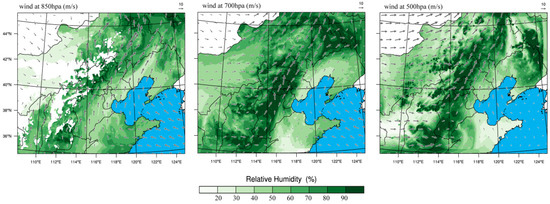
Figure 2.
Atmospheric relative humidity and wind field at 850 hPa, 700 hPa, and 500 hPa in North China at 1200 UTC on 24 June 2012. The color map in the figure indicates the relative humidity, and the arrows show the wind field.
2.2.2. Simulation Design
A non-nested single-layer calculation area with a resolution of 3 km was designed for simulation in this paper. The domain covered north and central China to ensure that the information of the main weather systems was captured, as shown in Figure 2. The initial and lateral meteorological boundary conditions came from the National Center for Environmental Prediction final analysis (NCEP/FNL) data at 1° of horizontal resolution and 6 h temporal intervals. The topographic information was obtained from 5 min-resolution WRF Preprocessing System (WPS) geographical input data. The initial chemical condition came from default profiles in the WRF-Chem model and was a very clean condition. The Yonsei University (YSU) planetary boundary layer scheme [43], Unified Noah land surface scheme [44], Morrison 2-moment bulk microphysics scheme [45,46], and RRTMG longwave and shortwave radiation schemes [47] were used in this study. A cumulus cloud parameterization was not included, since such a parameterization is not suitable for 3 km resolution. The anthropogenic emission data in 2012 was obtained from the MEIC team of Tsinghua University (data was acquired from http://meicmodel.org (accessed on 30 March 2021)). They consider the contribution of electric power, industry, civil, transportation, and agriculture activities. The data include SO2, NOx, CO NMVOC, NH3, PM10, PM2.5, BC, OC, and CO2 [48,49]. Table 2 shows the information for the physical and chemical schemes used in these simulations.
Table 2.
Physics and chemistry schemes used in the simulations.
Two simulations were designed in this study for the case described in Section 2.2.1. One (named “Polluted” in this paper) simulated the case with the actual pollution emission conditions by using emission source data from 2012. In the other simulation, the emission source intensity was reduced by multiplying by 0.33 based on the Polluted case to simulate the process under clean conditions (named “Clean”).
3. Results
3.1. Observation Results
3.1.1. Changes of PCR and AOD
The PCR in plain and mountainous areas showed opposite trends, as seen in Figure 3a. The PCR in plain areas significantly fluctuated upward from 31% to nearly 40% from 2000 to 2009 before decreasing, finally approaching a level in 2020 similar to 2000. In contrast to the plain areas, PCR in the mountains initially decreased from 30% to ~24% (around 2010) and then increased to ~31% in 2020. The PCR for areas at the foot of the mountains showed no obvious change trend over the last 20 years, so we decided to ignore this element in subsequent analyses. As seen in Figure 3b, from 2000 to 2009 (especially after 2004), the AOD in the plains increased from 0.85 to 0.96, then gradually decreased to approximately 0.83 in 2020. The AOD value in mountainous areas fluctuated around 0.7 for all 20 years.
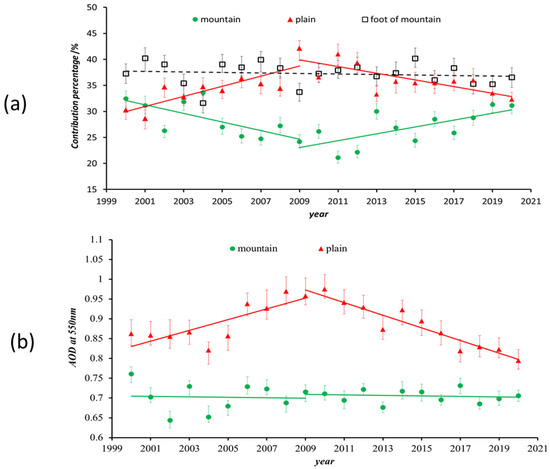
Figure 3.
Annual variation of (a) PCR and (b) AOD at 550 nm from 2000 to 2020 in different regions of Beijing. The red triangle, dark square, and green circle correspond to stations in the mountains, at the foot of the mountains, and plains, respectively. The error bar marks the 95% confidence interval.
Over the last 20 years, PRC and AOD trends in plains areas appeared similar, first rising, then falling. This indicated that air pollution may vary the precipitation in plains areas. In contrast, the AOD in mountainous areas did not change significantly, but PCR in these areas contrasted with plain areas, falling initially before rising. Since the contribution rate is a percentage probability, the change in mountainous PCR may correspond to changes in the plains. On the other hand, changes in air pollution in plain areas may also indirectly affect the PCR change in the mountains. Further analysis is necessary to confirm this hypothesis.
3.1.2. Changes of PCR for Different Rainfall Intensities
To further analyze the impact of different rainfall intensities in different regions on the contribution rate, hourly precipitation results from ground meteorological stations in mountainous and plain areas were divided into three categories according to the precipitation intensity, i.e., less than 5 mm h−1, 5–10 mm h−1, and >10 mm h−1. Figure 4 shows the contribution rates of different rainfall intensities in different regions. For plain areas, the curves shown in Figure 4b indicate that heavy rainfall changes (greater than 10 mm h−1) caused most of the PCR changes shown in Figure 3a. This implied that increased air pollution led to increases in heavy precipitation, which led to the total precipitation increase in the plain areas. Figure 4a shows the annual PCR variation at different rainfall intensities in mountainous areas. The PCR trend in the mountains shown in Figure 3a corresponded to the variation of precipitation in mountain areas and implied the change was primarily due to rainfall intensity changes of less than 5 mm h−1 and greater than 10 mm h−1.
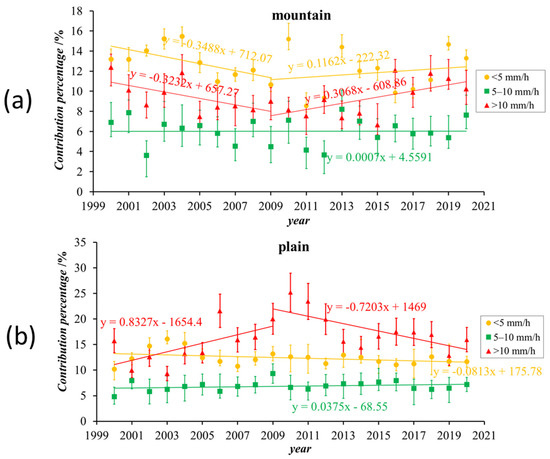
Figure 4.
Annual variation of PCR from 2000 to 2020 in (a) mountain and (b) plain regions in Beijing for different rainfall densities. The yellow circle, green square, and red triangle marks correspond to the <5 mm h−1,5–10 mm h−1, and >10 mm h−1 rainfall intensities, respectively. The error bars mark the 95% confidence interval.
3.2. Simulation
Based on analyses from the collected data, air pollution may alter the precipitation in plain and mountainous areas of Beijing during the summer, and air pollution sources occur mainly in the plains. The total amount of heavy rainfall (>10 mm h−1) in plain areas increased with the aggravation of air pollution, while the total rainfall intensities in the mountains decreased with air pollution enhancement. To confirm the impact of air pollutant emission on typical summer precipitation in Beijing, we used the WRF-Chem model to simulate the typical regional precipitation in Beijing. By changing the intensity of anthropogenic emission sources, this paper compared and analyzed the impacts of air pollutants on rainfall intensities in different regions of Beijing (See Section 2.2 for the design and details of the simulation schemes).
3.2.1. Verification of the Simulation Results
This study chose precipitation that occurred on 24 June 2012. We checked the simulated precipitation results by using data from 245 rain gauge stations (data from http://web.dataportal.bepk.cn/weatherServer/index.jsp; accessed on 1 May 2016). Figure 5 shows the total amount and distribution of precipitation from 0400 UTC to 1800 UTC on 24 June. The Polluted simulation captured the total rainfall features better than the Clean simulation. As shown in Polluted and Observation, the rainfall center was distributed in a belt along the foot of the mountains from southwest to northeast. The maximum cumulative precipitation exceeded 60 mm, and the cumulative precipitation in the mountain area was less than 30 mm. The simulated rainfall in the plain area Polluted simulation was ~5 mm lower than the observed results, but the distribution matched the actual situation well, while the Clean case just showed an isolated rainfall center at the foot of the mountains in the north. Compared with the Polluted scheme, the total rainfall in the plains and mountainous areas of the Clean simulation decreased. Therefore, we think that simulation results from the Polluted scheme better reflect the actual process.
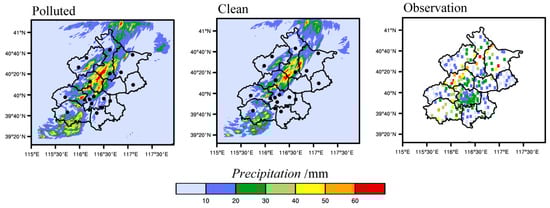
Figure 5.
Accumulated precipitation from 0400 UTC to 1800 UTC on 24 June 2012 based on Polluted (left), Clean (middle), and rain gauge observations (right). The dark circles in the Polluted and Clean images mark the location of the 20 national stations.
3.2.2. Effects of Air Pollution on Rainfall Intensity
This study focused on the Beijing area; therefore, the analysis area was fixed at 115° E–118° E and 39° N–41° N. At the same time, the grid points at altitudes below 300 m were defined as plain (plains) areas, and areas at altitudes above 1000 m were defined as mountain (mountainous) areas. The rainfall intensities in mountainous and plain areas were divided into four categories, i.e., <0.1 mm h−1, 0.1–5 mm h−1, 5–10 mm h−1, and >10 mm h−1. Since the observation resolution of the automatic observation station is 0.1 mm, rainfall intensities below 0.1 mm h−1 were viewed as no precipitation in this study.
The histogram in Figure 6 shows the different probabilities for the four rainfall intensity categories between Polluted and Clean in mountainous and plains areas, which means the probability of occurrence for Polluted minus that for Clean. Those results showed that an increase in air pollutants in plain areas reduced the probability of rainfall below 10 mm h−1. The probability of no precipitation (<0.1 mm h−1) increased by approximately 7%, precipitation between 0.1–5 mm h−1 decreased by 23%, while precipitation between 5–10 mm h−1 decreased by ~12%. Only the probability of precipitation greater than 10 mm h−1 increased and did so by nearly 10%. The mountainous areas showed total rainfall decreases. The probability of no precipitation increased by ~15%, and the probabilities of 0.1–5 mm h−1, 5–10 mm h−1, and >10 mm h−1 rainfall decreased by 11%, 24%, and 5%, respectively.
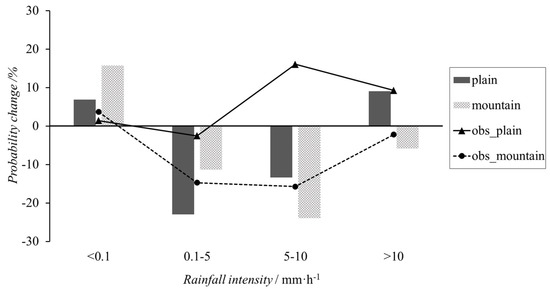
Figure 6.
Different probabilities of the occurrence of the classified rainfall intensities under polluted conditions compared with clean conditions in plain and mountainous areas of Beijing. The histogram represents the simulation results for plain (black) and mountain (grey grid) areas, and the line with triangles and circles indicates the observed results for plain and mountain areas, respectively.
To verify those simulation results, observation data from 2009 and 2020 were selected as representative of polluted and clean conditions. The differences in probability for the four rainfall intensities during those two years were calculated using observed hourly precipitation data; those results are shown in the line diagram of Figure 6. These results showed an increase in the probability of no precipitation and decreases in the probabilities of the other three rainfall intensities in mountain areas; this agreed with the simulation results well. Our observations also showed an increased probability for no rain and a slightly decreased probability for 5 mm h−1 rainfall in the plains. In contrast, the observed probability of precipitation above 5 mm h−1 increased significantly. Although precipitation enhancement values were inconsistent, both observation and simulation indicated the enhancement of pollutant emission inhibited weak precipitations and promoted the occurrence of heavy precipitations in plain areas.
3.2.3. Changes of Aerosol and Cloud Microphysical
The 850 hPa wind field in Figure 2 shows that wind in Beijing blows from the plains to the mountain. Therefore, low-level pollutants and moisture also move in the same direction. The simulation results showed that different emission sources led to aerosol transport efficiency changes from the plains to mountainous areas.
The histogram in Figure 7 shows the average hourly precipitation in plain areas. Plain_ rain_ P corresponds to polluted conditions, and plain_ rain_ C indicates clean conditions. Plain_rain_P was significantly higher than plain_rain_C, which once again confirmed that pollution increases also increased rainfall intensities in the plains. The line diagram in Figure 7 shows the PM2.5 mass ratio between the mountains and plains under polluted and clean conditions at the same time, which reflects the proportion of aerosols moving from the plains to mountainous areas. The gap between the two lines is not obvious in the initial stage of precipitation (before 0600 UTC on 24 June). As the rainfall system developed, the ratio for the Polluted case gradually decreased from 40% (0600 UTC on 24 June) to 22% (1000 UTC on 25 June), while the values for the Clean case fluctuated between 45% and 38%. Previous studies showed that heavy precipitation very effectively removed atmospheric pollutants, while the removal efficacy of weak precipitation was quite minor [2,3]. Therefore, we believe that air pollution increases rainfall intensities in plains areas, which also improves the removal of air pollutants, reduces the number of pollutant particles transported into mountain areas, and subsequently alters the precipitation characteristics in mountainous regions.
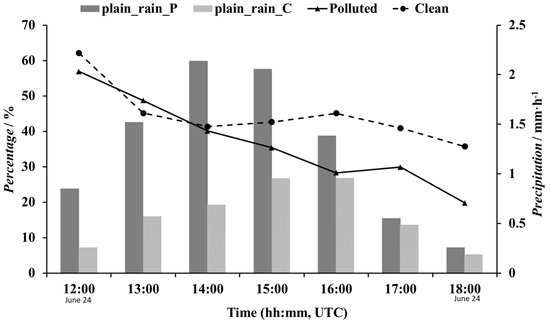
Figure 7.
Hourly PM2.5 concentration ratios between mountainous and plains (lines) areas and hourly rainfall in plains areas (histogram) during the time of heaviest rainfall (1200 UTC to 1800 UTC on 24 June). The black line with triangle marks and the dashed line with circle marks indicate the Polluted and Clean results for plain areas, respectively. The histogram indicates the results for plain areas under Polluted (plain_rain_P, black) and Clean (plain_rain_C, grey grid) conditions.
The discussion above indicates that air pollution from plains areas affects both the distribution and intensity of precipitation in plain and mountainous areas. Increased pollution increases the probability of moderate to heavy rainfall intensity, and light rain decreases in the plains areas, while both the total rainfall amount and intensity in the mountains decrease. The physical parameters of the clouds during the primary precipitation period (1200 UTC to 1800 UTC on 24 June) from the simulations were analyzed to determine how air pollution changes the physical characteristics of the cloud and the final precipitation.
Figure 8a shows the average microphysical mass concentration vertical profiles in Beijing plain and mountains under Polluted and Clean conditions. The mass mixing ratios of cloud, rain, snow, graupel and ice crystal are shown from left to right. For Polluted conditions, total clouds in mountainous areas dropped significantly since the mass ratios also dropped significantly (except for the ice ratio) as compared to the Clean conditions. This could directly reduce the precipitation in mountainous areas. Except for cloud droplets, the values for the Polluted conditions in plain areas increased significantly. The mass of ice clouds (including snow, graupel, and ice) in plain areas more than doubled compared with the Clean conditions. The increase of pollutants in plain areas likely led to additional cloud development in the upper atmosphere, increased ice-phase cloud formation, and finally enhanced rainfall in these areas.
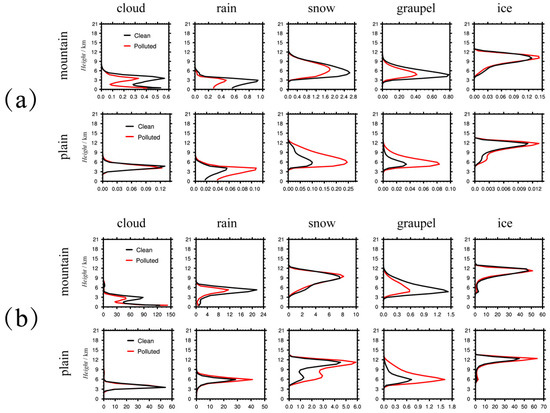
Figure 8.
Vertical profiles of cloud microphysical parameters (a) mass concentration and (b) number concentration in Beijing plains and mountainous areas under Polluted (red line) and Clean (black line) conditions. Data were averaged for the main rainfall period (1200 UTC to 1800 UTC on 24 June). The unit of mass concentration in Figure 8a is 0.1 g·kg−1 for mountain areas and g·kg−1 for plain areas. The unit of number concentration in Figure 8b for cloud drops is 1 × 10⁶ #·kg−1, and the units of number concentration in Figure 8b for rain, snow, graupel, and ice are 1 × 10³ #·kg−1.
Figure 8b shows the average microphysical number concentration vertical profiles of the same cloud particles as Figure 8a. An important way air pollution physically affects a cloud stems from changes to the number of cloud condensation nuclei caused by the change of aerosol particles. The number of raindrops, snow, graupel and ice crystals in plain areas increased significantly in the Polluted conditions. After spectral confirmation, the particle sizes of clouds in the primary stage decreased in the Polluted case. More particles were carried to the upper air by the updraft flow, which increased ice-phase microphysical processes, as reported previously [16]. This ultimately resulted in plains area precipitation increases. However, Figure 8b shows that the number of snow and ice crystals at high altitudes in mountainous clouds did not change significantly, which confirmed that clouds in mountainous areas did not develop upward to form more ice clouds. The number of cloud drops, rain, and graupel particles at low altitudes decreased significantly due to fewer aerosol particles transported from the plain areas (see Figure 7), which reduced the efficiency of cloud formation and ultimately decreased the precipitation in mountainous areas.
4. Conclusions
Precipitation and satellite observation AOD data from the last 20 years of Beijing summers showed similar variations as data related to plains areas. Both mountainous and plains areas saw an initial increase followed by a decrease, and the inflection point occurred in 2009. The difference between the maximum and minimum PCR for the plains was close to 10%, and the maximum difference of AOD was ~0.15. The PCR for mountain areas showed no obvious correlation with AOD changes.
Both observation and simulation results showed that air pollution affected rainfall intensity and precipitation amount and distribution. When anthropogenic emissions increased by a factor of three, as observed for the Polluted conditions compared with the Clean conditions, heavy precipitation instances (greater than 10 mm h−1) increased by nearly 10%, and precipitations at other intensities decreased by nearly to 30% in the plains. This agreed with the observation that indicated precipitation greater than 5 mm h−1 increased by about 28% when the AOD difference increased by 0.15. Both simulation and observation showed that air pollution from plain areas affected mountainous areas, and rainfall decreased due to the enhancement of air pollution and increased after improvements in air quality.
In plain areas, the increase of aerosols decreased the effective particle size of cloud droplets and raindrops; smaller cloud raindrops more readily transfer to high air layers and generate ice-phase substances in the clouds, which promotes strong precipitation events. Aerosols reach the mountain mainly from plain areas. In polluted conditions, cloud formation and rainfall consume most aerosols in plain areas. Aerosols reaching the mountain areas from the plain decrease, which leads to rainfall reductions in mountainous areas.
Author Contributions
Conceptualization, Y.Y.; methodology, Y.Y., W.Z. and Q.G.; software, Y.Y. and W.Z.; investigation, Y.Y., X.L. and Y.W.; data curation, Y.Y. and D.Z.; writing—original draft preparation, Y.Y.; writing—review and editing, Y.Y. and Q.G.; visualization, Y.Y.; project administration, Y.Y., W.Z. and D.Z.; funding acquisition, Y.Y., W.Z. and D.Z. All authors have read and agreed to the published version of the manuscript.
Funding
This research was funded by the National key research and development program (grant number: 2017YFC1501405) and the National Natural Science Foundation of China (grant numbers: 41805113; 42075084).
Institutional Review Board Statement
Not applicable.
Informed Consent Statement
Not applicable.
Data Availability Statement
Rain gauge data were from China Meteorological Data Service Centre (http://data.cma.cn/en; accessed on 2 January 2021). Anthropogenic emissions data were from the MEIC team of Tsinghua University (http://meicmodel.org/?lang=en; accessed on 30 March 2021). The MODIS AOD product (MCD19A2) can get from https://ladsweb.modaps.eosdis.nasa.gov (accessed on 20 February 2021).
Acknowledgments
The authors are sincerely grateful to all organizations that provided observational and simulation data mentioned in this paper.
Conflicts of Interest
The authors declare no conflict of interest.
References
- Sharma, S.; Kumari, N. Modeling the Impact of Rain on Population Exposed to Air Pollution. Int. J. Nonlinear Sci. Numer. Simul. 2020, 21, 363–370. [Google Scholar] [CrossRef] [Green Version]
- Oduber, F.; Calvo, A.I.; Blanco-Alegre, C.; Castro, A.; Alves, C.; Cerqueira, M.; Lucarelli, F.; Nava, S.; Calzolai, G.; Martin-Villacorta, J.; et al. Towards a Model for Aerosol Removal by Rain Scavenging: The Role of Physical-Chemical Characteristics of Raindrops. Water Res. 2021, 190, 116758. [Google Scholar] [CrossRef]
- Elperin, T.; Fominykh, A.; Krasovitov, B.; Vikhansky, A. Effect of Rain Scavenging on Altitudinal Distribution of Soluble Gaseous Pollutants in the Atmosphere. Atmos. Environ. 2011, 45, 2427–2433. [Google Scholar] [CrossRef] [Green Version]
- Zhou, Y.; Yue, Y.; Bai, Y.; Zhang, L. Effects of Rainfall on PM2.5 and PM10 in the Middle Reaches of the Yangtze River. Adv. Meteorol. 2020, 2020, 2398146. [Google Scholar] [CrossRef]
- Shin, J.; Gil, K. Effect of Rainfall Characteristics on Removal Efficiency Evaluation in Vegetative Filter Strips. Environ. Earth Sci. 2014, 72, 601–607. [Google Scholar] [CrossRef]
- Twomey, S. Pollution and the Planetary Albedo. Atmos. Environ. 2007, 41, 120–125. [Google Scholar] [CrossRef]
- Altaratz, O.; Koren, I.; Remer, L.A.; Hirsch, E. Review: Cloud invigoration by aerosols—Coupling between microphysics and dynamics. Atmos. Res. 2014, 140–141, 38–60. [Google Scholar] [CrossRef]
- Ramanathan, V.; Crutzen, P.J.; Kiehl, J.T.; Rosenfeld, D. Aerosols, Climate, and the Hydrological Cycle. Science 2001, 294, 2119–2124. [Google Scholar] [CrossRef] [Green Version]
- Penner, J.E.; Dong, X.; Chen, Y. Observational Evidence of a Change in Radiative Forcing Due to the Indirect Aerosol Effect. Nat. Cell Biol. 2004, 427, 231–234. [Google Scholar] [CrossRef]
- Albrecht, B.A. Aerosols, Cloud Microphysics, and Fractional Cloudiness. Science 1989, 245, 1227–1230. [Google Scholar] [CrossRef]
- Brenguier, J.L.; Pawlowska, H.; Schuller, L.; Preusker, R.; Fouquart, Y. Radiative Properties of Boundary Layer Clouds: Drop-Let Effective Radius Versus Number Concentration. J. Atmos. Sci. 2000, 57, 803–821. [Google Scholar] [CrossRef] [Green Version]
- Yunfei, C.; Jing, Z.; Chungang, F.; Xu, Z.; Wenhao, X.; Hu, X.; Duan, J.; Li, W.; Gao, Y.; Lu, G.; et al. Aerosol and Cloud Properties over a Coastal Area from Aircraft Observations in Zhejiang, China. Atmos. Environ. 2021, 267, 118771. [Google Scholar]
- Chen, Y.C.; Wang, S.H.; Min, Q.; Lu, S.; Joseph, E. Aerosol Impacts on Warm-Cloud Microphysics and Drizzle in a Moderate-Ly Polluted Environment. Atmos. Chem. Phys. 2021, 21, 4487–4502. [Google Scholar] [CrossRef]
- Fan, J.; Leung, L.R.; Rosenfeld, D.; Chen, Q.; Li, Z.; Zhang, J.; Yan, H. Microphysical Effects Determine Macrophysical Response for Aerosol Impacts on Deep Convective clouds. Proc. Natl. Acad. Sci. USA 2013, 110, E4581–E4590. [Google Scholar] [CrossRef] [Green Version]
- Li, Z.; Niu, F.; Fan, J.; Liu, Y.; Rosenfeld, D.; Ding, Y. Long-Term Impacts of Aerosols on the Vertical Development of Clouds Andprecipitation. Nat. GeoScience 2011, 4, 888–894. [Google Scholar] [CrossRef]
- Fan, J.; Rosenfeld, D.; Zhang, Y.; Giangrande, S.E.; Li, Z.; Machado, L.A.T.; Martin, S.T.; Yang, Y.; Wang, J.; de Souza, R.A.F.; et al. Substantial Convection and Precipitation Enhancements by Ultrafine Aerosol Particles. Science 2018, 359, 411–418. [Google Scholar] [CrossRef] [Green Version]
- Fan, J.; Rosenfeld, D.; Yang, Y.; Zhao, C.; Leung, L.R.; Li, Z. Substantial Contribution of Anthropogenic Air Pollution to Catastrophic Floods in Southwest China. Geophys. Res. Lett. 2015, 42, 6066–6075. [Google Scholar] [CrossRef]
- Yang, Y.; Fan, J.; Leung, L.R.; Zhao, C.; Li, Z.; Rosenfeld, D. Mechanisms Contributing to Suppressed Precipitation in Mt. Hua of Central China. Part I: Mountain Valley Circulation. J. Atmos. Sci. 2016, 73, 1351–1366. [Google Scholar] [CrossRef]
- Khain, A.; Rosenfeld, D.; Pokrovsky, A. Aerosol Impact on the Dynamics and Microphysics of Deep Convective Clouds. Q. J. R. Meteorol. Soc. 2005, 131, 2639–2663. [Google Scholar] [CrossRef] [Green Version]
- Lin, J.C.; Matsui, T.; Pielke, R.A.; Kummerow, C. Effects of Biomass-Burning-Derived Aerosols on Precipitation and Clouds in the Amazon Basin: A Satellite-Based Empirical Study. J. Geophys. Res. Space Phys. 2006, 111, 19204. [Google Scholar] [CrossRef] [Green Version]
- Kawecki, S.; Henebry, G.M.; Steiner, A.L. Effects of Urban Plume Aerosols on a Mesoscale Convective System. J. Atmos. Sci. 2016, 73, 4641–4660. [Google Scholar] [CrossRef]
- Lin, Y.; Fan, J.; Jeong, J.-H.; Zhang, Y.; Homeyer, C.R.; Wang, J. Urbanization-Induced Land and Aerosol Impacts on Storm Propagation and Hail Characteristics. J. Atmos. Sci. 2021, 78, 925–947. [Google Scholar] [CrossRef]
- Zhou, S.; Yang, J.; Wang, W.-C.; Zhao, C.; Gong, D.; Shi, P. An Observational Study of the Effects of Aerosols on Diurnal Variation of Heavy Rainfall and Associated Clouds over Beijing–Tianjin–Hebei. Atmos. Chem. Phys. Discuss. 2020, 20, 5211–5229. [Google Scholar] [CrossRef]
- Guo, C.; Xiao, H.; Yang, H.; Wen, W. Effects of Anthropogenic Aerosols on a Heavy Rainstorm in Beijing. Atmosphere 2019, 10, 162. [Google Scholar] [CrossRef] [Green Version]
- Yu, R.; Zhou, T.; Xiong, A.; Zhu, Y.; Li, J. Diurnal Variations of Summer Precipitation over Contiguous China. Geophys. Res. Lett. 2007, 34, 223–234. [Google Scholar] [CrossRef] [Green Version]
- Chang, H.; Zhao, Y.; Wang, Q.; Wang, J.; Li, H.; Zhai, J.; Han, J.; Jiang, S. Available Water Supplies in Beijing, China, Under Single- and Multi-Year Drought. JAWRA J. Am. Water Resour. Assoc. 2020, 56, 230–246. [Google Scholar] [CrossRef]
- Jena, C.; Ghude, S.D.; Kumar, R.; Debnath, S.; Govardhan, G.; Soni, V.K.; Kulkarni, S.H.; Beig, G.; Nanjundiah, R.S.; Rajeevan, M. Performance of High Resolution (400 M) PM2.5 Forecast over Delhi. Sci. Rep. 2021, 11, 4104. [Google Scholar] [CrossRef] [PubMed]
- Zhang, Y.; Shindell, D.; Seltzer, K.; Shen, L.; Lamarque, J.-F.; Zheng, B.; Xing, J.; Jiang, Z.; Zhang, L. Impacts of Emission Changes in China from 2010 to 2017 on Domestic and Intercontinental Air Quality and Health Effect. Atmos. Chem. Phys. Discuss. 2021, 21, 16051–16065. [Google Scholar] [CrossRef]
- Hung, W.-T.; Lu, C.-H.S.; Alessandrini, S.; Kumar, R.; Lin, C.-A. Estimation of PM2.5 Concentrations in New York State: Understanding the Influence of Vertical Mixing on Surface PM2.5 Using Machine Learning. Atmosphere 2020, 11, 1303. [Google Scholar] [CrossRef]
- Crawford, J.H.; Ahn, J.-Y.; Al-Saadi, J.; Chang, L.; Emmons, L.K.; Kim, J.; Lee, G.; Park, J.-H.; Park, R.J.; Woo, J.H.; et al. The Korea–United States Air Quality (KORUS-AQ) Field Study. Elem. Sci. Anth. 2021, 9, 00163. [Google Scholar] [CrossRef]
- Lyapustin, A.; Wang, Y.; Korkin, S.; Huang, D. MODIS Collection 6 MAIAC Algorithm. Atmos. Meas. Tech. 2018, 11, 5741–5765. [Google Scholar] [CrossRef] [Green Version]
- Chudnovsky, A.A.; Kostinski, A.; Lyapustin, A.; Koutrakis, P. Spatial Scales of Pollution from Variable Resolution Satellite Imaging. Environ. Pollut. 2013, 172, 131–138. [Google Scholar] [CrossRef]
- Jing, L.; Zhang, Y.; Chen, M.; Wang, L.; Zhao, S.; Pu, X.; Chen, X. Estimation of Monthly 1 Km Resolution PM2.5 Concentrations Using a Random Forest Model over “2 + 26” Cities, China. Urban Clim. 2021, 35, 1000734. [Google Scholar]
- Jia, C.; Sun, L.; Wang, Y.; Zhang, X. Accuracy Validation of 1 Km Resolution AOD Products in Beijing-Tianjin-Hebei Region and Correlation Analysis with Air Pollution. Laser Optoelectron. Prog. 2020, 57, 232802. [Google Scholar] [CrossRef]
- Grell, G.A.; Peckham, S.E.; Schmitz, R.; McKeen, S.A.; Frost, G.; Skamarock, W.C.; Eder, B. Fully Coupled “online” Chemistry within the WRF Model. Atmos. Environ. 2005, 39, 6957–6975. [Google Scholar] [CrossRef]
- Zaveri, R.A.; Easter, R.C.; Fast, J.D.; Peters, L.K. Model for Simulating Aerosol Interactions and Chemistry (MOSAIC). J. Geophys. Res. Space Phys. 2008, 113, 13204. [Google Scholar] [CrossRef]
- Zaveri, R.; Peters, L.K. A New Lumped Structure Photochemical Mechanism for Large-Scale Applications. J. Geophys. Res. Space Phys. 1999, 104, 30387–30415. [Google Scholar] [CrossRef]
- Fast, J.D.; Gustafson, W.; Easter, R.C.; Zaveri, R.; Barnard, J.C.; Chapman, E.G.; Grell, G.A.; Peckham, S.E. Evolution of Ozone, Particulates, and Aerosol Direct Radiative Forcing in the Vicinity of Houston Using a Fully Coupled Meteorology-Chemistry-Aerosol Model. J. Geophys. Res. Space Phys. 2006, 111. [Google Scholar] [CrossRef]
- Zhang, X.Y.; Gong, S.L.; Shen, Z.X.; Mei, F.M.; Xi, X.; Liu, L.C.; Zhou, Z.J.; Wang, D.; Wang, Y.Q.; Cheng, Y. Characterization of Soil Dust Aerosol in China and Its Transport and Distribution During 2001 ACE-Asia: Network Observations. J. Geophys. Res. 2003, 108, 4261. [Google Scholar] [CrossRef]
- Zhao, C.; Leung, L.R.; Easter, R.C.; Hand, J.; Avise, J. Characterization of Speciated Aerosol Direct Radiative Forcing over California. J. Geophys. Res. Atmos. 2013, 118, 2372–2388. [Google Scholar] [CrossRef]
- Hess, M.; Koepke, P.; Schult, I. Optical Properties of Aerosols and Clouds: The Software Package OPAC. Bull. Am. Meteorol. Soc. 1998, 79, 831–844. [Google Scholar] [CrossRef]
- Zhao, C.; Chen, S.; Leung, L.R.; Qian, Y.; Kok, J.F.; Zaveri, R.A.; Huang, J. Uncertainty in Modeling Dust Mass Balance and Radiative Forcing from Size Parameterization. Atmos. Chem. Phys. Discuss. 2013, 13, 10733–10753. [Google Scholar] [CrossRef] [Green Version]
- Hong, S.-Y.; Noh, Y.; Dudhia, J. A New Vertical Diffusion Package with an Explicit Treatment of Entrainment Processes. Mon. Weather. Rev. 2006, 134, 2318–2341. [Google Scholar] [CrossRef] [Green Version]
- Chen, F.; Dudhia, J. Coupling an Advanced Land Surface-Hydrology Model with the Penn State-NCAR MM5 Modeling System. Part I: Model Implementation and Sensitivity. Mon. Weather Rev. 2001, 129, 569–585. [Google Scholar] [CrossRef] [Green Version]
- Morrison, H.; Gettelman, A. A New Two-Moment Bulk Stratiform Cloud Microphysics Scheme in the Community Atmosphere Model, Version 3 (CAM3). Part I: Description and Numerical Tests. J. Clim. 2008, 21, 3642–3659. [Google Scholar] [CrossRef]
- Morrison, H.; Pinto, J.O. Mesoscale Modeling of Springtime Arctic Mixed-Phase Stratiform Clouds Using a New Two-Moment Bulk Microphysics Scheme. J. Atmos. Sci. 2005, 62, 3683–3704. [Google Scholar] [CrossRef]
- Mlawer, E.J.; Taubman, S.J.; Brown, P.D.; Iacono, M.J.; Clough, S.A. Radiative Transfer for Inhomogeneous Atmospheres: RRTM, a Validated Correlated-K Model for the Longwave. J. Geophys. Res. Space Phys. 1997, 102, 16663–16682. [Google Scholar] [CrossRef] [Green Version]
- Li, M.; Liu, H.; Geng, G.; Hong, C.; Liu, F.; Song, Y.; Tong, D.; Zheng, B.; Cui, H.; Man, H.; et al. Anthropogenic Emission Inventories in China: A Review. Natl. Sci. Rev. 2017, 4, 834–866. [Google Scholar] [CrossRef]
- Zheng, B.; Tong, D.; Li, M.; Liu, F.; Hong, C.; Geng, G.; Li, H.; Li, X.; Peng, L.; Qi, J.; et al. Trends in China’s Anthropogenic Emissions since 2010 As the Consequence of Clean Air Actions. Atmos. Chem. Phys. 2018, 18, 14095. [Google Scholar] [CrossRef] [Green Version]
Publisher’s Note: MDPI stays neutral with regard to jurisdictional claims in published maps and institutional affiliations. |
© 2022 by the authors. Licensee MDPI, Basel, Switzerland. This article is an open access article distributed under the terms and conditions of the Creative Commons Attribution (CC BY) license (https://creativecommons.org/licenses/by/4.0/).