Abstract
Sulfur dioxide (SO2) is a serious air pollutant emitted from different sources in many developing regions worldwide, where the contribution of different potential influencing factors remains unclear. Using Shandong, a typical industrial province in China as an example, we studied the spatial distribution of SO2 and used geographical detectors to explore its influencing factors. Based on the daily average concentration in Shandong Province from 2014 to 2019, we explored the influence of the diurnal temperature range, secondary production, precipitation, wind speed, soot emission, sunshine duration, and urbanization rate on the SO2 concentration. The results showed that the diurnal temperature range had the largest impact on SO2, with q values of 0.69, followed by secondary production (0.51), precipitation (0.46), and wind speed (0.42). There was no significant difference in the SO2 distribution between pairs of sunshine durations, soot emissions, and urbanization rates. The meteorological factors of precipitation, wind speed, and diurnal temperature range were sensitive to seasonal changes. There were nonlinear enhancement relationships among those meteorological factors to the SO2 pollution. There were obvious geographical differences in the human activity factors of soot emissions, secondary production, and urbanization rates. The amount of SO2 emissions should be adjusted in different seasons considering the varied effect of meteorological factors.
1. Introduction
There is no doubt that air pollution is a significant environmental risk to health, particularly in many underdeveloped countries. Sulfur dioxide (SO2) has been widely studied among the anthropogenic pollutants. The most important effects of SO2 air pollution include an increase in the risk of hospital admissions, cardiopulmonary disease, myocardial infarction, chronic obstructive pulmonary disease, respiratory disease, and death [1,2,3]. After SO2 reaches the threshold of 8 µg/m3, a continuous increase in industrial SO2 emission increases the proportion of the population with chronic diseases, of which respiratory diseases account for a significant proportion [4]. Through an analysis of the city-combined effects of pollutants represented by SO2, it was shown that the residents of Asian cities were more likely to have greater exposure to air pollution than those in western industrial nations [5]. As one of the largest countries in Asia, China has paid attention to frequent air pollution in recent years. According to the Bulletin of the State of China’s Ecological Environment in 2019, four of the twenty cities with the worst air quality in China were located in Shandong province. SO2 is one of the most important indicators to evaluate the air quality. Therefore, a study of the factors related to SO2 pollution is of great significance and is closely related to people’s quality of life.
Various research methods have been applied to study the factors that affect SO2. A stepwise multiple linear regression analysis was used to reveal a close relationship between the concentration of urban air pollutants and meteorological parameters [6]. Global regression models have been used to study the determinants of SO2 concentration from the perspective of pollution sources and diffusion [7]. The logarithmic mean divisia index method was used to study the impacts of energy consumption, energy structure, and treatment technology on SO2 emissions [8]. The influences of meteorological factors on the multifractal properties of SO2 have also been investigated [9]. These studies analyzed the factors influencing SO2 emissions from different perspectives. However, a detailed exploration based on the spatial distribution of human factors and meteorological factors is lacking.
Geographical detectors are a set of spatial statistical methods that can detect spatial differentiation and can reveal the driving force behind it [10]. The method has a wide range of applications in natural and human geography, such as in studies of the spatiotemporal variations and driving factors of air pollution [11,12,13,14,15], the detection of the dominant factors related to the spatial variation of land surface cutting [16], the identification of environmental factors related to the spatial variation of neonatal jaundice [17], and the spatiotemporal trends of diseases [18,19]. Geographical detectors can be used to reveal the spatial similarity or the correlation between a certain independent variable and related dependent variables. They can detect both numerical data and qualitative data and the effect of the interaction of two factors on dependent variables. They can explain whether two independent variables are linearly enhanced, nonlinearly enhanced, or weakened by detecting the significance of their interaction; moreover, this method has no limitations compared to traditional statistical methods [20].
We applied geographical detectors to explore the factors influencing SO2 emissions in Shandong from 2014 to 2019. Factor detection, interaction detection, and ecological detection of geographical detectors were used to explore the correlations of spatial distributions between SO2 concentration and various factors, including meteorological factors with seasonal regularity and human factors based on inland and seaside locations. The results offer a scientific and theoretical foundation for future pollution control.
2. Data
2.1. Study Area
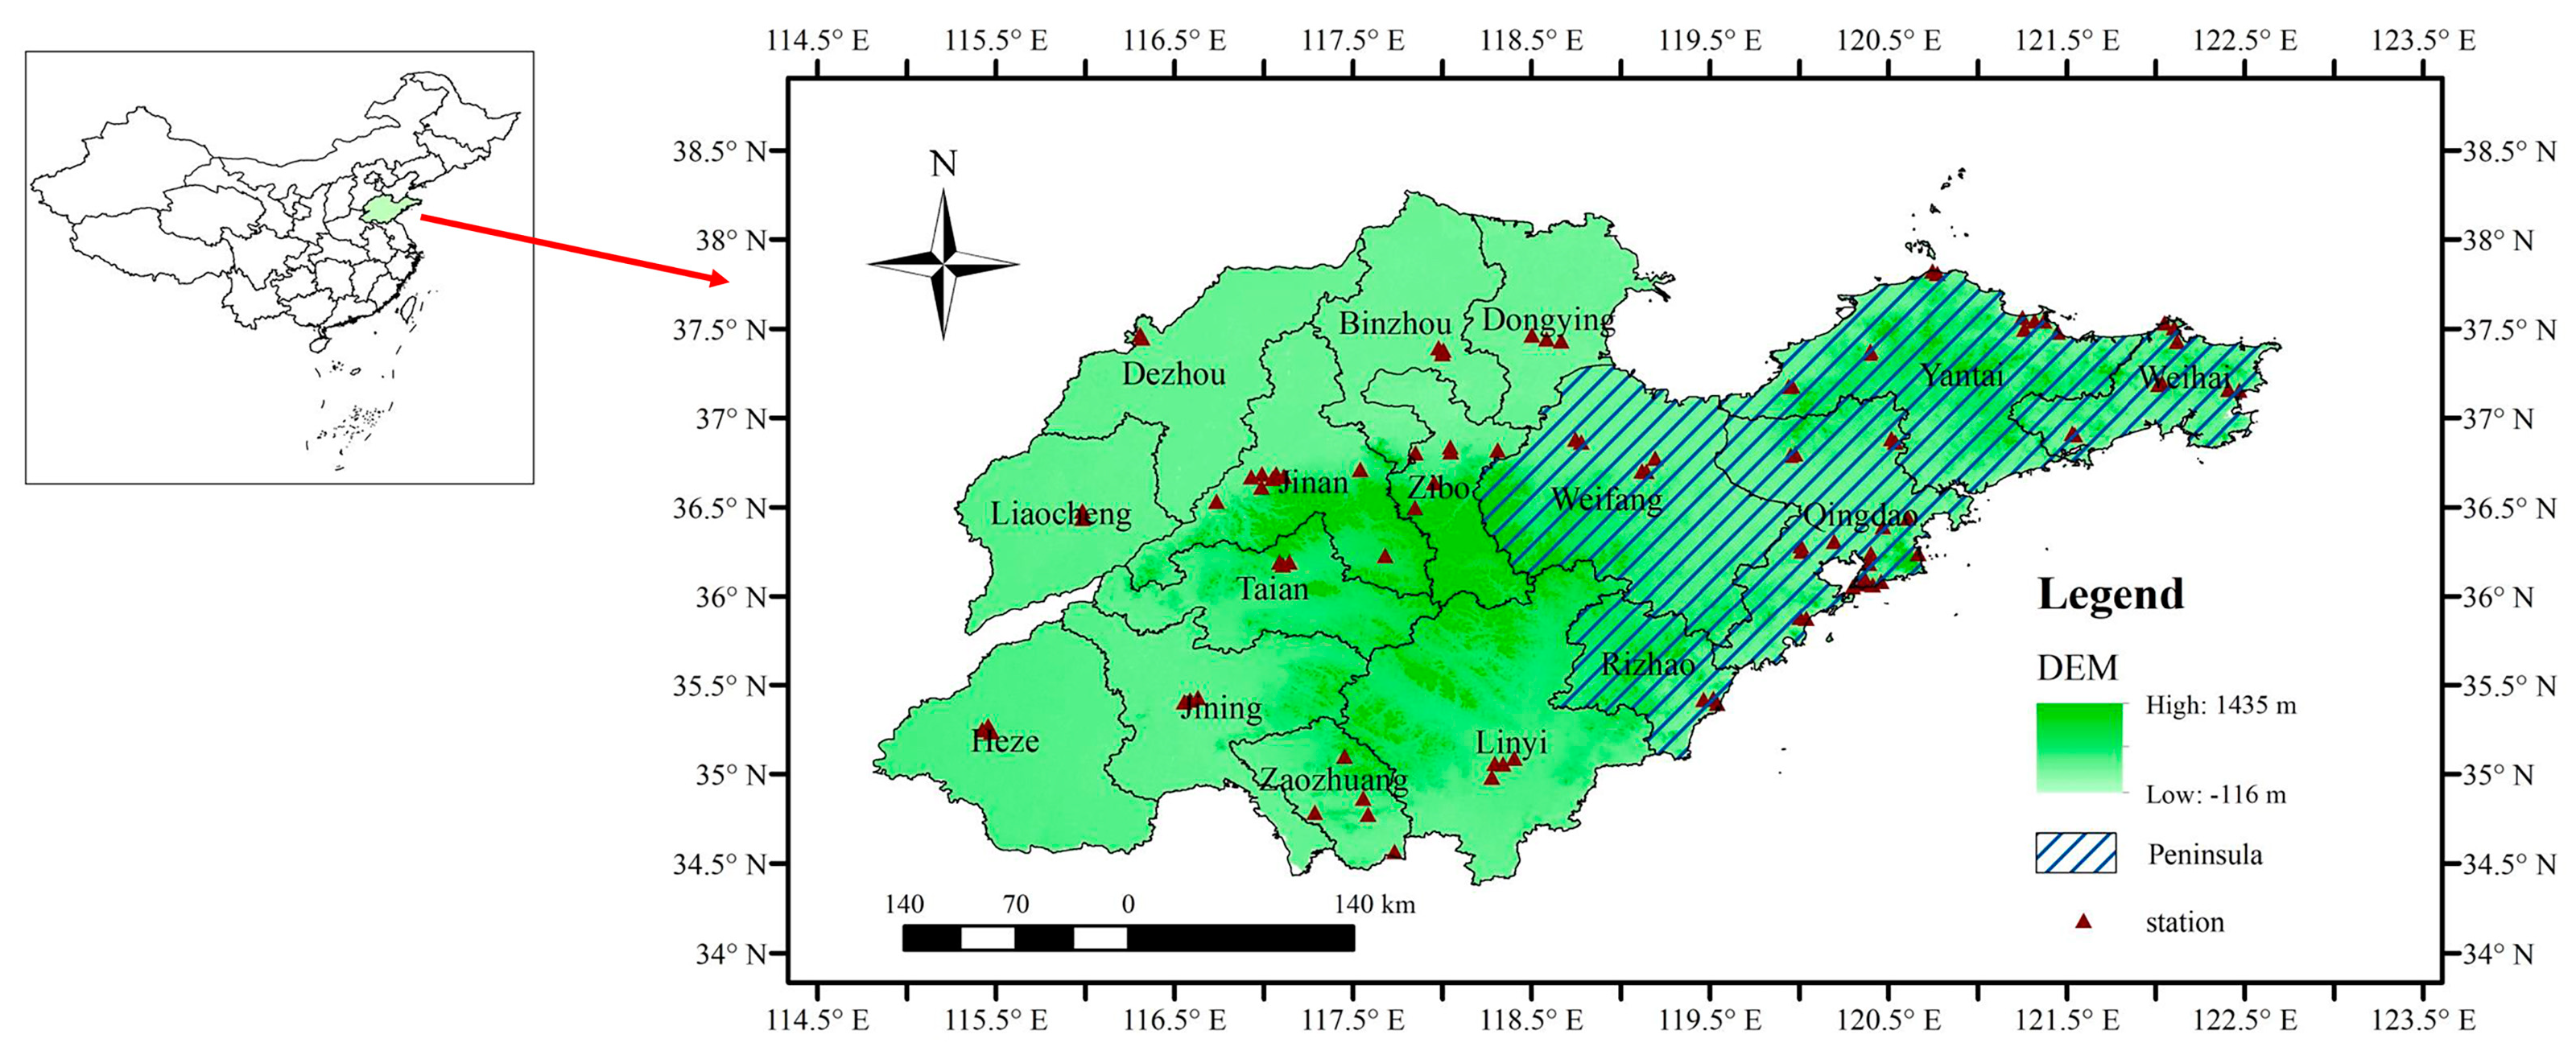
Shandong Province is located on the east coast of China and covers an area of 158,000 km2 (Figure 1). Its eastern part protrudes between the Bohai Sea and the Yellow Sea, while the western and northern parts are on the North China Plain. There is a large difference between seaside cities and inland cities, which is reflected in the level of urban development and meteorological factors.
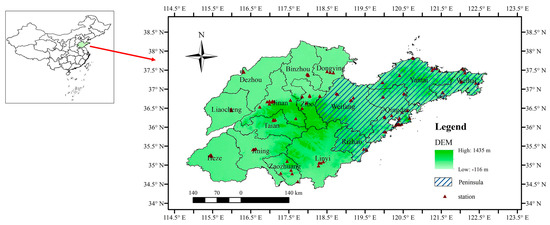
Figure 1.
Distribution of monitoring stations in Shandong Province.
As one of the most economically developed provinces in China with developed industry and a large population, Shandong has a fast-growing secondary industry and a continuously increasing rate of urbanization. Therefore, in 2016, large amounts of SO2 and soot were emitted and it had the highest SO2 emissions among the provinces. In Shandong, March, April, and May belong to the spring; June, July, and August belong to the summer; autumn consists of September, October, and November; and winter consists of December and January and February of the following year. Shandong has a warm temperate monsoonal climate with abundant sunlight, and the winter monsoon greatly affects the wind speed. Summer is the most humid and the warmest season. Winter and autumn are shorter than summer and spring. The temperature and precipitation are quite variable due to the different positions of land relative to the sea.
2.2. Data Source
The daily SO2 concentration, precipitation, and wind speed data from 1 January 2014 to 31 December 2019, were collected from the online air quality data website of the China National Environmental Monitoring Center. Ninety-one typical air pollution monitoring stations distributed in sixteen cities in Shandong province were selected. Considering the regional distribution, at least two stations in each city that could reflect the local situation were adopted. Qingdao, Jinan, and Yantai are the top three cities in terms of GDP in Shandong, with nineteen, twelve, and eleven stations, respectively. There are forty-six monitoring stations in the inland region and forty-five in the peninsular region. For each station, the daily data were the 24 h average values. The monthly value was calculated on the basis of daily values. The quarterly value was the average for the corresponding three months. The annual value was calculated from the twelve-monthly concentration values.
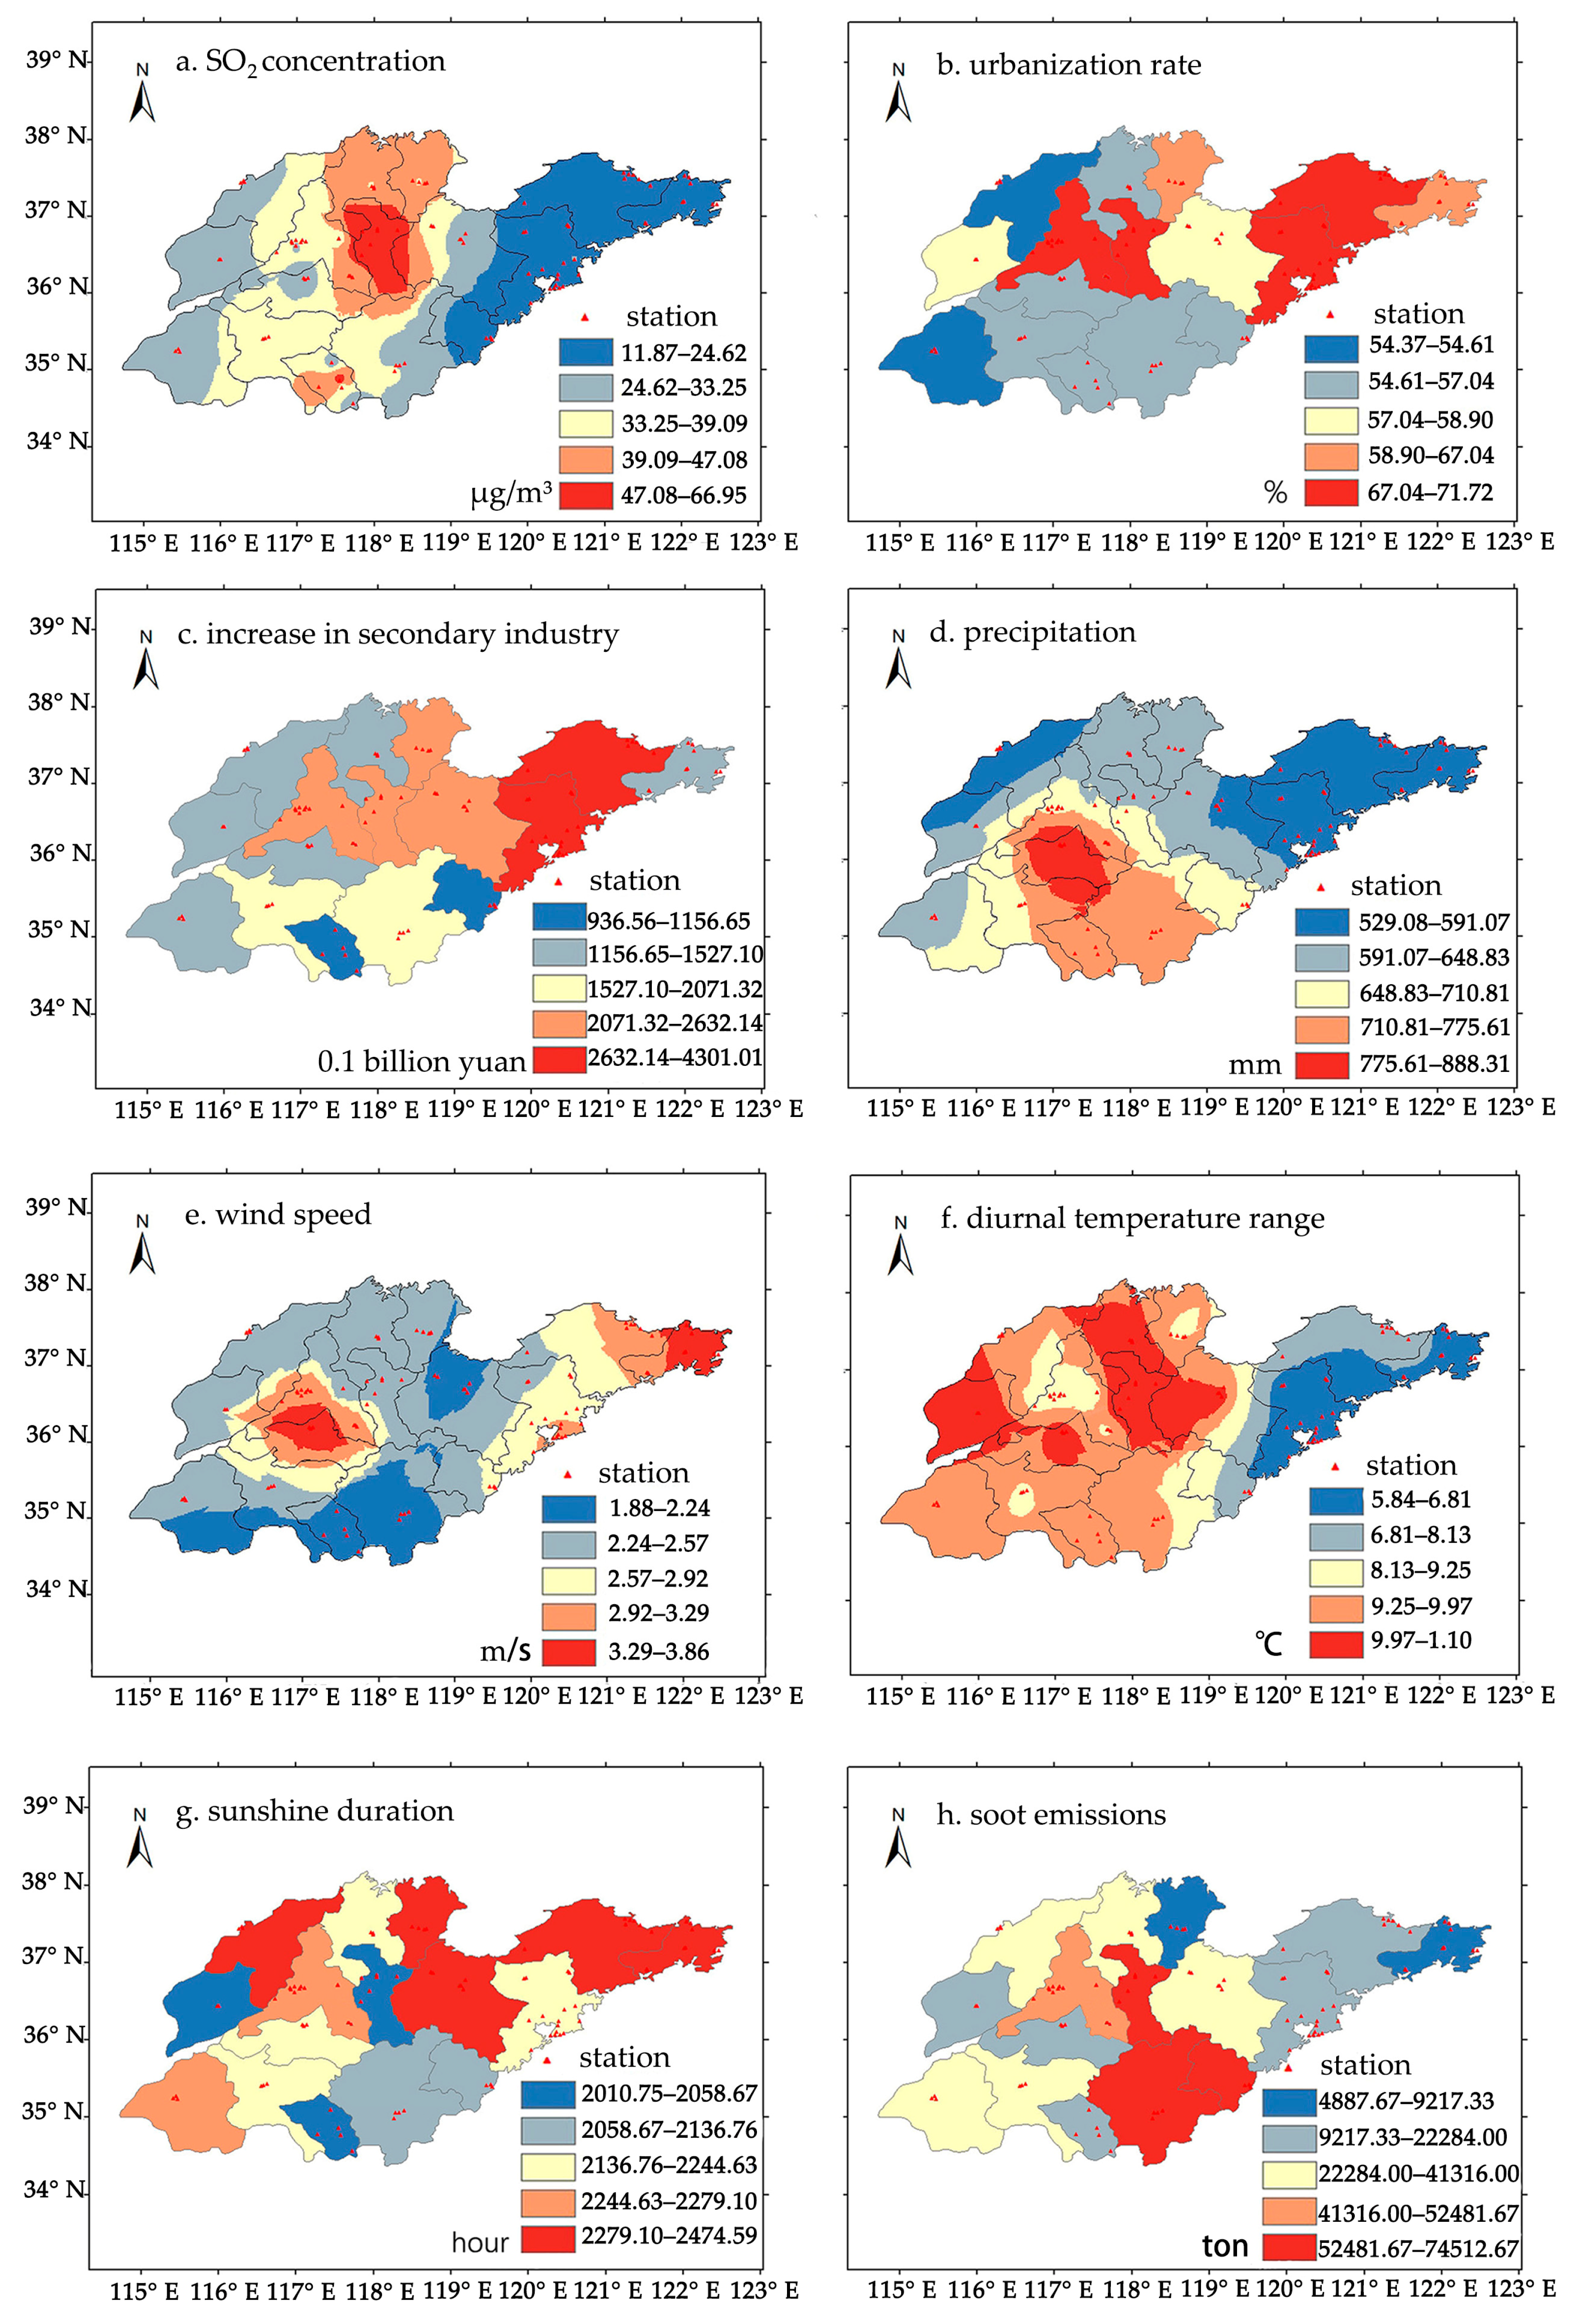
From the Shandong Provincial Bureau of Statistics, we retrieved yearly data on the urbanization rate and increases in secondary industry and soot emissions. We also retrieved the daily data on the temperature range and sunshine hours from the China Meteorological Data Network. Figure 2 shows the distributions of SO2, the urbanization rate, secondary industry, precipitation, wind speed, diurnal temperature range, sunshine duration, and soot emissions in Shandong. The quarterly and annual data related to the influencing factors were calculated and used in the research.
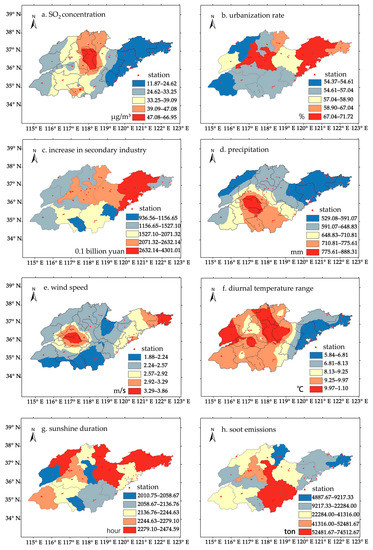
Figure 2.
Distribution of the annual average SO2 concentration and influencing factor data. Subgraphs (a–h), respectively, describe the spatial distribution of the average values of SO2 concentration, the urbanization rate, increase in secondary industry, precipitation, wind speed, diurnal temperature range, sunshine duration, and soot emissions from 2014 to 2019.
3. Methods
A geographical detector model was adopted to determine the impact of different factors on the spatial–temporal variation in the SO2 concentration in Shandong province. In the model, we assumed that the study area was divided into several subregions, which were categorized according to the K-means classification results of the factors that affect SO2. If the sum of the variance of the subregion was less than the total variance of the region, there would be spatial differentiation. If the spatial distributions of the two variables tended to be consistent, there would be a statistical correlation between the two variables. Factor detection, interaction detection, and ecological detection of the geographical detectors were used [10,21]. In the application of the geographical detectors, the input data consisted of a dependent variable and independent variables. The SO2 concentration was taken as the dependent variable, and the independent variables included diurnal temperature range, secondary industry, precipitation, wind speed, soot emission, sunshine duration, and urbanization rate. The model can consider both linear and nonlinear relationships between variables.
3.1. Factor Detection
Factor detection was used to detect the spatial differentiation of SO2 and the extent to which the influencing factor X explains the attributes of the spatial differentiation of SO2. The influence of factor X on the spatial differentiation of SO2 is measured by the q value. The expression is described as follows:
where h = 1, L is the strata of factor X, i.e., the K-means classification. and are the numbers of units in stratum h and the entire area, respectively. is the variance of the Y value of stratum h, and is the variance of the Y value of the entire area. SSW and SST are the sum of squares within and the total sum of squares, respectively. The range of the q values is (0, 1). A larger q corresponds to a stronger explanatory power of an influencing factor X on SO2. By comparing the sizes of the q values of the factors (Xs), the dominant factor that affects SO2 can be determined.
3.2. Interaction Detection
Interaction detection is used to calculate q () and q() and their interaction, i.e., the value q() of the new polygon distribution formed by the superposition of the layers and . By comparing these results, the relationships between influencing factors can be divided into five categories: nonlinear weakening, single-factor nonlinear weakening, two-factor enhancement, independent enhancement, and nonlinear enhancement. Through interaction detection, the relationships between factors (Xs) can be obtained.
3.3. Ecological Exploration
Ecological exploration is used to compare whether the effects of two factors and have significant differences in their influence on the spatial distribution of SO2. It is measured as follows by the F statistic:
where and are the sample sizes of two factors and , respectively. and are the sums of the intralayer variances of the stratifications formed by and , respectively; and and are the strata of layers in and , respectively. The null hypothesis is : = . If is rejected at the significance level of α, so the two factors and have a significant difference in their effects on the spatial distribution of SO2.
Using the statistical software R 3.6 and the package kernlab, the number of stratifications of each influencing factor was determined based on the elbow method. Then we imported the stratification into the geographical detector model and obtained the results.
4. Results
4.1. Overview of the Data Set
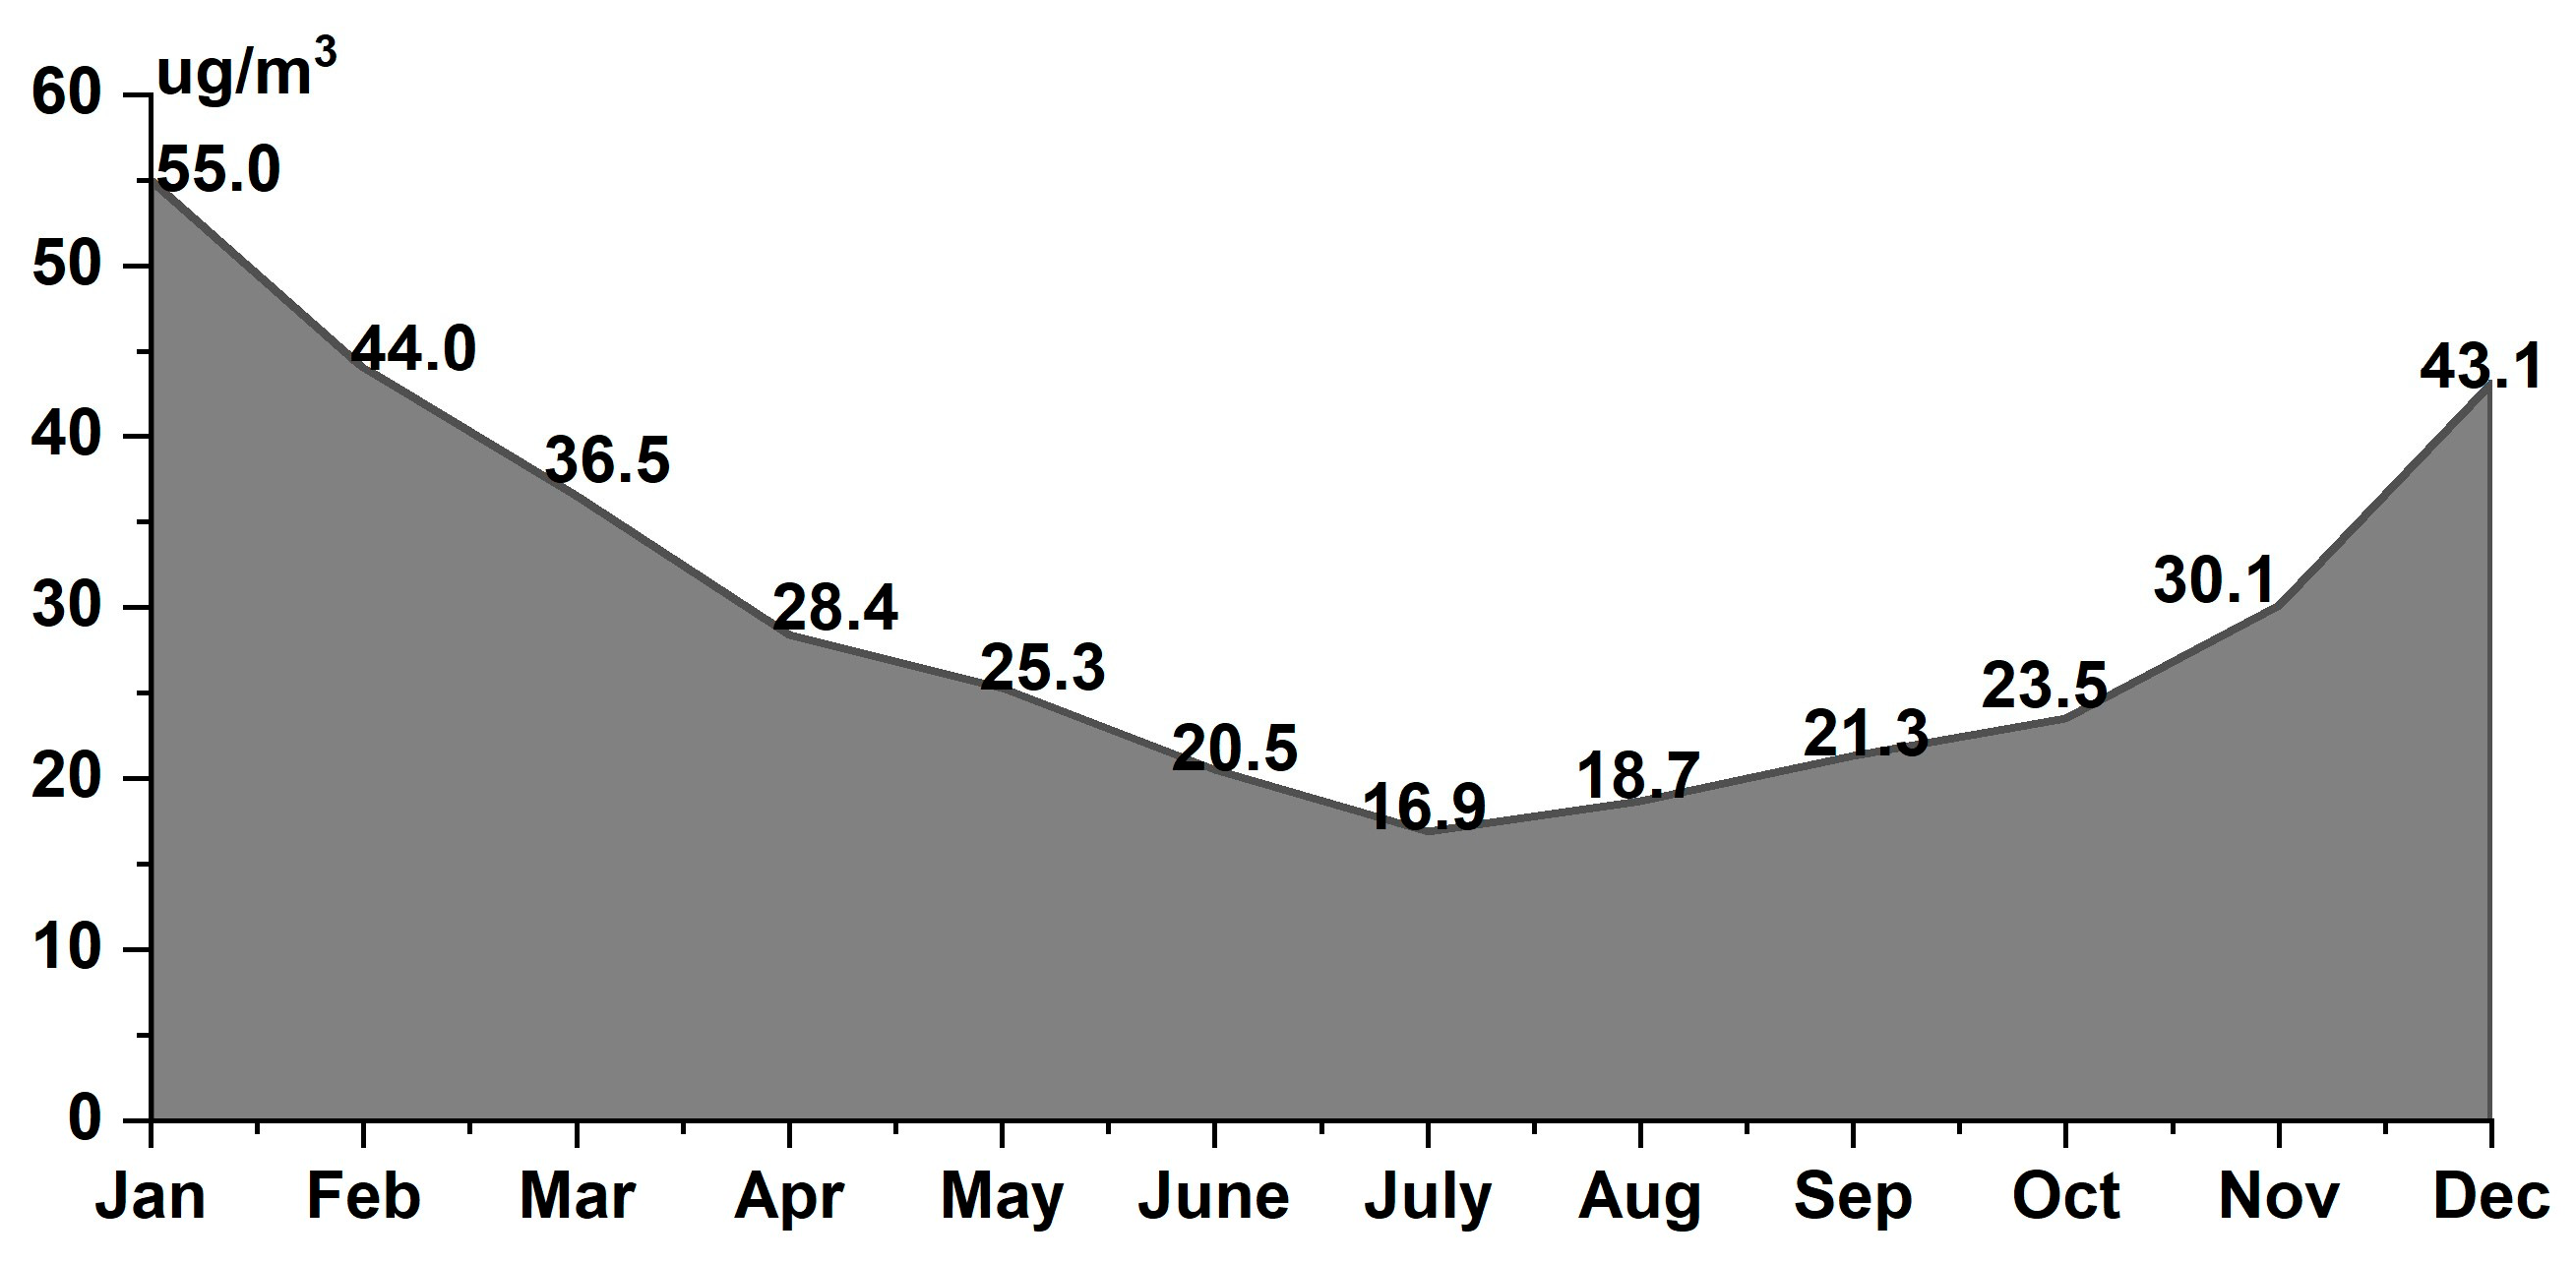
The average concentration of SO2 from 2014 to 2019 was high in inland areas and low in coastal areas, and the maximum concentration appeared in the transition area between the peninsular and the inland areas of Shandong (Figure 2). The SO2 concentration during the six years followed an obvious monthly pattern: the maximum value appeared in January, and the minimum value appeared in July (Figure 3). The maximum value was more than three times larger than the minimum value.
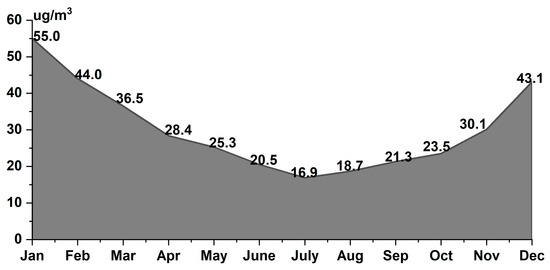
Figure 3.
Monthly average values of SO2 concentration from 2014 to 2019.
4.2. Annual Detection Results
The factor detection of the geographical detectors processed the six-year data and obtained the following results (q value): diurnal temperature range, secondary industry, precipitation, wind speed, soot emission, sunshine duration, and urbanization rate (Figure 4). The interaction detection shows that the interactions among all the factors were in two states: bilinear enhancement and nonlinear enhancement. Bilinear enhancement was reflected between the diurnal temperature range and all the other influencing factors, between secondary industry and precipitation, between secondary industry and wind speed, and between precipitation and wind speed. All pairwise relationships among the remaining factors were nonlinear enhancements.
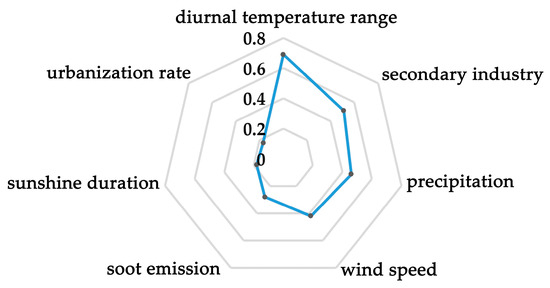
Figure 4.
Comparison chart of the factor detection results of seven influencing factors.
The ecological exploration showed no significant difference in SO2 distributions between sunshine duration and urbanization rate, between soot emission and urbanization rate, between secondary industry and precipitation, between secondary industry and wind speed, between precipitation and wind speed, between wind speed and soot emission, or between sunshine duration and soot emission. There were significant differences among the remaining elements.
4.3. Seasonal Detection Results
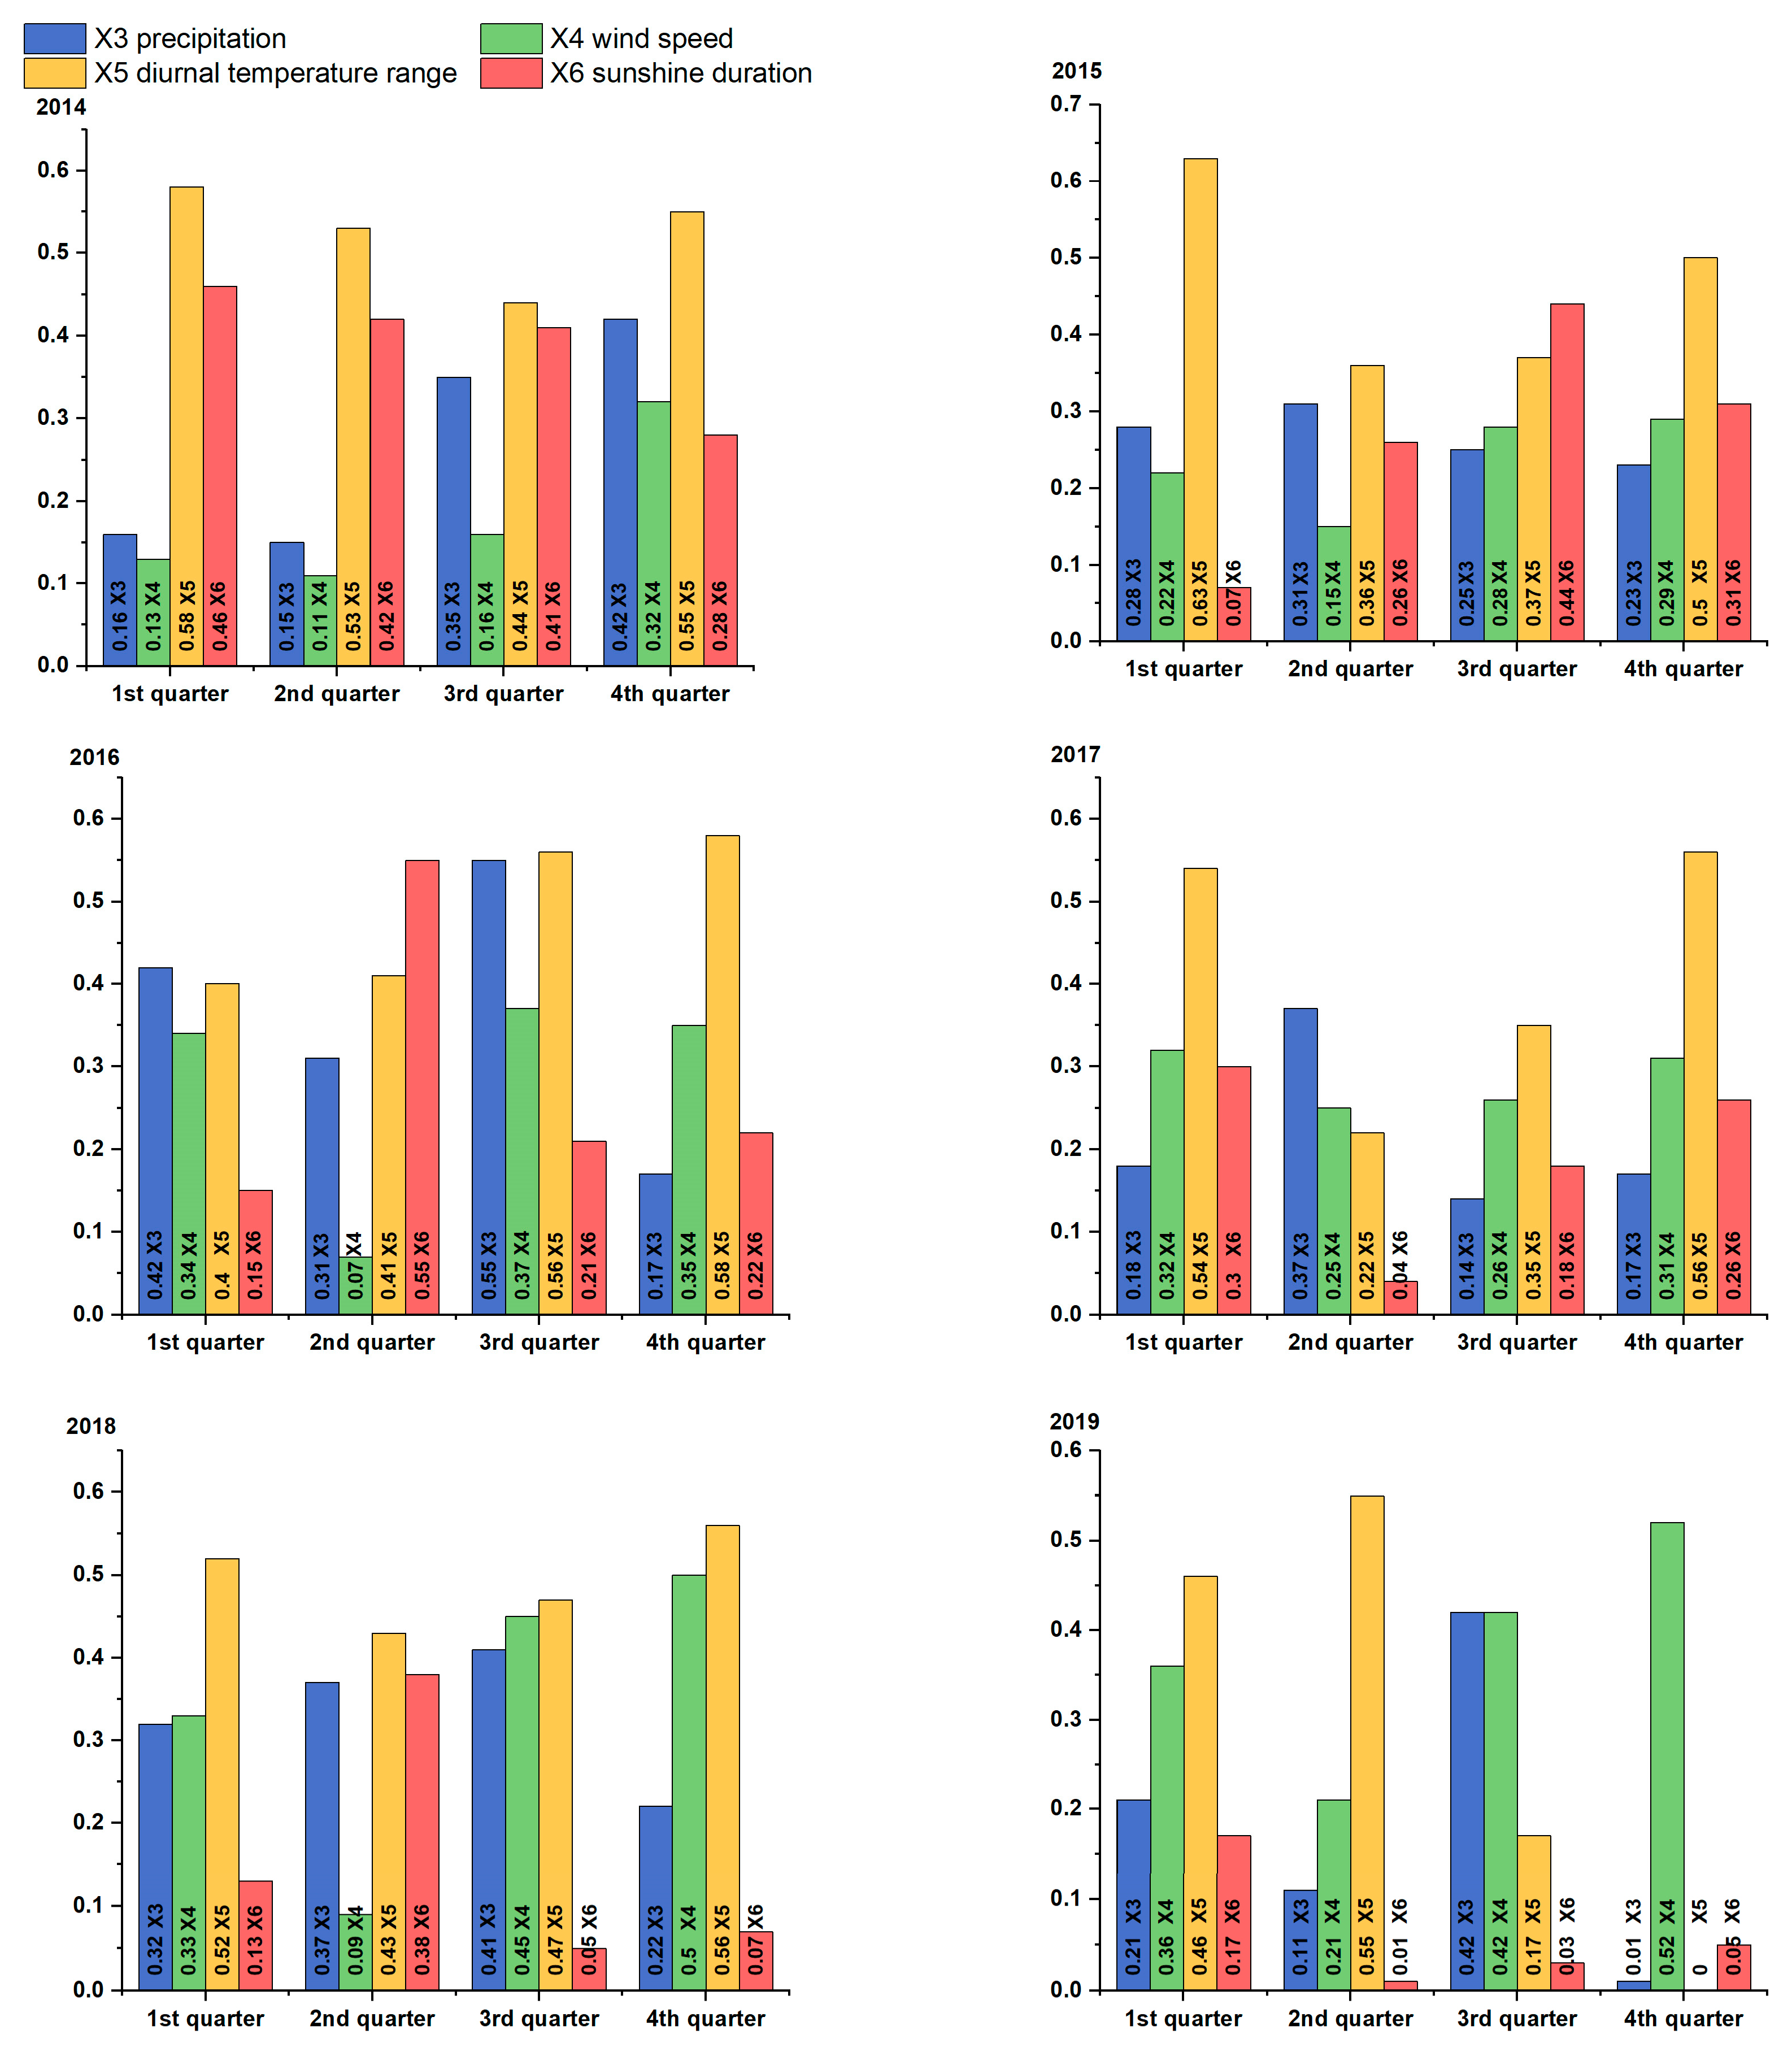
Four meteorological factors with large annual detection values and obvious seasonal changes—precipitation, wind speed, diurnal temperature range, and sunshine duration—were selected for geographical detection by quarter (Figure 5).

Figure 5.
Quarterly factor detection results from 2014 to 2019. X3: precipitation; X4: wind speed; X5: diurnal temperature range; X6: sunshine duration.
In 2014, the q values of precipitation were relatively high in the third and fourth quarters. The influence of the wind speed significantly increased in the fourth quarter. The q values of the diurnal temperature range were lower in the third quarter than in the other quarters, and the influence of the sunshine duration significantly decreased in the fourth quarter.
In 2015, the q value of precipitation was maximal in the second quarter. The q values of wind speed were higher in the third and fourth quarters and lower in the first and second quarters. The period with the highest q values of the diurnal temperature range was around the first and fourth quarters. There was a large gap in the q values between those two quarters and the second and third quarters. The largest q value of sunshine duration occurred in the third quarter, and the q values of sunshine duration had a large gap between the maximum and minimum values.
In 2016, the seasonal fluctuations in the q values of precipitation were large, with the maximum value in the third quarter and a large difference in values between the third and fourth quarters. The influence of wind speed became extremely small in the second quarter, and the overall trend of the q value first sharply decreased, subsequently increased, and finally decreased. The influence of the diurnal temperature range showed a trend of gradually increasing from the first quarter to the fourth quarter. The q values of sunshine duration were the highest in the second quarter.
In 2017, the influence of precipitation was largest in the second quarter (approximately twice as large as that in other quarters) and the first and fourth quarters had high and extremely similar q values of wind speed. The ranking of the q values of the diurnal temperature range in descending order was the fourth, first, third, and second quarters, and the difference between the maximum and minimum was 0.3. The influence of the sunshine duration was larger in the first quarter than in the other quarters.
In 2018, the q values of precipitation gradually increased during the first three quarters; in the fourth quarter, they fell to one-half of those in the second quarter. The q values of wind speed evenly increased in the first, third, and fourth quarters, but the second quarter showed an extremely low value. The influence of the diurnal temperature range was higher in the first and fourth quarters and lower in the second and third quarters, but the overall differences were not large. The q values of sunshine duration reached their highest value in the third quarter.
In 2019, the q values of precipitation reached their highest value in the third quarter. The ranking of the q values of wind speed in descending order was the fourth, third, first, and second quarters. The ranking of the q values of the diurnal temperature range in descending order was the second, first, third, and fourth quarters. The q value in the first quarter was 0.17, and the q values in the remaining quarters were extremely low.
4.4. Regional Human Factor Detection Results
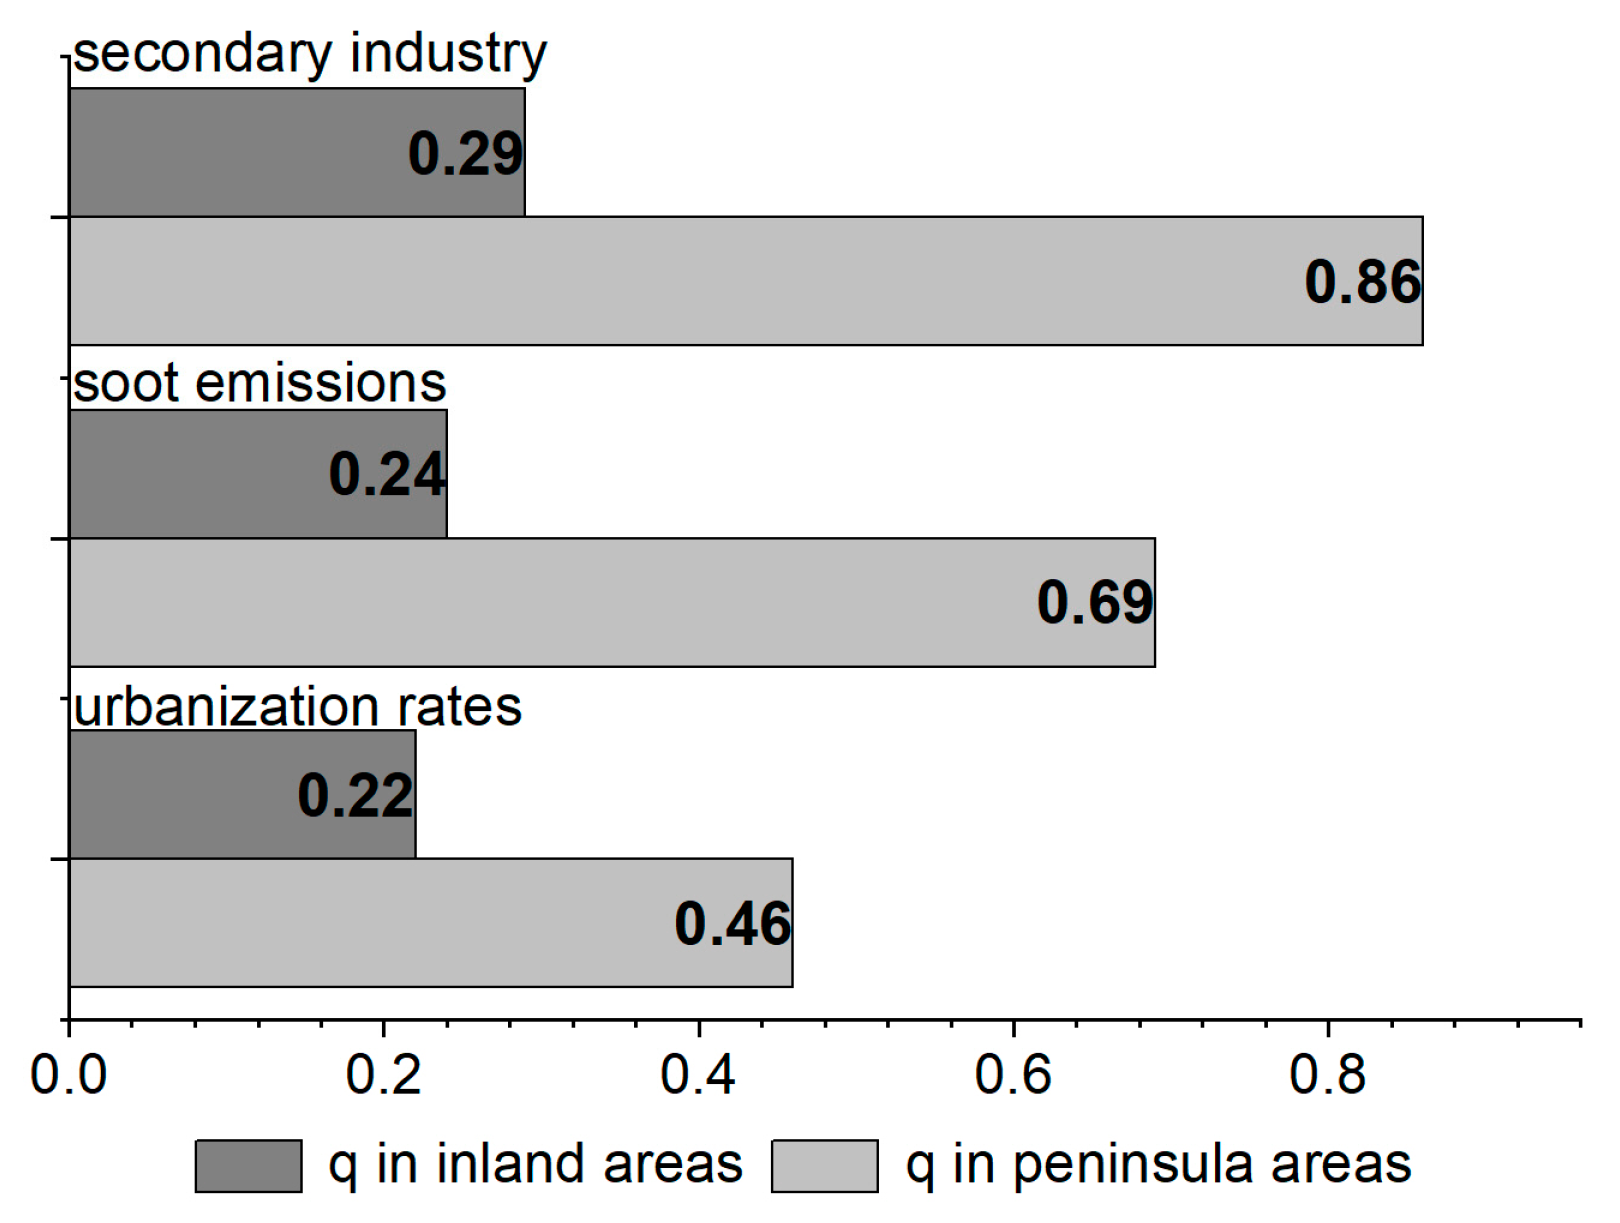
Human factors, including soot emissions, secondary production, and urbanization rates were selected to detect their q values. The geographical division of Shandong, Yantai, Weihai, Qingdao, Weifang, and Rizhao were classified as peninsular areas, and the remaining cities were classified as inland areas.
The detection results showed that there were significant differences in the human activity factors between the peninsular areas and the inland areas. The q values of the urbanization rates, secondary industry, and soot emissions in the inland areas and the peninsular areas are shown in Figure 6. All the q values in the peninsular areas were greater (two or more times) than those in the inland areas.
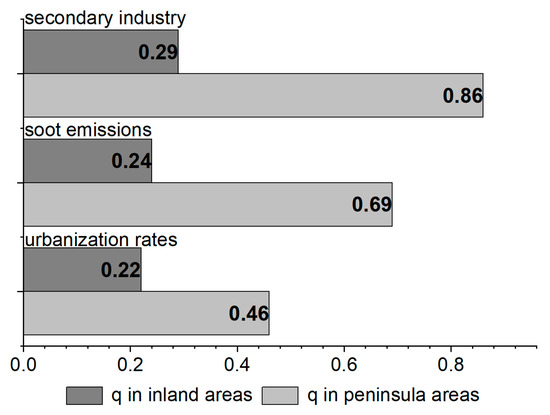
Figure 6.
Human factor detection results of inland areas and peninsular areas.
Ecological exploration shows that human factors had no significant effect on the SO2 distribution in inland areas but had a significant effect on that in peninsular areas.
5. Discussion
5.1. Analysis of Influencing Factors
When the q values of the influencing factors were sorted from large to small, meteorological factors and human activity factors alternately appeared, which shows that both meteorological factors and human activity factors were important factors that affected the SO2 concentration. The q value of the diurnal temperature range was 0.69, which was much higher than the q value of secondary production (0.51). Therefore, the diurnal temperature range was the leading factor of SO2 pollution in Shandong from 2014 to 2019. A previous study showed that the diurnal temperature range was positively related to the air quality API [22], and SO2 concentration is an important evaluation index of air quality. To a certain extent, the secondary industry factor reflects the expansion of industrial scale in a region, and the expansion of the industrial scale led to more SO2 [23]. The wind speed directly affects the diffusion of SO2, and precipitation can dissolve SO2 and affect the concentration of SO2 in the air [24]. Compared with the effects of other factors, the effects of soot emissions and urbanization rates on SO2 were not obvious.
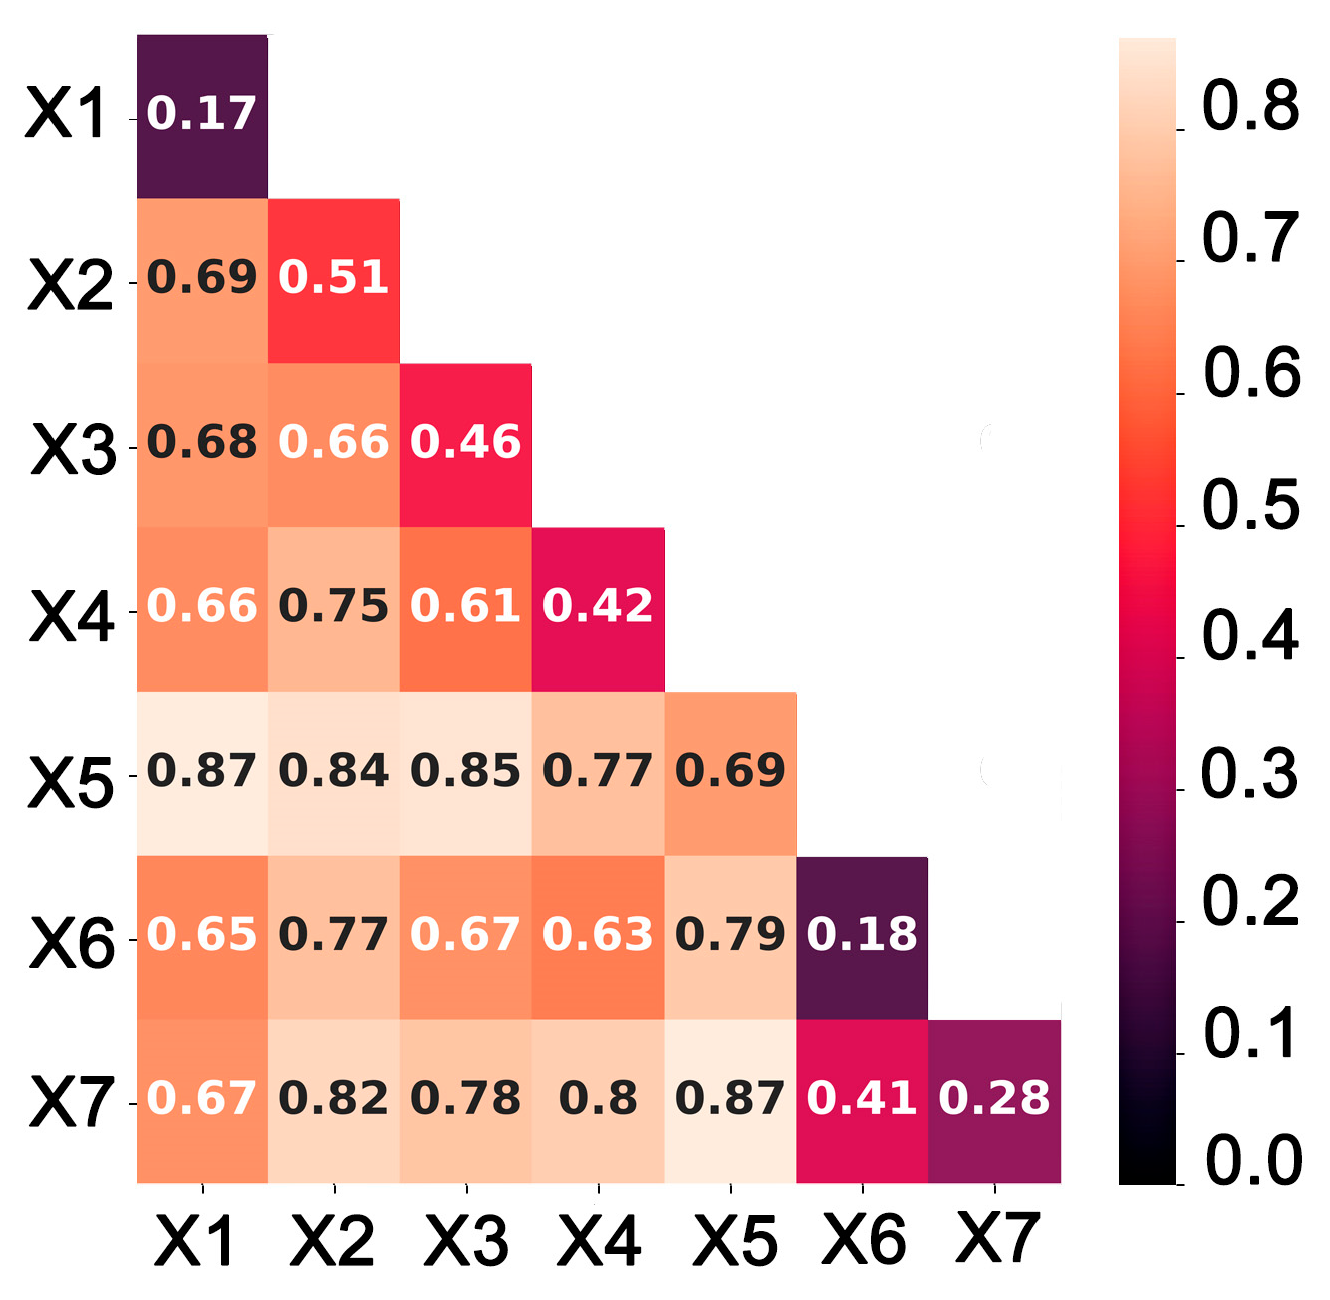
These factors affect SO2 and interact with one another. According to the interaction detection results, all influencing factors were enhanced (Figure 7). The interaction of the q values between the diurnal temperature range and the other influencing factors was greater than 0.69, which was very high. In addition, more than half of the interaction q values between the factors were higher than 0.6. Although the urbanization rate had the lowest q value of SO2, its interaction q value with the diurnal temperature range was as high as 0.87, which was the highest of all interaction q values. There was a very strong interaction and a very complex coupling relationship between the urbanization rate and the diurnal temperature range.

Figure 7.
Interaction detection results. X1: urbanization rate; X2: secondary industry; X3: precipitation; X4: wind speed; X5: diurnal temperature range; X6: sunshine duration; X7: soot emission.
The ecological detection results show obvious differences among most factors. The selected factors have their own characteristics, and the repeatability among the factors is small.
5.2. Seasonal Variability in Meteorological Factors
The quarters with larger precipitation q values were the second and third quarters. This result is consistent with the time when precipitation is concentrated in North China. The rainy season in Shandong starts at the end of June, reaches its peak at the end of July, and ends in early September [25]. The summer rainfall time coincided with the third quarter. Although the precipitation in the spring accounts for only 14% of the total annual precipitation in North China, the precipitation in the summer accounts for 65%. Considering the one-month deviation between the division of quarters and the division of seasons and the instability of the summer monsoon in China, the summer precipitation during June was included in the second quarter, so the time of precipitation concentration and the quarters with larger SO2 q values roughly coincided with each other. Moreover, the chemical properties of SO2 are unstable, and it reacts extremely easily with water, which supports the conclusion that precipitation can affect the SO2 concentration. In terms of the form of precipitation, the SO2 concentration absorbed by rainfall was much higher than that absorbed by snowfall [26]. The winter precipitation in Shandong is small, and part of it appears in the form of snow, so the absorption of precipitation during winter is not as good as that during summer.
Large q values of the diurnal temperature range often appeared in the fourth and first quarters. North China has its largest diurnal temperature range during the spring [27], which roughly corresponded with the fourth and first quarters. Among temperature, humidity, and wind speed, temperature had the most obvious long-term relationship with pollutants in the corresponding study area [9]. The factors that affect the diurnal temperature range are complex, and some studies have noted that there is reasonable agreement between the trend of SO2 emissions and the diurnal temperature range in highly polluted areas [28]. On a sunny day, the temperature varies greatly, and the vertical air convection is strong, which can make the inversion layer quickly disappear, which is conducive to the diffusion of pollutants [29].
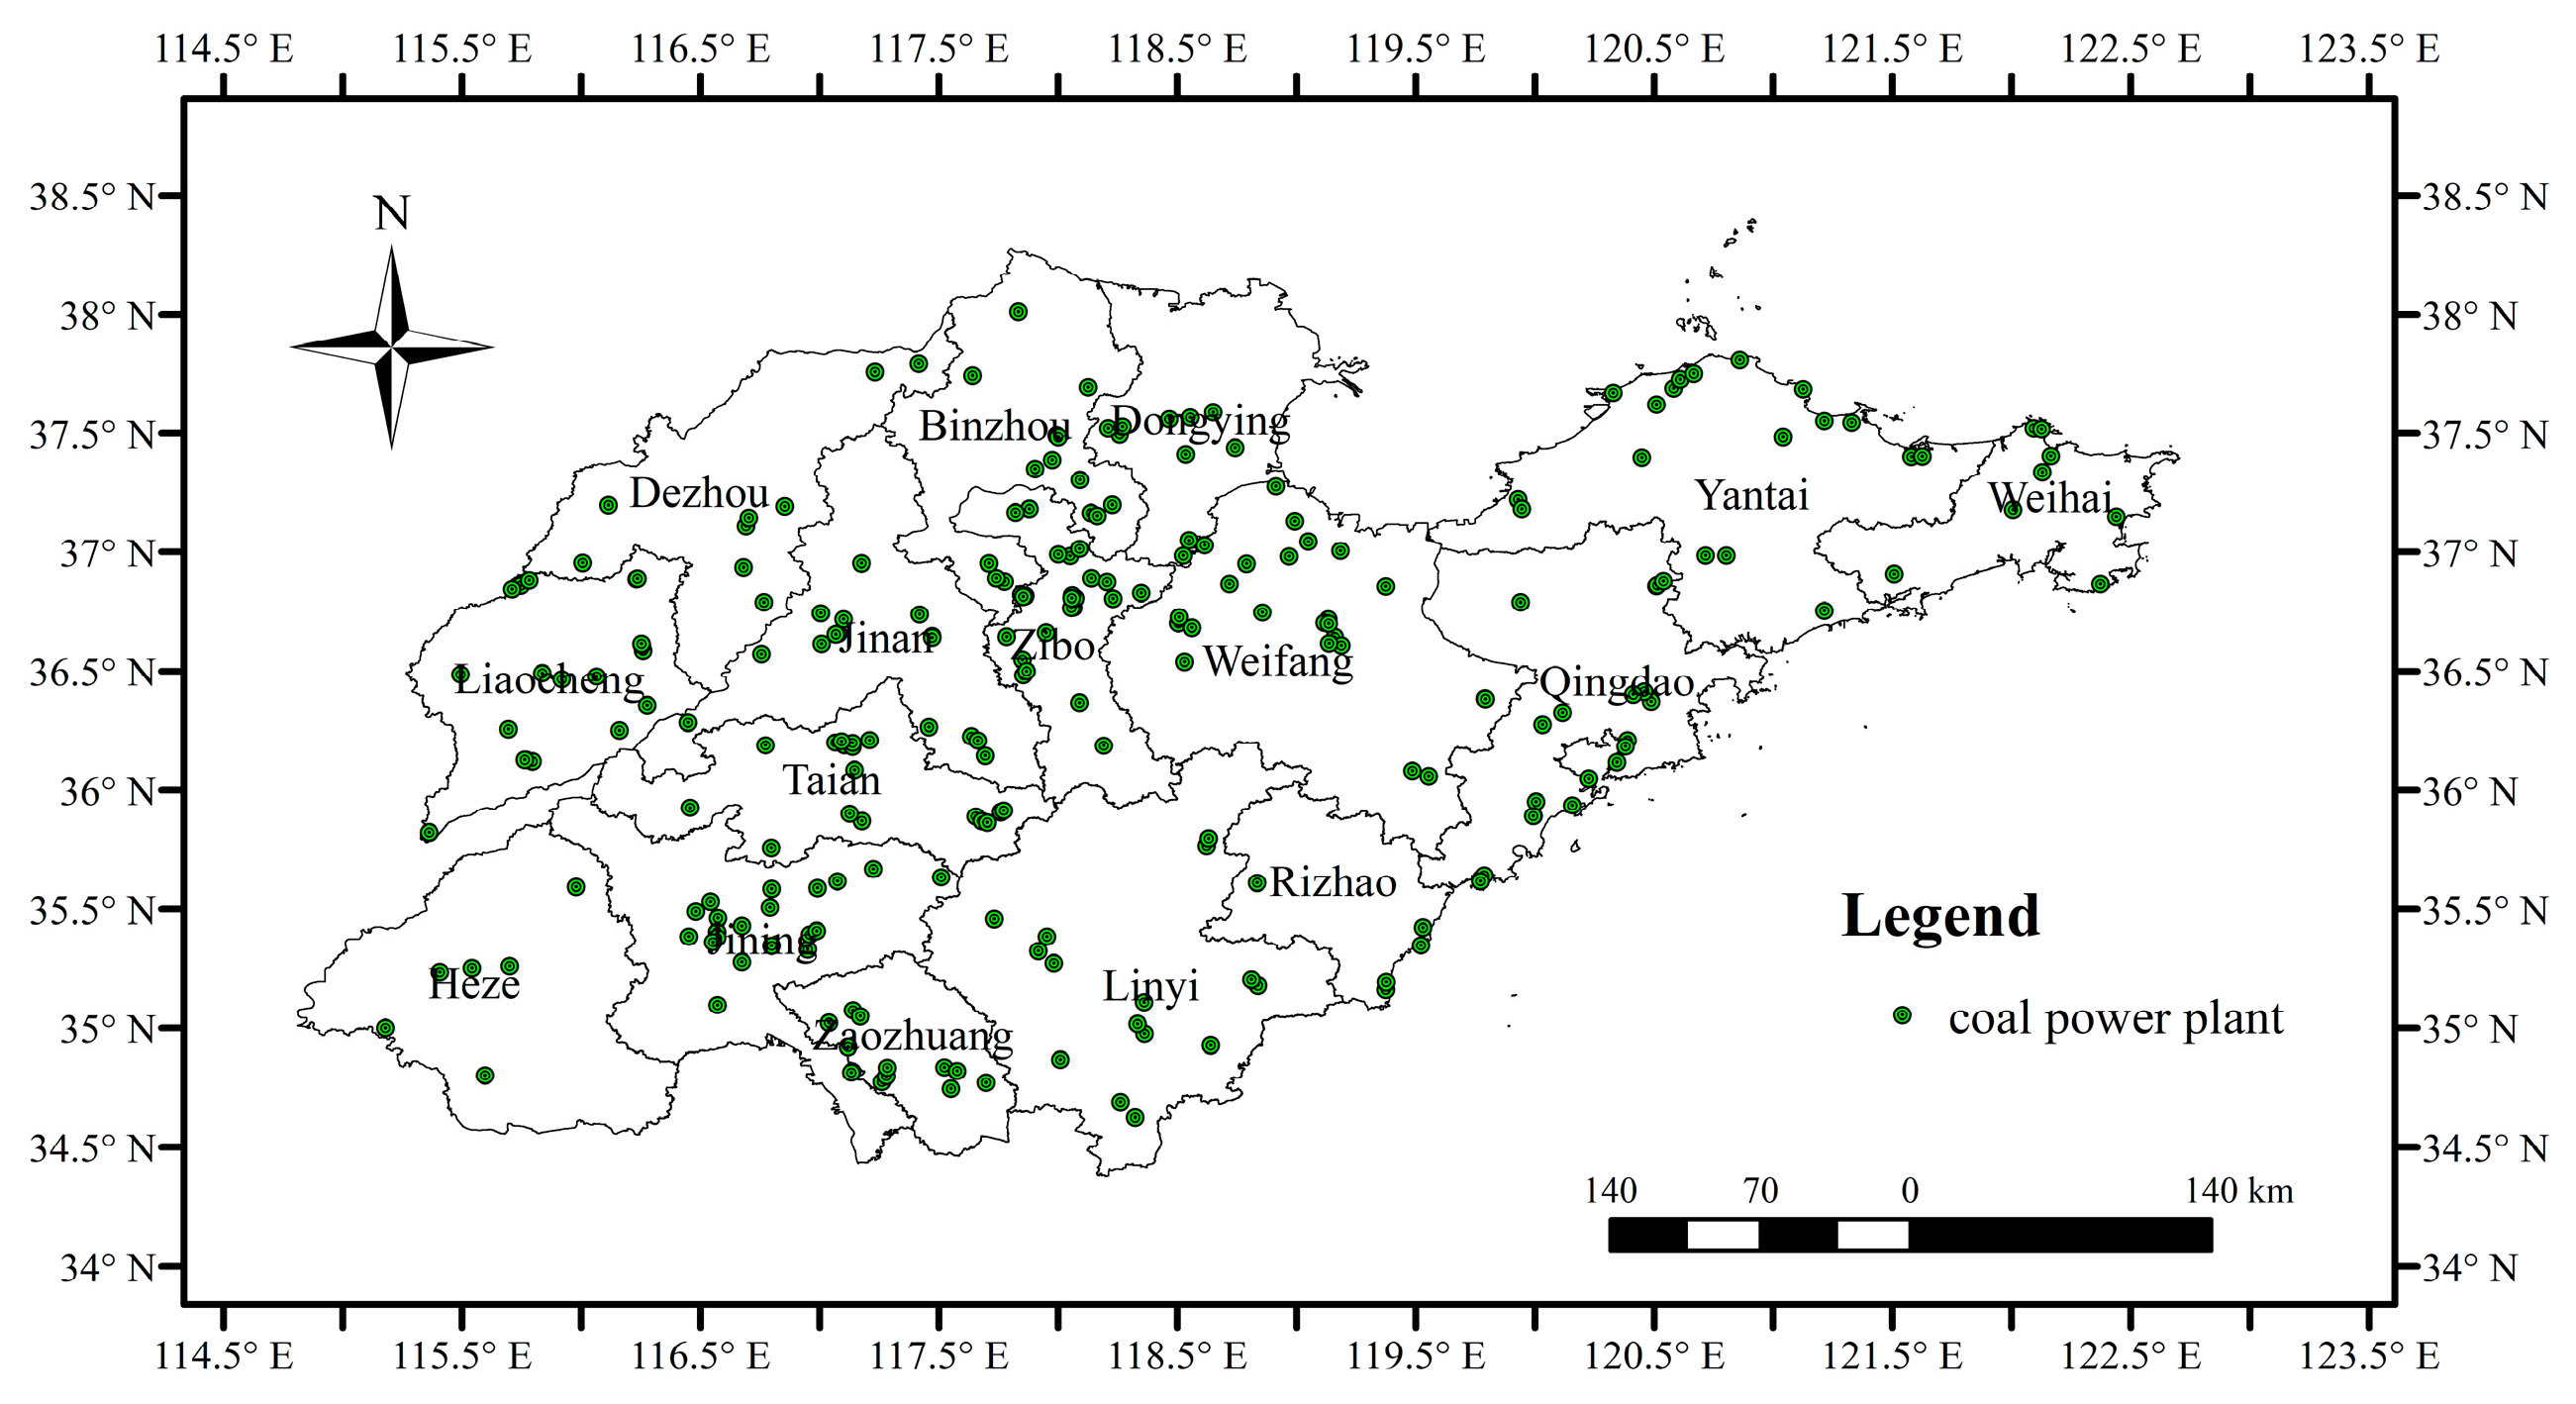
The highest q value of wind speed was in the fourth quarter, followed by the first quarter. Research has shown that the average wind speed on the North China Plain is relatively high during the first and fourth quarters but higher during the fourth quarter [30]. In addition, strong tropospheric stability is beneficial to the accumulation of SO2 over the North China Plain [31]. Analysis of the existing data showed that the SO2 concentration was high in spring and winter, and the wind speed in the first and fourth quarters was also high. It is generally believed that a high wind speed helps diffuse pollutants [32], which is contrary to the above research. This result shows that the factors influencing SO2 concentration include more factors than wind speed alone. This conclusion is consistent with the results of Goudarzi et al. which showed that poor fuel quality leads to the deterioration of ambient air quality [33]. The massive burning of biomass fuels during spring and coal-fired central heating during winter have greatly increased SO2 emissions (Figure 8) [34,35]. Multifactor coupling caused the ultimate effects on SO2.

Figure 8.
Distribution of coal power plants in Shandong Province.
There was no special quarterly pattern in the q values of sunshine duration, and the quarterly values of each year varied.
5.3. Regional Analysis of Human Factors
There were obvious differences in the spatial distributions of the human factors (Figure 2). All cities with a large increase in secondary industry were located in peninsular areas, and the q value of the peninsular areas was indeed nearly three times that of the inland areas. Thus, a greater increase in secondary production has a greater impact on SO2 emissions. However, a larger increase in secondary production does not indicate more SO2 emissions. There is an inverted U-shaped relationship between emissions and the economy [36]. When the economy reaches a certain level, the technical and structural effects dominate. The deterioration has slowed down. The economic disparity could increase SO2 emission inequality [37].
The urbanization level of Shandong was concentrated from 54.61% to 57.04%. Many cities were in this urbanization level segment, and there was a very large gap in urbanization between the 58.9–67.04% segment and the above 67.04% segments. In general, the urbanization rate was higher in the peninsular areas than in the inland areas. Studies have shown that changes in SO2 in urban areas are less affected by meteorological factors because urban SO2 depends on the traffic volume [9]. Therefore, places with higher levels of urbanization were more affected by the traffic volume, so peninsular areas had a larger effect than inland areas.
The areas with large soot emissions are mainly concentrated near the boundary between peninsular areas and inland areas, and most of them are located in inland areas. The concentrations of SO2 and soot emissions in inland areas were significantly higher than those in peninsular areas, but the q value in peninsular areas was more than twice that in inland areas. The reason may be that the ratio of SO2 to soot emissions was higher in peninsular areas than in inland areas.
The main purpose of this study was to analyze the effects of selected influencing factors on the spatiotemporal distribution of SO2 air pollution through geographical detection. As the formation and transmission mechanism of air pollution is complex, its influencing factors are also numerous. Through analysis and comparison, we selected seven factors with high probability, and the research results proved our choice was correct. In the research process, we fully considered the spatio-temporal distribution, spatial stratified heterogeneity, and variable coupling of data, and analyzed SO2 air pollution and influencing factors from the three perspectives of factor detection, interactive detection, and ecological exploration, so as to ensure the reliability of the results. In addition, the long time series and comprehensiveness of the data are also worth determining. However, we lacked an in-depth analysis of the action mechanisms of the influencing factors, which will be the focus of our attention in the future. For example, a limitation of the research is that we did not take into account the potential effect of the distribution of thermal power stations, changes in generation capacity, and improvements in discharge devices due to the lack of data. This should be further studied in later research.
6. Conclusions
The analysis of SO2 influencing factors in Shandong from 2014 to 2019 based on geographical detectors shows that the diurnal temperature range had the largest influence on SO2 in Shandong, which made it the dominant factor. The secondary industry increase, precipitation, wind speed, soot emission, sunshine duration, and urbanization rate followed. There were mutually reinforcing relationships between influencing factors, and more than half of the relationships between the factors had significant differences. The meteorological factors of precipitation, diurnal temperature range, and wind speed were sensitive to seasonal changes, and the months with higher q values were consistent with the months with higher values in the factors related to physical geography. The sunshine duration had no obvious seasonal regularity. Among the meteorological factors, there were complex coupling relationships. There were obvious differences in the geographical distributions of the following human activity factors: soot emissions, secondary industry increases, and urbanization rates. These factors had greater influence in peninsular areas than in inland areas.
This research provides effective decision-making references to govern SO2 emissions. It lays the foundation for people to combine weather forecasts with production and life according to the seasonal regularity of the effects of meteorological factors on SO2, which will enable people to plan seasonal production to minimize adverse effects. Based on human factor detection, people can rationally plan the industrial development and manage upgrades to industrial structures.
Author Contributions
Conceptualization, methodology, funding acquisition, supervision, project administration, H.W.; data curation, software, S.H.; validation, visualization, Y.L. and W.Y.; writing—original draft preparation, review and editing, S.H., H.W. and M.H. All authors have read and agreed to the published version of the manuscript.
Funding
This research was funded by the National Natural Science Foundation of China, grant numbers 41771434 and 41930651, and the Fundamental Research Funds for the Central Universities, grant numbers 18CX02064A.
Institutional Review Board Statement
Not applicable.
Informed Consent Statement
Not applicable.
Data Availability Statement
Publicly available datasets were analyzed in this study. The daily SO2 concentration from 2014 to 2019 can be found at the China National Environmental Monitoring Center website http://www.cnemc.cn. The meteorological data can be found at the China meteorological data network website http://data.cma.cn. Data on the diurnal temperature range, secondary production, soot emissions, sunshine duration, and urbanization rate, can be found at the Shandong Provincial Bureau of Statistics website http://tjj.shandong.gov.cn.
Acknowledgments
The authors want to thank Zhen Wei and Yanrong Wang at China University of Petroleum for their assistance.
Conflicts of Interest
The authors declare no conflict of interest.
References
- Geravandi, S.; Goudarzi, G.R.; Niri, M.V.; Mohammadi, M.J.; Saeidimehr, S.; Geravandi, S. Estimate of cardiovascular and respiratory mortality related to sulfur dioxide pollutant in Ahvaz. J. Environ. Stud. 2015, 41, 341–350. [Google Scholar] [CrossRef]
- Khaniabadi, Y.O.; Daryanoosh, S.M.; Hopke, P.K.; Ferrante, M.; De Marco, A.; Sicard, P.; Conti, G.O.; Goudarzi, G.; Basiri, H.; Mohammadi, M.J.; et al. Acute myocardial infarction and COPD attributed to ambient SO2 in Iran. Environ. Res. 2017, 156, 683. [Google Scholar] [CrossRef] [PubMed]
- Effatpanah, M.; Effatpanah, H.; Jalali, S.; Parseh, I.; Goudarzi, G.; Barzegar, G.; Geravandi, S.; Darabi, F.; Ghasemian, N.; Mohammadi, M.J. Hospital admission of exposure to air pollution in Ahvaz megacity during 2010–2013. Clin. Epidemiol. Glob. Health 2020, 8, 550. [Google Scholar] [CrossRef] [Green Version]
- He, J. Industrialization, environment and health: The impacts of industrial SO2 emission on public health in China. Chin. J. Popul. Resour. Environ. 2008, 6, 14–24. [Google Scholar] [CrossRef]
- Chit-Ming, W.; Nuntavarn, V.V.; Kan, H.; Qian, Z. Public health and air pollution in Asia (PAPA): A multicity study of short-term effects of air pollution on mortality. Environ. Health Perspect. 2007, 116, 1195–1202. [Google Scholar] [CrossRef] [Green Version]
- Turalıoğlu, F.; Nuhoğlu, A.; Bayraktar, H. Impacts of some meteorological parameters on SO2 and TSP concentrations in Erzurum, Turkey. Chemosphere 2005, 59, 1633–1642. [Google Scholar] [CrossRef]
- Yang, X.; Wang, S.; Zhang, W.; Zhan, D.; Li, J. The impact of anthropogenic emissions and meteorological conditions on the spatial variation of ambient SO2 concentrations: A panel study of 113 Chinese cities. Sci. Total Environ. 2016, 584–585, 318–328. [Google Scholar] [CrossRef] [PubMed]
- Yang, X.; Wang, S.; Zhang, W.; Li, J.; Zou, Y. Impacts of energy consumption, energy structure, and treatment technology on SO2 emissions: A multi-scale LMDI decomposition analysis in China. Appl. Energy 2016, 184, 714–726. [Google Scholar] [CrossRef]
- He, H. Multifractal analysis of interactive patterns between meteorological factors and pollutants in urban and rural areas. Atmos. Environ. 2017, 149, 47–54. [Google Scholar] [CrossRef]
- Wang, J.; Xu, C. Geodetector: Principle and prospective. Acta Geogr. Sin. 2017, 72, 116–134. [Google Scholar] [CrossRef]
- Zou, B.; Wilson, J.G.; Zhan, F.B.; Zeng, Y.; Wu, K. Spatial-temporal variations in regional ambient sulfur dioxide concentration and source-contribution analysis: A dispersion modeling approach. Atmos. Environ. 2011, 45, 4977–4985. [Google Scholar] [CrossRef]
- Lou, C.R.; Liu, H.Y.; Li, Y.F.; Li, Y.L. Socioeconomic Drivers of PM2.5 in the Accumulation Phase of Air Pollution Episodes in the Yangtze River Delta of China. Int. J. Environ. Res. Public Health 2016, 13, 928. [Google Scholar] [CrossRef] [PubMed] [Green Version]
- Dai, Y.H.; Zhou, W.X. Temporal and spatial correlation patterns of air pollutants in Chinese cities. PLoS ONE 2017, 12, e0182724. [Google Scholar] [CrossRef] [Green Version]
- Zhan, D.; Kwan, M.P.; Zhang, W.; Wang, S.; Yu, J. Spatiotemporal Variations and Driving Factors of Air Pollution in China. Int. J. Environ. Res. Public Health 2017, 14, 1538. [Google Scholar] [CrossRef] [Green Version]
- Han, Y.; Zhao, W.; Pereira, P. Global COVID-19 pandemic trends and their relationship with meteorological variables, air pollutants and socioeconomic aspects. Environ. Res. 2022, 204 Pt C, 112249. [Google Scholar] [CrossRef]
- Luo, W.; Jasiewicz, J.; Stepinski, T.; Wang, J.; Xu, C.; Cang, X. Spatial association between dissection density and environmental factors over the entire conterminous United States. Geophys. Res. Lett. 2016, 43, 692–700. [Google Scholar] [CrossRef] [Green Version]
- Zhang, L.; Liu, W.; Hou, K.; Lin, J.; Song, C.; Zhou, C.; Huang, B.; Tong, X.; Wang, J.; Rhine, W.; et al. Air pollution exposure associates with increased risk of neonatal jaundice. Nat. Commun. 2019, 10, 3741. [Google Scholar] [CrossRef] [PubMed]
- Li, J.; Liang, J.; Wang, J.; Ren, Z.; Yang, D.; Wang, Y.; Mu, L.; Li, X.; Li, M.; Guo, Y.; et al. Spatiotemporal trends and ecological determinants in maternal mortality ratios in 2205 Chinese counties, 2010–2013: A Bayesian modelling analysis. PLoS Med. 2020, 17, e1003114. [Google Scholar] [CrossRef] [PubMed]
- Hu, M.; Lin, H.; Wang, J.; Xu, C.; Tatem, A.J.; Meng, B.; Zhang, X.; Liu, Y.; Wang, P.; Wu, G.; et al. Risk of Coronavirus Disease 2019 Transmission in Train Passengers: An Epidemiological and Modeling Study. Clin. Infect. Dis. 2021, 72, 604–610. [Google Scholar] [CrossRef]
- Wang, J.F.; Li, X.H.; Christakos, G.; Liao, Y.L.; Zhang, T.; Gu, X.; Zheng, X.Y. Geographical Detectors-Based Health Risk Assessment and its Application in the Neural Tube Defects Study of the Heshun Region, China. Int. J. Geogr. Inf. Sci. 2010, 24, 107–127. [Google Scholar] [CrossRef]
- Geodetector. Available online: http://www.geodetector.cn/ (accessed on 22 December 2021).
- Li, L.; Qian, J.; Ou, C.; Zhou, Y.; Guo, C.; Guo, Y. Spatial and temporal analysis of Air Pollution Index and its timescale-dependent relationship with meteorological factors in Guangzhou, China, 2001–2011. Environ. Pollut. 2014, 190, 75–81. [Google Scholar] [CrossRef] [PubMed]
- Han, Y.; Xiong, X.; Liu, Y.; Pan, Y. The analysis of factors affecting SO2 emission of Chinese industry. In Proceedings of the International Conference on Computer & Management, Wuhan, China, 19–21 May 2011. [Google Scholar]
- Li, R.; Fu, H.; Cui, L.; Li, J.; Wu, Y.; Meng, Y.; Wang, Y.; Chen, J. The spatiotemporal variation and key factors of SO2 in 336 cities across China. J. Clean. Prod. 2019, 210, 602–611. [Google Scholar] [CrossRef]
- Hao, L. Spatial-Temporal Variation of the Precipitation in North China and the Impact Factors of Precipitation Reduction. Ph.D. Thesis, Nanjing University of Information Science & Technology, Nanjing, China, 2011. [Google Scholar]
- Walter, H.C.; David, H.S.C. Regional-scale precipitation scavenging of SO2, SO4, NO3 and HNO3. Atmos. Environ. 1986, 20, 1397–1402. [Google Scholar] [CrossRef]
- Zhou, J.; Shao, H.; Wu, Y.; Hu, J. Spatial and temporal characteristics of diurnal temperature range in North China. J. Yangzhou Univ. (Nat. Sci. Ed.) 2013, 16, 38–43. [Google Scholar] [CrossRef]
- Makowski, K.; Wild, M.; Ohmura, A. Diurnal temperature range over Europe between 1950 and 2005. Atmos. Chem. Phys. 2008, 8, 6483–6498. [Google Scholar] [CrossRef] [Green Version]
- Zhao, B.; Zhang, J.; Liu, X.; Chen, J. Analyzing 24-hour variation of atmosphere pollution character in Luoyang city and related meteorological factors. Environ. Monit. China 2004, 20, 21–23. [Google Scholar] [CrossRef]
- Liu, S.; Qiu, J.; Mo, X. Wind velocity variation from 1951 to 2006 in the north China plain. Resour. Sci. 2009, 31, 1486–1492. [Google Scholar] [CrossRef]
- Lin, C.; Chen, Y.; Liu, C.; Chen, W.; Chou, C.K. Satellite-derived correlation of SO2, NO2, and aerosol optical depth with meteorological conditions over east Asia from 2005 to 2015. Remote Sens. 2019, 11, 1738. [Google Scholar] [CrossRef] [Green Version]
- Bralić, M.; Buljac, M.; Periš, N.; Buzuk, M.; Dabić, P.; Brinić, S. Monthly and Seasonal Variations of NO2, SO2 and Black-smoke Located Within the Sport District in Urban Area, City of Split, Croatia. Croat. Chem. Acta 2012, 85, 139–145. [Google Scholar] [CrossRef]
- Goudarzi, G.; Geravandi, S.; Idani, E.; Hosseini, S.A.; Baneshi, M.M.; Yari, A.R.; Vosoughi, M.; Dobaradaran, S.; Shirali, S.; Marzooni, M.B.; et al. An evaluation of hospital admission respiratory disease attributed to sulfur dioxide ambient concentration in Ahvaz from 2011 through 2013. Environ. Sci. Pollut. Res. 2016, 23, 22001–22007. [Google Scholar] [CrossRef] [Green Version]
- de Gouw, J.A.; Parrish, D.D.; Frost, G.J.; Trainer, M. Reduced emissions of CO2, NOx, and SO2 from U.S. power plants owing to switch from coalto natural gas with combined cycle technology. Earth’s Future 2014, 2, 75–82. [Google Scholar] [CrossRef]
- He, H.; Vinnikov, K.Y.; Li, C.; Krotkov, N.A.; Jongeward, A.R.; Li, Z.; Stehr, J.W.; Hains, J.C.; Dickerson, R.R. Response of SO2 and particulate air pollution to local and regional emission controls: A case study in Maryland. Earth’s Future 2016, 4, 94–109. [Google Scholar] [CrossRef]
- Luo, J.; Angelina, I.H.; He, Q. Research on the decomposition of the economic impact factors of air pollution in Hubei province in China. In Proceedings of the 2nd International Conference on Education, Management and Information Technology, Jinan, China, 10–11 October 2015. [Google Scholar]
- Azimi, M.; Feng, F.; Yang, Y. Air Pollution Inequality and Its Sources in SO2 and NOX Emissions among Chinese Provinces from 2006 to 2015. Sustainability 2018, 10, 367. [Google Scholar] [CrossRef] [Green Version]

Publisher’s Note: MDPI stays neutral with regard to jurisdictional claims in published maps and institutional affiliations. |
© 2022 by the authors. Licensee MDPI, Basel, Switzerland. This article is an open access article distributed under the terms and conditions of the Creative Commons Attribution (CC BY) license (https://creativecommons.org/licenses/by/4.0/).