4.1. Weather Maps of Two Types
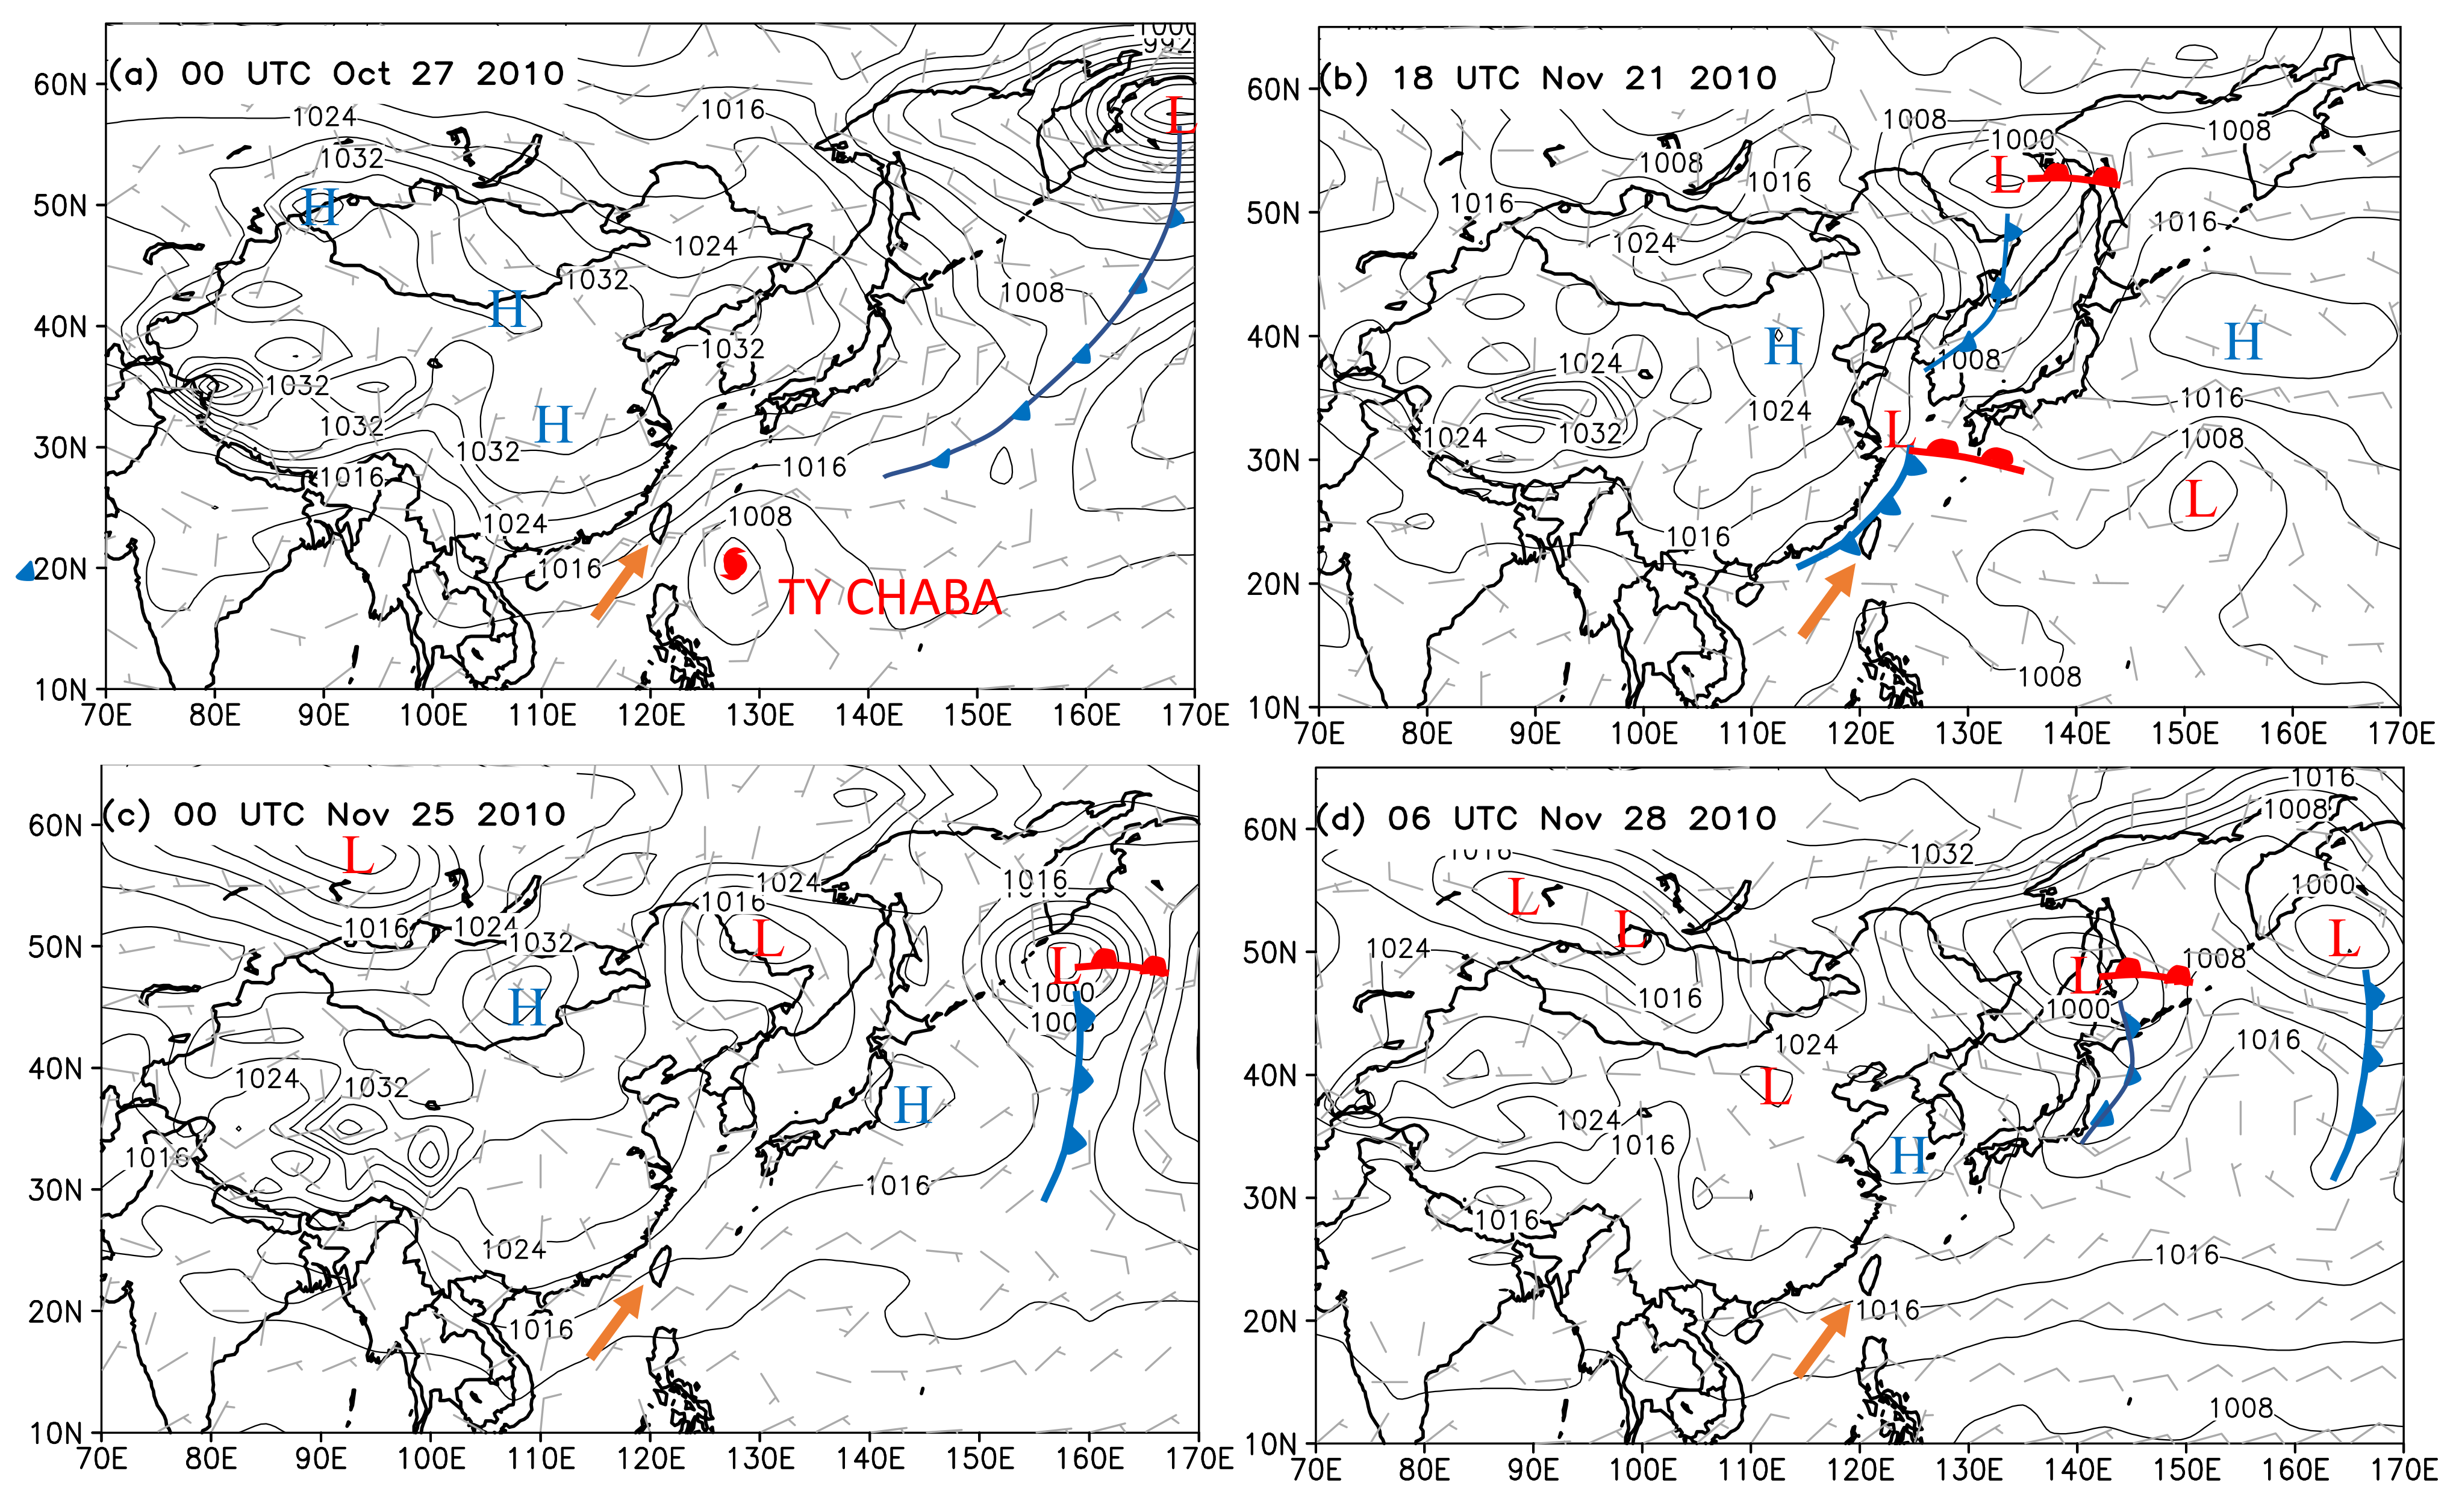
Figure 4 shows the weather maps of the first events of the typhoon and non-typhoon types, in which the latter is further classified into ahead of front, ahead of anticyclone, and behind anticyclone. In
Figure 4a, the first typhoon type was observed on 27 October 2010 (also see
Table 1). In this event, Typhoon Chaba approached Taiwan from near the equator, and later turned northeast to the Japanese coast without passing through Taiwan. On the other hand, a strong anticyclonic circulation occupied China on the same day, and there was an intensive pressure gradient in the coastal areas of China. Due to this strong pressure gradient, strong northeasterly winds prevailed in Taiwan. The approach of the cyclonic circulation of the typhoon accelerated the strong northeasterlies, resulting in the rising of the riverbed sands and dust particles, and has led to the daily PM
10 exceedance over the Daan/Dajia and Zhuoshui Rivers (
Table 1). Although typhoons are warm and humid cyclones, and often produce rainfall, Typhoon Chaba was far away from Taiwan, so less than 1 mm of precipitation was observed in southeastern Taiwan, and no precipitation was observed in the riverbed area of Central Taiwan.
For the non-typhoon type,
Figure 4b–d show the weather map of the first consecutive event from 20 November to 30 November 2010. The event includes weather conditions such as Taiwan’s location ahead of the surface front (
Figure 4b), ahead of the anticyclonic system (
Figure 4c), and behind the anticyclonic system (
Figure 4d). This event caused the daily averaged PM
10 values of the Zhuoshui River to exceed the standard for two days (22/11/2010 and 28/11/2010 in
Table 1).
Figure 4b shows the ahead of the front type of weather on 21 November 2010. In this type, a surface front was located on the southeast coast of China, which was about to pass through Taiwan.
After the passage of the surface front, Taiwan was under northeasterly winds ahead of the anticyclonic system.
Figure 4c shows the weather map of this type on 25 November 2010. The northeasterly wind lasted for several days until the anticyclonic center moved off the coastal areas of China.
Figure 4d shows that after the anticyclonic center passed through areas to the north of Taiwan on 28 November 2010, most areas of Taiwan were dominated by weak easterly winds.
4.2. Hourly Data of Two Types
Figure 5 and
Figure 6 plot PM
10 concentration and meteorological data of all riverbeds for the typhoon and non-typhoon types discussed in
Figure 4.
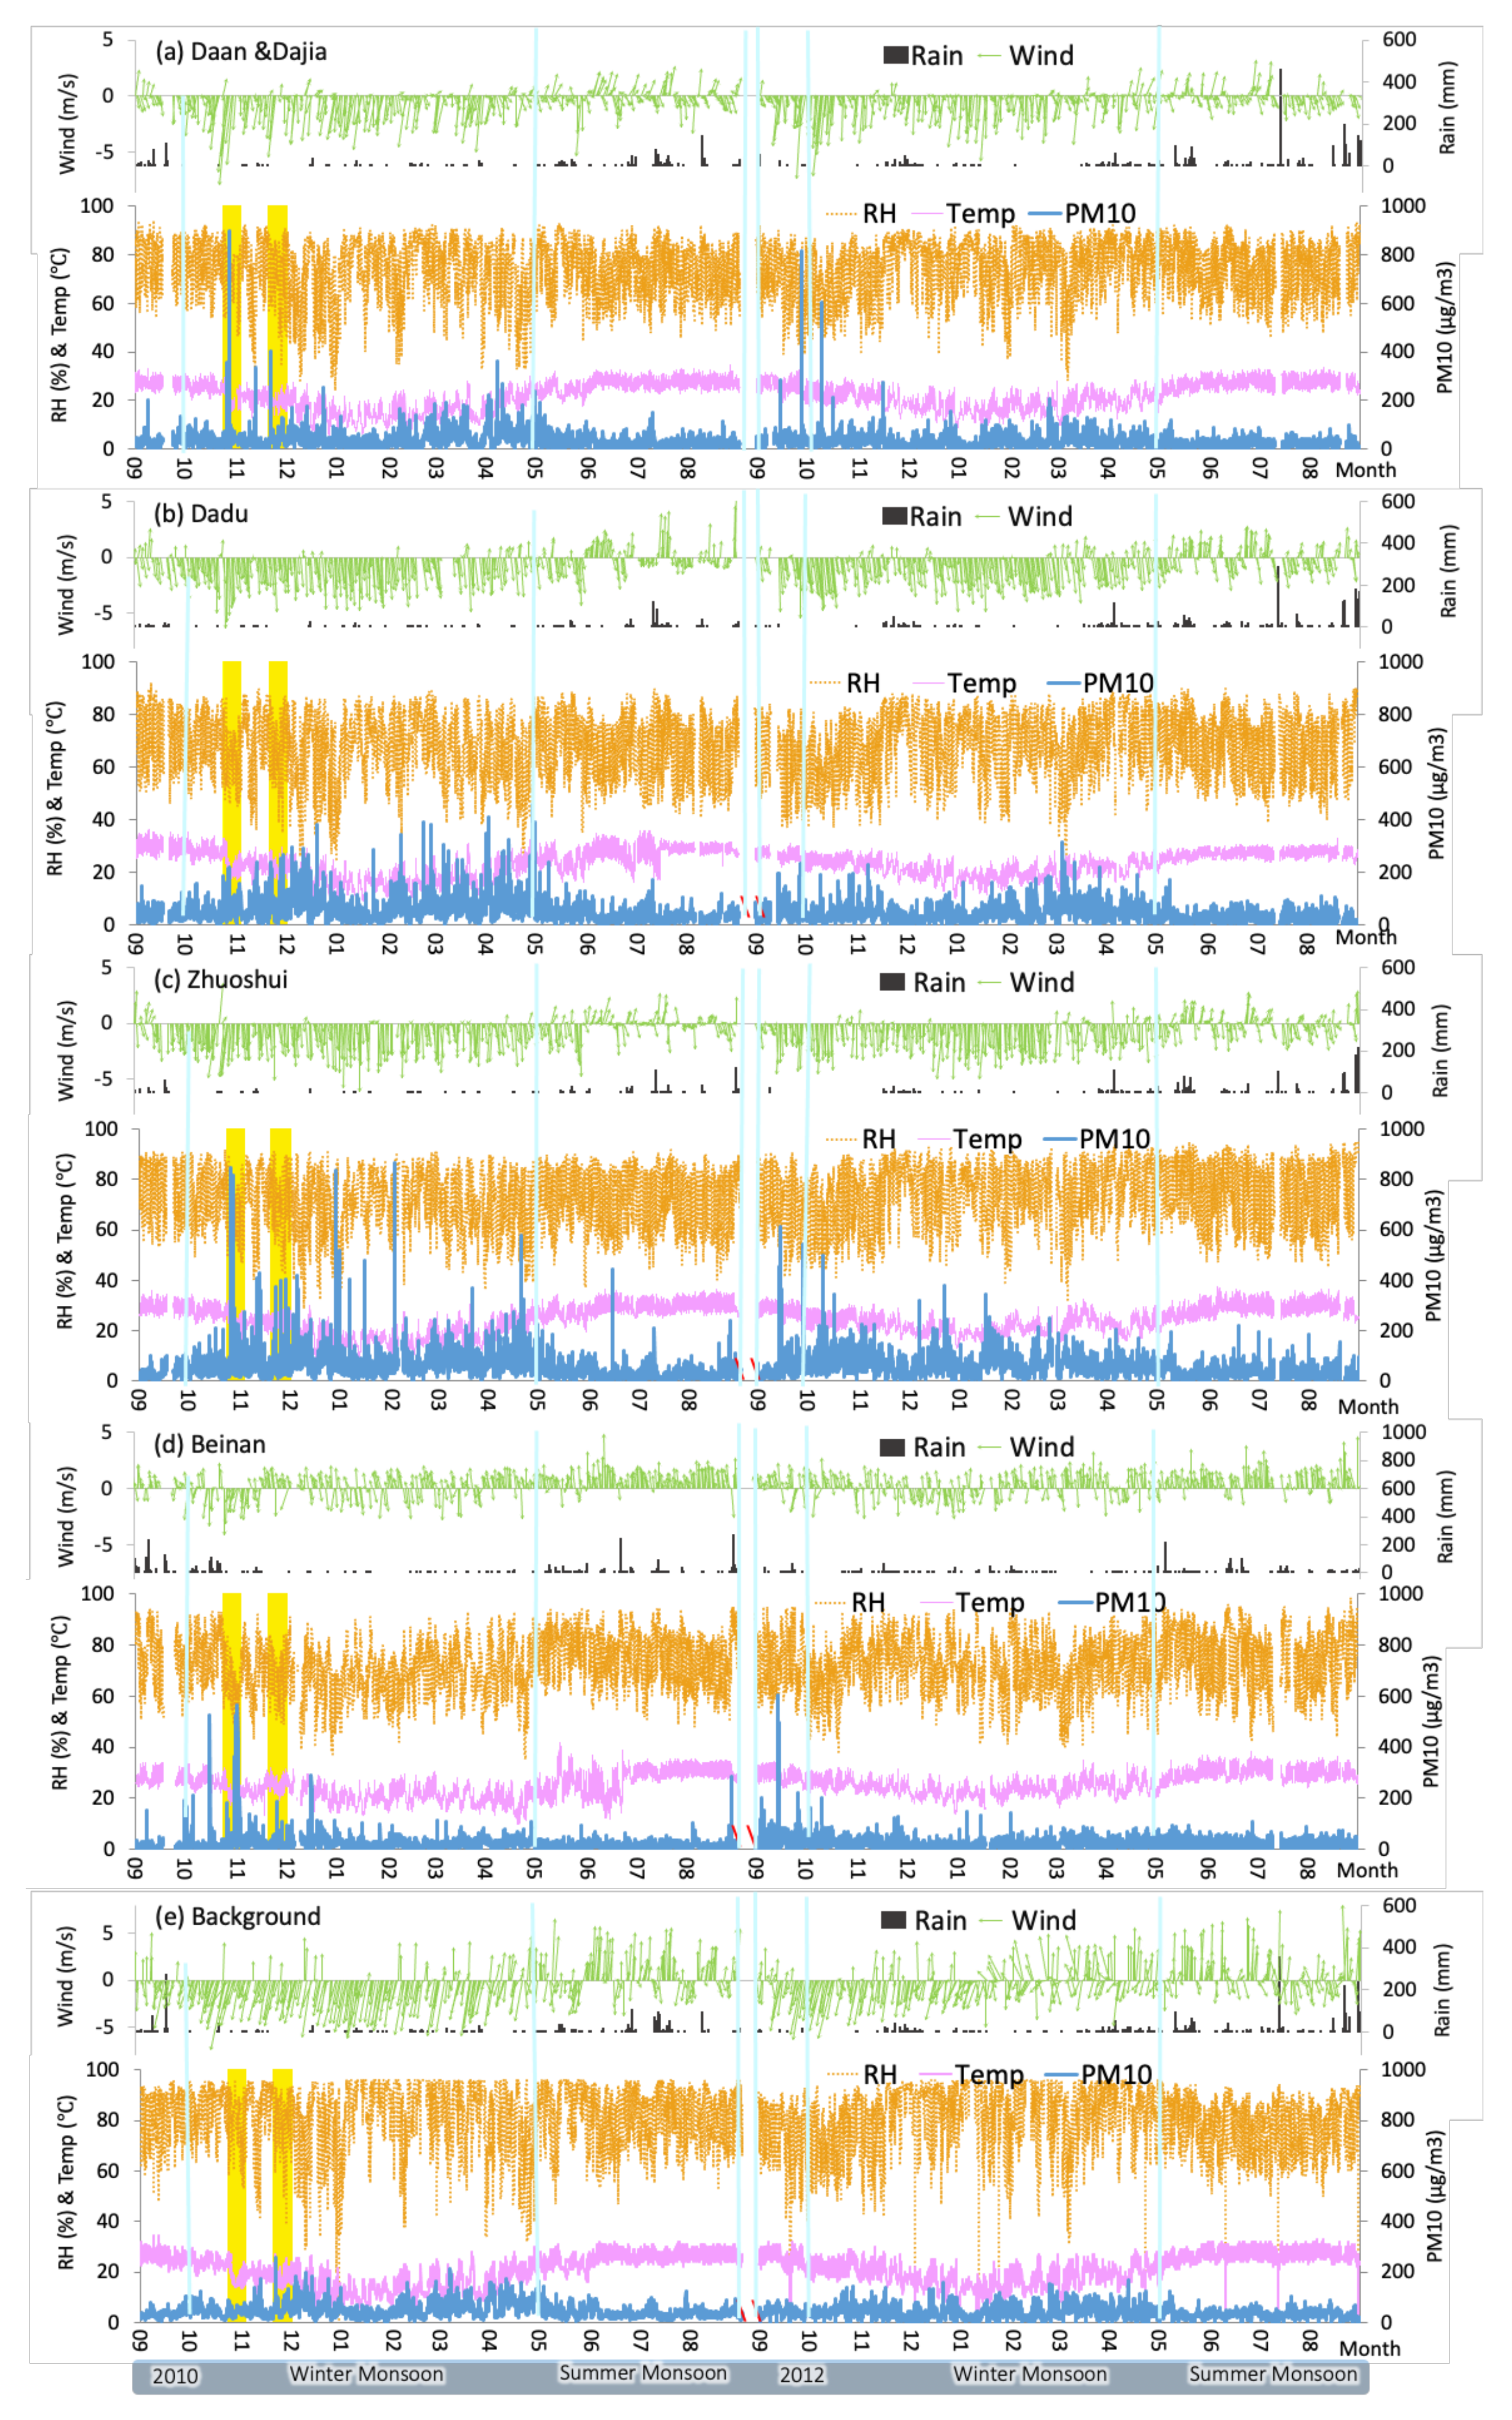
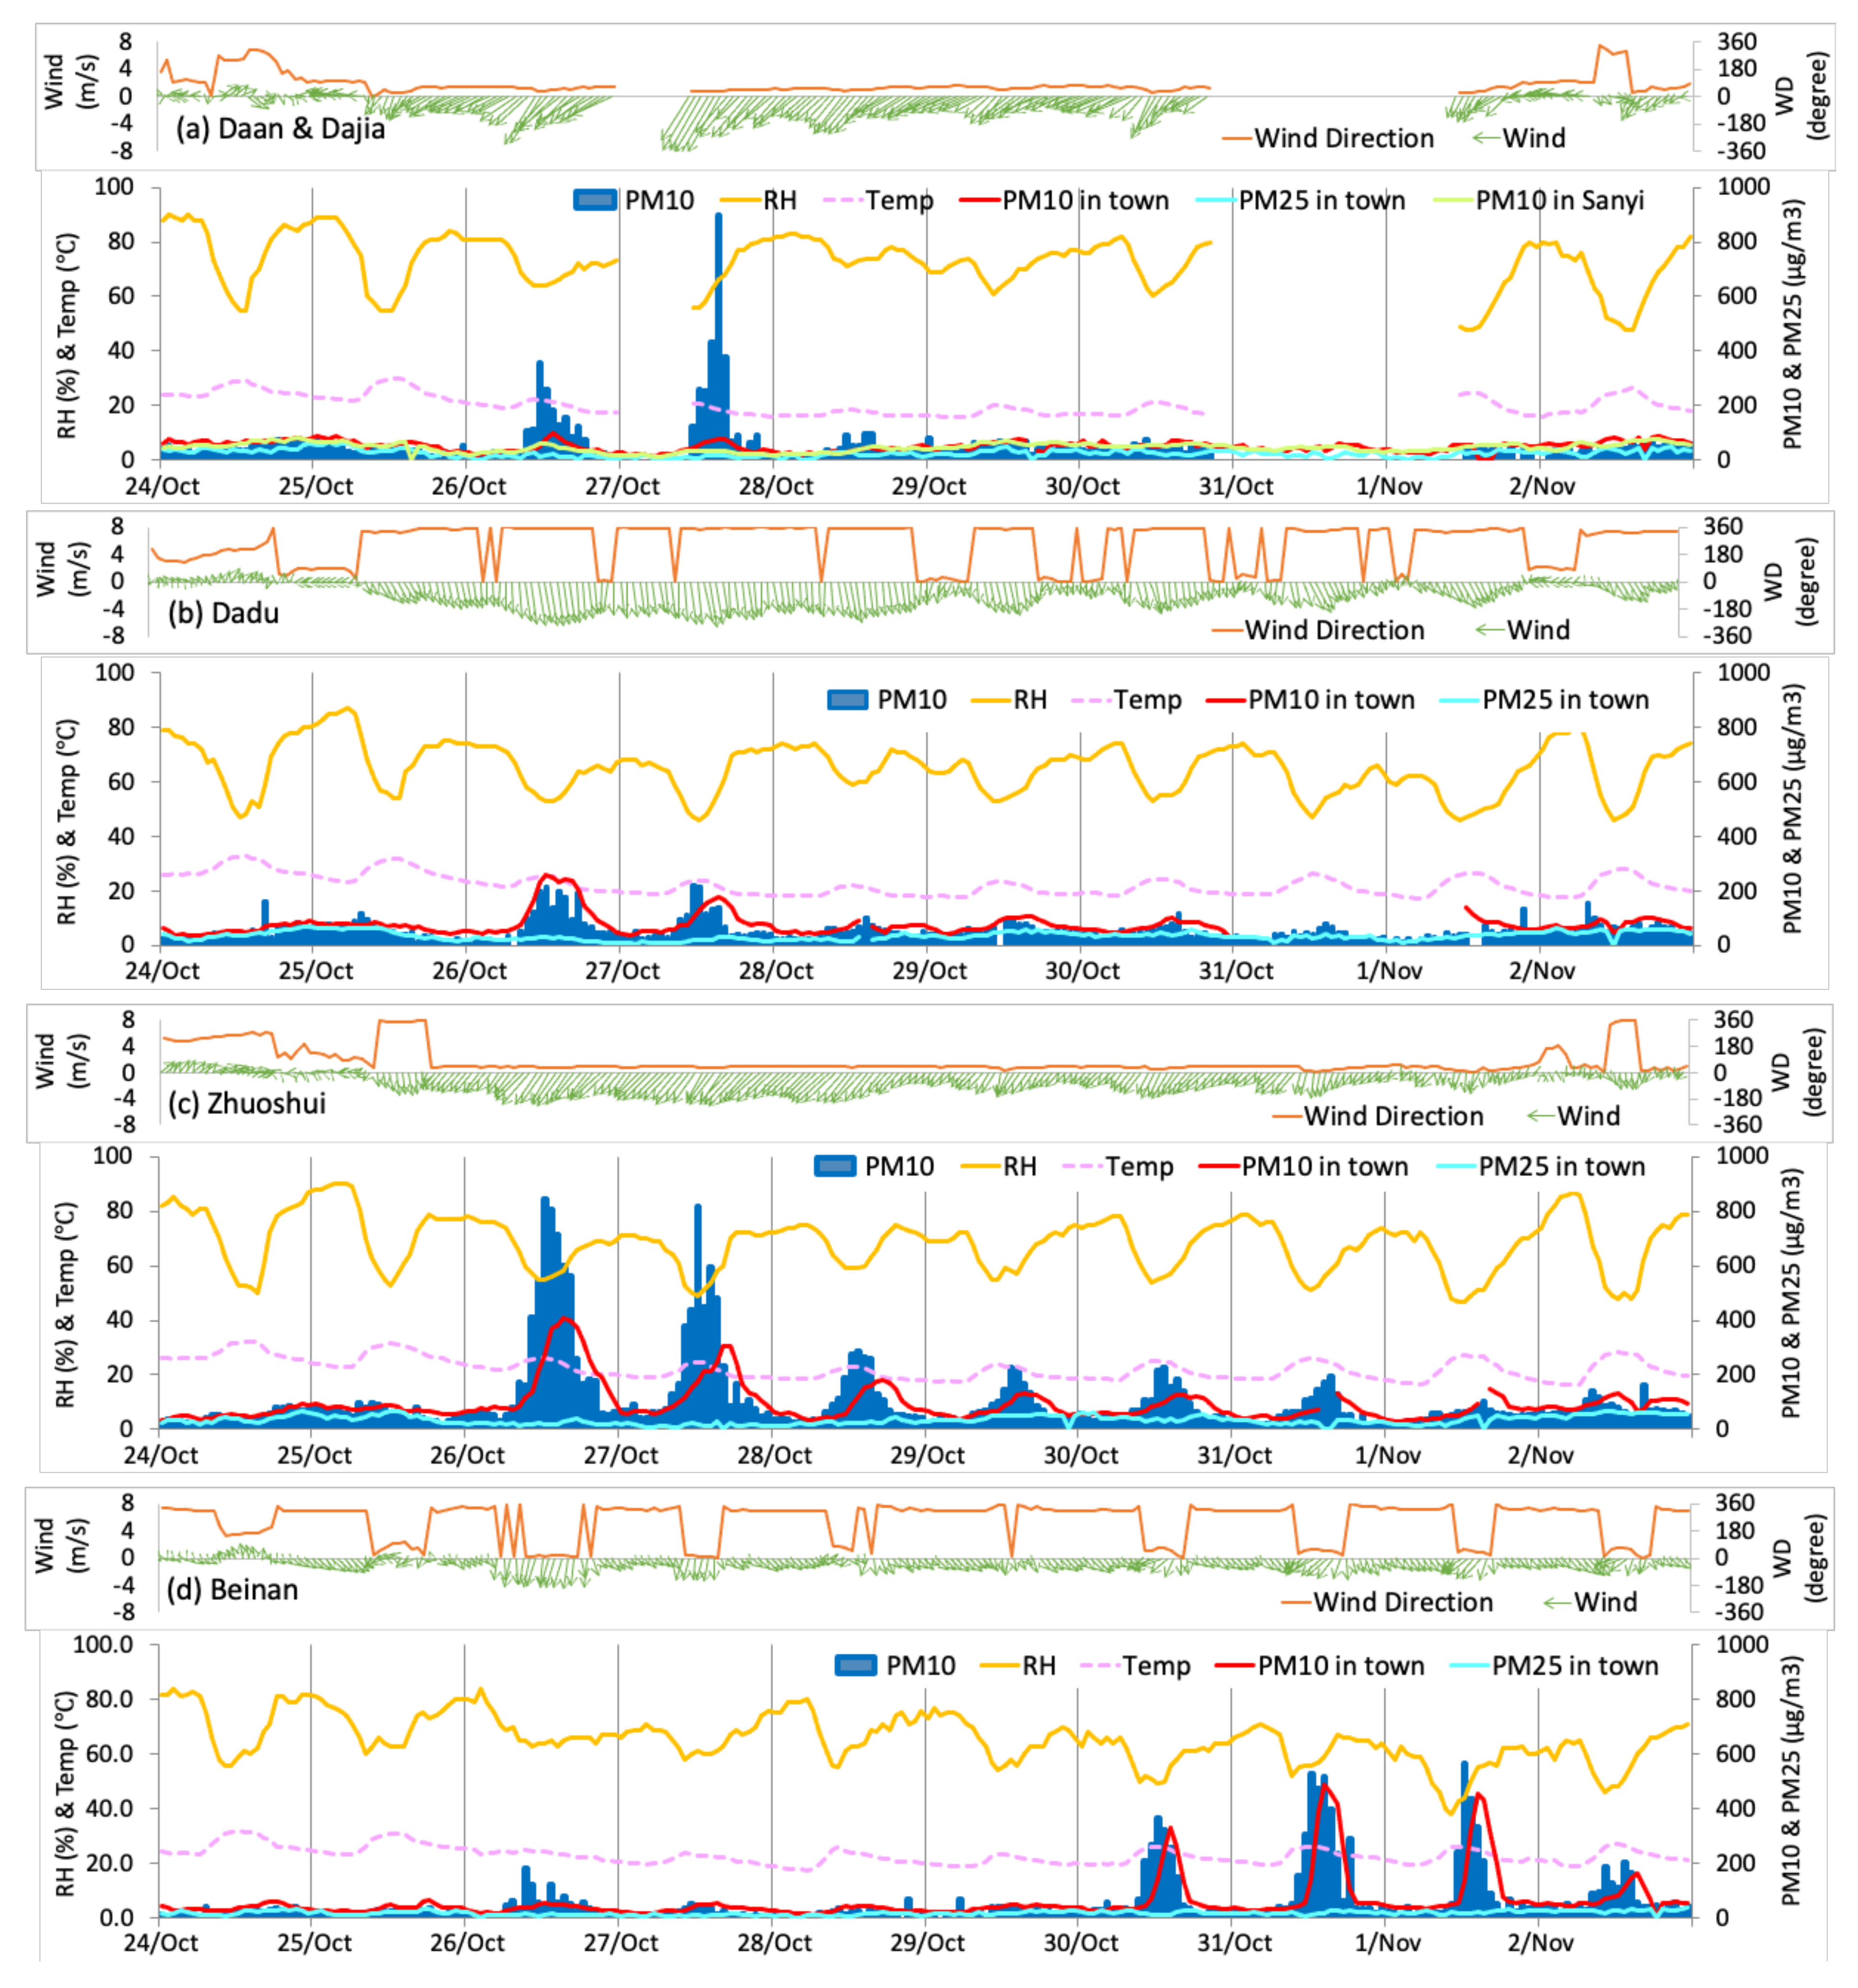
Figure 5 shows the typhoon type data from 24 October to 2 November 2010. In this type, Typhoon Chaba approached Taiwan from 26 to 27 October. Before the arrival of the typhoon on 24 October, land breezes (easterlies on the western coast) were observed in most riverbeds from the evening to early morning, and then sea breezes (westerlies on the western coast) during the day (
Figure 5). The land–sea breeze is in the reverse wind direction in the Beinan River over the southeastern coast of Taiwan.
Followed by the local land–sea breeze on early 25 October, the northeasterlies ahead of the surface anticyclonic system started to affect the coastal areas of East Asia. From 26 to 27 October, the northeasterlies reached their maximum surface wind speed due to the approach of the typhoon. The maximum surface wind speed observed at the Daan/Dajia Rivers was close to 10 m s
−1, while at other sites in Central Taiwan it remained at 7 m s
−1, and at the Beinan River in southeastern Taiwan it decreased to 5 m s
−1. Under the extremely high wind speeds, all riverbed stations observed an increase in PM
10 concentration (
Figure 5). On 26 and 27 October, the hourly maximum of PM
10 was around 350 and 900 µg m
−3 at the Daan/Dajia Rivers, respectively, while at the Zhuoshui River, it exceeded 800 µg m
−3 on both days (also see
Figure 2). The PM
10 concentration of the Dadu and Beinan Rivers is lower, but the maximum hourly value is also about 200 µg m
−3. In addition, the hourly PM
10 concentrations at the Sanyi background station in Central Taiwan during the entire event was less than 70 µg m
−3 (
Figure 5a), indicating the impacts of long-range transport of aerosol from the Asian continent were small. Also, note that although the prevailing wind was strong throughout the day, the riverbed dust concentration was only enhanced during the day and reached its peak at noon time, when the temperature was warmer and relative humidity of all the rivers decreased to less than 60%, indicating these conditions are conducive to riverbed dust generation.
Among all the rivers, the Zhuoshui River has more obvious riverbed dust enhancement than other rivers (
Figure 5c). Except for the extremely high PM
10 concentration on 26 and 27 October, PM
10 concentration exceeding 200 µg m
−3 continued for several days in the river until 31 October. The maximum hourly wind speed observed on the Zhuoshui River during the event (7 m s
−1) was lower than the wind speed observed on the Daan/Dajia Rivers (10 m s
−1), and was roughly the same as the wind speed observed on the Dadu River. In addition, the temperature (23–24 °C) and relative humidity (49–58%) at the peak PM
10 concentration from 27 to 31 October are similar to those of the Dadu River (21–25 °C, 46–60%). However, the maximum concentration of PM
10 in the Zhuoshui River was more than 800 µg m
−3 and PM
10 enhancement lasted for a few days, while the concentration in the Dadu River reached 200 µg m
−3 only in the first two days. This suggests that in addition to meteorological conditions, different riverbed characteristics are critical to riverbed dust generation.
After the typhoon, the PM
10 concentrations of most rivers decreased, but the opposite occurred in the Beinan River (
Figure 5d). From 30 October to 2 November 2010, high PM
10 concentrations were observed in the Beinan River at noon time, and the maximum concentration exceeded 500 µg m
−3. The wind speed on these days only reached around 4 m s
−1, and was less than the peak wind speed (close to 5 m s
−1) during the typhoon period. However, the Beinan River is located on the southeastern coast of Taiwan, directly facing the warm and humid air brought by the typhoon’s peripheral circulation, which suppressed the uplifting of dust particles from riverbeds. After the typhoon left, the northeast monsoon followed and the relative humidity decreased to a minimum below 40%. Thus, the riverbed dust particles were uplifted under windy and dry conditions, showing the importance of humidity as a factor. In addition,
Figure 5d shows that the PM
10 concentration in the town near the riverbed increased during this period. Similarly, the PM
10 concentrations in towns near other riverbeds also increased during the typhoon period (
Figure 5). Since the concentration of PM
2.5 in towns and PM
10 in the background Sanyi station were both low during the event, indicating low local pollution or foreign dust concentrations. The high PM
10 concentration in towns suggests that the coarse particles from riverbeds have affected those nearby towns.
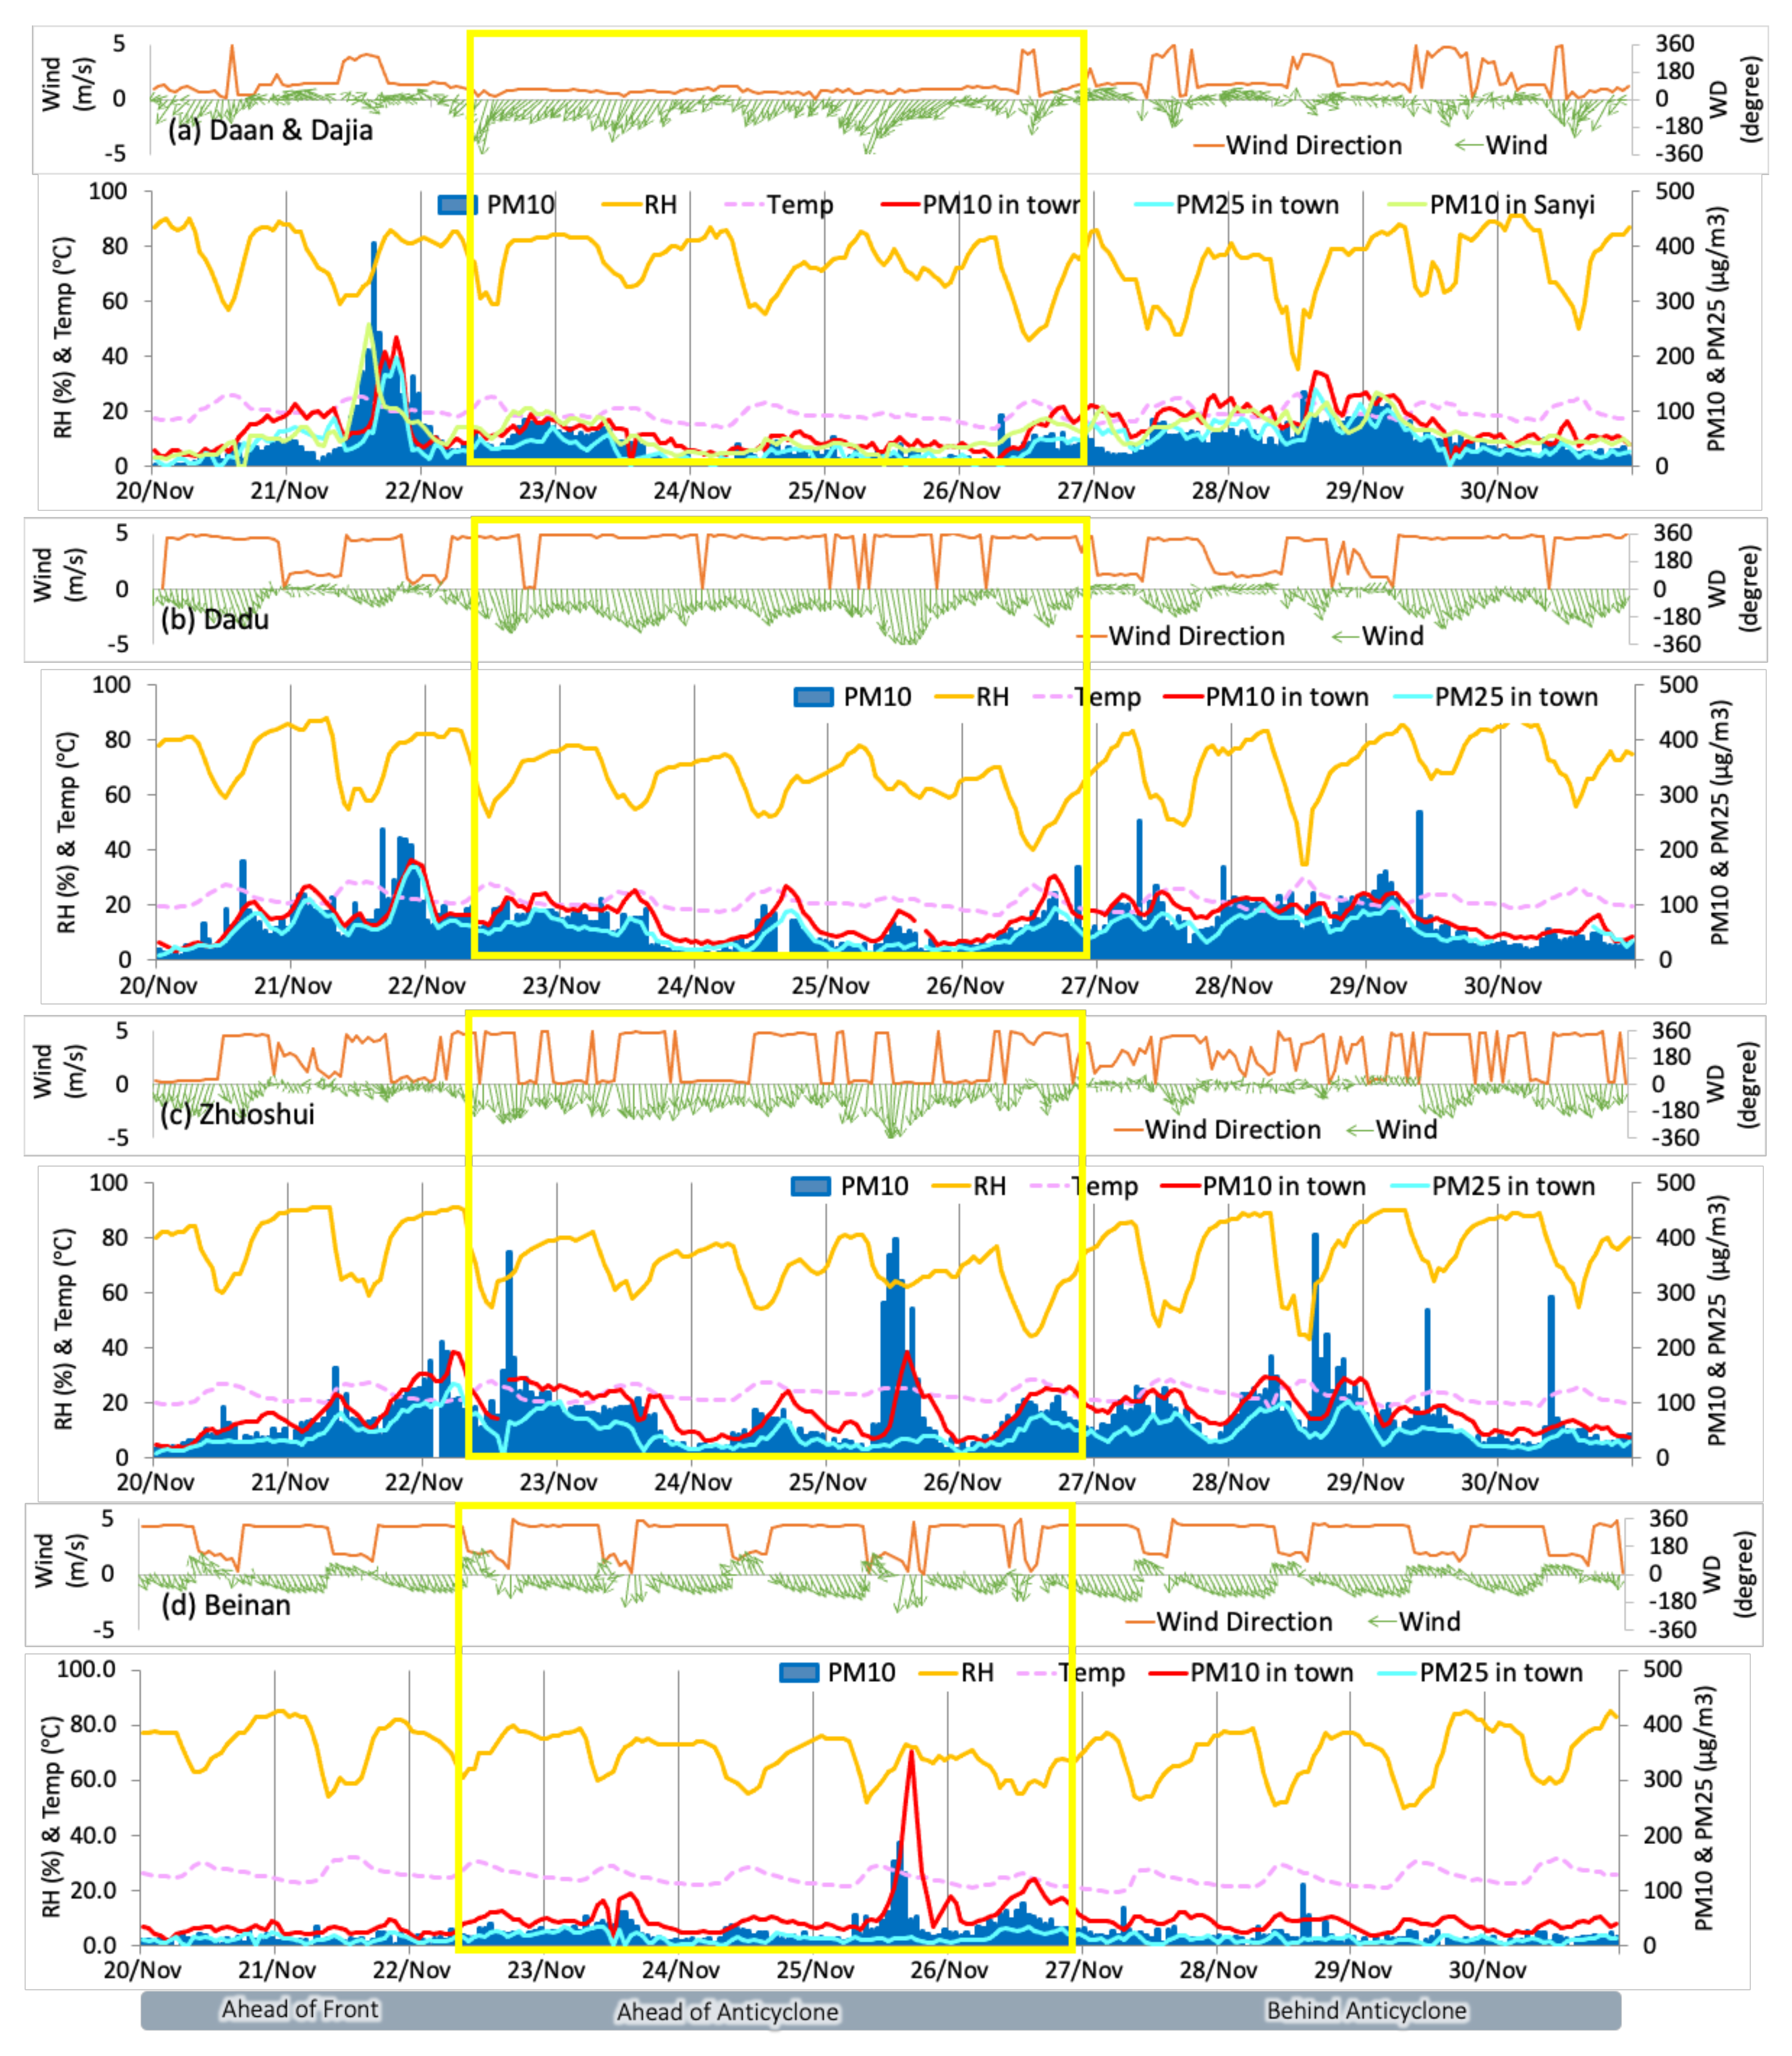
The second selected weather type is without typhoon, which occurred from 20 November to 30 November 2010, and
Figure 6 shows the observed data of this type. In this type, three meteorological stages were observed, including ahead of a surface front, ahead of an anticyclonic system, and behind an anticyclonic system. At the beginning of this type on 21 November, a surface front was approaching Taiwan (
Figure 4b). At this time, the wind speed was low and the atmosphere was stable. In addition, due to the approach of the cyclonic circulation of the low-pressure system, southwesterly winds were easily seen in some areas of Western Taiwan [
36], causing the pollutants to accumulate over the marginal sea and northwestern Taiwan (
Figure S1). In the riverbed area of Central Taiwan, the sea breeze from the northwest prevailed at noon time, bringing pollutants into the riverbed areas (
Figure 6a–c). Under the northwesterly wind, high PM
10 concentration was observed over the Daan/Dajia Rivers, with the maximum value exceeding 400 µg m
−3 (
Figure 6a). Since concentrations of PM
10 in the Sanyi background station and the PM
2.5 in riverside towns were both about 200 µg m
−3 at the same time, it suggests that other than the riverbed dust raised by the wind speed, the pollutants carried by the westerly wind affected the riverbeds of the Daan/Dajia Rivers and surrounding areas. The PM
10 concentration of other rivers in Central Taiwan also increased, but the time was slightly delayed from north to south (
Figure 6b,c).
After the frontal passage on early 22 November, the northeast monsoon prevailed ahead of the anticyclonic system. On 25 November, another anticyclonic system with a strong pressure gradient affected Taiwan and once again triggered strong northeasterly winds.
Figure 6 shows that the Daan/Dajia Rivers were affected by wind speeds close to 6 m s
−1 and 7 m s
−1 at noon time on 22 and 25 November, respectively. On the same days, the Dadu and Zhuoshui Rivers exceeded 4 m s
−1 and 5 m s
−1, respectively, while the Beinan River was about 3 m s
−1 on both days. The wind direction was northeasterly in the Daan/Dajia Rivers, the same as in the typhoon type, but turned into northerly or northwesterly in the Dadu and Zhuoshui Rivers due to the eastward movement of the anticyclone and its interaction with the terrain. The northwesterly wind was seen in the Beinan River, but unlike the rivers in Central Taiwan, the local sea breeze from the south also prevailed during the daytime (
Figure 6d). However, although the humidity of all rivers is approximately the same, only a significant increase in PM
10 was observed on the Zhuoshui and Beinan Rivers. At noon time on 22 and 25 November, the hourly PM
10 peak value of the Zhuoshui River reached about 400 µg m
−3 (
Figure 6c). During these stages, the PM
2.5 and PM
10 concentrations were not high in the riverside town and background Sanyi station, suggesting that the high value of suspended particles was mainly from riverbed dust. Similarly, on 25 November, PM
10 concentration close to 200 µg m
−3 was also observed on the Beinan River when the northeasterly wind prevailed (
Figure 6d). Interestingly, the PM
10 concentration in the riverside town reached 350 µg m
−3, much higher than observed over the riverbed. Although the PM
10 concentration in the Sanyi background station in Central Taiwan is low (less than 42 µg m
−3), according to the EPA background station over the northeastern tip of Taiwan (Wanli Station), the maximum hourly PM
10 concentration observed on that day was close to 140 µg m
−3. Therefore, in addition to the dust generated from the riverbed, the PM
10 in the riverside town of Beinan River may be partially affected by the long-range transport of coarse particles (such as Asian dust) due to its location over the southeastern coast and directly facing the northeasterly wind.
Late on 26 November, the center of the anticyclonic system left the coastal areas of China and passed over the marginal sea to the north of Taiwan (
Figure 4d). Meteorological conditions had shifted to the stage of the behind anticyclonic system. The prevailing wind changed from northeasterly to easterly winds over northern Taiwan, and the wind speed also weakened (
Figure 4d). At this stage, most of the riverbed areas were heavy polluted and the PM
2.5 concentrations were high (
Figure 6). At the same time, the PM
10 at the Sanyi background station also reached more than 100 µg m
−3, suggesting a high concentration of particles imported from abroad. In addition to the long-range transport, there were also a few cases of high dust concentration in riverbeds during the daytime. For example, at noon on 28 November, an hourly PM
10 of 400 µg m
−3 was observed over the Zhuoshui River. At the same time, the relative humidity was extremely low, reaching a minimum of around 40%, and was favorable for riverbed emission under a maximum wind speed of 3.5 m s
−1. At night, high concentrations of PM
10 were also observed, especially in the Dadu River (
Figure 6b). The land breeze from the east suggests that the high concentration of the river is related to the pollution of the main city in Central Taiwan (Taichung), which is located 10 km to the east of the river.
4.3. Summary of Two Types
Table 2 summarizes the times, peak PM
10 concentrations, and the corresponding meteorological conditions at the peak concentration for each weather type in
Table 1. There are 6–11 cases for each type. One case in
Table 2 represents one day listed in
Table 1. In
Table 2, September and October are the months in which the typhoon type cases occurred (also see
Table 1). Because there are more typhoon cases observed in October in the Zhuoshui River, they are listed as the main month and river in
Table 2. The result in
Table 2 explains that in
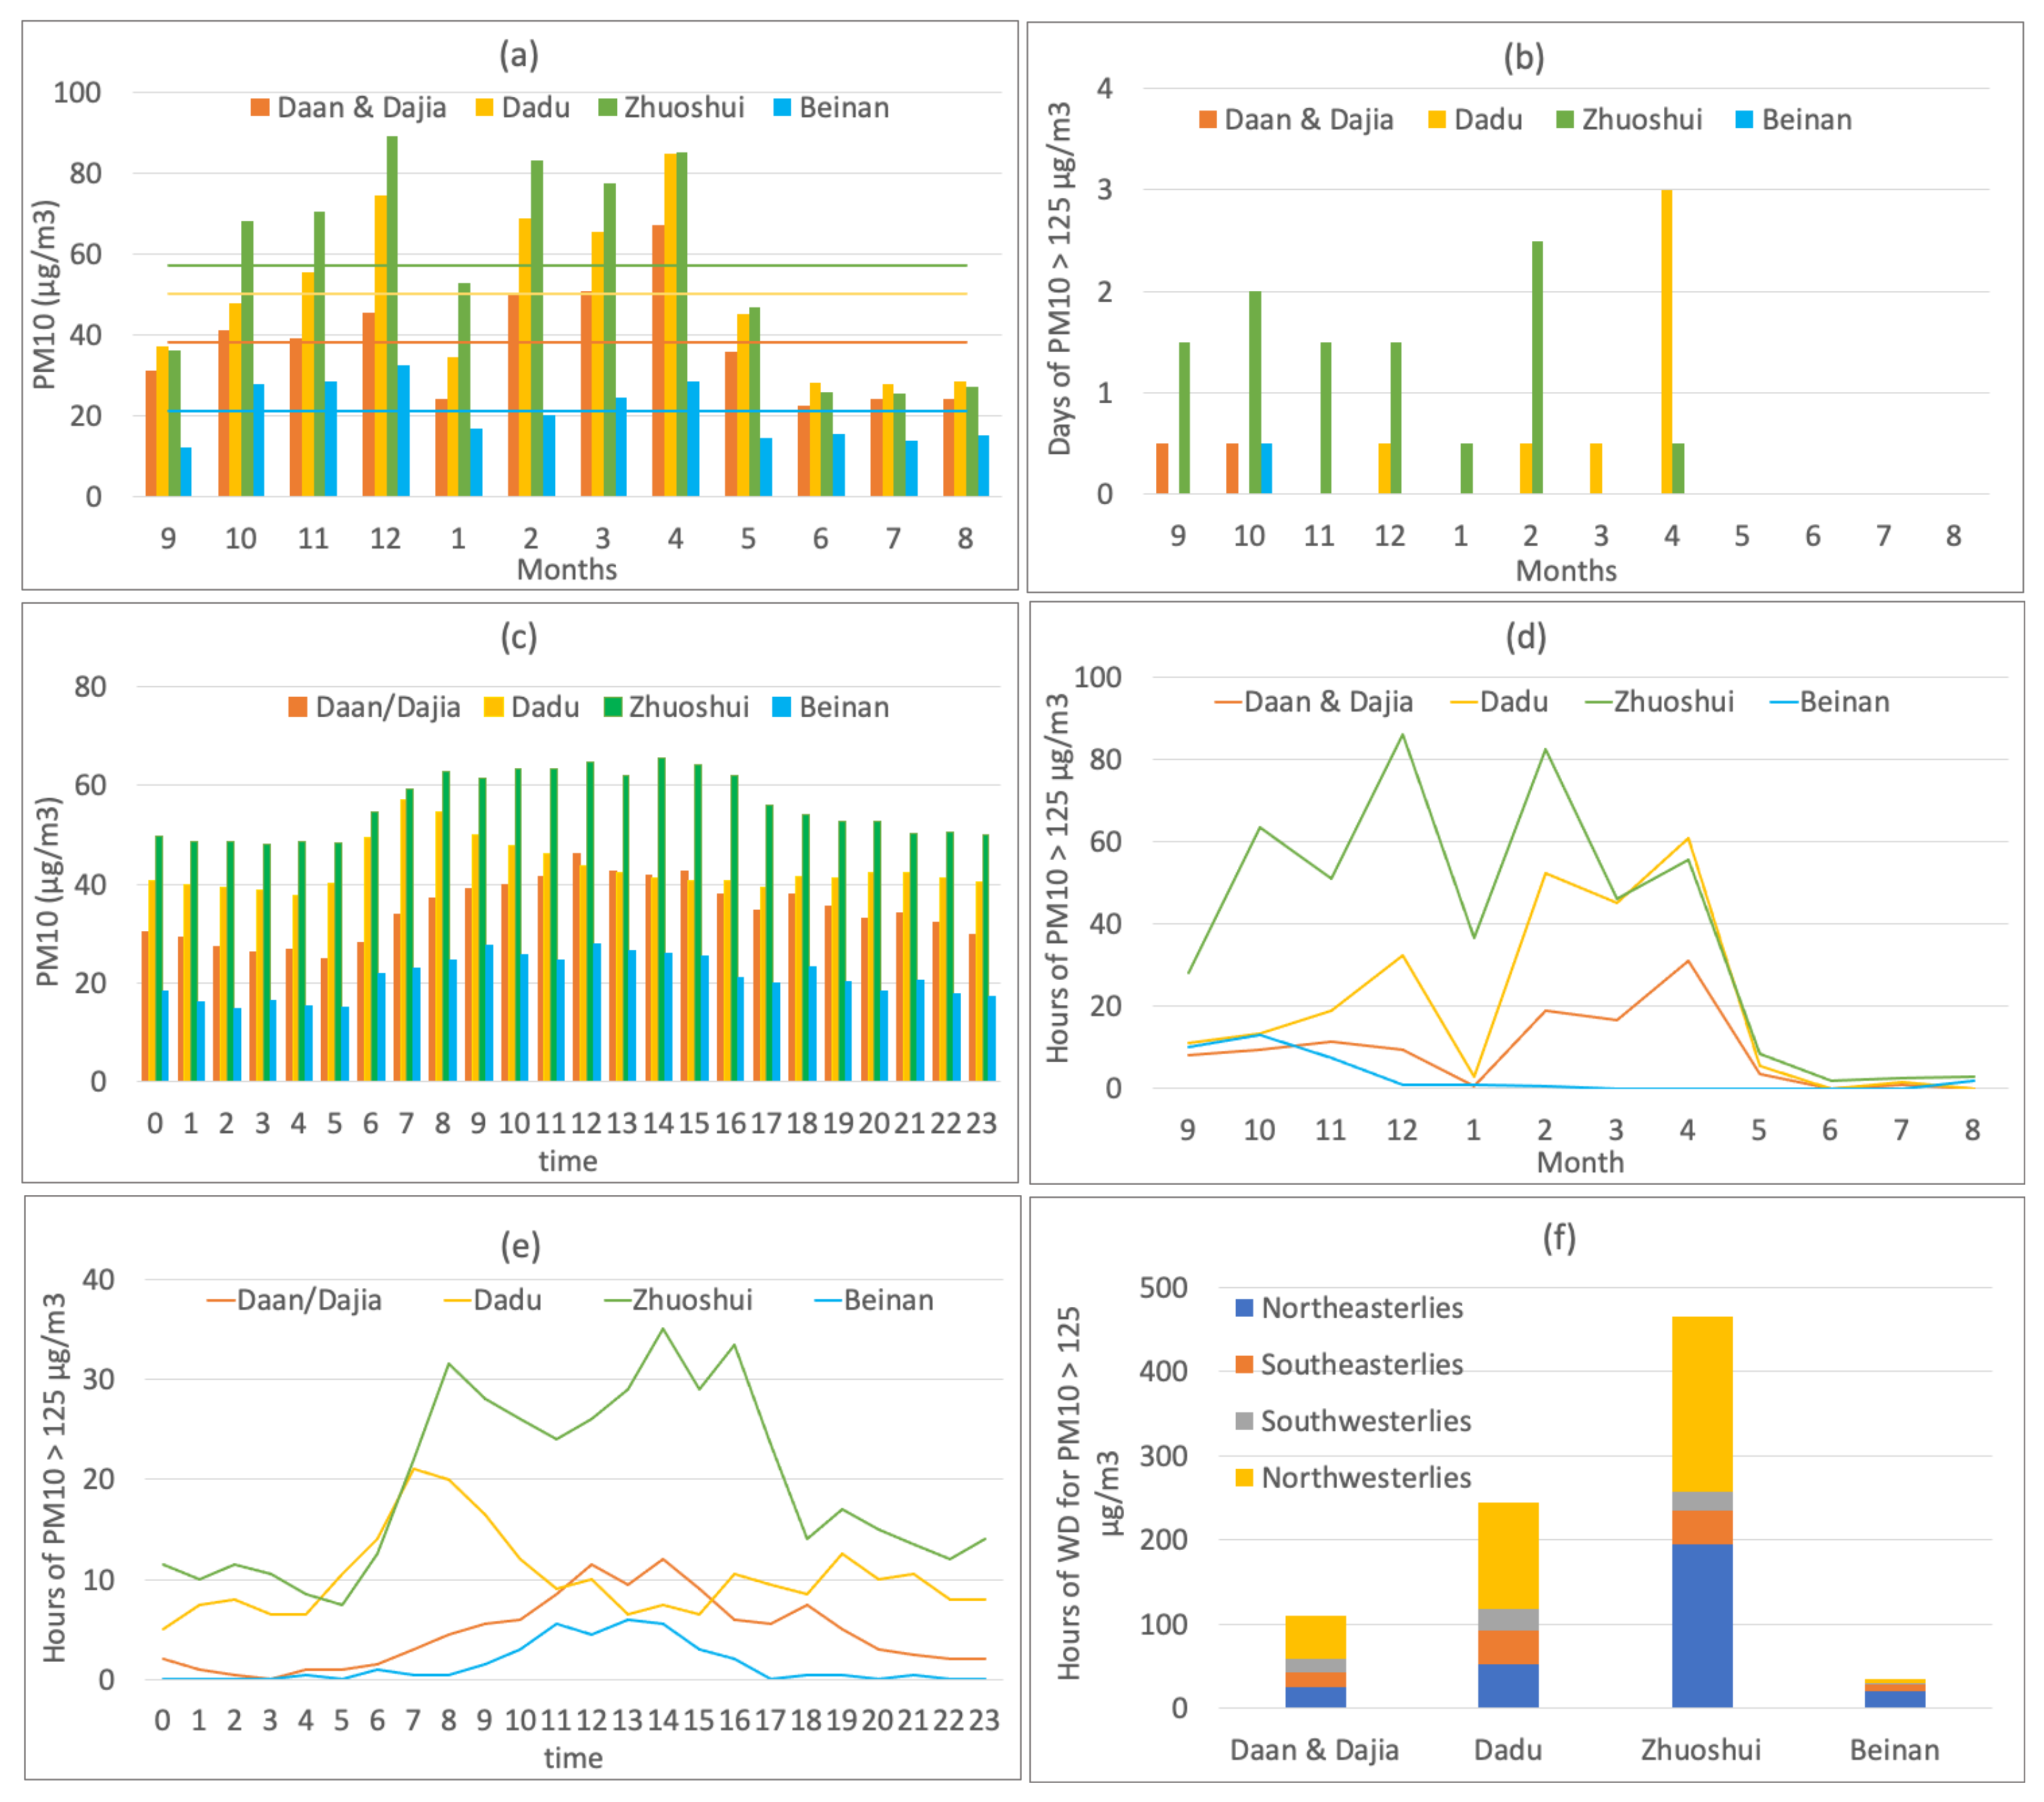
Figure 3d, the higher PM
10 exceedance hours observed in October, especially in the Zhuoshui River, resulted from typhoons. In the non-typhoon type in
Table 2, the riverbed events in ahead of front, ahead of anticyclone, and behind anticyclone stages were mainly observed in April, December, and both February and April, respectively. Riverbed events in these weather stages were mainly observed in the Zhuoshui and Dadu Rivers.
In addition,
Table 2 shows the time of peak PM
10 concentration for each type. We roughly classified the time of day as morning (06:00–09:00 local time), noon time (10:00–15:00 local time), afternoon (16:00–17:00), and night (18:00–05:00). Although more peak concentrations of riverbed events were observed at noon time from 11:00 to 15:00, peak concentrations were also observed in the morning in the typhoon type. For example, on the Daan/Dajia and Zhuoshui Rivers, a typhoon type on 28 September 2012 was observed at 8:00–9:00 a.m. The occurrence time of the typhoon type is similar to that in the ahead of anticyclone stage, except that the peak time of the ahead of anticyclone stage appears to be more extended, and was observed from 09:00 to 15:00 during the day. These two types also explain that the high concentrations of PM
10 in
Figure 3e appeared at noon time and a few in the morning. Different from these two types, in the ahead of front stage, peak PM
10 concentration appeared throughout the day, while in the behind anticyclone stage, peak PM
10 concentration was only observed in the morning and at night. Thus, the peak PM
10 concentrations in these two stages resulted from different mechanisms.
Table 2 also lists the average concentration of the peak PM
10 in the riverbed, peak PM
2.5 of the riverside town, and peak PM
10 concentration of the day at the Sanyi background station for each weather type. Among them, the peak PM
10 concentration in the riverbed caused by the typhoon types exceeded 600 µg m
−3 on average, which is the highest concentration of all types. The ahead of anticyclone stage of the non-typhoon type exceeding 400 µg m
−3 is the second highest concentration. In addition, the PM
2.5 concentration of these two types is low, with an average of 37 to 64 µg m
−3, respectively, indicating that the concentration of pollutants from either local areas or imported is low. Furthermore, during these two types of events, the highest concentration of PM
10 at the Sanyi background station in Central Taiwan is about 60 µg m
−3, implying that the contribution from Asian dust was low. Therefore, the high riverbed PM
10 concentrations of these two types is mainly caused by the riverbed dust generation. On the contrary, the PM
10 in the ahead of front and behind anticyclone stages in the non-typhoon types are both around 300 µg m
−3 on average, but their PM
2.5 concentration is higher, both being about 130 µg m
−3, indicating that part of the riverbed aerosol may come from pollution rather than riverbed emission. Also, the background PM
10 concentration at Sanyi is close to 150 µg m
−3 on average, indicating that the pollution from the Asian continent contributes a lot during these two weather stages.
The influence of the surface wind speed and wind direction on riverbed dust generation is also shown in
Table 2. At the peak PM
10 concentrations of the typhoon type, the surface wind speeds reach an average value of 6.5 m s
−1, while more than 5 m s
−1 in the ahead of anticyclone stage, and thus high wind speed is critical for riverbed dust generation. In the typhoon type, the wind directions are mostly northeasterly winds, but in the ahead of anticyclone type, only half of the wind directions are northeasterly winds, and the other half are northwesterly winds. Similarly, Tsai et al. [
36] also reported that after a frontal passage over Taiwan, the wind direction changes from northwesterly to northeasterly in Northern Taiwan. In contrast to these two types, the averaged wind speeds in the stages of ahead of front and behind anticyclone are lower, with only 1 m s
−1 of average wind speed. In addition, the wind directions of these two types are more diversified, and northeasterlies, northwesterlies, and southeasterlies were all observed in both types at the peak PM
10 concentrations. Among them, northwesterly is the main wind direction in the ahead of front stage of the non-typhoon type. As discussed in the case study, most of it is related to the sea breeze during the day and the cyclonic circulation, and the wind direction may carry pollutants to the riverbeds. The southeasterlies in the two stages are mostly observed in the Dadu River. As discussed in
Section 4.2, the main city in Central Taiwan is located to the east of the river, and the land breeze can carry pollutants to affect the concentration of the river. Northeasterly is the main wind direction for the behind anticyclone stage. The high concentrations of PM
2.5 at the riverside town and PM
10 at the background station show that the riverbed is affected by local pollution and foreign aerosol at this time. This is because during the winter monsoon, northeasterly winds can bring pollution from Asia, resulting in high background pollution in Taiwan. Liu et al. [
23] and Hung et al. [
26] also showed that due to the long-range transport of dust or pollutant from the Asian continent, the averaged background concentration of PM
10 in Northern Taiwan can be as high as 100 µg m
−3 during the event, and April is the month with the highest background concentration. Our results are consistent with those studies.
The average temperature and relative humidity in
Table 2 also give an explanation for the high PM
10 concentration in the riverbeds. The typhoon type has the highest average temperature (25 °C), and the weather is usually warm and humid. However, this type of low relative humidity also shows that the moist air has not reached Central Taiwan, where most of the rivers are located, so it is conducive to dust emissions. For the ahead of anticyclone type, the temperature is lower (20 °C), but the dry air (mean humidity of 60%) is also favorable for riverbed emissions. In contrast, the behind anticyclone and ahead of front stages in the non-typhoon types both have high humidity close to 80%. Particularly for the behind anticyclone stage, the cold and humid air is not favorable for dust emission, and thus the riverbed events were significantly affected by local pollutant or foreign aerosol.
4.4. Monthly and Hourly Mean Meteorology
Table 2 shows that the riverbed events were mainly observed during different weather stages in December, February, and April, respectively, and also often observed at noon time. To further explain the high riverbed PM
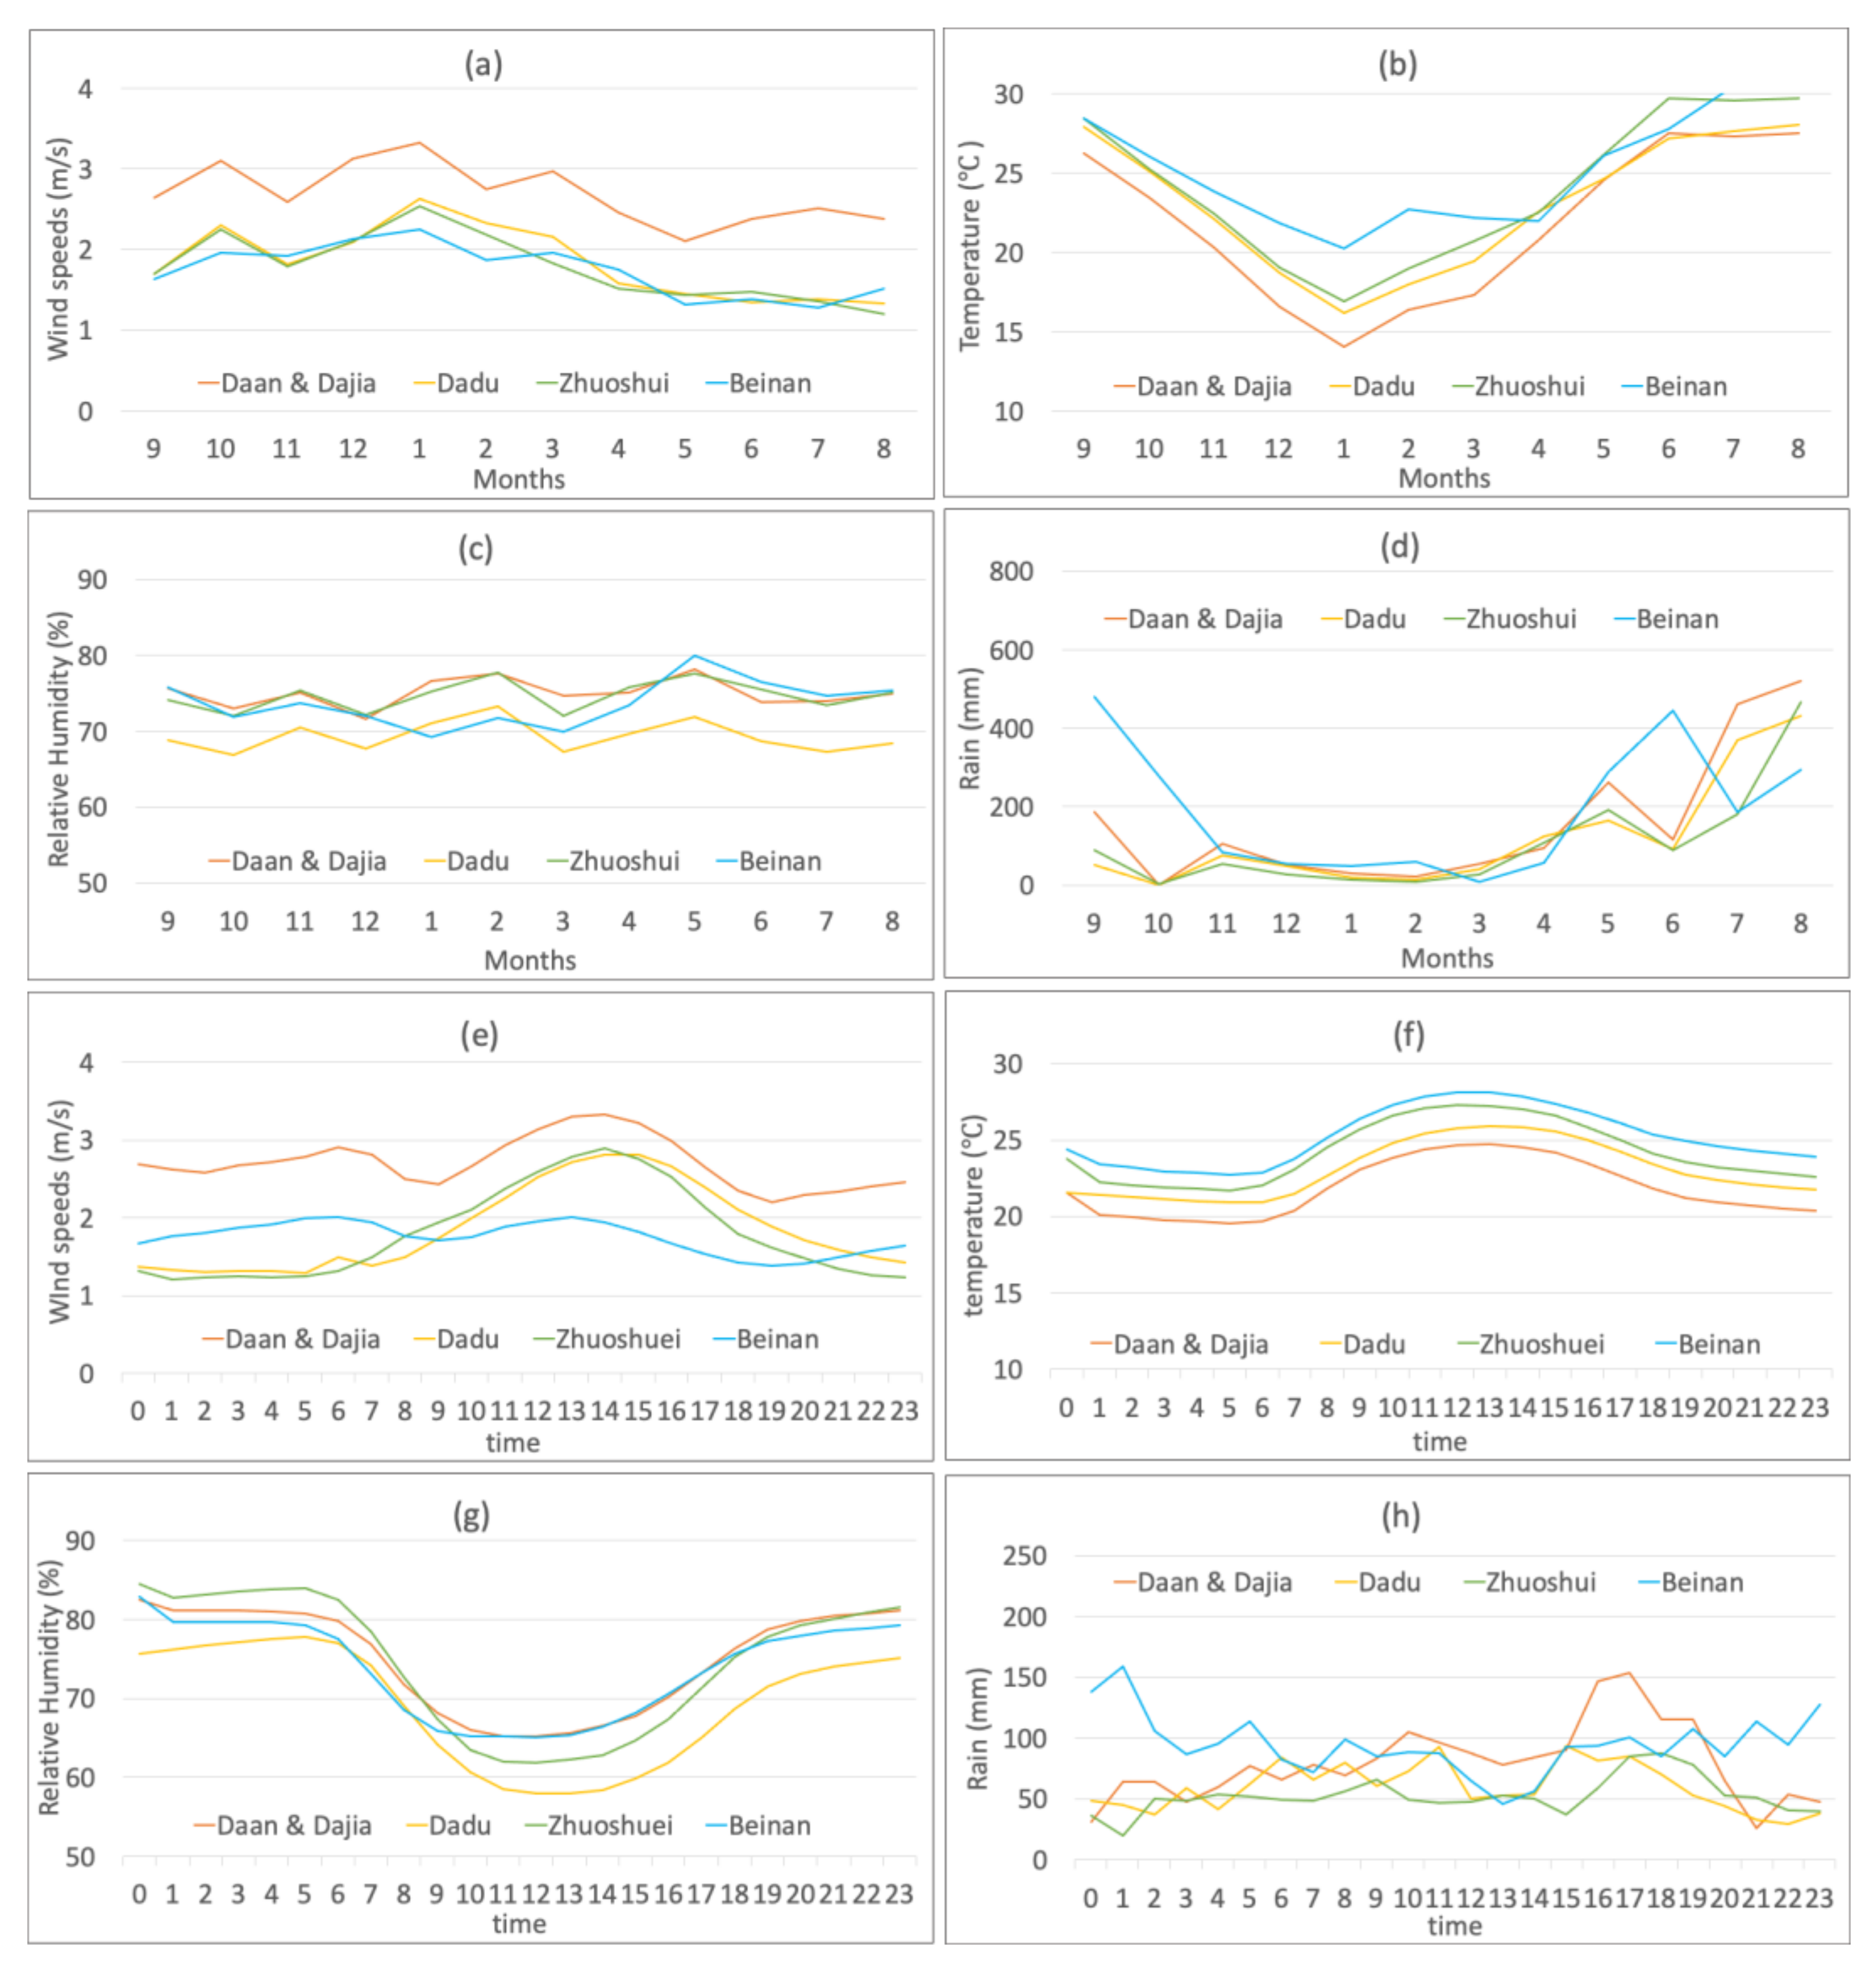
10 concentrations observed in these months rather than in the same weather stages of other months and times, the monthly and hourly mean wind speed, temperature, relative humidity, and precipitations of all the rivers are plotted and the general meteorological conditions are discussed (
Figure 7).
Figure 7a shows that during the winter monsoon from October to April, higher monthly average wind speeds were observed in all the rivers than in the summer monsoon. In addition, the peak monthly wind speeds were observed from December to February. Thus, during the ahead of anticyclone stage of these months, the strong wind speeds can result in higher riverbed emission compared to other months. In contrast, April is at the end of winter monsoon. The wind speed decreases (
Figure 7a) and thus the weak wind speed behind the anticyclone can easily result in the accumulation of local pollution compared to other months, and enhance the riverbed concentration. In addition, a previous study [
23] also found that in December and April, the amount of Asian dust transported to Northern Taiwan was higher than in other months. Under high background concentration, more riverbed events can also be observed. However, January is the month with the lowest riverbed concentration (
Figure 3), despite the maximum wind speed of the months. It is possible that due to the low temperature in January (
Figure 7b), Asian deserts are easily covered by snow, resulting in the reduction of Asian dust emissions and transport. The low foreign dust concentration in this month also resulted in the lower PM
10 concentration in the riverbed areas. The similar low PM
10 concentration is also seen in a previous study of Northern Taiwan [
23].
In addition,
Figure 7c shows that the monthly average relative humidity is around 70% for all the rivers, and
Figure 7d shows that rainfall in all the rivers during the winter monsoon is extremely low, different from that during the summer monsoon (May to September). The dry condition is favorable for riverbed dust generation during those months.
The average meteorological values in a day (
Figure 7e–h) show that higher wind speeds often occur around noon for all the rivers, and the maximum wind speed is between 13:00–14:00. The highest temperature was also observed at noon, while the hourly average relative humidity of all rivers reaches a minimum at noon time. The strong wind speed, high temperature, and low humidity at noon time are conducive to dust emission from the riverbed, as shown in
Table 2. Furthermore, the hourly average rainfall in
Figure 7h shows that the 24-h rainfall of all rivers remains mostly around 50 mm to 100 mm. Among them, the minimum mean precipitation was observed over the Zhuoshui River most of the time, which may be one of the reasons for the high riverbed PM
10 concentration shown in
Figure 3.
