
Nature-Based Resilience: A Multi-Type Evaluation of Productive Green Infrastructure in Agricultural Settings in Ontario, Canada


Abstract
:1. Introduction
Literature Review
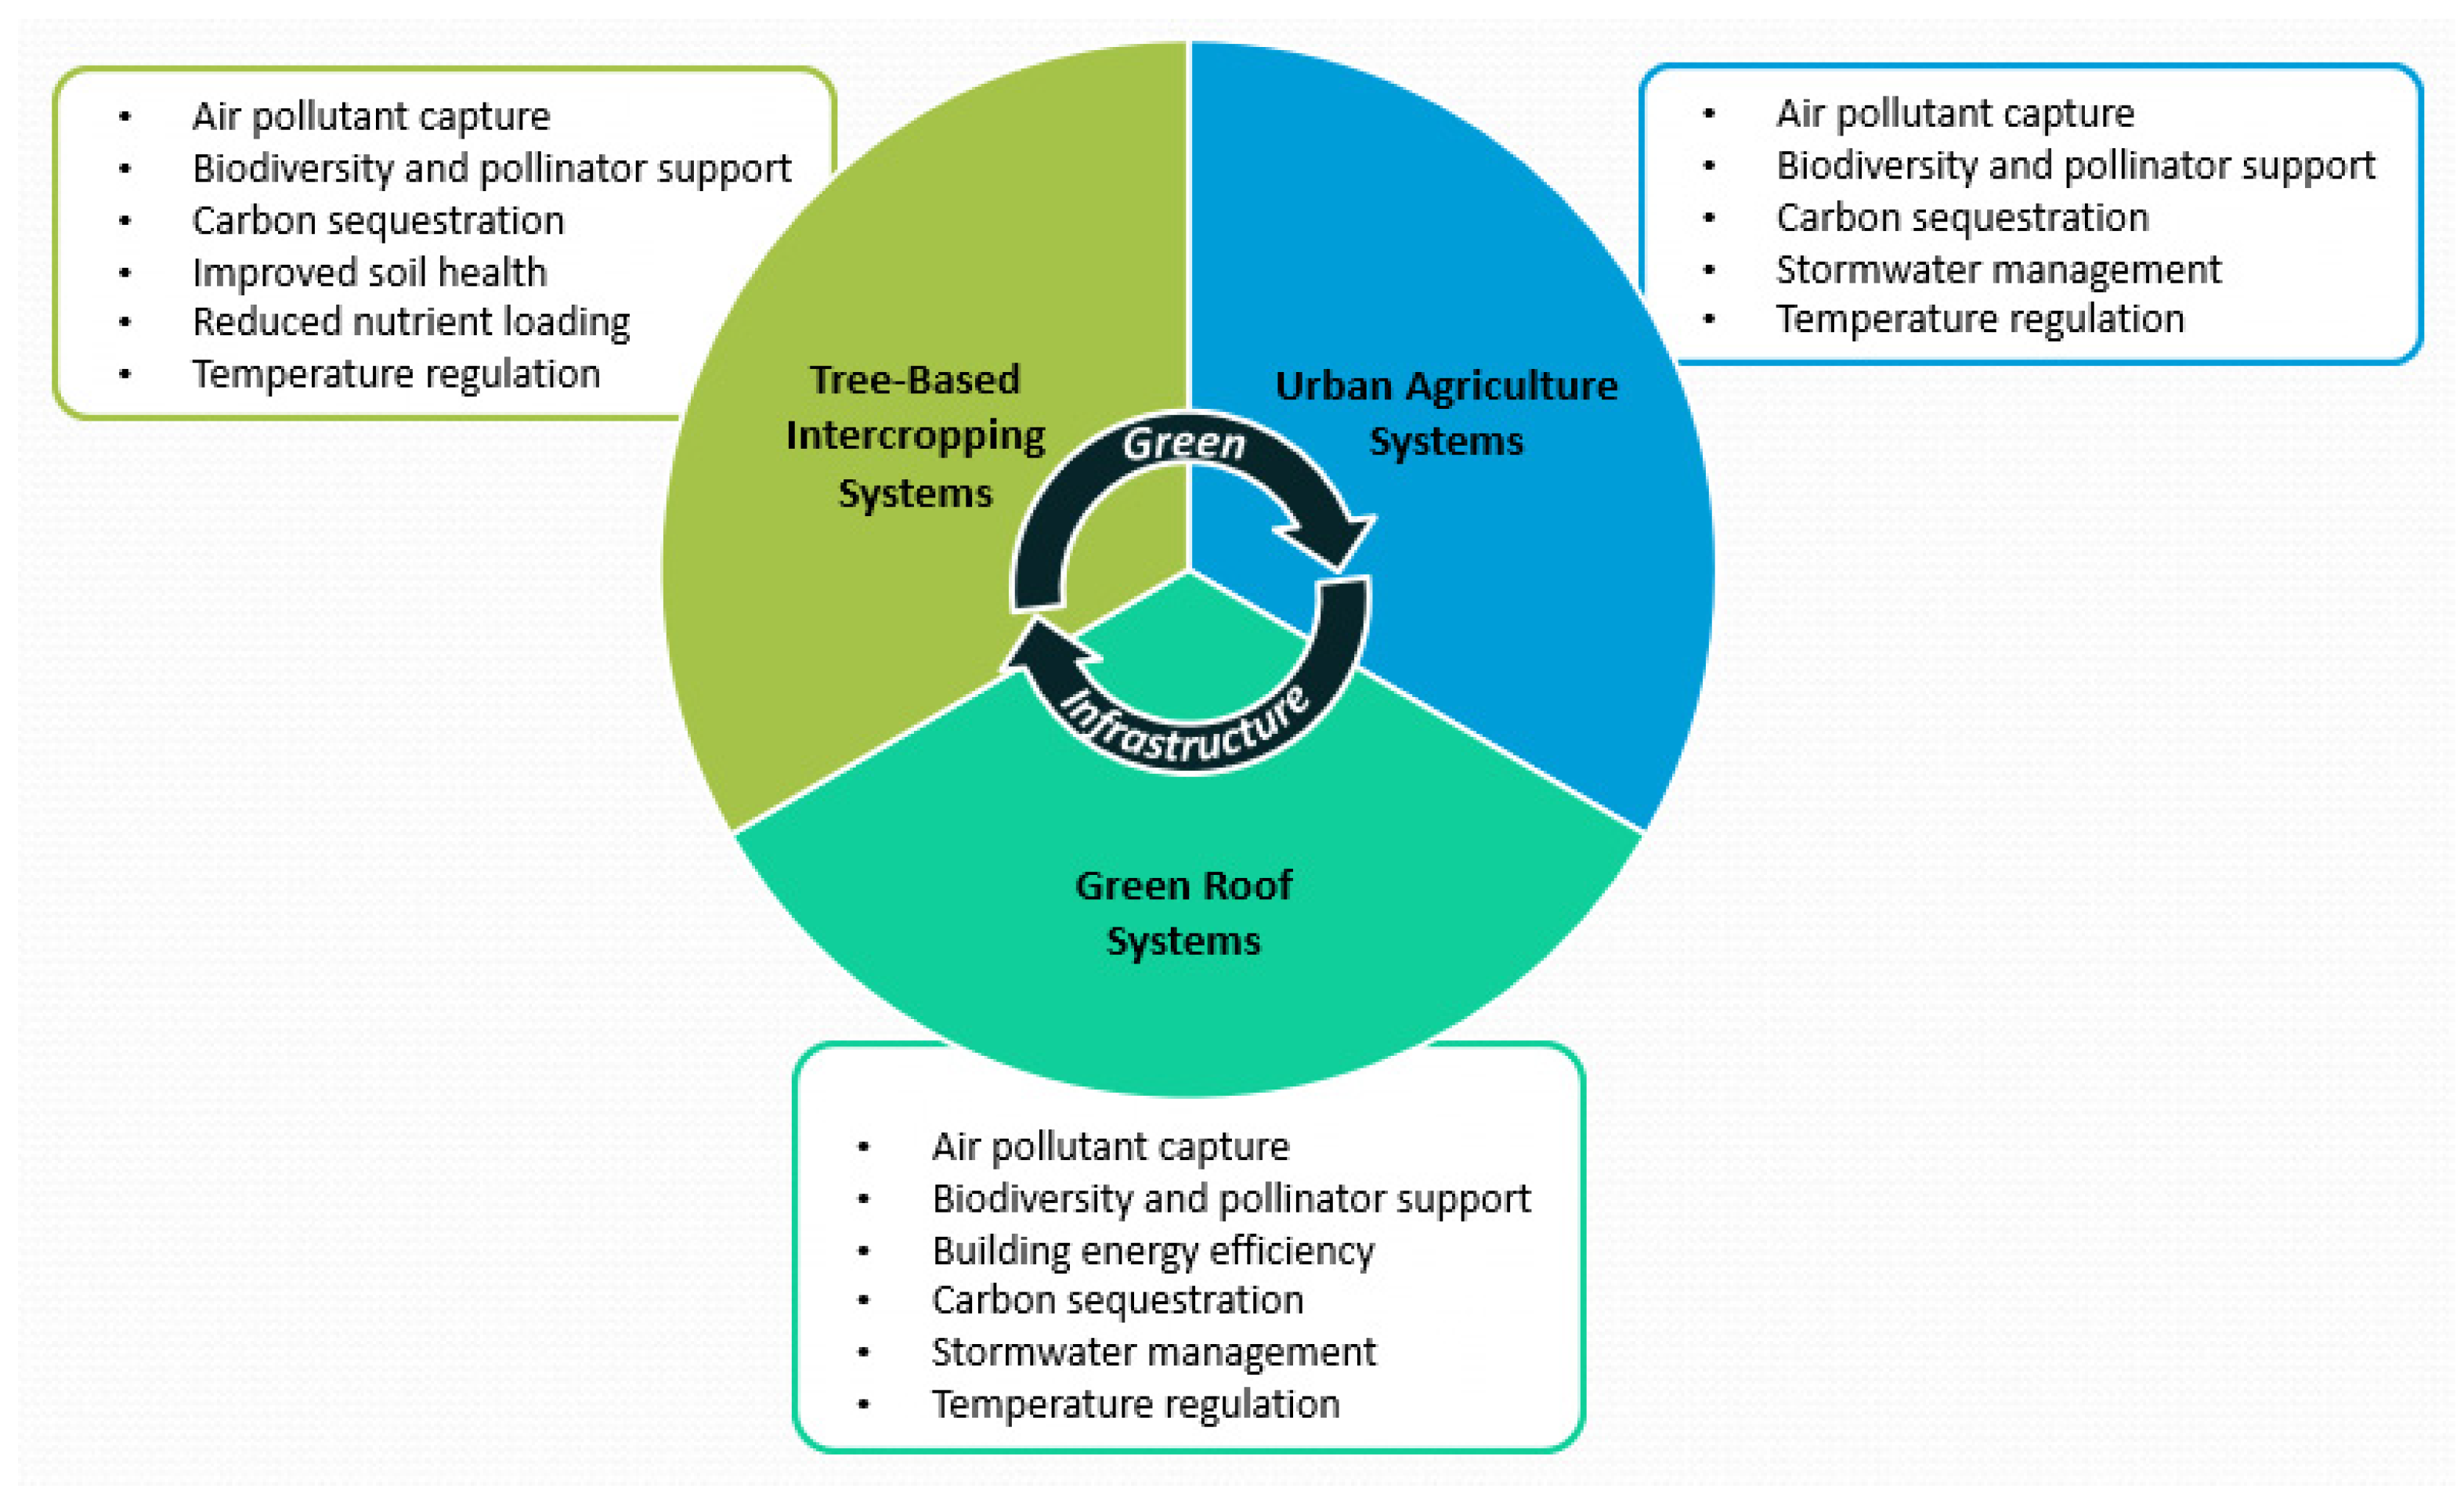
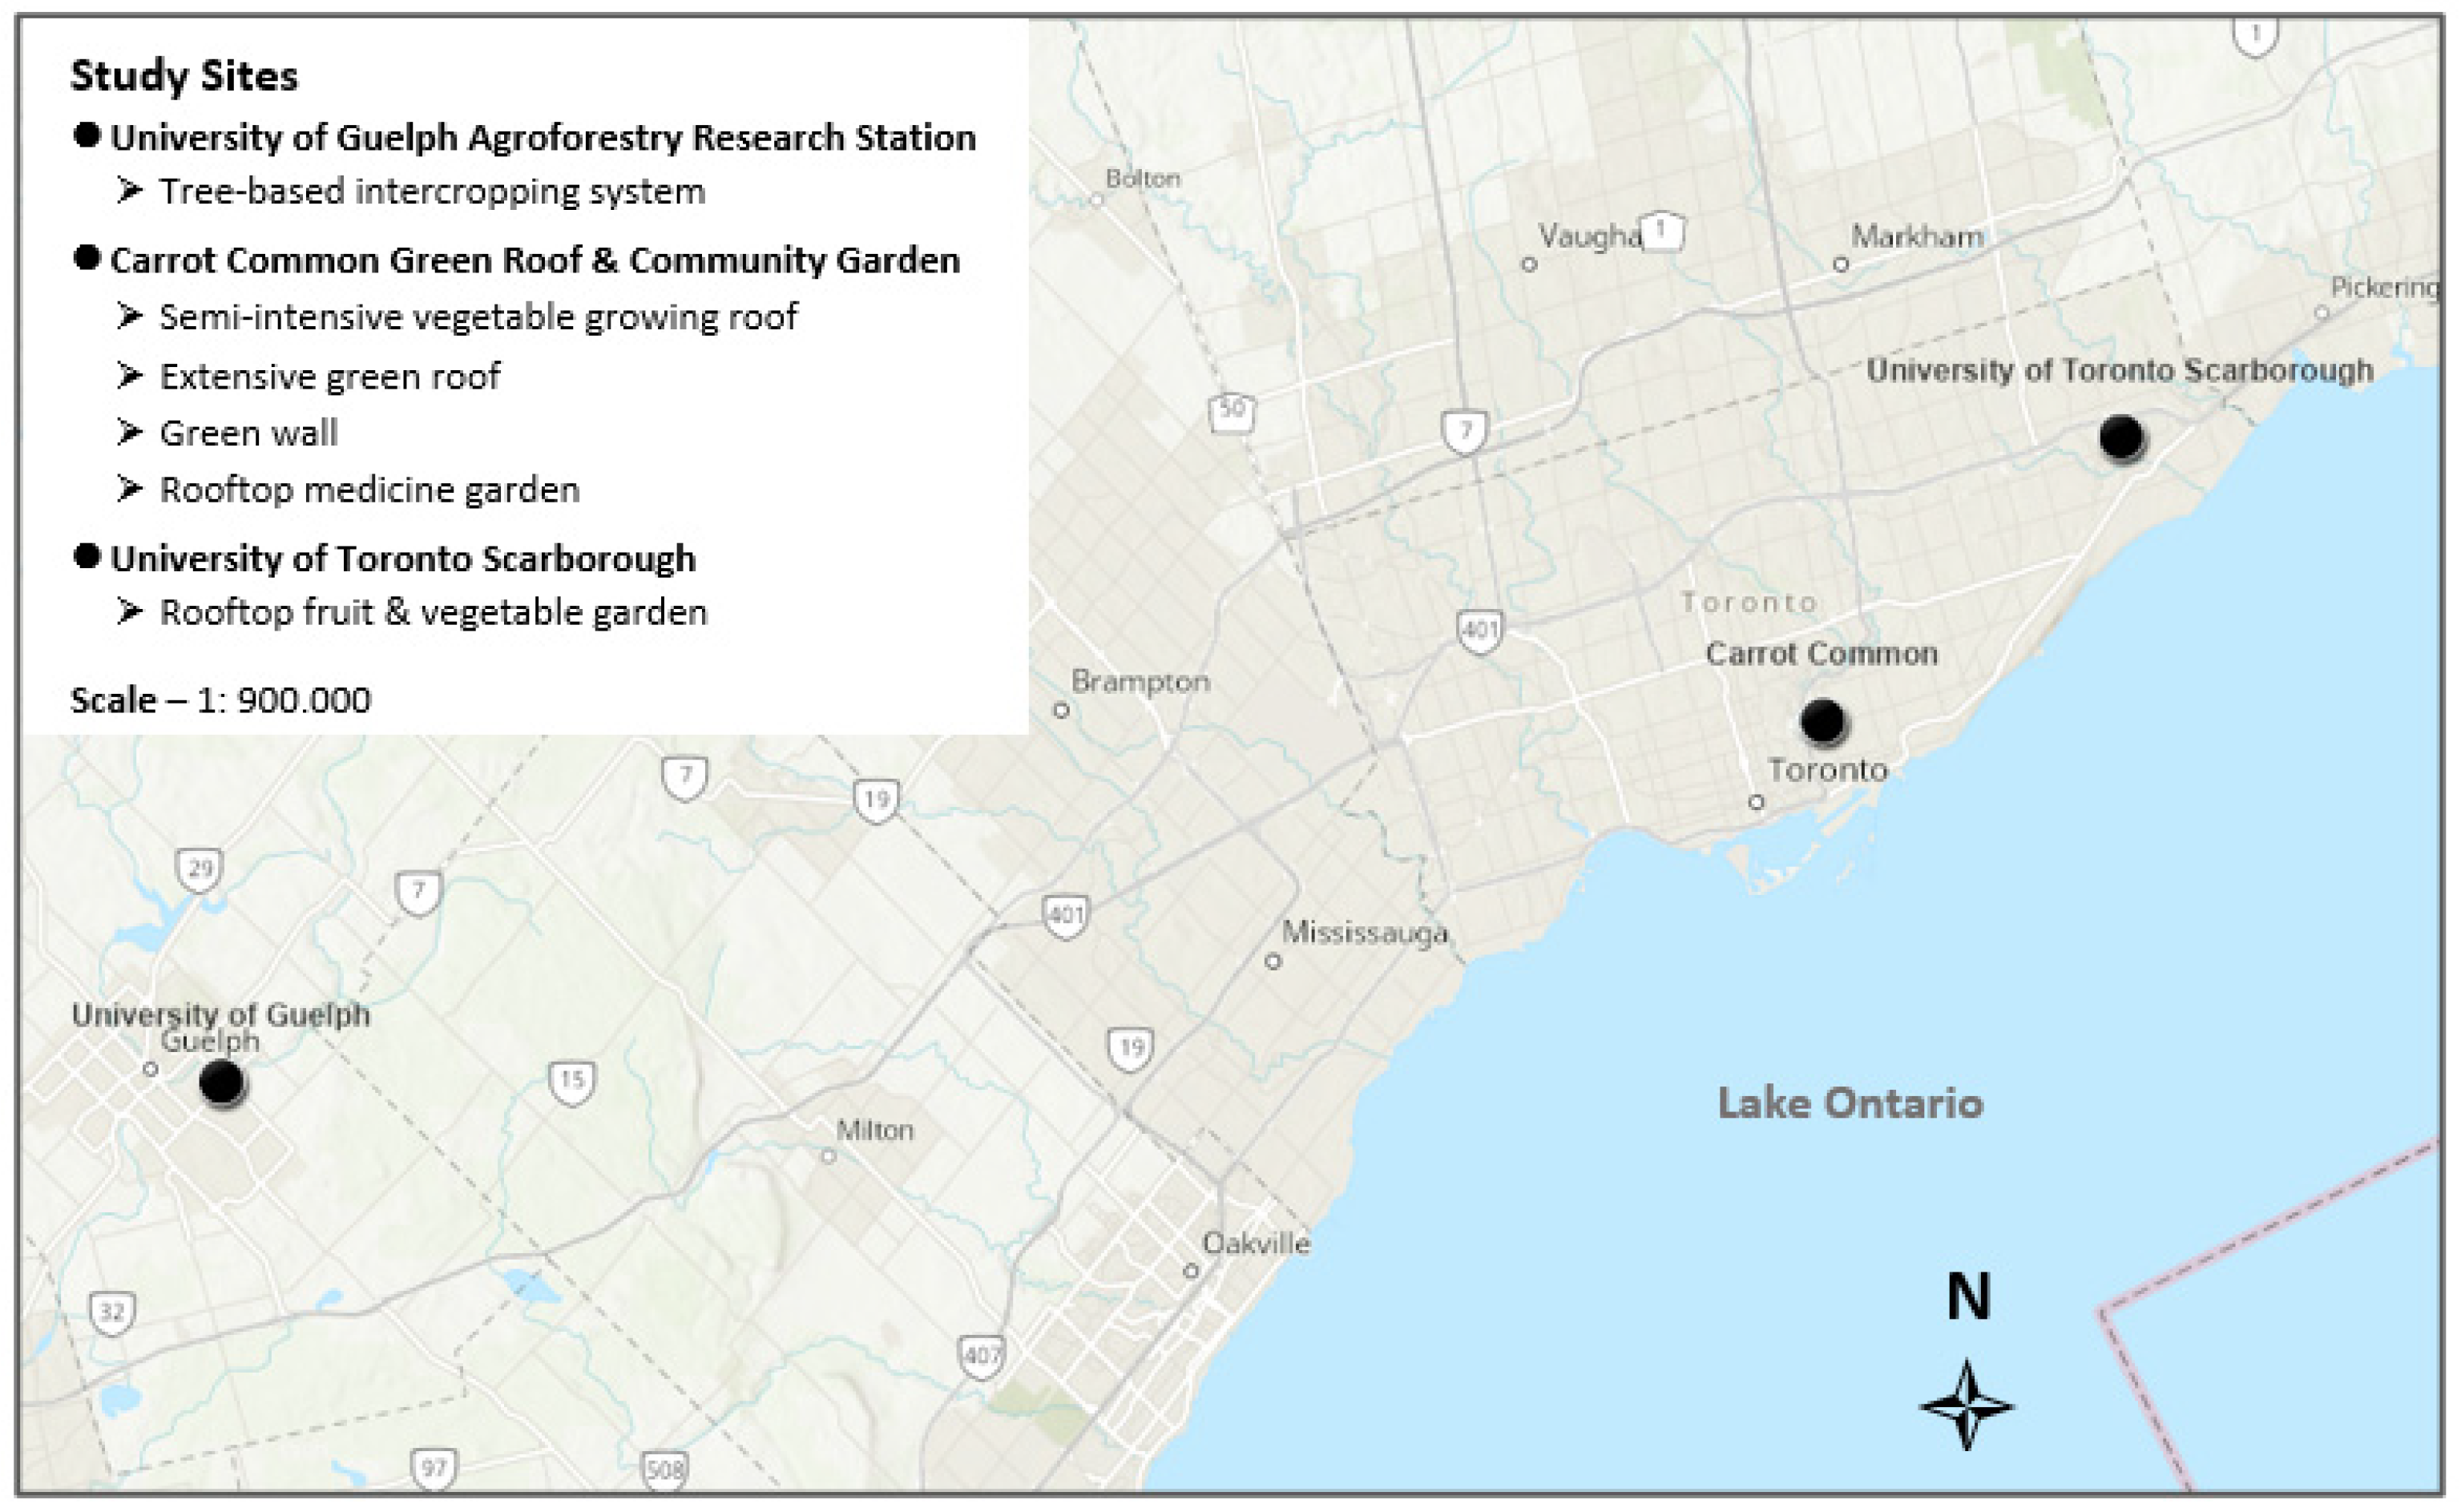
2. Methods
3. Results
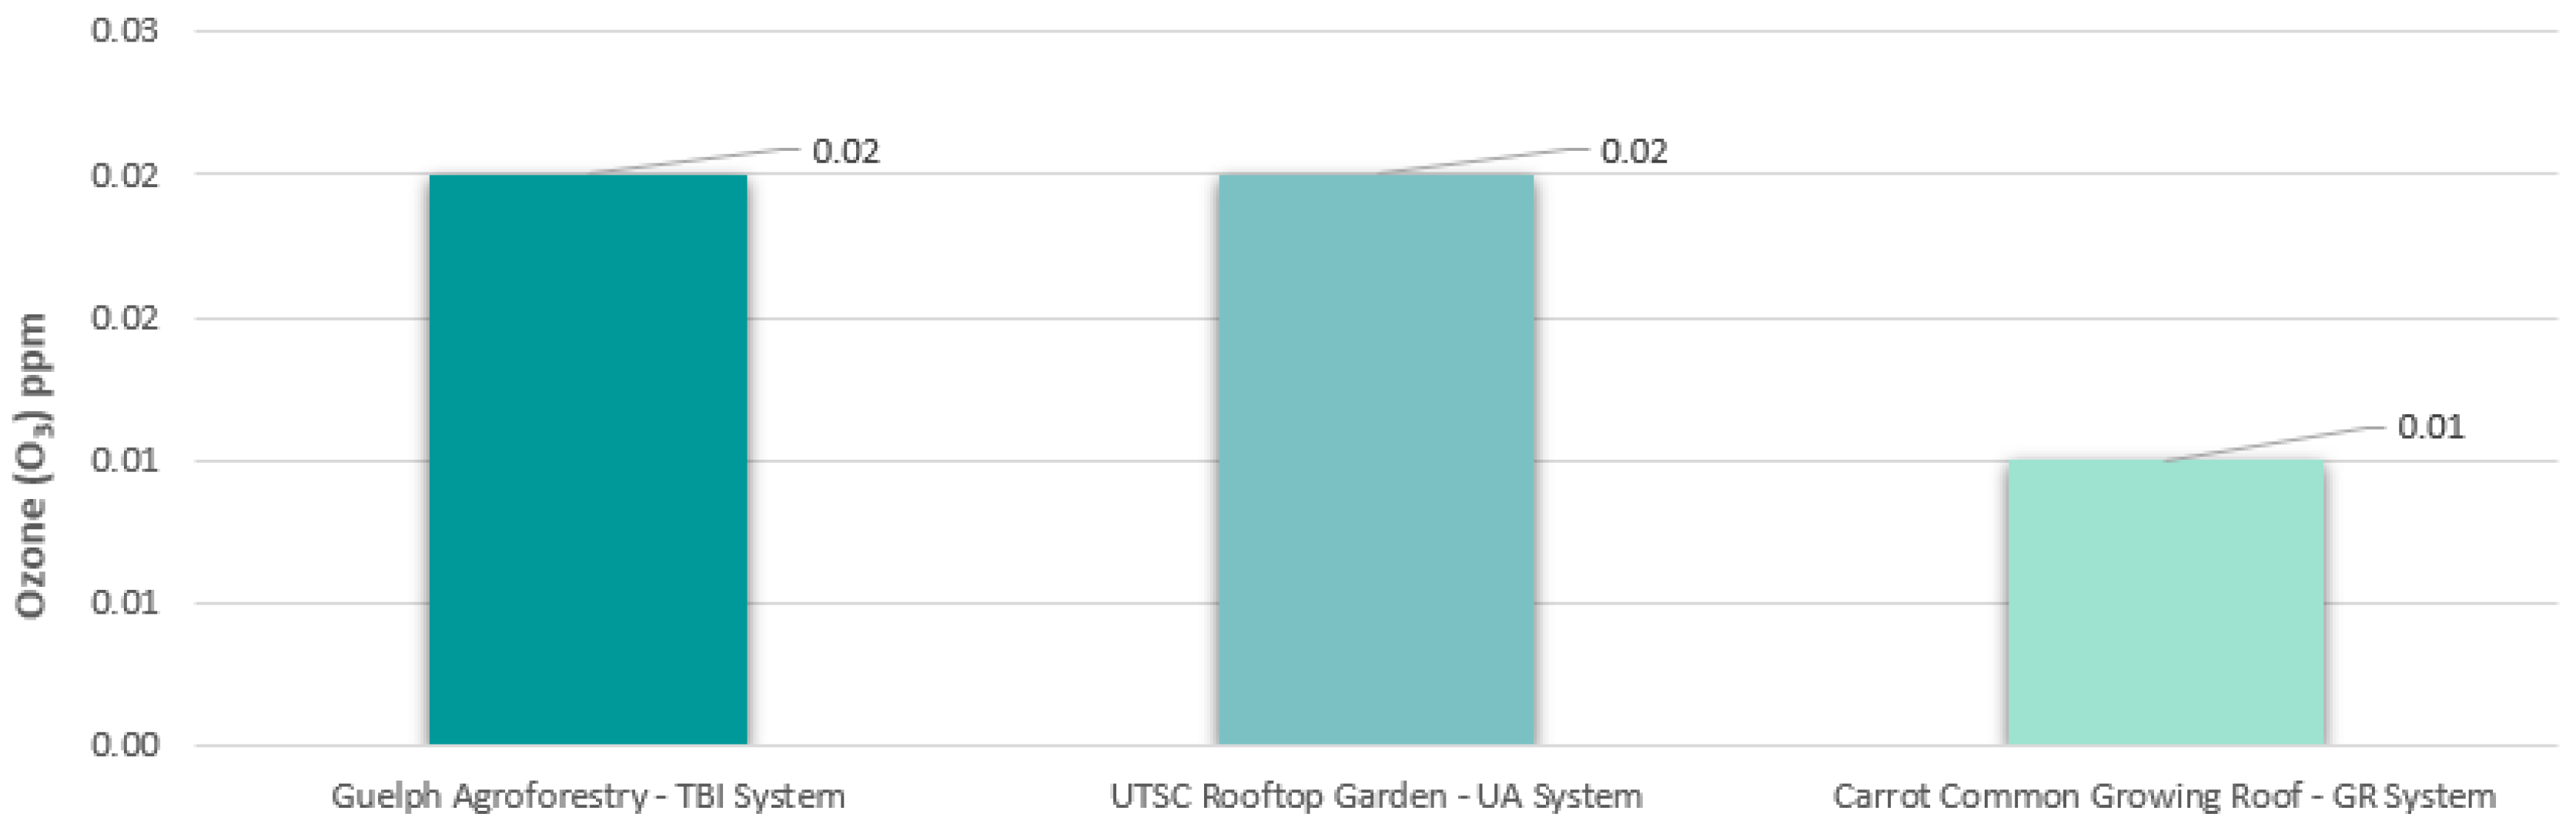
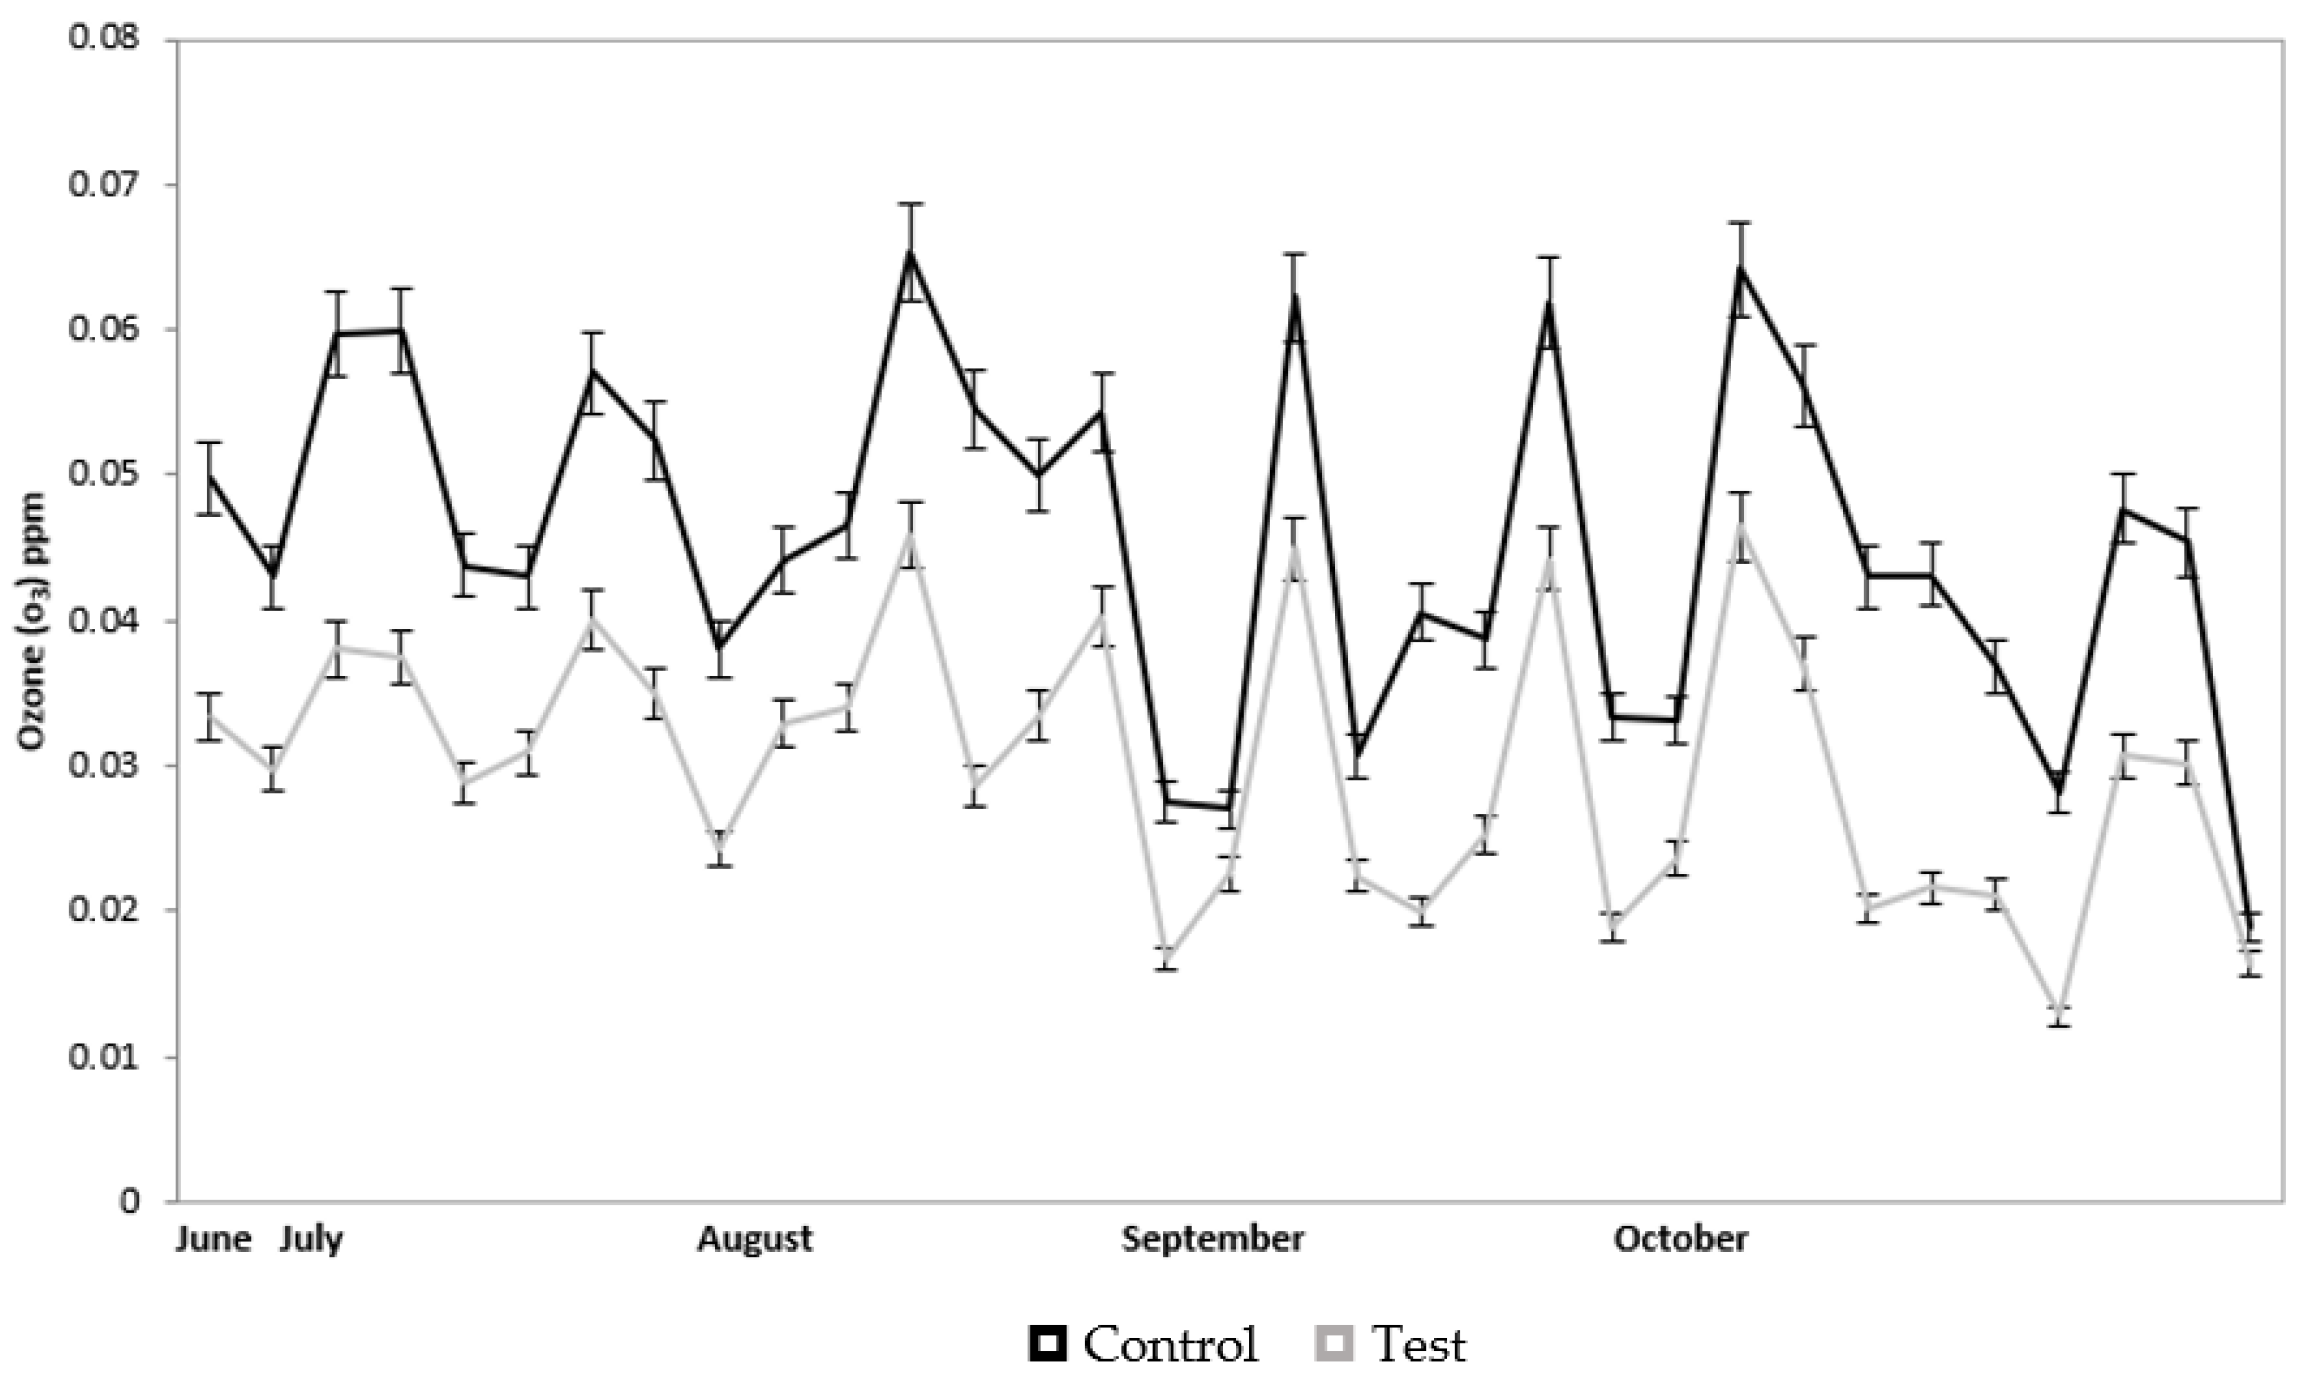
3.1. Reduction in Air Pollutants—Ozone
3.2. Analysis of Reduction in Pollutants—Ozone
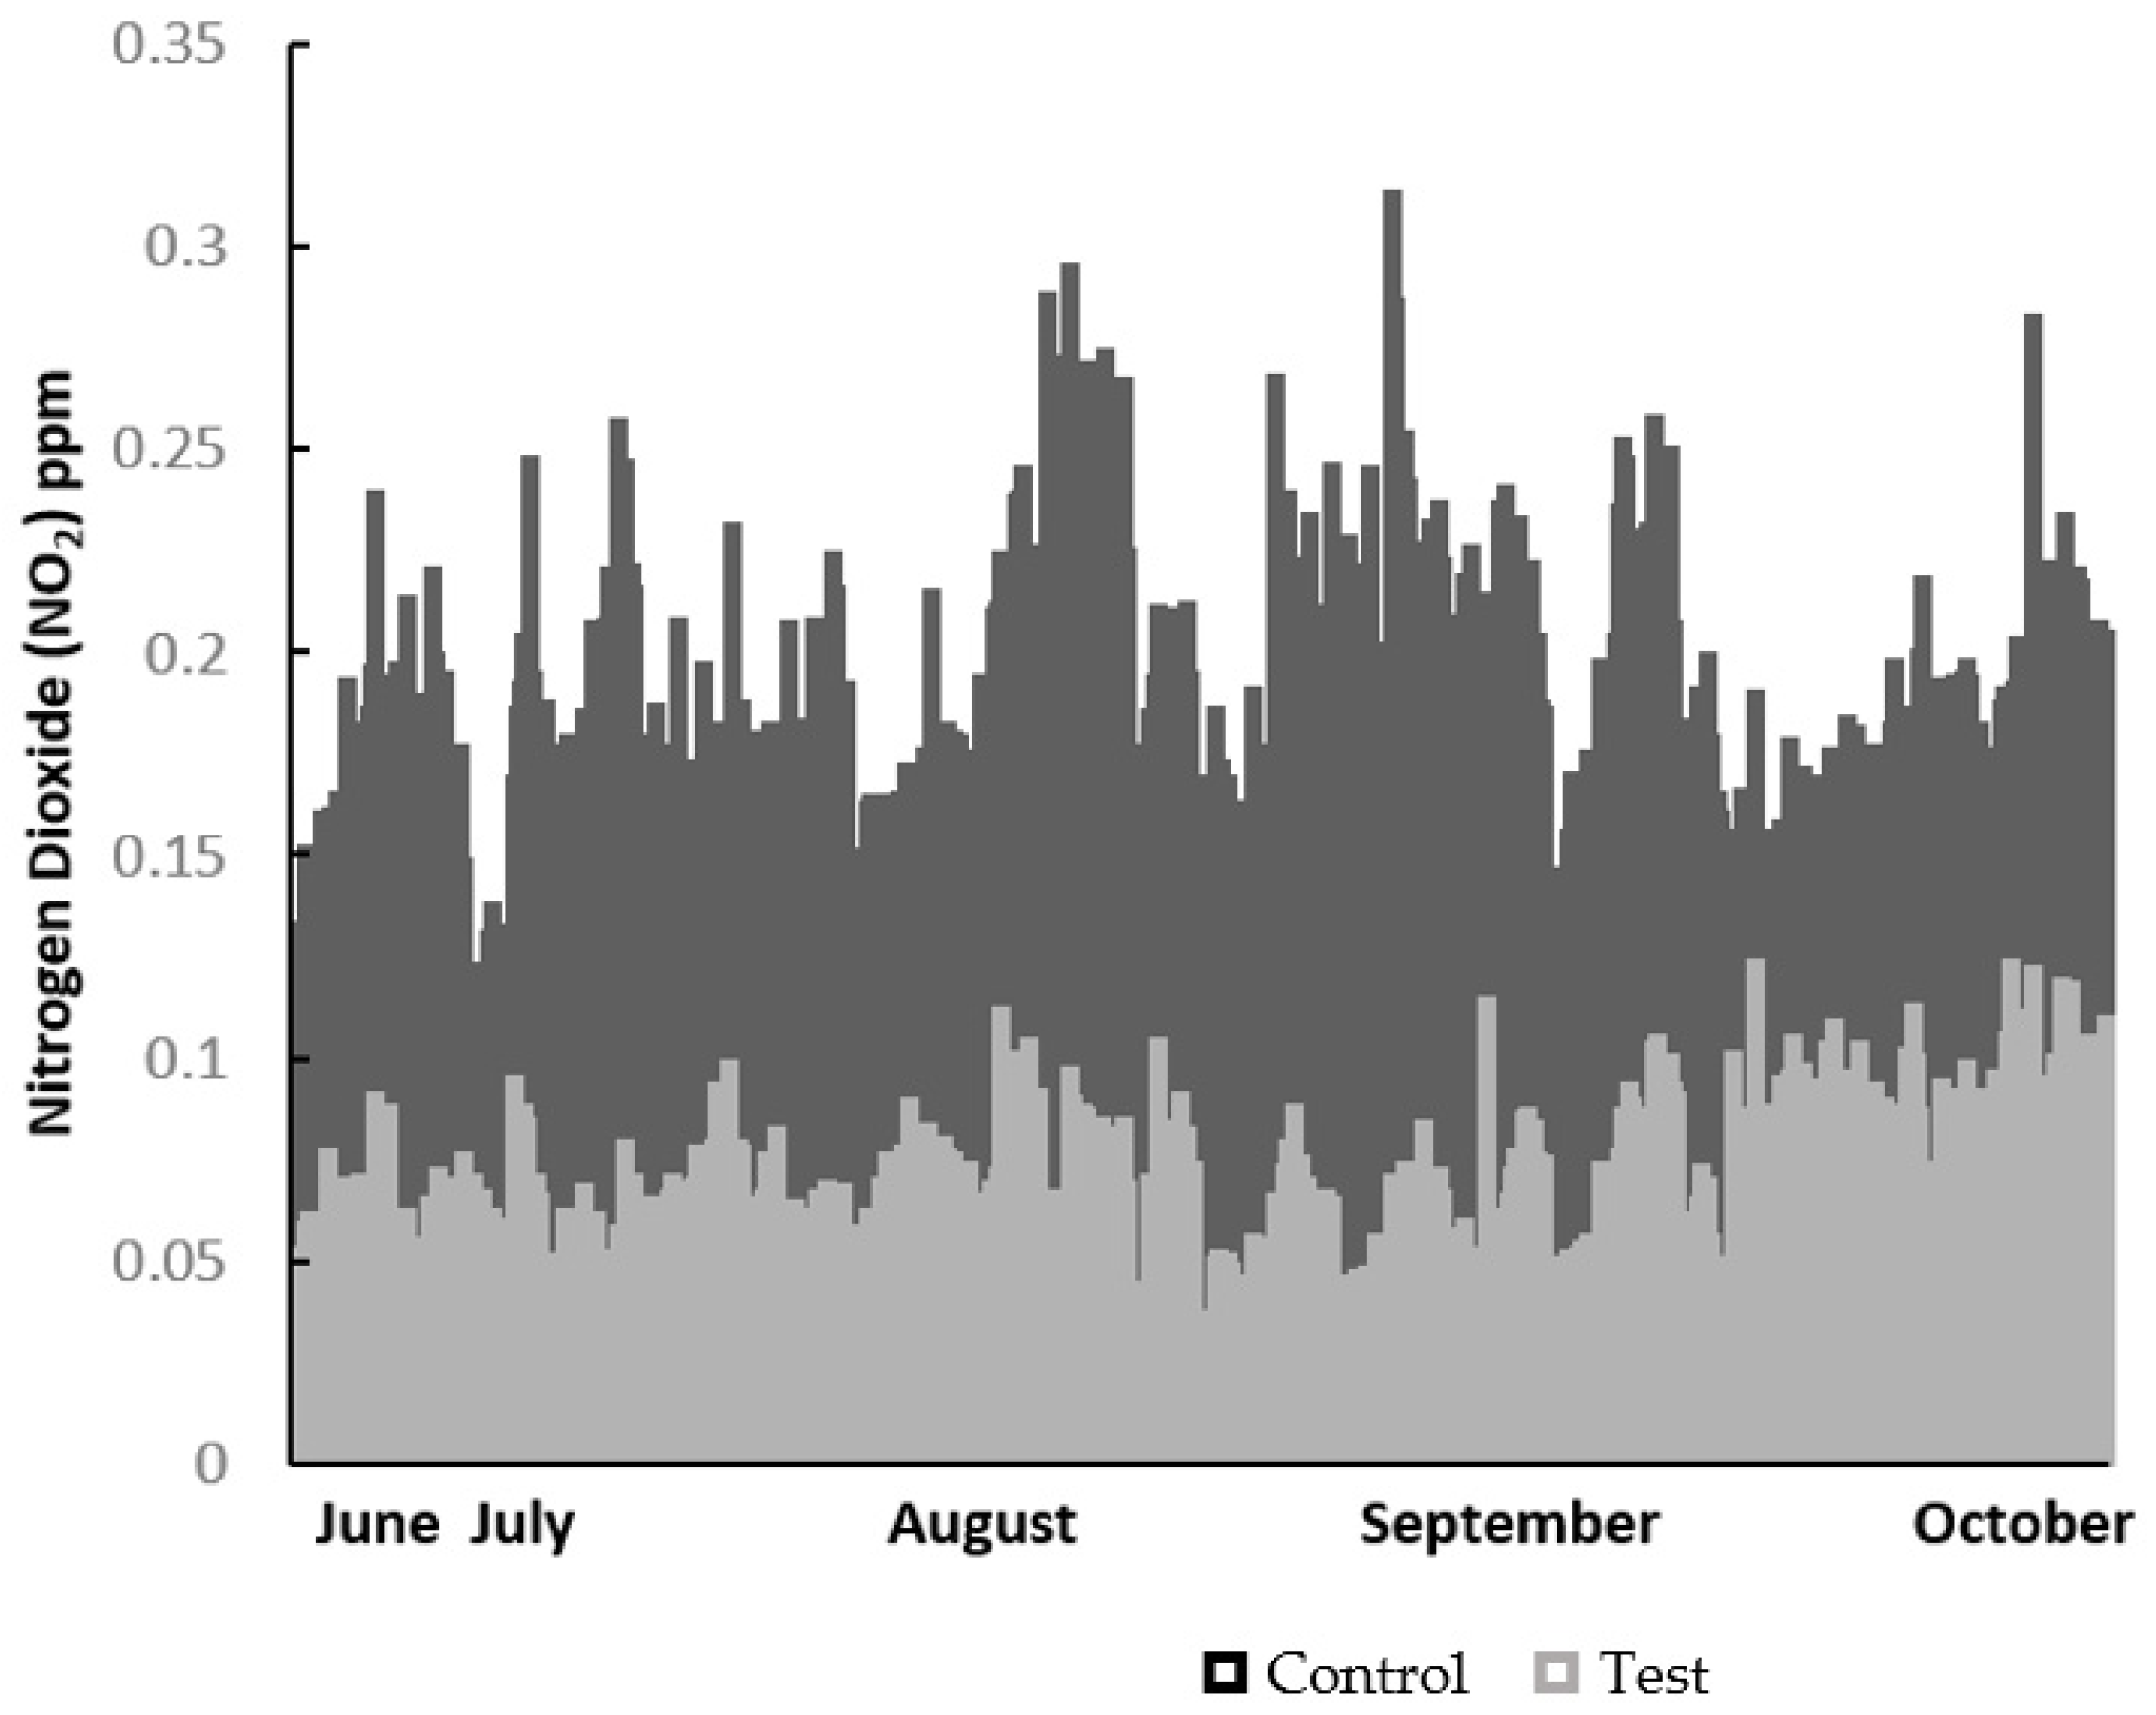
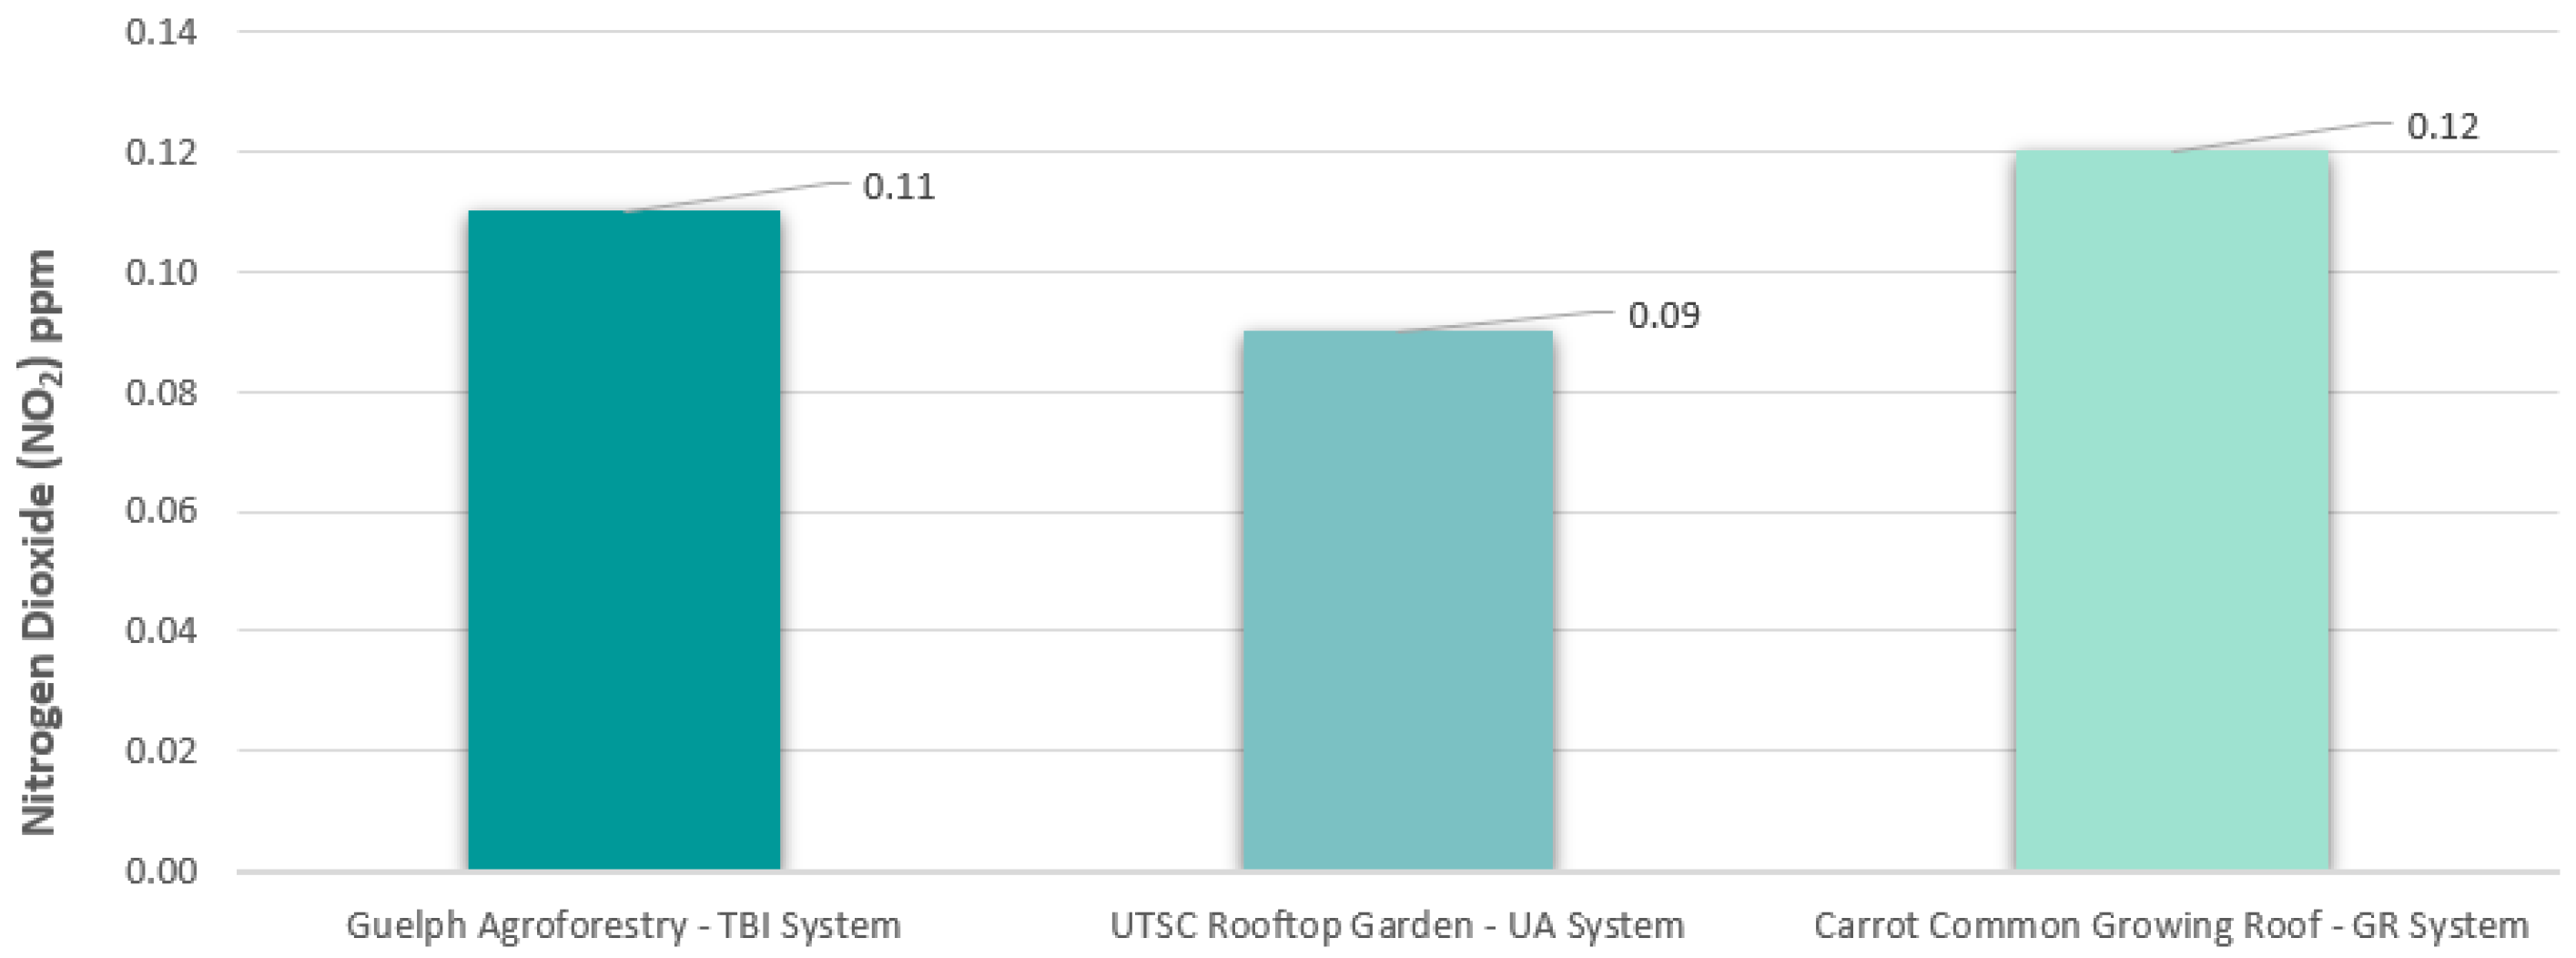
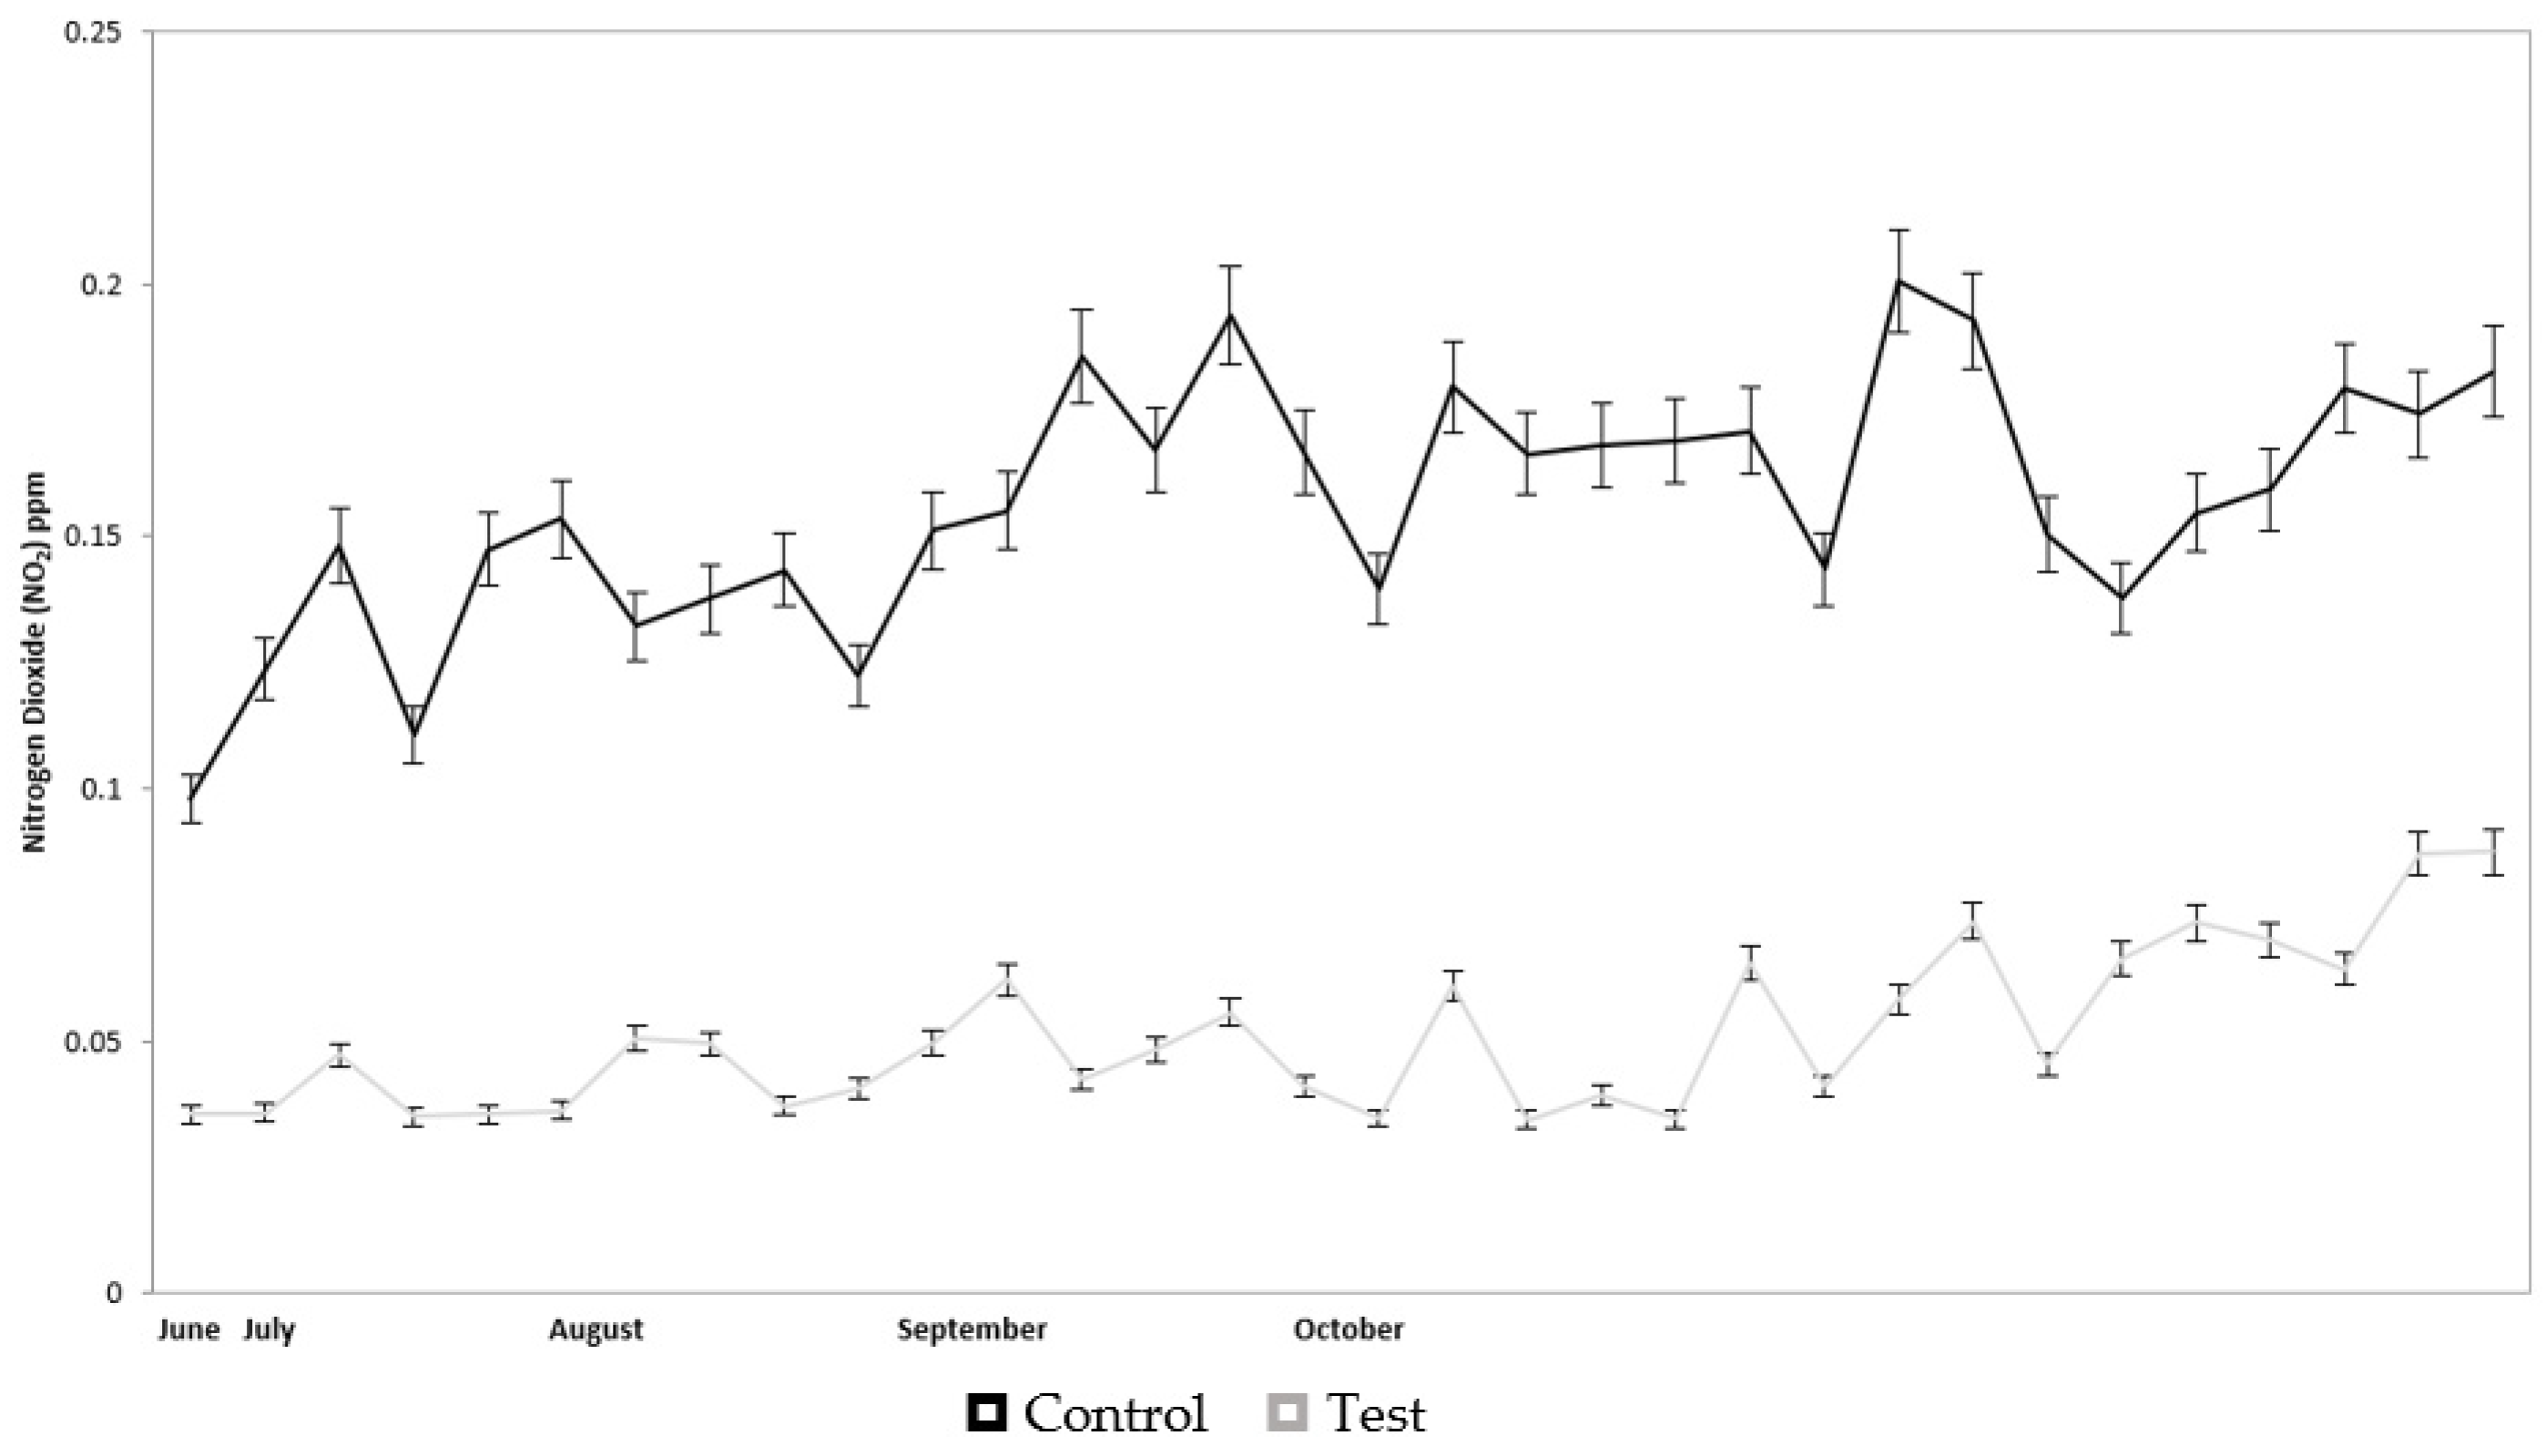
3.3. Reduction in Air Pollutants—Nitrogen Dioxide
3.4. Analysis of Reduction in Air Pollutants—Nitrogen Dioxide
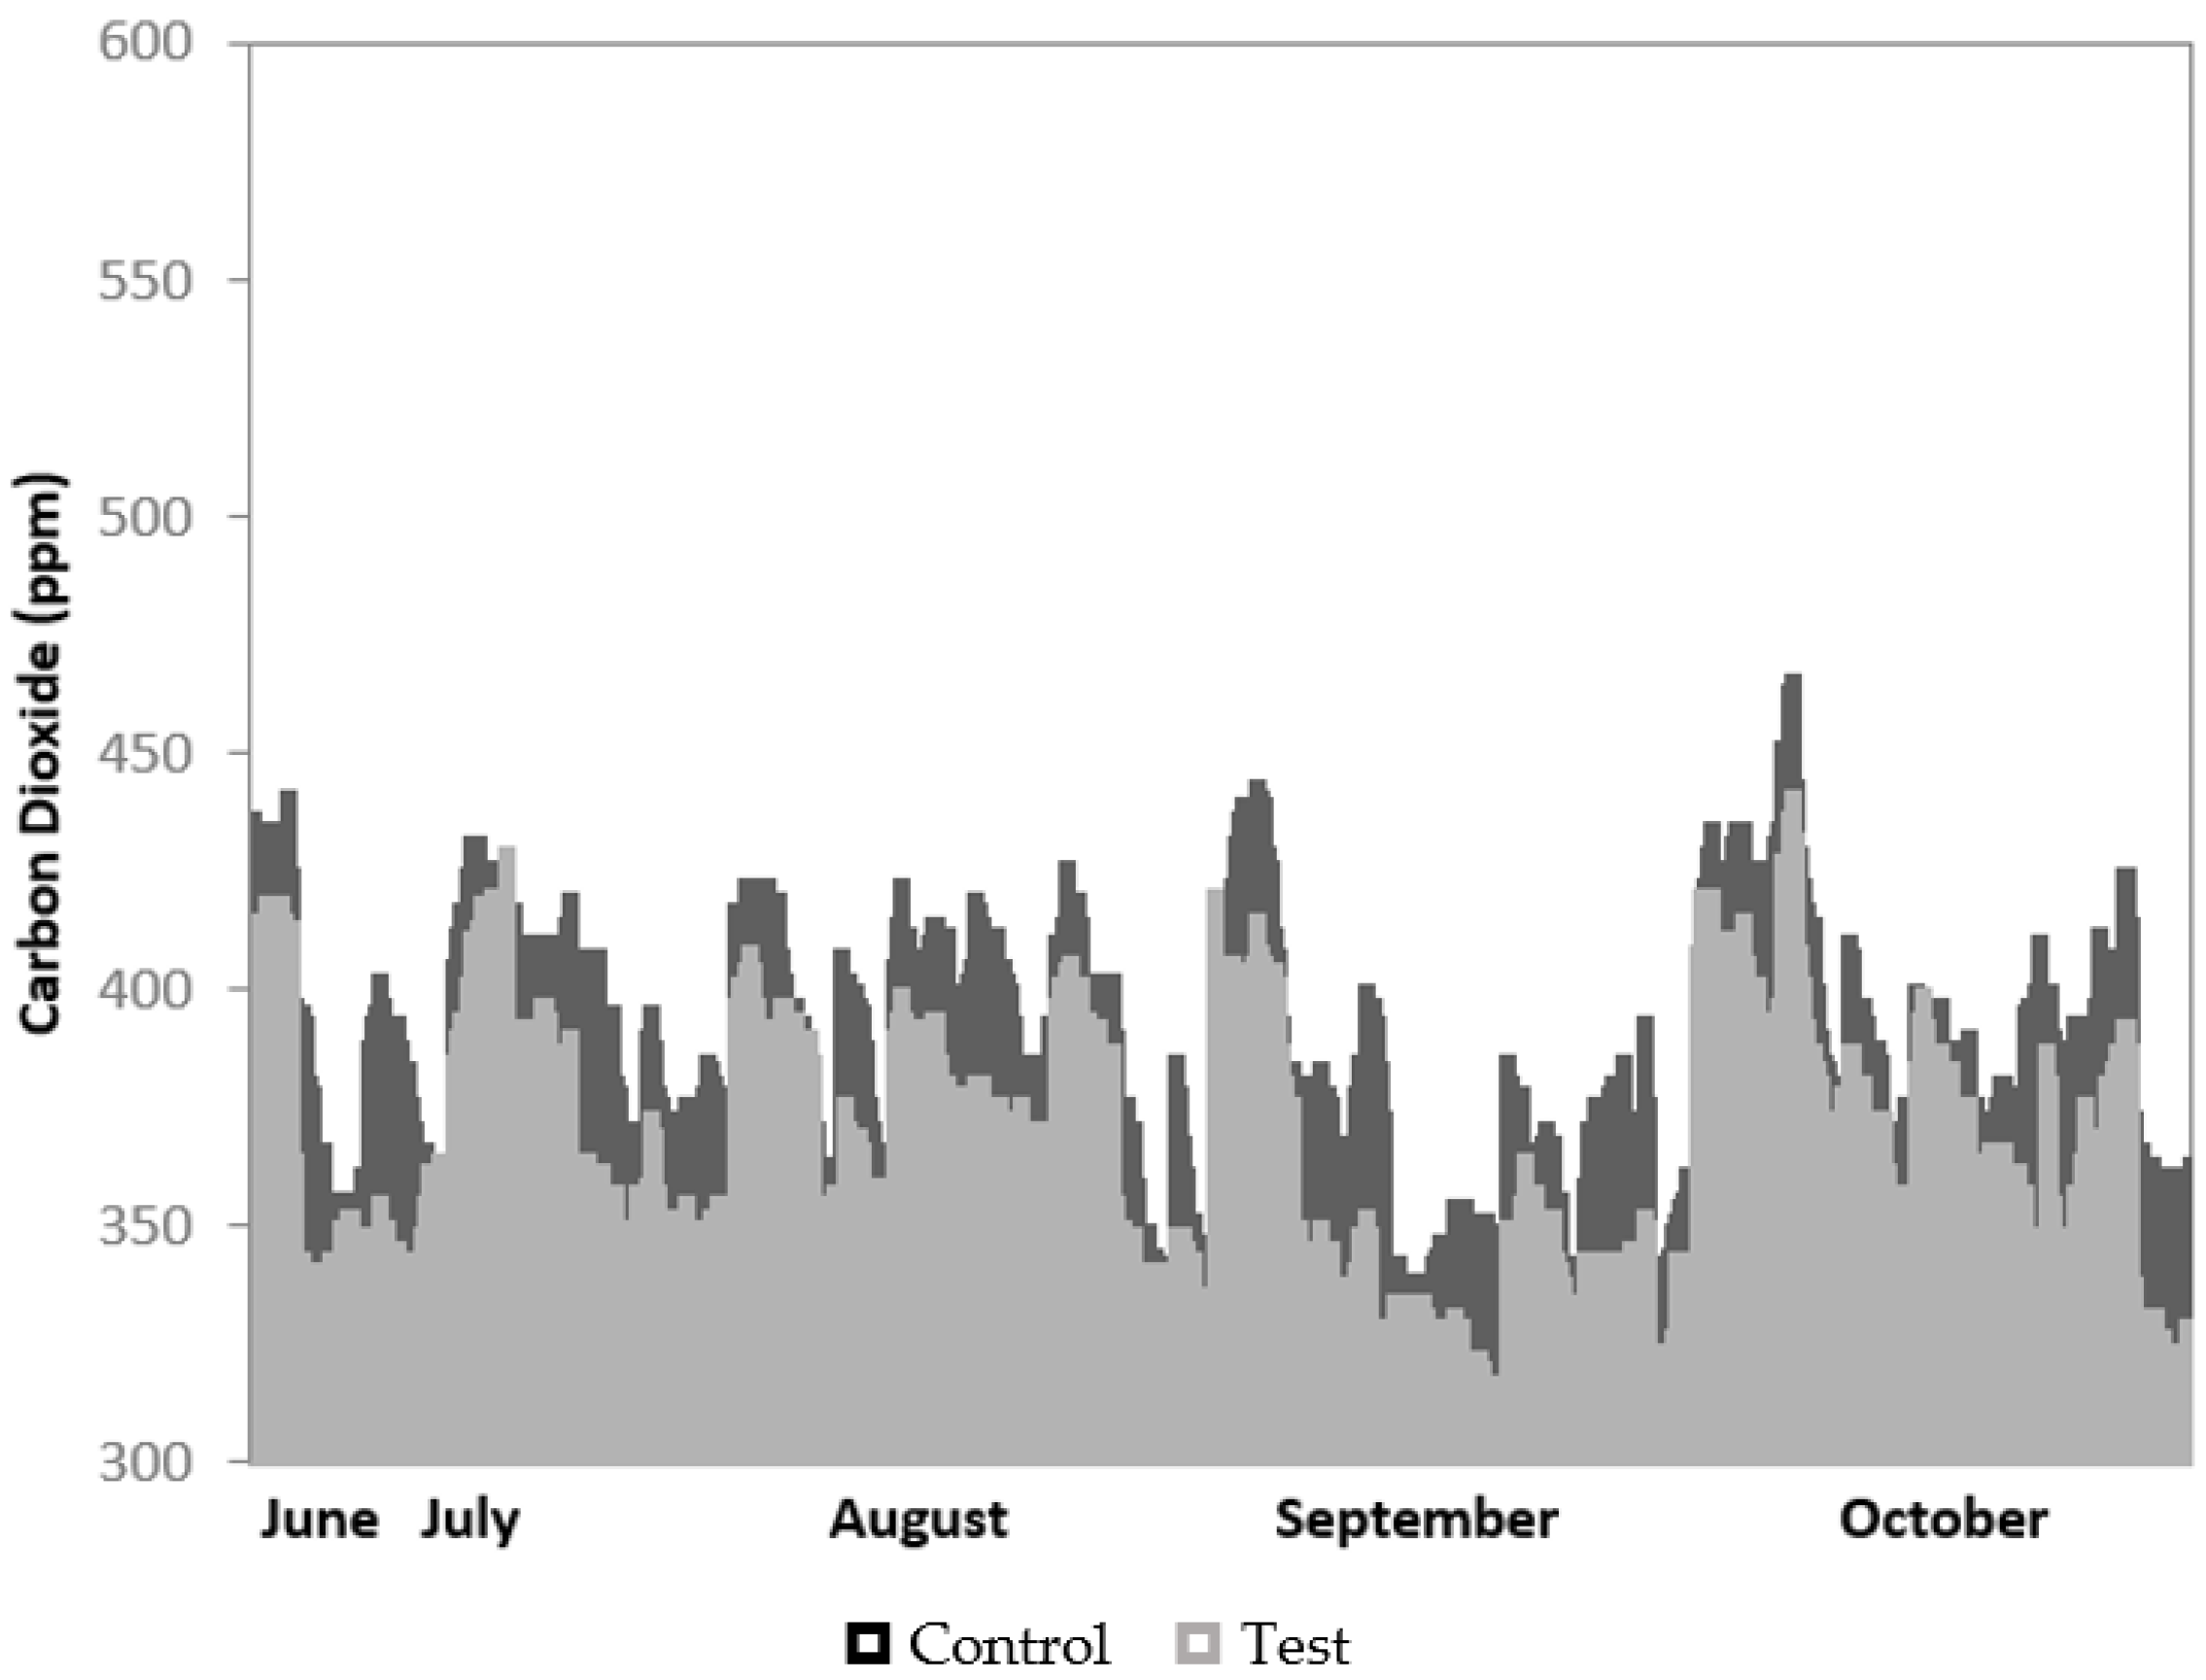
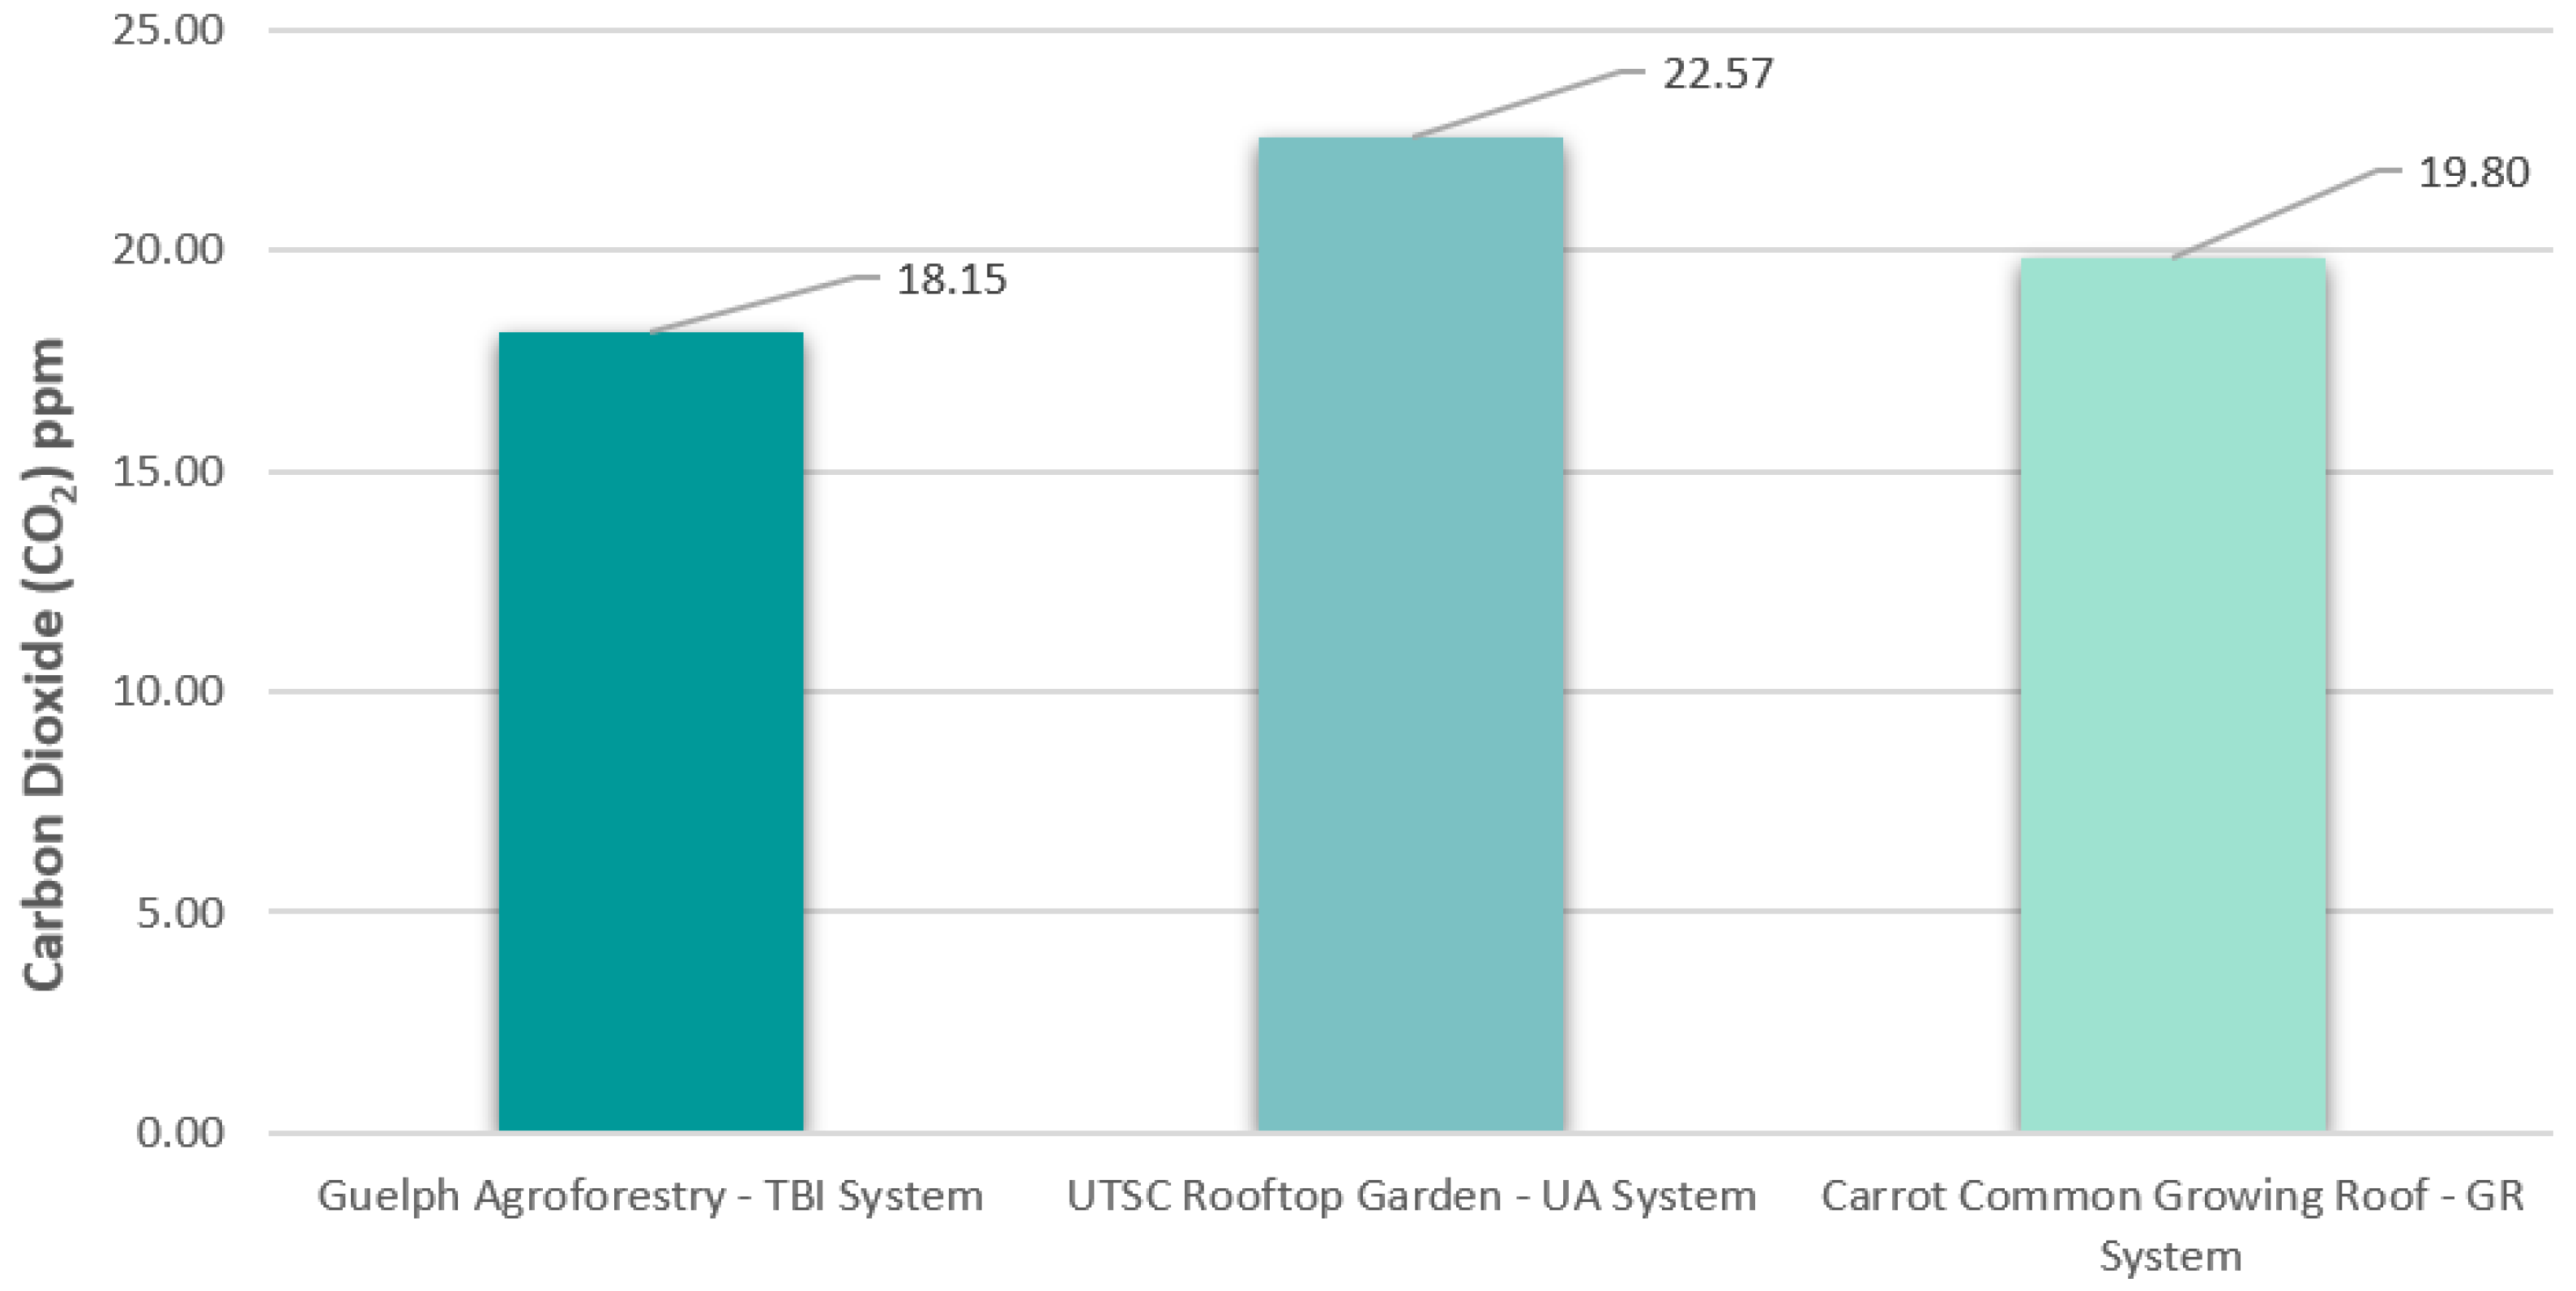
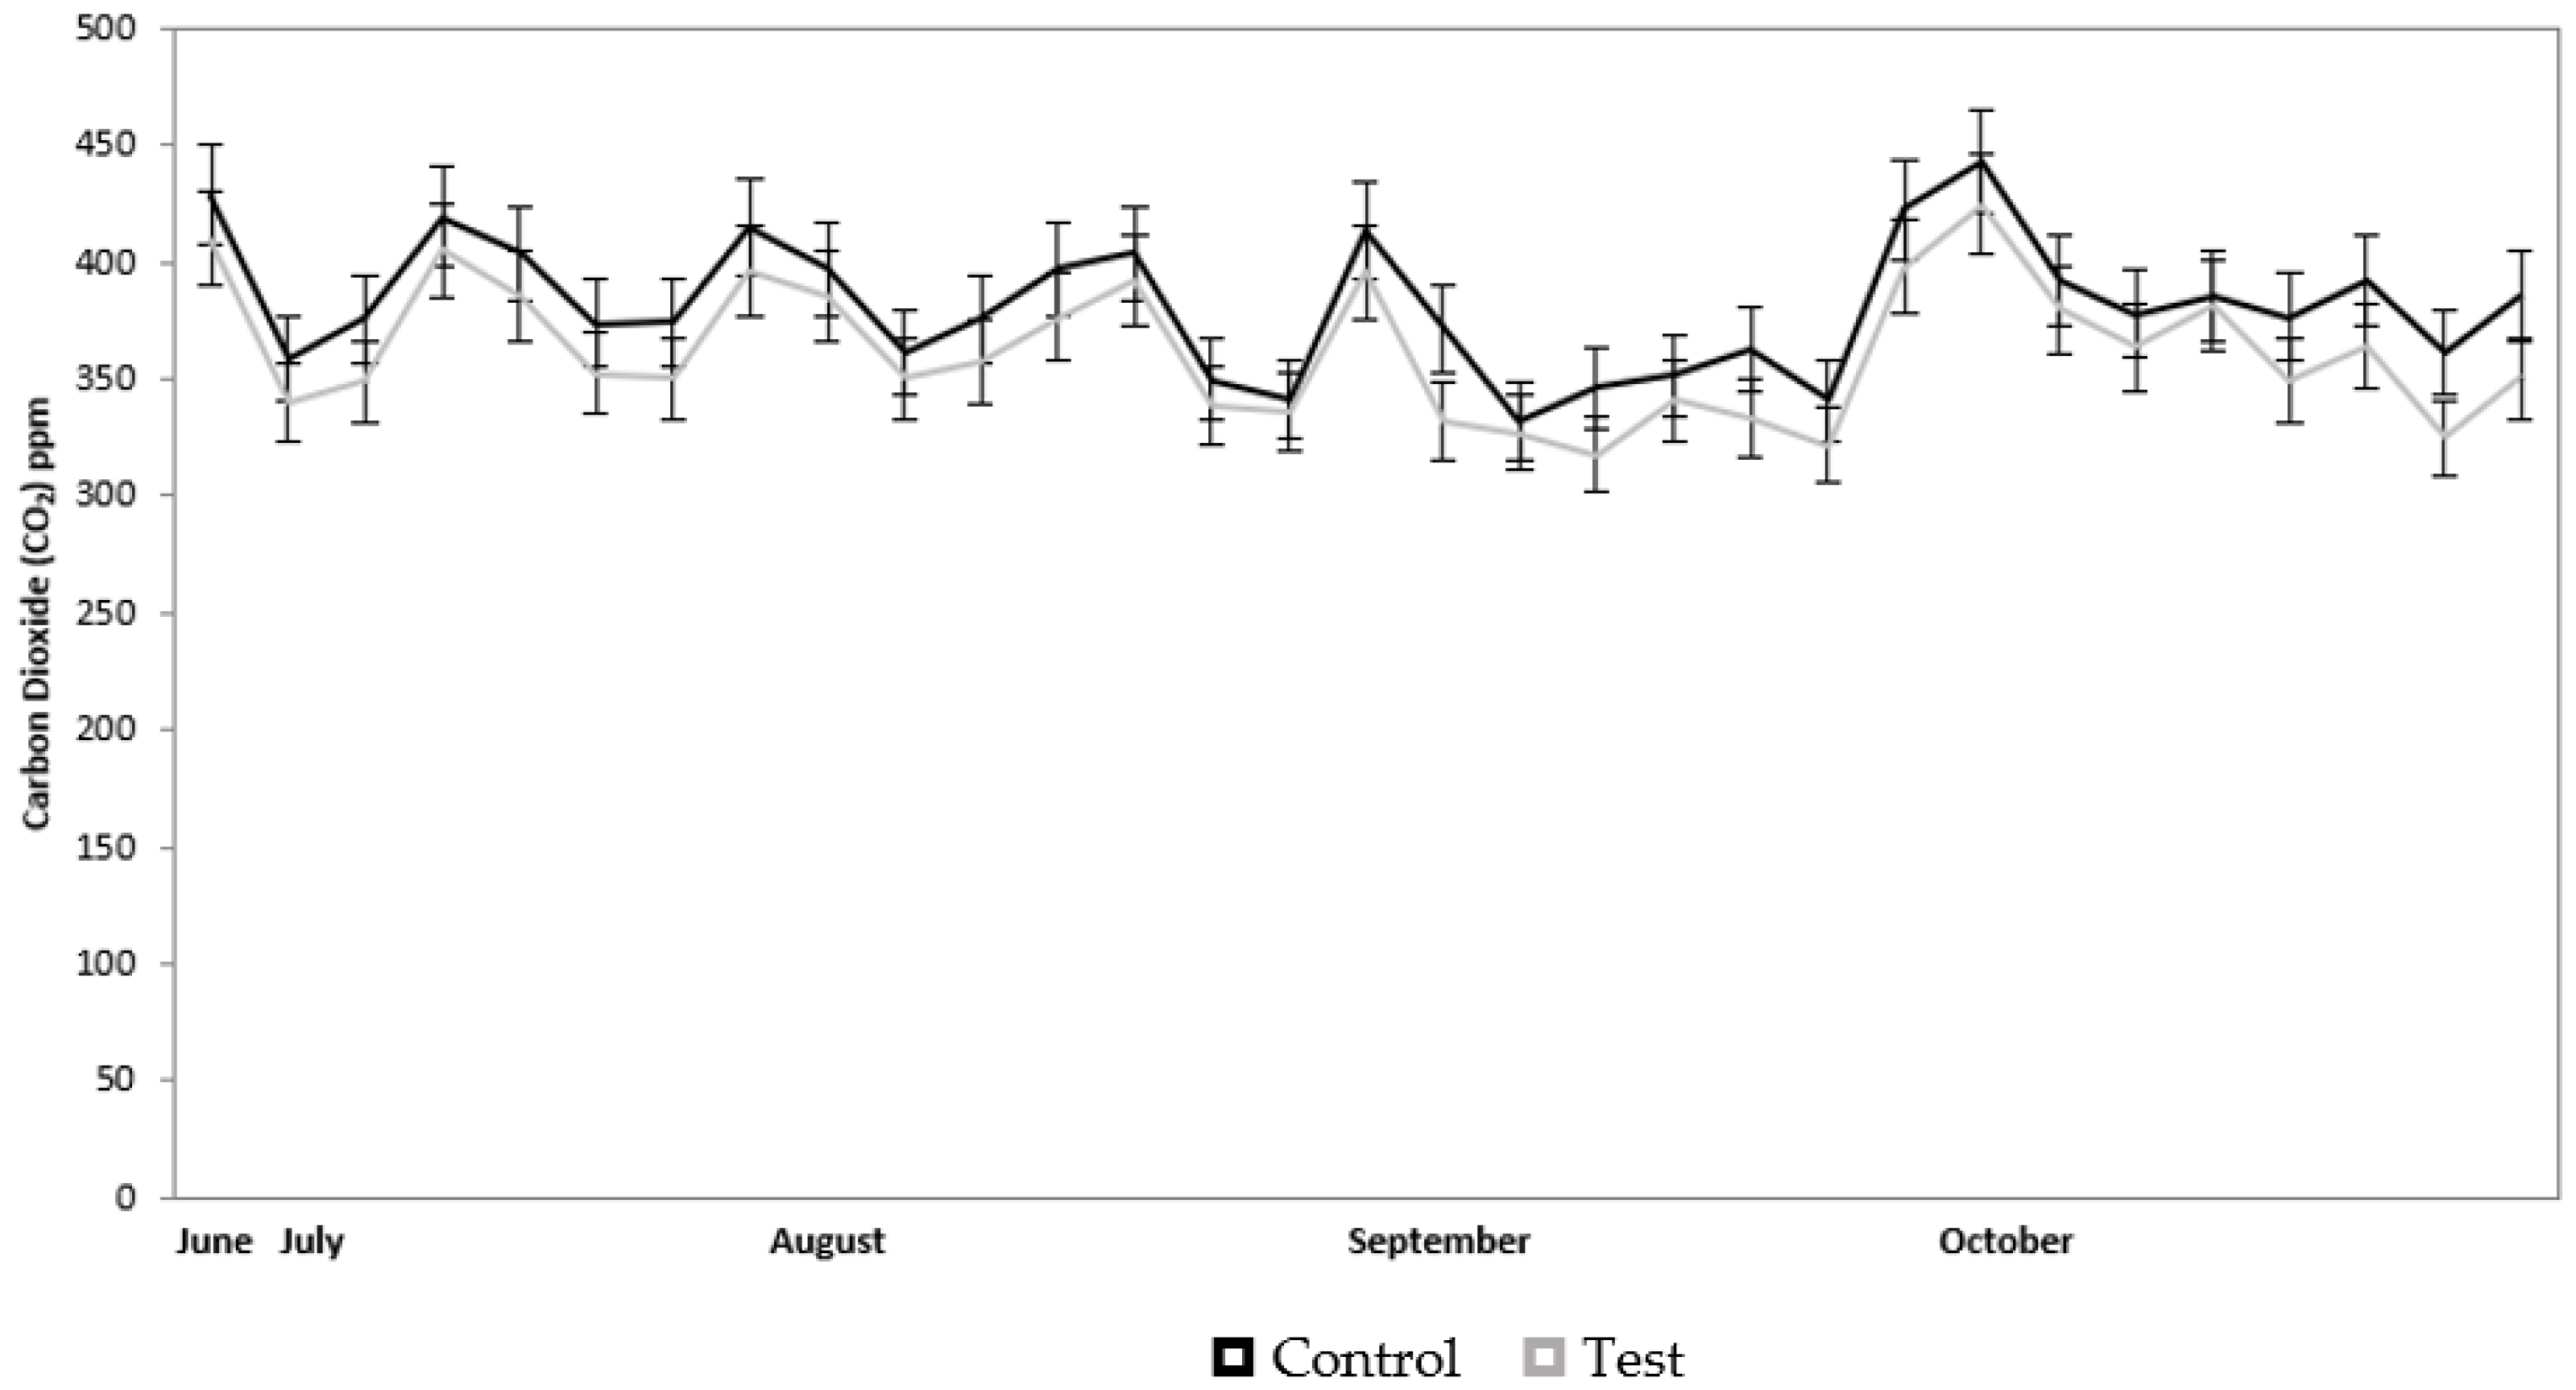
3.5. Reduction in Carbon Dioxide Concentrations
3.6. Analysis of Reduction in Carbon Dioxide Concentrations
4. Discussion
5. Conclusions
Author Contributions
Funding
Institutional Review Board Statement
Informed Consent Statement
Data Availability Statement
Acknowledgments
Conflicts of Interest
References
- Smith, P.; Bustamante, M.; Ahammad, H.; Clark, H.; Dong, H.; Elsiddig, E.A.; Haberl, H.; Harper, R.; House, J.; Jafari, M.; et al. Agriculture, Forestry and Other Land Use (AFOLU). In Climate Change 2014: Mitigation of Climate Change. Contribution of Working Group III to the Fifth Assessment Report of the Intergovernmental Panel on Climate Change; Edenhofer, O., Pichs-Madruga, R., Sokona, Y., Farahani, E., Kadner, S., Seyboth, K., Adler, A., Baum, I., Brunner, S., Eickemeier, P., et al., Eds.; Cambridge University Press: Cambridge, UK; New York, NY, USA, 2014. [Google Scholar]
- Environmental Commissioner of Ontario. Facing Climate Change: Greenhouse Gas Progress Report. Available online: http://docs.assets.eco.on.ca/reports/climate-change/2015/2015-GHG.pdf (accessed on 1 June 2021).
- Lucon, O.; Ürge-Vorsatz, D.; Zain Ahmed, A.; Akbari, H.; Bertoldi, P.; Cabeza, L.F.; Eyre, N.; Gadgil, A.; Harvey, L.D.D.; Jiang, Y.; et al. Buildings. In Climate Change 2014: Mitigation of Climate Change. Contribution of Working Group III to the Fifth Assessment Report of the Intergovernmental Panel on Climate Change; Edenhofer, O., Pichs-Madruga, R., Sokona, Y., Farahani, E., Kadner, S., Seyboth, K., Adler, A., Baum, I., Brunner, S., Eickemeier, P., et al., Eds.; Cambridge University Press: Cambridge, UK; New York, NY, USA, 2014. [Google Scholar]
- Stocker, T.F.; Qin, D.; Plattner, G.-K.; Alexander, L.V.; Allen, S.K.; Bindoff, N.L.; Bréon, F.-M.; Church, J.A.; Cubasch, U.; Emori, S.; et al. Technical Summary. In Climate Change 2013: The Physical Science Basis. Contribution of Working Group I to the Fifth Assessment Report of the Intergovernmental Panel on Climate Change; Stocker, T.F., Qin, D., Plattner, G.-K., Tignor, M., Allen, S.K., Boschung, J., Nauels, A., Xia, Y., Bex, V., Midgley, P.M., Eds.; Cambridge University Press: Cambridge, UK; New York, NY, USA, 2013. [Google Scholar]
- Fiore, A.M.; Naik, V.; Leibensperger, E.M. Air Quality and Climate Connections. J. Air Waste Manag. Assoc. 2015, 65, 645–685. [Google Scholar] [CrossRef] [PubMed]
- Jacob, D.J.; Winner, D.A. Effect of climate change on air quality. Atmos. Environ. 2009, 43, 51–63. [Google Scholar] [CrossRef] [Green Version]
- Weaver, C.; Liang, X.-Z.; Zhu, J.; Adams, P.J.; Amar, P.; Avise, J.; Caughey, M.; Chen, J.; Cohen, R.C.; Cooter, E.; et al. A Preliminary Synthesis of Modeled Climate Change Impacts on U.S. Regional Ozone Concentrations. Bull. Am. Meteorol. Soc. 2009, 90, 1843–1864. [Google Scholar] [CrossRef]
- Ordóñez, C.; Mathis, H.; Furger, M.; Henne, S.; Hüglin, C.; Staehelin, J.; Prévôt, A.S.H. Changes of daily surface ozone maxima in Switzerland in all seasons from 1992 to 2002 and discussion of summer. Atmos. Chem. Phys. Discuss. 2005, 5, 1187–1203. [Google Scholar] [CrossRef] [Green Version]
- Tressol, M.; Ordonez, C.; Zbinden, R.; Brioude, J.; Thouret, V.; Mari, C.; Nedelec, P.; Cammas, J.-P.; Smit, H.; Pätz, H.-W.; et al. Air pollution during the 2003 European heat wave as seen by MOZAIC airliners. Atmos. Chem. Phys. Discuss. 2008, 8, 2133–2150. [Google Scholar] [CrossRef] [Green Version]
- Vieno, M.; Dore, A.J.; Stevenson, D.S.; Doherty, R.; Heal, M.R.; Reis, S.; Hallsworth, S.; Tarrason, L.; Wind, P.; Fowler, D.; et al. Modelling surface ozone during the 2003 heat-wave in the UK. Atmos. Chem. Phys. Discuss. 2010, 10, 7963–7978. [Google Scholar] [CrossRef] [Green Version]
- Cohen-Shacham, E.; Walters, G.; Janzen, C.; Maginnis, S. Nature-Based Solutions to Address Global Societal Challenges; IUCN: Gland, Switzerland, 2016. [Google Scholar]
- Cohen-Shacham, E.; Andrade, A.; Dalton, J.; Dudley, N.; Jones, M.; Kumar, C.; Maginnis, S.; Maynard, S.; Nelson, C.R.; Renaud, F.G.; et al. Core principles for successfully implementing and upscaling Nature-based Solutions. Environ. Sci. Policy 2019, 98, 20–29. [Google Scholar] [CrossRef]
- Seddon, N.; Chausson, A.; Berry, P.; Girardin, C.A.J.; Smith, A.; Turner, B. Understanding the value and limits of nature-based solutions to climate change and other global challenges. Philos. Trans. R. Soc. B Biol. Sci. 2020, 375, 20190120. [Google Scholar] [CrossRef] [PubMed] [Green Version]
- Anderson, V. Deep Adaptation: A Framework for Climate Resilience, Decarbonization and Planetary Health. Ph.D. Thesis, University of Toronto, Toronto, ON, Canada, 2018. Available online: https://tspace.library.utoronto.ca/ (accessed on 1 June 2021).
- Anderson, V.; Gough, W.A. Evaluating the potential of nature-based solutions to reduce ozone, nitrogen dioxide, and carbon dioxide through a multi-type green infrastructure study in Ontario, Canada. City Environ. Interact. 2020, 6, 100043. [Google Scholar] [CrossRef]
- Anderson, V.; Gough, W.A. Nature-based cooling potential: A multi-type green infrastructure evaluation in Toronto, Ontario, Canada. Int. J. Biometeorol. 2021, 6, 1–13. [Google Scholar] [CrossRef]
- Anderson, V.; Gough, W. Harnessing the Four Horsemen of Climate Change: A Framework for Deep Resilience, Decarbonization, and Planetary Health in Ontario, Canada. Sustainability 2021, 13, 379. [Google Scholar] [CrossRef]
- Anderson, V.; Gough, W.A. Form, function, and nomenclature: Deconstructing green infrastructure and its role in a changing climate. In Climate Change and Extreme Events; Elsevier BV: Amsterdam, The Netherlands, 2021; pp. 125–144. [Google Scholar]
- Anderson, V.; Gough, W.; Agic, B. Nature-Based Equity: An Assessment of the Public Health Impacts of Green Infrastructure in Ontario Canada. Int. J. Environ. Res. Public Health 2021, 18, 5763. [Google Scholar] [CrossRef]
- Thevathasan, N.V.; Gordon, A.M. Ecology of tree intercropping systems in the North temperate region: Experiences from southern Ontario, Canada. Adv. Agrofor. 2004, 61, 257–268. [Google Scholar] [CrossRef]
- Jose, S. Agroforestry for ecosystem services and environmental benefits: An overview. Agrofor. Syst. 2009, 76, 1–10. [Google Scholar] [CrossRef]
- Evers, A.K.; Bambrick, A.; Lacombe, S.; Dougherty, M.C.; Peichl, M.; Gordon, A.M.; Thevathasan, N.V.; Whalen, J.; Bradley, R.L. Potential Greenhouse Gas Mitigation through Temperate Tree-Based Intercropping Systems. Open Agric. J. 2010, 4, 49–57. [Google Scholar] [CrossRef] [Green Version]
- Thevathasan, N.V.; Coleman, B.; Zabek, L.; Ward, T.; Gordon, A.M. Agroforestry in Canada and its role in farming systems. In Temperate Agroforestry Systems; Gordon, A.M., Newman, S.M., Coleman, B.R.W., Eds.; CABI Publishing: Wallingford, UK, 2018; pp. 7–49. [Google Scholar] [CrossRef]
- Rowe, D.B. Green roofs as a means of pollution abatement. Environ. Pollut. 2011, 159, 2100–2110. [Google Scholar] [CrossRef] [PubMed] [Green Version]
- Plascencia-Escalante, F. An analysis of some components of the nitrogen cycle as affected by land use adjacent to the riparian zone of a Southern Ontario stream. Ph.D. Thesis, University of Guelph, Guelph, ON, Canada, 2008. [Google Scholar]
- Lin, B.; Philpott, S.; Jha, S. The future of urban agriculture and biodiversity-ecosystem services: Challenges and next steps. Basic Appl. Ecol. 2015, 16, 189–201. [Google Scholar] [CrossRef]
- Hillel, D.; Rosenzweig, C. Biodiversity and food production. In Sustaining Life: How Human Health Depends on Biodiversity; Chivian, E., Bernstein, A., Eds.; Oxford University Press: New York, NY, USA, 2008; pp. 325–381. [Google Scholar]
- Coutts, C.; Hahn, M. Green Infrastructure, Ecosystem Services, and Human Health. Int. J. Environ. Res. Public Health 2015, 12, 9768–9798. [Google Scholar] [CrossRef] [Green Version]
- Thevathasan, N.V.; Gordon, A.M.; Bradley, R.; Cogliastro, A.; Folkard, P.; Grant, R.; Kort, J.; Liggins, L.; Njenga, F.; Olivier, A.; et al. Agroforestry Research and Development in Canada: The Way Forward. In Agroforestry—The Future of Global Land Use; Springer: Dordrecht, The Netherlands, 2012; pp. 247–283. [Google Scholar] [CrossRef]
- Wotherspoon, A.; Thevathasan, N.V.; Gordon, A.M.; Voroney, R.P. Carbon sequestration potential of five tree species in a 25-year-old temperate tree-based intercropping system in southern Ontario, Canada. Agrofor. Syst. 2014, 88, 631–643. [Google Scholar] [CrossRef]
- Oberndorfer, E.; Lundholm, J.; Bass, B.; Coffman, R.R.; Doshi, H.; Dunnett, N.; Gaffin, S.; Köhler, M.; Liu, K.K.Y.; Rowe, B. Green Roofs as Urban Ecosystems: Ecological Structures, Functions, and Services. Bioscience 2007, 57, 823–833. [Google Scholar] [CrossRef]
- Parkins, K.; Clark, J. Green roofs provide habitat for urban bats. Glob. Ecol. Conserv. 2015, 4, 349–357. [Google Scholar] [CrossRef] [Green Version]
- Tonietto, R.; Fant, J.; Ascher, J.; Ellis, K.; Larkin, D. A comparison of bee communities of Chicago green roofs, parks and prairies. Landsc. Urban Plan. 2011, 103, 102–108. [Google Scholar] [CrossRef]
- Hedin, L.O. Deposition of Nutrients and Pollutants to Ecosystems. In Methods in Ecosystem Science; Springer: New York, NY, USA, 2000; pp. 265–276. [Google Scholar]
- Nowak, D.J.; Crane, D.E.; Stevens, J.C. Air pollution removal by urban trees and shrubs in the United States. Urban For. Urban Green. 2006, 4, 115–123. [Google Scholar] [CrossRef]
- Kleerekoper, L.; Esch, M.P.-V.; Salcedo, T.B. How to make a city climate-proof, addressing the urban heat island effect. Resour. Conserv. Recycl. 2012, 64, 30–38. [Google Scholar] [CrossRef]
- Rao, M.; George, L.A.; Rosenstiel, T.N.; Shandas, V.; Dinno, A. Assessing the relationship among urban trees, nitrogen dioxide, and respiratory health. Environ. Pollut. 2014, 194, 96–104. [Google Scholar] [CrossRef]
- King, K.L.; Johnson, S.; Kheirbek, I.; Lu, J.W.; Matte, T. Differences in magnitude and spatial distribution of urban forest pollution deposition rates, air pollution emissions, and ambient neighborhood air quality in New York City. Landsc. Urban Plan. 2014, 128, 14–22. [Google Scholar] [CrossRef]
- Gourdji, S. Review of plants to mitigate particulate matter, ozone as well as nitrogen dioxide air pollutants and applicable recommendations for green roofs in Montreal, Quebec. Environ. Pollut. 2018, 241, 378–387. [Google Scholar] [CrossRef]
- Nowak, D.J.; Hirabayashi, S.; Doyle, M.; McGovern, M.; Pasher, J. Air pollution removal by urban forests in Canada and its effect on air quality and human health. Urban For. Urban Green. 2018, 29, 40–48. [Google Scholar] [CrossRef]
- Sicard, P.; Agathokleous, E.; Araminiene, V.; Carrari, E.; Hoshika, Y.; De Marco, A.; Paoletti, E. Should we see urban trees as effective solutions to reduce increasing ozone levels in cities? Environ. Pollut. 2018, 243, 163–176. [Google Scholar] [CrossRef]
- Yang, J.; Yu, Q.; Gong, P. Quantifying air pollution removal by green roofs in Chicago. Atmos. Environ. 2008, 42, 7266–7273. [Google Scholar] [CrossRef]
- Baik, J.-J.; Kwak, K.-H.; Park, S.-B.; Ryu, Y.-H. Effects of building roof greening on air quality in street canyons. Atmos. Environ. 2012, 61, 48–55. [Google Scholar] [CrossRef]
- Vos, P.E.; Maiheu, B.; Vankerkom, J.; Janssen, S. Improving local air quality in cities: To tree or not to tree? Environ. Pollut. 2013, 183, 113–122. [Google Scholar] [CrossRef] [PubMed]
- Bottalico, F.; Chirici, G.; Giannetti, F.; De Marco, A.; Nocentini, S.; Paoletti, E.; Salbitano, F.; Sanesi, G.; Serenelli, C.; Travaglini, D. Air Pollution Removal by Green Infrastructures and Urban Forests in the City of Florence. Agric. Agric. Sci. Procedia 2016, 8, 243–251. [Google Scholar] [CrossRef] [Green Version]
- Tan, P.Y.; Sia, A. A pilot green roof research project in Singapore. In Proceedings of the Third Annual Greening Rooftops for Sustainable Communities Conference, Awards and Trade Show, Washington, DC, USA, 4–6 May 2005. [Google Scholar]
- Speak, A.; Rothwell, J.; Lindley, S.; Smith, C. Urban particulate pollution reduction by four species of green roof vegetation in a UK city. Atmos. Environ. 2012, 61, 283–293. [Google Scholar] [CrossRef]
- Abhijith, K.; Kumar, P.; Gallagher, J.; McNabola, A.; Baldauf, R.; Pilla, F.; Broderick, B.; DI Sabatino, S.; Pulvirenti, B. Air pollution abatement performances of green infrastructure in open road and built-up street canyon environments—A review. Atmos. Environ. 2017, 162, 71–86. [Google Scholar] [CrossRef]
- Janhäll, S. Review on urban vegetation and particle air pollution—Deposition and dispersion. Atmos. Environ. 2015, 105, 130–137. [Google Scholar] [CrossRef]
- Abjihith, K.V.; Kumar, P. Field investigations for evaluating green infrastructure effects on air quality in open-road conditions. Atmos. Environ. 2019, 201, 132–147. [Google Scholar] [CrossRef]
- Taleghani, M.; Clark, A.; Swan, W.; Mohegh, A. Air pollution in a microclimate; the impact of different green barriers on the dispersion. Sci. Total Environ. 2020, 711, 134649. [Google Scholar] [CrossRef]
- Demuzere, M.; Orru, K.; Heidrich, O.; Olazabal, E.; Geneletti, D.; Orru, H.; Bhave, A.G.; Mittal, N.; Feliu, E.; Faehnle, M. Mitigating and adapting to climate change: Multi-functional and multi-scale assessment of green urban infrastructure. J. Environ. Manag. 2014, 146, 107–115. [Google Scholar] [CrossRef] [PubMed]
- Whittinghill, L.J.; Rowe, D.B.; Schutzki, R.; Cregg, B.M. Quantifying carbon sequestration systems of various green roof and ornamental landscape sys-tems. Landsc. Urban Plan. 2014, 123, 41–48. [Google Scholar] [CrossRef]
- Li, J.-F.; Wai, O.W.; Li, Y.; Zhan, J.-M.; Ho, Y.A.; Li, J.; Lam, E.S.S. Effect of green roof on ambient CO2 concentration. Build. Environ. 2010, 45, 2644–2651. [Google Scholar] [CrossRef]
- Velasco, E.; Roth, M.; Norford, L.; Molina, L.T. Does urban vegetation enhance carbon sequestration? Landsc. Urban Plan. 2016, 148, 99–107. [Google Scholar] [CrossRef]
- Montagnini, F.; Nair, P.K.R. Carbon sequestration: An underexploited environmental benefit of agroforestry systems. Adv. Agrofor. 2004, 61, 281–295. [Google Scholar] [CrossRef]
- Peichl, M.; Thevathasan, N.V.; Gordon, A.M.; Huss, J.; Abohassan, R.A. Carbon Sequestration Potentials in Temperate Tree-Based Intercropping Systems, Southern Ontario, Canada. Agrofor. Syst. 2006, 66, 243–257. [Google Scholar] [CrossRef]
- Berardi, U.; Amir Hosein, G.H.; Ali, G. State-of-the-art analysis of the environmental benefits of green roofs. Appl. Energy 2014, 15, 411–428. [Google Scholar] [CrossRef]
- Thornbush, M. Urban agriculture in the transition to low carbon cities through urban greening. AIMS Environ. Sci. 2015, 2, 852–867. [Google Scholar] [CrossRef]
- Environmental Protection Agency (EPA). EPA Combines Expertise with New Zealand Company to Advance Air Sensor Technologies. 2019. Available online: https://www.epa.gov/sciencematters/epa-combines-expertise-new-zealand-company-advance-air-sensor-technologies (accessed on 1 June 2021).

Publisher’s Note: MDPI stays neutral with regard to jurisdictional claims in published maps and institutional affiliations. |
© 2021 by the authors. Licensee MDPI, Basel, Switzerland. This article is an open access article distributed under the terms and conditions of the Creative Commons Attribution (CC BY) license (https://creativecommons.org/licenses/by/4.0/).
Share and Cite
Anderson, V.; Gough, W.A. Nature-Based Resilience: A Multi-Type Evaluation of Productive Green Infrastructure in Agricultural Settings in Ontario, Canada. Atmosphere 2021, 12, 1183. https://doi.org/10.3390/atmos12091183
Anderson V, Gough WA. Nature-Based Resilience: A Multi-Type Evaluation of Productive Green Infrastructure in Agricultural Settings in Ontario, Canada. Atmosphere. 2021; 12(9):1183. https://doi.org/10.3390/atmos12091183
Chicago/Turabian StyleAnderson, Vidya, and William A. Gough. 2021. "Nature-Based Resilience: A Multi-Type Evaluation of Productive Green Infrastructure in Agricultural Settings in Ontario, Canada" Atmosphere 12, no. 9: 1183. https://doi.org/10.3390/atmos12091183
APA StyleAnderson, V., & Gough, W. A. (2021). Nature-Based Resilience: A Multi-Type Evaluation of Productive Green Infrastructure in Agricultural Settings in Ontario, Canada. Atmosphere, 12(9), 1183. https://doi.org/10.3390/atmos12091183