Article

Optimizing the Knowledge on Residential Heating Characteristics in Greece via Crowd-Sourcing Approach

by
Kyriaki-Maria Fameli
*,
Katerina Papagiannaki
and
Vassiliki Kotroni
Institute for Environmental Research and Sustainable Development, National Observatory of Athens, 152 36 Athens, Greece
*
Author to whom correspondence should be addressed.
Atmosphere 2021, 12(9), 1178; https://doi.org/10.3390/atmos12091178
Submission received: 29 July 2021 / Revised: 3 September 2021 / Accepted: 8 September 2021 / Published: 13 September 2021
(This article belongs to the Special Issue Air Quality in Greece)

Abstract

:
Households have been pointed out as a significant source of air pollution and climate change. In Europe, the 60% of energy used by households is for space heating. The present work focuses on improving the knowledge on residential heating characteristics in Greece. The full causal chain, from the appliances used to the pollutants emitted, is examined at thelocal scale. A crowdsourcing approach was followed for the collection of the necessary data for performing the emissions calculations. With the use of a Geographic Information System (GIS), dynamic maps were produced for each Greek region, providing the information produced in this study in gridded form. In terms of energy demands, it was found that Greece relies mainly on oil and biomass and secondarily on gas and electricity. The use of biomass burning as a main heating fuel is quite high inthe colder and rural areas, while it is popular as a secondary heating fuel inthe urban areas. The residential heating period in Greece lasts from October to April and it is even shorter in southern Greece. In terms of emissions, CO and PM10 had the highest values since they are related to biomass burning. NOx emissions are mainly emitted by the oil burned in boilers.

1. Introduction

The most common purposes that households use energy for are space heating and cooling, water heating, cooking, lighting and the operation of multiple electrical appliances. According to the Eurostat database, in 2018 the residential sector represented 26.10% of the energy consumption in the European Union (EU). The main use of energy in households was for space heating (63.61% of the total residential energy consumption), with renewable fuels accounting for more than a quarter (27.05%). Gas also played an essential role in terms of space heating (37.97%), while derived heat and oil products covered 10.57% and 14.14%, respectively, and electricity only 5.22% (source: Eurostat, online codes: nrg_bal_c, nrg_d_hhq). Pollutants emitted from the combustion process are related to the type and quality of the fuel and the appliance used. In many cases, the heating equipment may be outdated, inefficient and thus polluting. Moreover, the energy efficiency of the fuel and the appliance is a key factor for the overall plan for household expenditures and sustainable development in general. It is true that emissions from heating activities affect both air quality and climate change. The residential sector contributes by 27% and 17% to global energy consumption and CO2 emissions [1]. To meet the commitment for net-zero carbon emissions by 2050 requires a significant change of heating technologies and fuels. Among the most impactful changes for the residential sector low carbon heating devices and the use of renewable energy are considered [2]. As a result, many researchers have laid down new, unprecedented targets for frontier heating appliances and fuels that are conducive to green energy production and lower emissions. Studies have focused on comparisons of the fuels’ characteristics in order to propose the optimum fuel for each case [3,4], the production of biofuels ([5] and references therein), as well as the improvement of the fuels’ characteristics [6,7], such as chemical structure [8], that will consequently benefit energy saving and emissions.
In order to advance our knowledge about the parameters that define air quality, it is important to conduct micro-level research [9] by examining local and regional sources [10] as well as the spatial distribution of emissions, activity data and energy consumption profiles [11,12].At the local scale, for residential heating Greece relies mainly on oil and petroleum products (43.02%), renewable and wastes (36.18%, incl. biomass) and secondarily on gas (13.61%), electricity (4.79%), derived heat (2.23%) and solid fuels (0.17%) (source: Eurostat, online codes: nrg_bal_c, nrg_d_hhq). It is very interesting that the energy consumption profile has significantly changed over the last decade in Greece in favor of biomass (27.07 PJ in 2006 compared to 35.67 PJ in 2017) and gas consumption (5.22 PJ in 2006 compared to 13.03 PJ in 2017, source: Odyssee–Mure project, https://www.odyssee-mure.eu/ (accessed on 5 April 2020)). The factors behind the above shift are mainly: (a) the lift of the ban on biomass usage for space heating (in force since 1993) in 2011 (Ministerial Decision 189533/7.11.2011); and (b) the economic crisis. The low cost of solid biofuels (wood, pellets, and briquettes) compared to oil was an important parameter for the spread of their use [13,14]. Fameli and Assimakopoulos [15] have developed the FEI-GREGAA emissions inventory for Greece, revealing important sources and pollutants. A bottom up approach will reveal the parameters that define the characteristics of residential heating and will lead to proposals towards greener solutions [16]. However, this is not always possible due to the fact that energy consumption and/or heating appliances data, which are necessary, are missing. In recent years, scientists have tried to develop bottom up emission inventories [17] and models [18,19] for calculating the national [20] or regional emissions from residential heating, as well as to improve the emission factors used for the calculation of emissions [20,21,22,23]. The administration of a survey is a common approach used by the scientific community for the collection of missing activity and socioeconomic data [24,25,26,27,28] at a finer spatial scale (e.g., region, regional units, city) [29].
The present work focuses on improving the knowledge about residential heating characteristics in Greece. Our motivation is to examine the full causal chain from the appliances used to the pollutants emitted in certain areas. The objectives are to: (1) evaluate the prospect of calculating the missing data based on the collection of citizens’ localized insights; (2) record people’s perspectives on biomass burning; and (3) develop temporal profiles of the heating activity. The novelty of this work is that both the main and the secondary heating appliances were recorded, as well as the type of fuel used in Greece and the relationship between emissions and other parameters (e.g., socioeconomic conditions, residence’s characteristics) was also established. With the use of a Geographic Information System (GIS), dynamic maps were produced for each region in Greece, providing the information produced in this study in gridded form.

2. Materials and Methods

The residential heating emissions were calculated for the period 2006–2017 for Greece based on the Tier 2 approach proposed by the EMEP/EAA Emission Inventory Guidebook 2019 [30]. Equation (1) was used for the calculation of the annual emissions.
E i = j ,   k EF i ,   j ,   k × A j ,   k ,
where
E i is the annual emission value of pollutant I;
EF i ,   j ,   k is the emission factor for pollutant i, source category j and fuel k;
A j ,   k is the annual consumption of fuel type k and source j.
Calculated pollutants are SO2, NOX, CO, NMVOC, SOx, NH3, particulate matter (PM10 and PM2.5), black carbon (BC), heavy metals (Pb, Cd, Hg, As, Cr, Cu, Ni, Se, Zn), polycyclic aromatic hydrocarbons (PAHs), polychlorinated biphenyls (PCBs), polychlorinated dibenzo-dioxins and furans (PCDD/F) and hexachlorobenzene (HCB). The main sources used for residential heating in Greece are boilers, fireplaces (open and advanced) and stoves (conventional and advanced). Furthermore, with the use of the survey responses, emissions were calculated for each region of Greece for the year 2017.

2.1. Energy Consumption

In the present study, emissions were calculated for Greece from 2006 to 2017 using the energy consumption data provided by the Odyssee–Mure project and for each Greek region for the year 2017 based on energy consumption data from the residential sector (including heating, cooking, cooling), provided by the Hellenic Statistical Authority (ELSTAT) in the frame of the Household Budget Survey (HBS, https://www.statistics.gr/el/statistics/-/publication/SFA05/- (accessed on 30 January 2020)) [31].
As presented in Figure 1, the overall energy needs for space heating in Greece are covered mainly by heating oil (72.86% in 2006 and 46.64% in 2017 out of the total consumption for heating), wood (16.59% in 2006 and 32.65% in 2017), and secondarily by electricity (5.89% in 2006 and 9.74% in 2017) and gas (3.20% in 2006 and 11.93% in 2017). Despite the fact that oil is the most common fuel in Greek households, consumption has experienced a significant decrease from 2006 to 2013, with the exception of the years 2011 and 2012. The percentage difference is 68.09% (118.90 PJ in 2006 and 37.94 PJ in 2013). This can be justified by the subsequent changes to the price of heating oil, which reached an approximately 89% increase from 2009 to 2013 [14]. However, the increase observed in wood consumption from 2011 (22.93% compared to the year 2010) cannot replace the abrupt drop in oil consumption, indicating that people either preferred not to heat their residences because of economic difficulties or the wood trade was not sufficiently recorded by the official authorities. The possibility of using wood from personal resources is also significant in many areas. Concerning the other energy types, electricity consumption remained rather stable during the whole period (at about 10 PJ) while an increase was observed in gas consumption from 2006 to 2011 (7.36 PJ); values remained rather stable from 2015 onwards (about 13 PJ). The contribution of coal and heat to the total energy consumption was rather small; for heat it ranged from 1.12% (2007) to 2.25% (2014) and for coal the respective range was 0.01–0.11%.
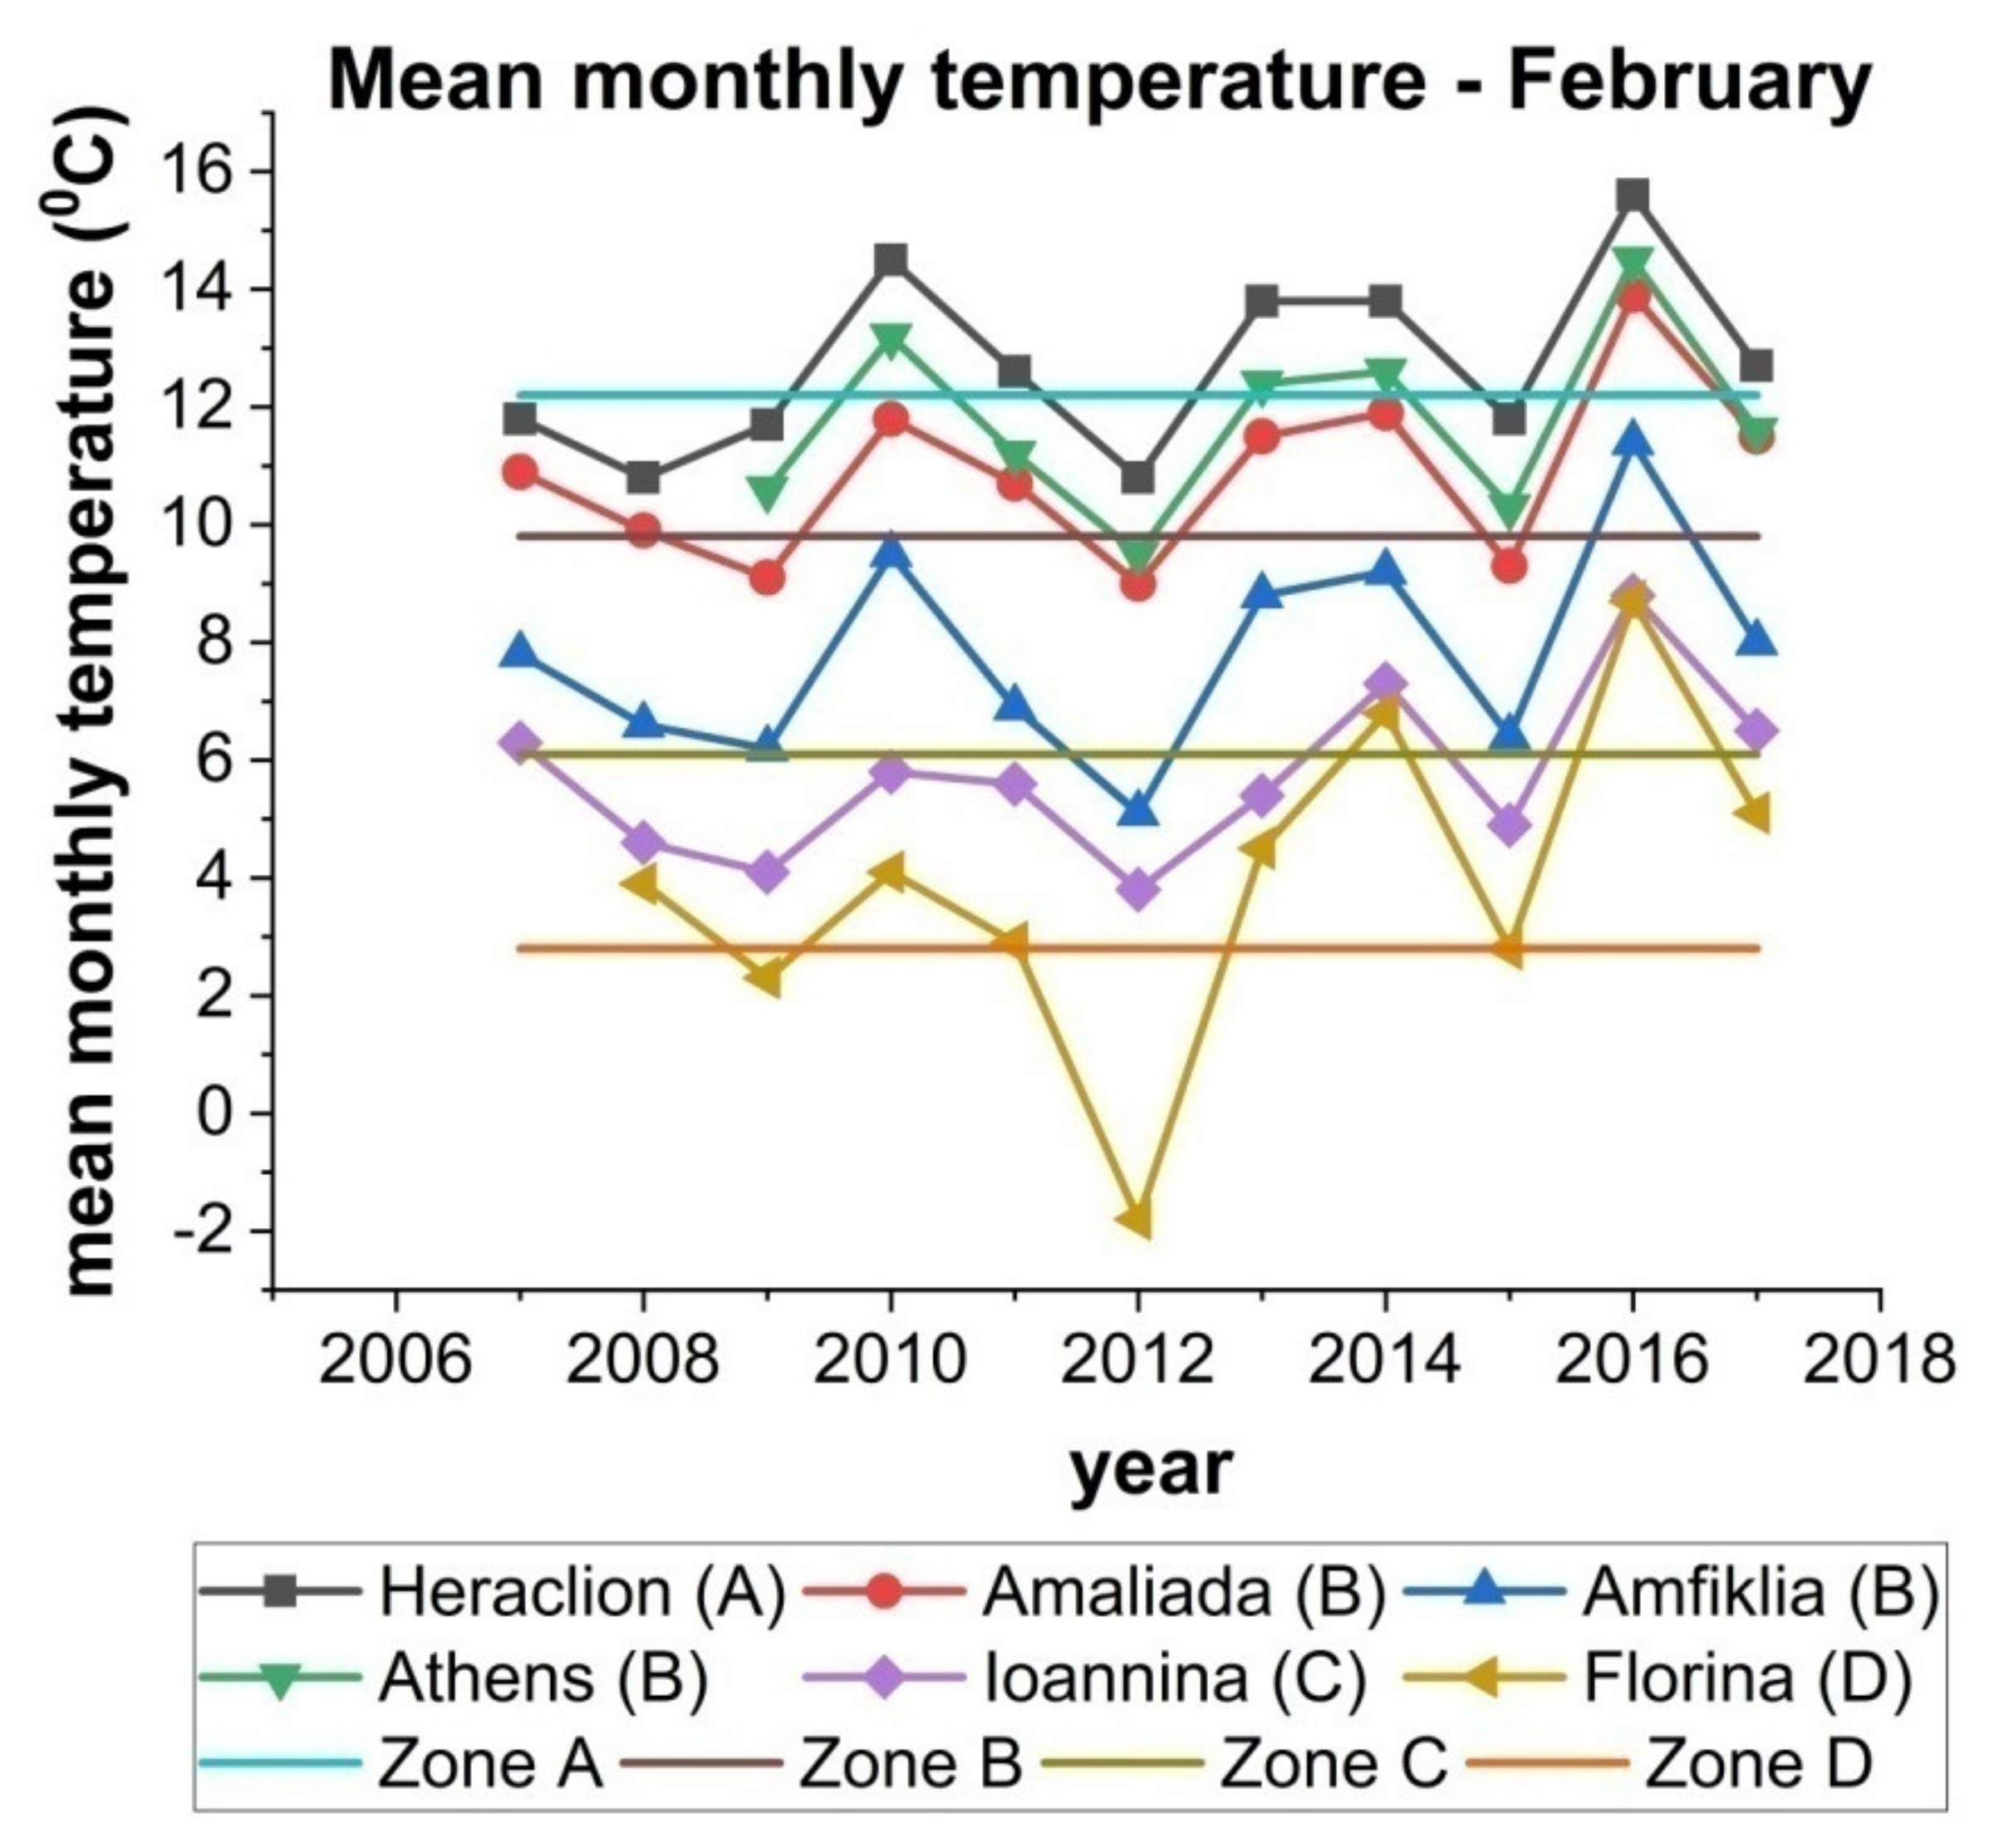
Meteorological conditions define the heating period and consequently the energy consumption. Lower temperatures result in higher energy demands. The three peaks observed in Figure 1 are due to the cold winters of the years 2011, 2012 and 2015. As recorded by the meteorological stations of the METEO network (www.meteo.gr (accessed on 2 February 2021)) [32], the mean monthly temperature for February dropped abruptly in the above-mentioned years (Figure 2). Indicatively, at the Florina station, the temperature difference from 2010 to 2012 was 5.90 °C, and 4.00 °C from 2014 to 2015, while for the Athens station the respective changes were 3.70 °C and 2.30 °C. However, the highest peak in oil consumption is observed in 2011 and not in 2012 as expected, probably because people preferred other energy types such as wood and electricity or they had stored energy supplies from the previous year. In general, the total energy consumption by households exhibited low values after 2013 (163.20 PJ in 2006, 91.13 PJ in 2013 and 109.22 PJ in 2017), depicting an overall reduction in energy consumption for residential heating. Consequently, different or complementary approaches should be followed to better record biomass consumption and to reveal the possible reasons behind the overall decrease in energy consumption.
When the area of study is of finer spatial resolution, the information needs to be more precise since emissions are highly related to climatic conditions. Due to the complex topography of the Greek regions, there are many differences in the existing meteorological conditions which consequently define the energy consumption. According to the “Energy Performance Buildings Regulation” (KENAK), Greece is subdivided into four climatic zones ([33] and references therein) indicative of the heating days; Zone A is the warmest and Zone D the coldest. Based on the HBS data, electricity (53.26%) and oil (26.75%) prevail among the other types of energy in Attica—the most populated region of Greece. Wood consumption is significant in eastern Macedonia and Thrace, Central Macedonia, Thessaly and Crete (42.37%, 29.22%, 34.34% and 40.36%ofthe total energy consumption, respectively) compared to oil consumption (28.23%, 25.00%, 26.70% and 21.45%, respectively), indicating higher biomass burning in rural areas compared to the densely populated ones (in agreement with [17]).The contribution of natural gas in regions in which a distribution network is available should be highlighted (14.54%, 13.29% and 7.14%in Central Macedonia, Thessaly and Attica, respectively). In addition, the mean monthly consumption of natural gas has increased in Thessaly and Attica from 2015 to 2019 by 43.10% and 48.48%, respectively.
As presented above, energy consumption data for Greece are provided by the statistical authorities on an annual basis, without including the information about the energy consumed by each type of heating appliance. However, for the calculation of the annual emissions it is necessary that these data be further separated in such a way as to represent only the consumption for space heating and be distinguished for each type of appliance. As a result, a methodology for the disaggregation of the national data at the local scale was developed, the temporal variation of the energy consumption was recorded and the amount of each fuel was attributed to different heating appliances with the help of a survey that was conducted in the frame of this study.

2.2. Crowdsourcing Data Collection

To decipher the residential heating profile of the Greek regions and overcome the multiple uncertainties concerning the calculation of annual emissions (e.g., the energy consumption by each type of appliance, use of multiple heating appliances) and the spatial and temporal allocation of them, an online survey was designed and conducted from December 2018 to January 2019 through the www.meteo.gr (accessed on 7 September 2021) website. Six objectives were set out in order to retrieve the maximum information from the survey responses: (i) determination of the main and secondary heating appliance types (e.g., boilers, stoves, fireplaces) as well as the geographic distribution of them; (ii) connection of the type of appliance with the fuel used (e.g., oil, gas, pellet, electricity); (iii) the monthly, daily and hourly activity profiles; (iv) understanding the reason(s) for preferring biomass burning; (v) estimation of the volume of biomass burned; and (vi) recording people’s perceptions regarding the performance efficiency of the heating appliances.
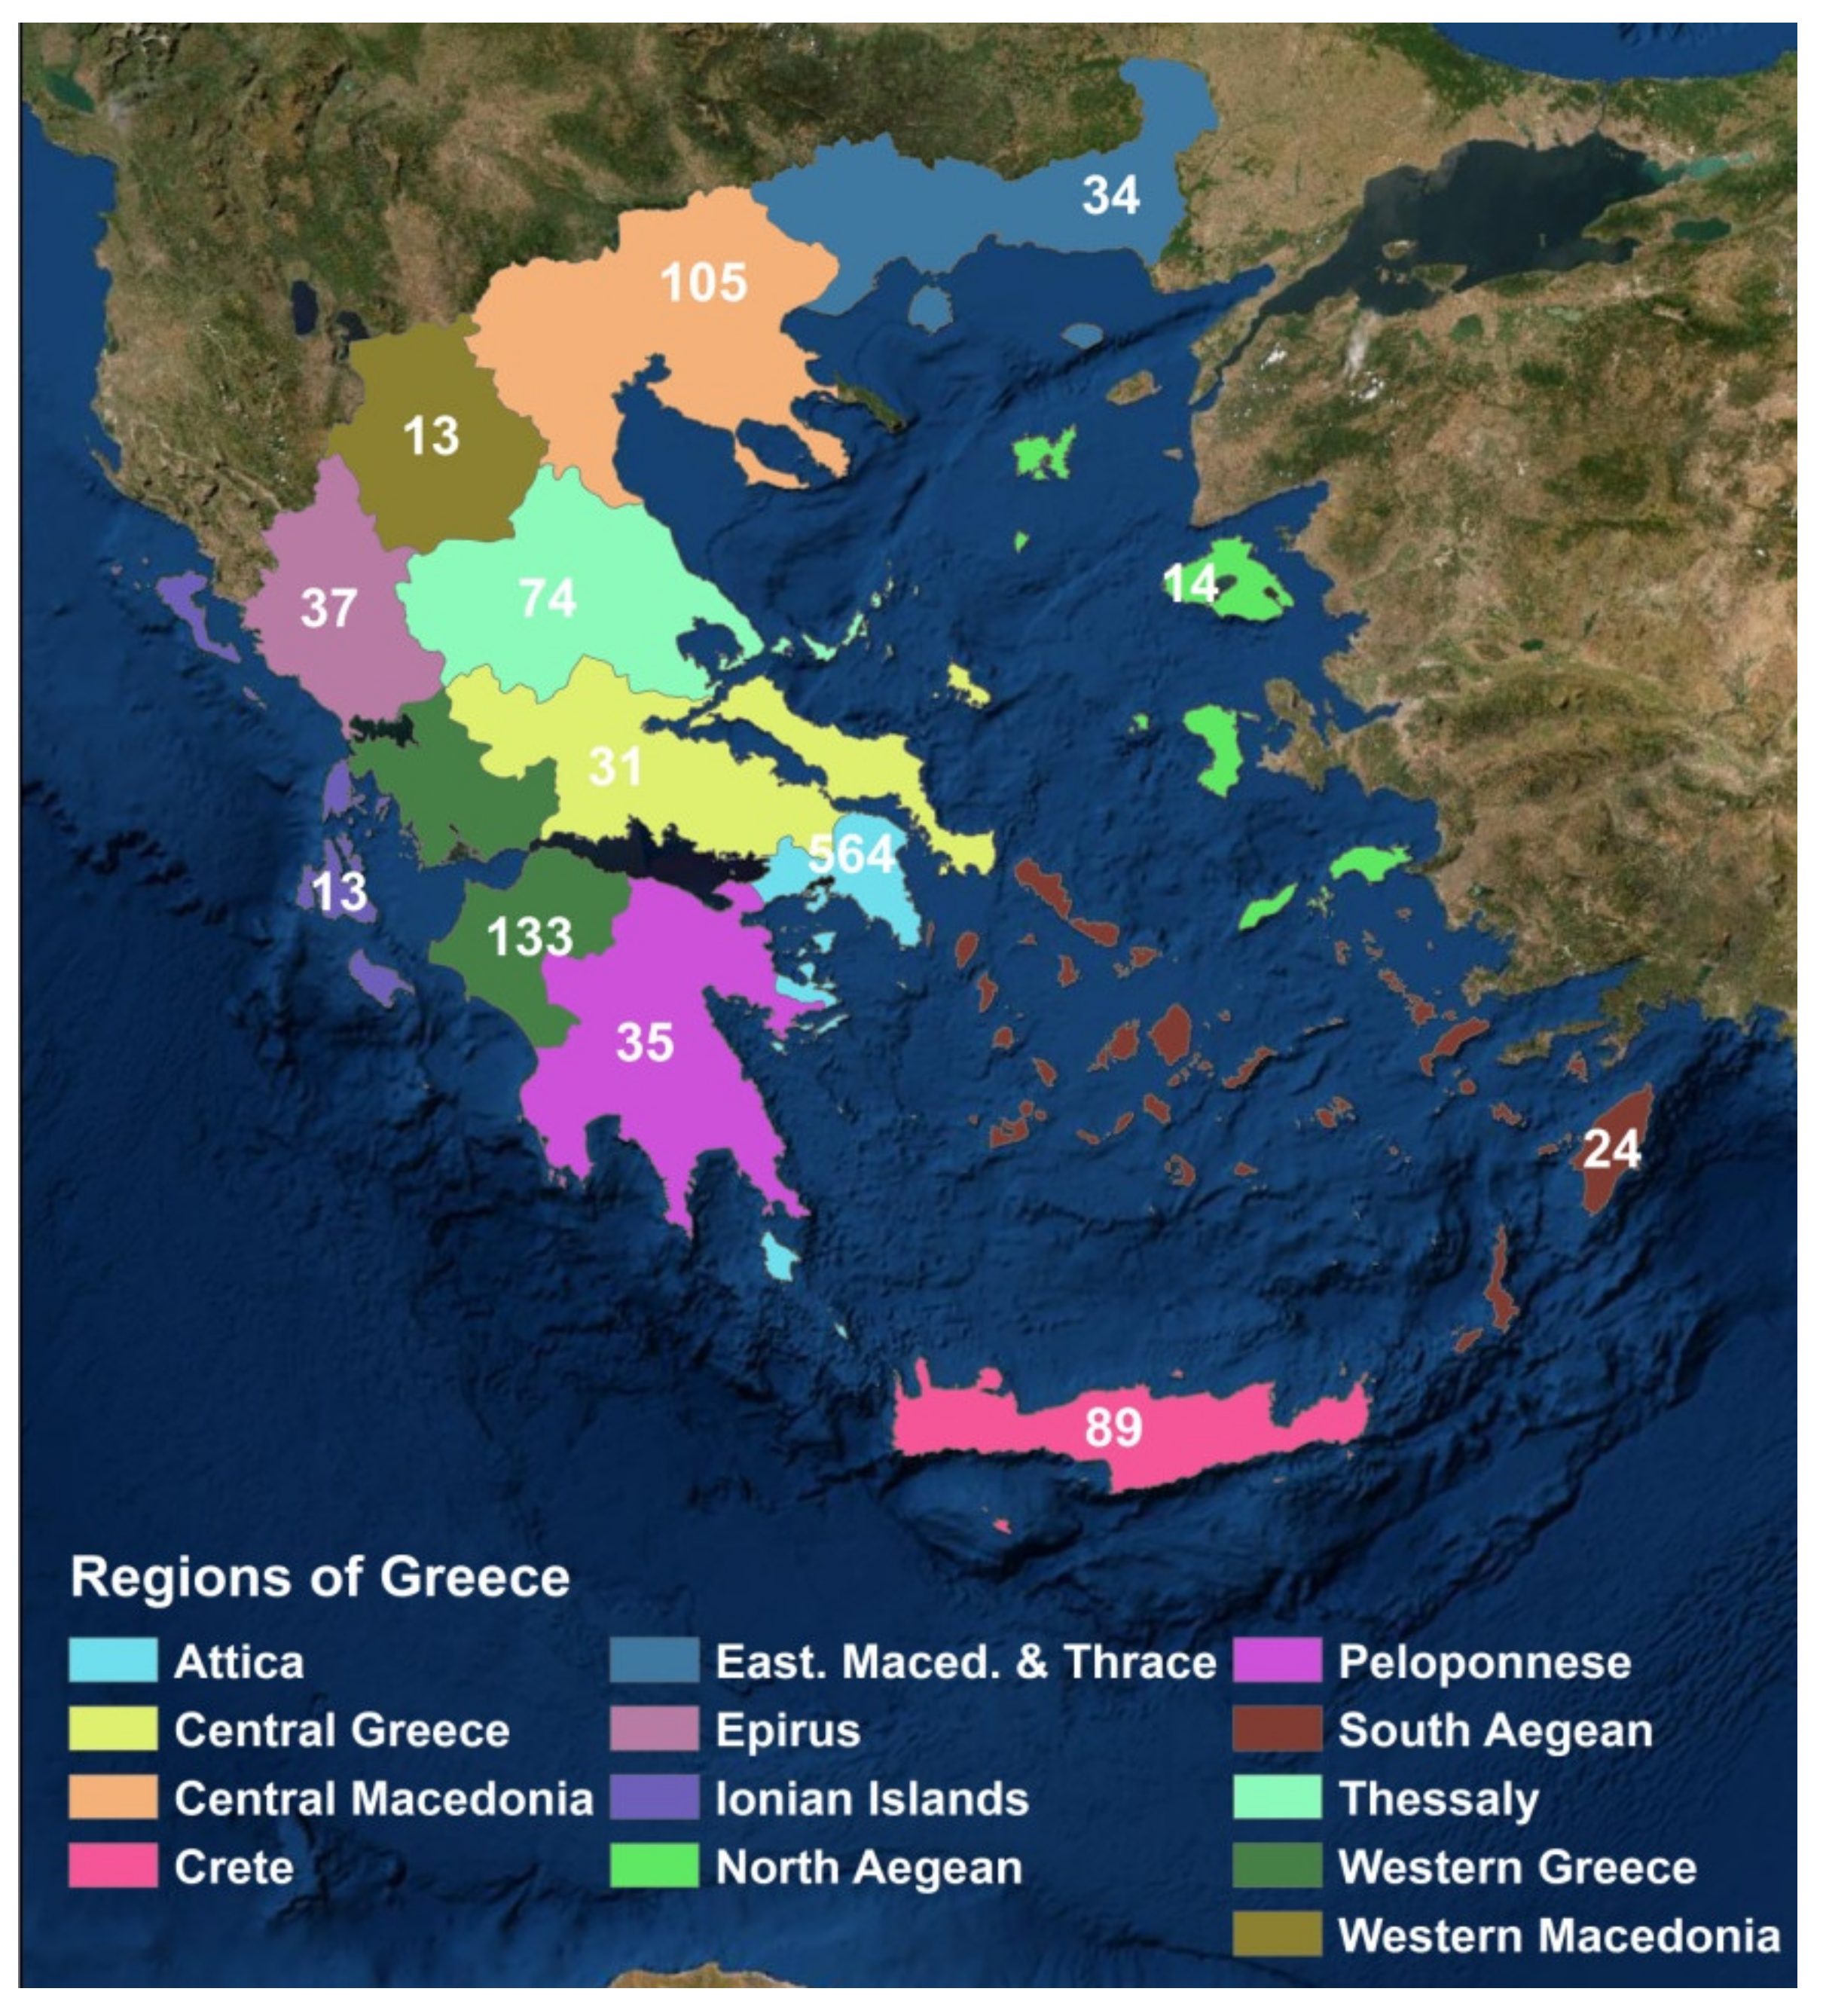
The questionnaire design was based on previous attempts to collect data about residential space heating and biomass burning worldwide [34,35,36,37]. It consisted of 28 questions, and it is presented in detail in the Supplementary Materials. We collected 1167 responses, 1166 of which were valid, spatially disaggregated in the Greek regions as presented in Figure 3.

2.3. Emissions Spatial and Temporal Distribution Methodology

The annual emissions per region were spatially aggregated in gridded form (1 × 1 km2) using as proxy values: (1) the Degree of URBAnisation (DEGURBA) and (2) population data allocated in spatial resolution of 1 × 1 km2 (GEOSTAT, https://ec.europa.eu/eurostat/web/gisco/geodata/reference-data/population-distribution-demography/geostat (accessed on 10 September 2021)), both datasets provided by Eurostat.
Based on the responses received from the online survey to the questions referring to heating needs (Questions 7 and 8), temporal coefficients for the distribution of the annual emissions were produced to be representative of each region and the special characteristics of the Greek climate. More specifically, for each climatic zone (A to Z), new monthly, daily and hourly coefficients were produced in order for the annual emissions to be distributed to hourly values for performing air quality applications with photochemical models. The production of local temporal coefficients is very important since they depict the special characteristics of each region.

3. Results and Discussion

3.1. National Emissions Analysis

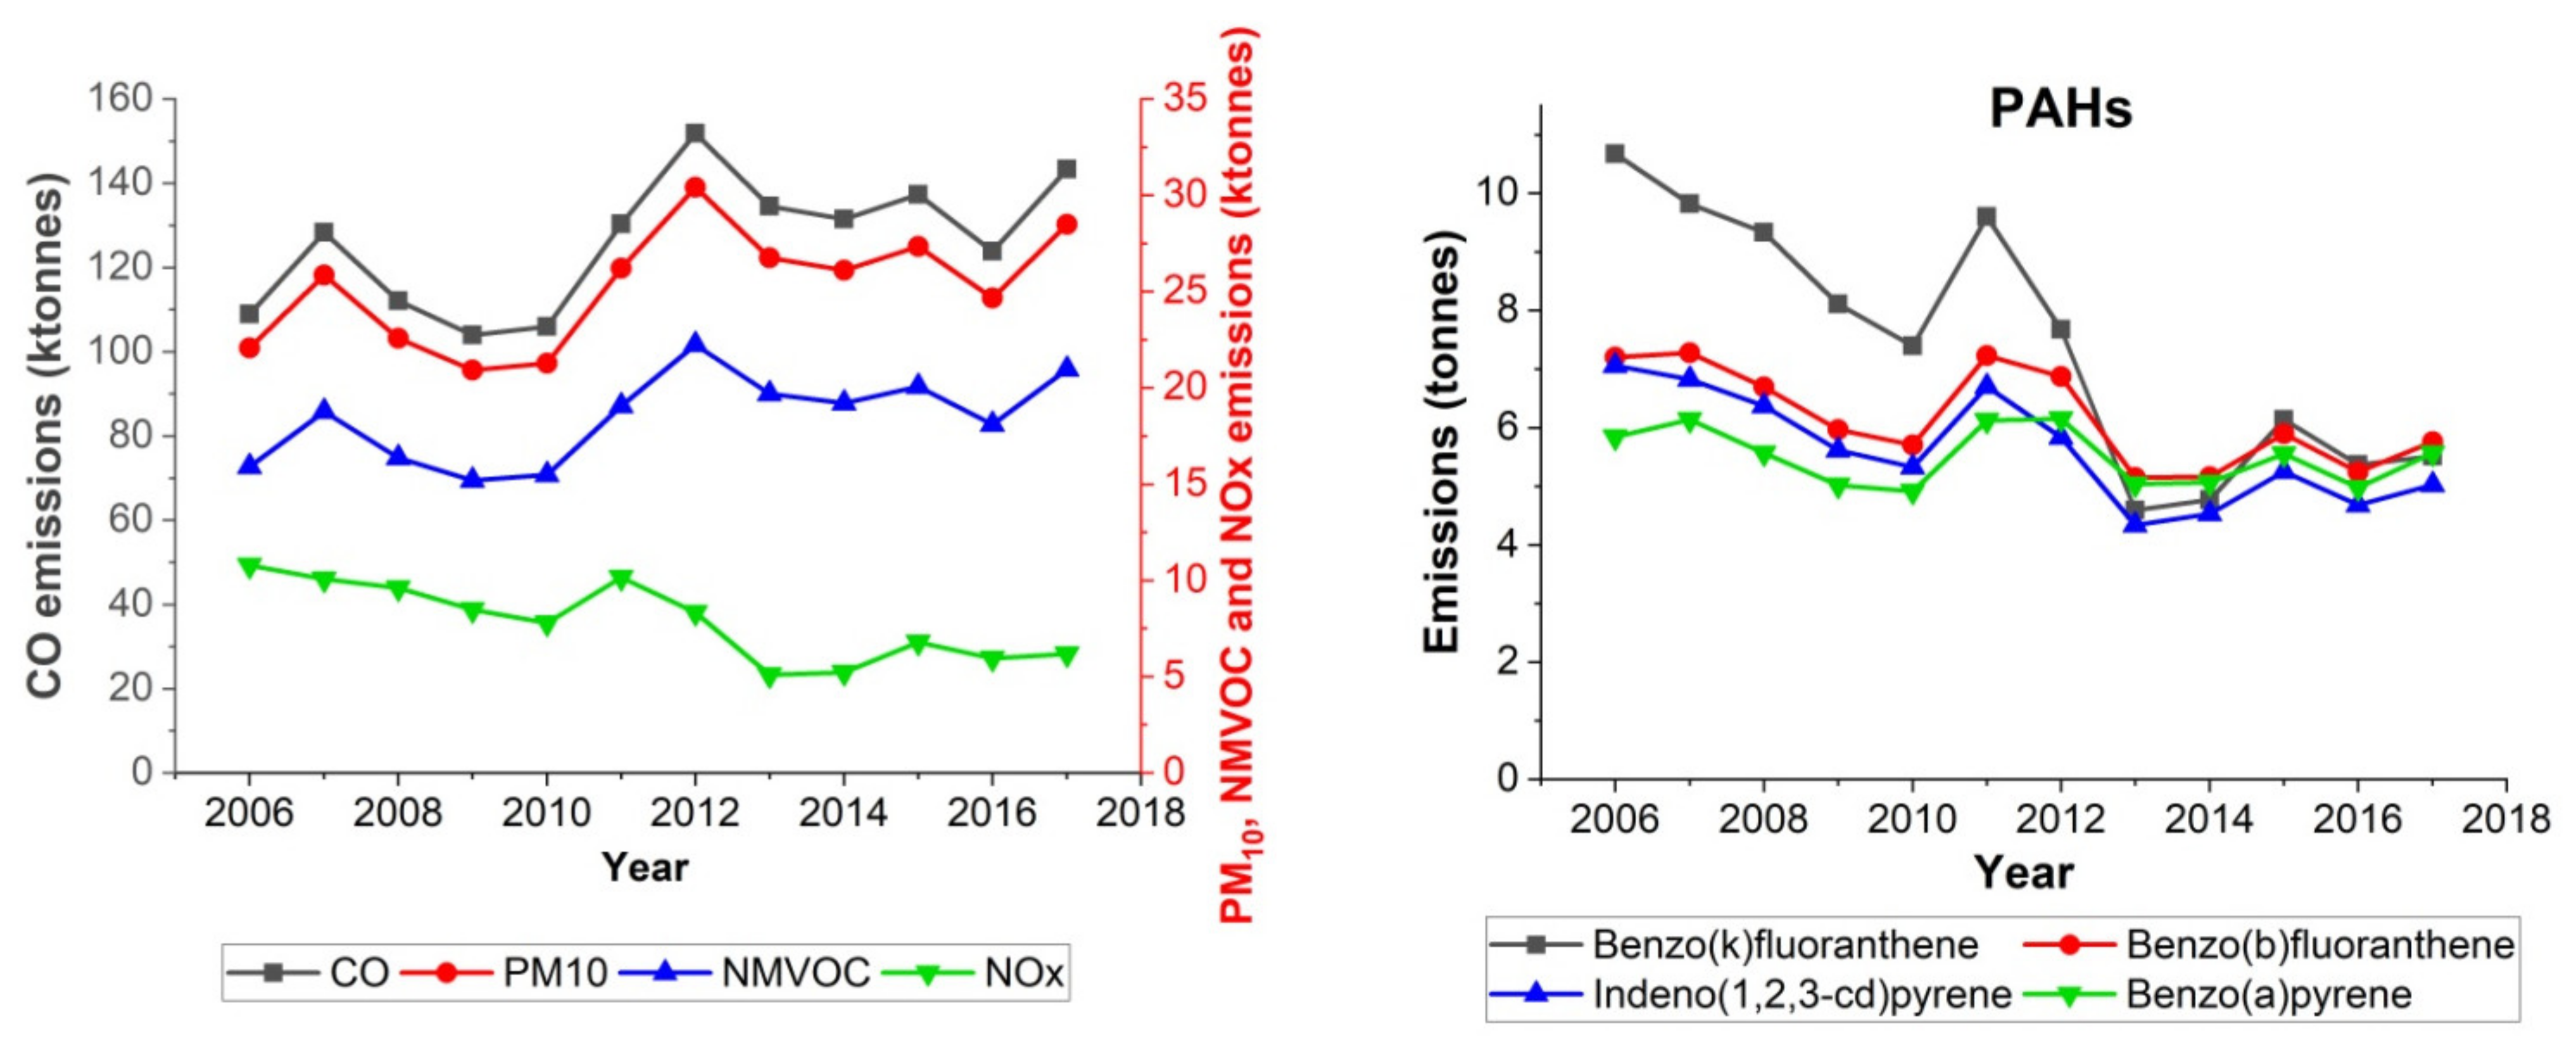
Among the annual emissions from residential heating calculated in this study for Greece, CO (108.98 ktonnes in 2006 and 143.39 ktonnes in 2017) and PM10 (22.09 ktonnes in 2006 and 28.49 ktonnes in 2017) were the highest during the whole period (2006–2017) followed by NMVOC (15.91 ktonnes in 2006 and 20.96ktonnes in 2017) and NOx (10.79 ktonnes in 2006 and 6.19 ktonnes in 2017) (Figure 4 left). The above values represent the sum of the pollutants emitted by all types of appliances and fuels except for electricity, which was not included in the calculation process since the pollutants for the production of this type of energy are considered to be emitted close to the public electricity industries. The comparison with the emissions reported annually by the official authorities under the Gothenburg Protocol and CRTAP Convention (https://cdr.eionet.europa.eu/gr/eu/nec_revised/inventories/envycotfw/ (accessed on 10 April 2021)), revealed the same annual variation, the values though were lower for most of the pollutants and particulates even though they represent the total emissions from the residential sector and not only heating activity. Indicative CO, PM10 and NOX emissions for the year 2017 are 110.76 ktonnes, 18.28 ktonnes and 5.26 ktonnes, respectively. These differences between datasets referring to the same area (e.g., Greece) are due to the different energy consumptions and the different proxies used for the disaggregation of the energy to the heating appliances.
Biomass burning is highly correlated with CO and particle emissions. Almost 99.29% of the total CO and 96.96% of the total PM10 values are due to the use of biomass (wood, pellets, and briquettes). On the contrary, NOx emissions mostly originate from oil consumption (84.83% in 2006 and 60.69% in 2017) and secondarily by biomass (13.99% in 2006 and 29.84% in 2017). In terms of source type, higher values are emitted by fireplaces since wood combustion is related to the highest Emission Factors (EFs) especially for the case of open fireplaces (e.g., the EF for CO for wood burning in open fireplaces is 4000.00 g/GJ of fuel used, while the relevant EFs for natural gas, wood and oil in boilers for single households are much smaller (22.00 g/GJ, 300.00 g/GJ and 3.70 g/GJ, respectively). Regarding heavy metals, Zn had the greatest value (29.22tonnes in 2017), in agreement with Wiinka et al. [38] and Zosima et al. [39], followed by Pb (1.60 tonnes in 2017) and Cr (1.32 tonnes in 2017). Heavy metals were emitted almost totally from biomass burning (99.99% for Zn). Theodosi et al. [40] found that domestic wood burning is an important source of heavy metals in Athens (mean annual Pb concentration 4.4 ± 3.4 ng/m3) and this is the case for other urban areas as well [41,42]. However, lower values were attributed to Zn (14.97 tonnes), Pb (0.81 tonnes) and Cr (0.68 tonnes) emissions by the official NECD Inventory submission for the year 2017 (https://cdr.eionet.europa.eu/gr/eu/nec_revised/inventories/envycotfw/ (accessed on 10 April 2021)), probably due to less biomass consumption (29.11 PJ while in the present study it was 56.82 PJ) or different distributions of the total energy consumption to the relevant appliances. From the group of PAHs, benzo(k)fluoranthene, mainly originating from oil consumption, prevailed until 2012 and decreased afterwards (50.57% drop from 2012 to 2013, Figure 4 right).

3.2. Key Findings from the Online Survey

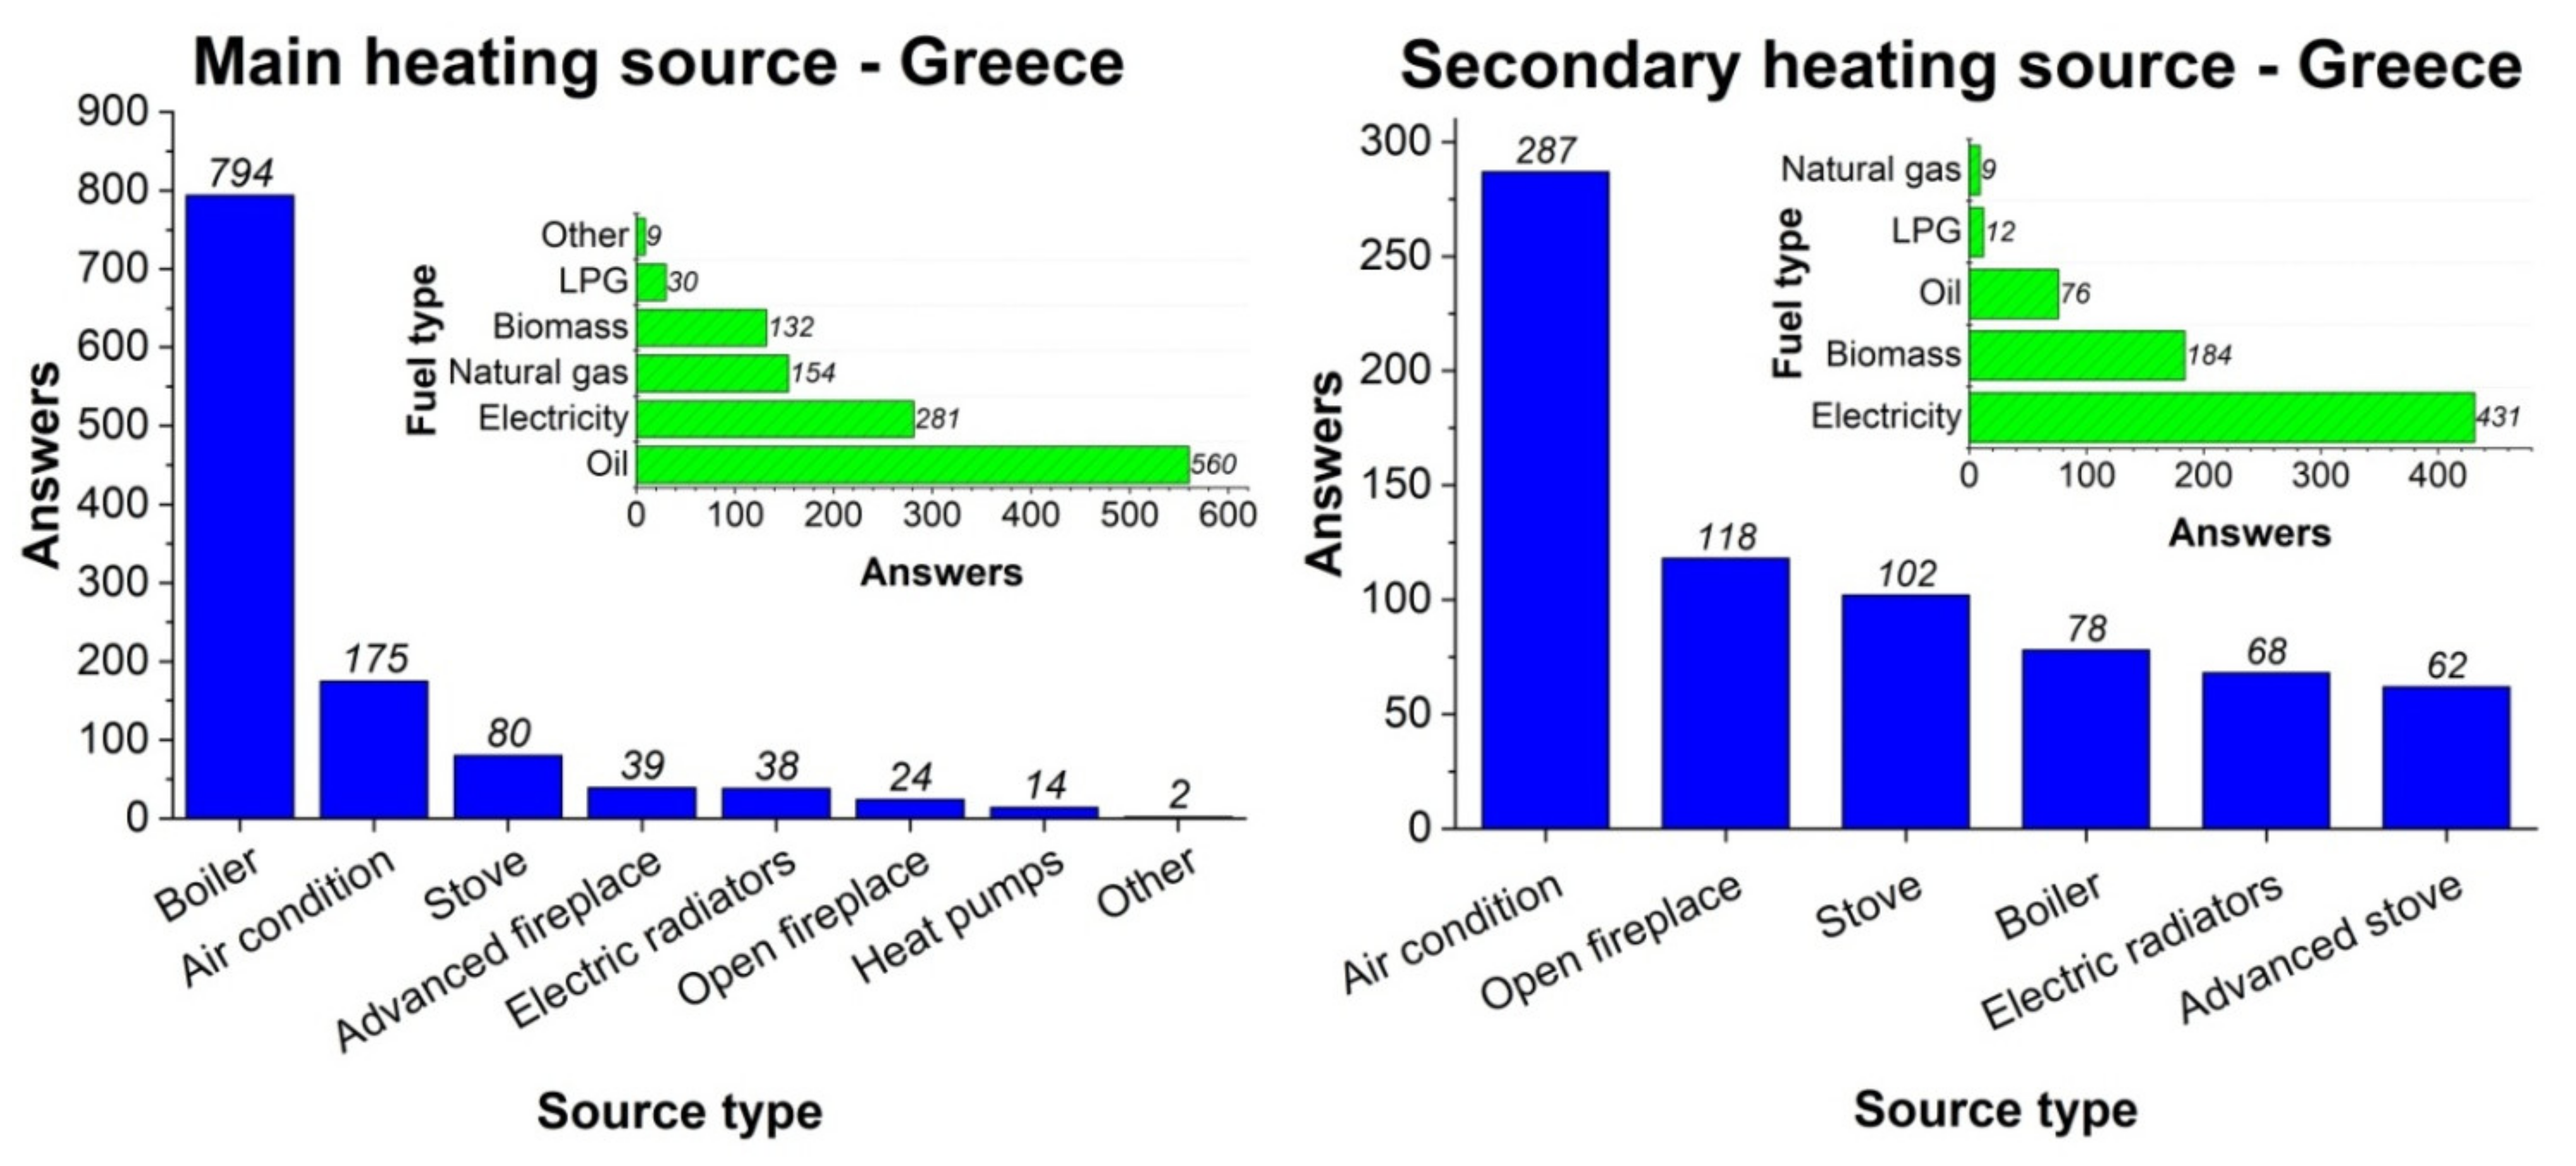
Table 1 presents the Greek regions, the relevant climatic zones and the answers received per region. According to the responses (Figure 5), the most common heating appliance in Greece is the boiler (794 answers—68.04%), which is mainly associated with oil (554 answers—69.77%) and natural gas usage (154 answers—19.40%) and less with biomass (39 answers—4.91%). About 15.00% of the participants use air conditioning, 6.86% stoves and 5.31% fireplaces. Generally, as shown in Table 1, the percentage use of boilers ranges from 53.85% in the Ionian Islands to 82.43% in Thessaly while, the relevant percentage range for the air condition is 1.35% (Thessaly)—29.17% (South Aegean). The use of stoves and fireplaces (open and advanced) is very popular mostly in rural regions such as the Peloponnese, Western Greece and East Macedonia and Thrace, in contrast to the Attica region (only 9.39%). In terms of the fuel used, oil is in the first place (49.65%, 45.16% and 38.10% in Attica, Central Greece and Central Macedonia, respectively). The use of natural gas is not negligible in the regions in which a sufficient network exists (15.60% in Attica and 19.05% in Central Macedonia from the survey responses) in agreement with the HBS results; 7.14% in Attica and 14.54% in Central Macedonia of the total energy used by households (HBS, 2021). Biomass burning as the main heating source is quite high in the climatic zones C (23.81% for Central Macedonia) and D (30.77% for the Western Macedonia), while lower values are reported for the region of Attica (4.61%). This is also justified by the energy consumption provided by the HBS (33.52% for Central Macedonia, 41.91% for Western Macedonia and 12.07% in Attica). In many Mediterranean countries (e.g., France, Spain, Italy) biomass burning for household heating is restricted to rural areas [17].
The possibility of using a secondary heating source was also reported. The percentage contribution of main versus secondary heating sources is shown in Figure S1 of Supplementary Materials. The range of the percentage use of the main heating source (which in most answers was boiler) was mainly from 70% to 90%, indicating that the use of a secondary source is an important factor for residential heating and should be recorded by the official household surveys in agreement with [37]. Concerning the use of secondary heating fuel or energy source, we received 714 responses distributed as follows: 431 for electricity (60.36%), 186 for biomass (26.05%), 76 for oil (10.64%), 12 for LPG (1.68%) and nine for natural gas (1.26%). In Attica, Crete and Western Greece the percentage contribution of electricity and biomass ranged from 61.67% to 66.67% and 20.80% to 26.67%, respectively, while in Central Macedonia electricity and biomass are used almost equally (about 48.89% each), indicating the importance of biomass burning in Northern Greece.
A special section of the survey was dedicated to people’s perceptions of biomass burning. Participants reported that the main reasons for selecting biomass are financial (80.6%), practical (13.4%), ecological (4.0%) and others (2.0%, Figure S2 of Supplementary Materials). Among the biomass types, the most preferable ones are wood (76.6%), pellet (10.8%), woodchips (7.1%) and briquettes (5.4%), while the mean annual consumption per household is about 1.9 tonnes (it refers to the households that used biomass). More specifically, according to the HBS, the average annual biomass consumption per household was 0.89 tonnes, 0.32 tonnes and 0.14 tonnes for the regions of Crete, East Macedonia and Thrace and Attica, respectively, while the responses to the survey for the above mentioned regions were 0.64 tonnes, 0.31 tonnes and 0.12 tonnes, respectively. These values refer to the average household consumption.
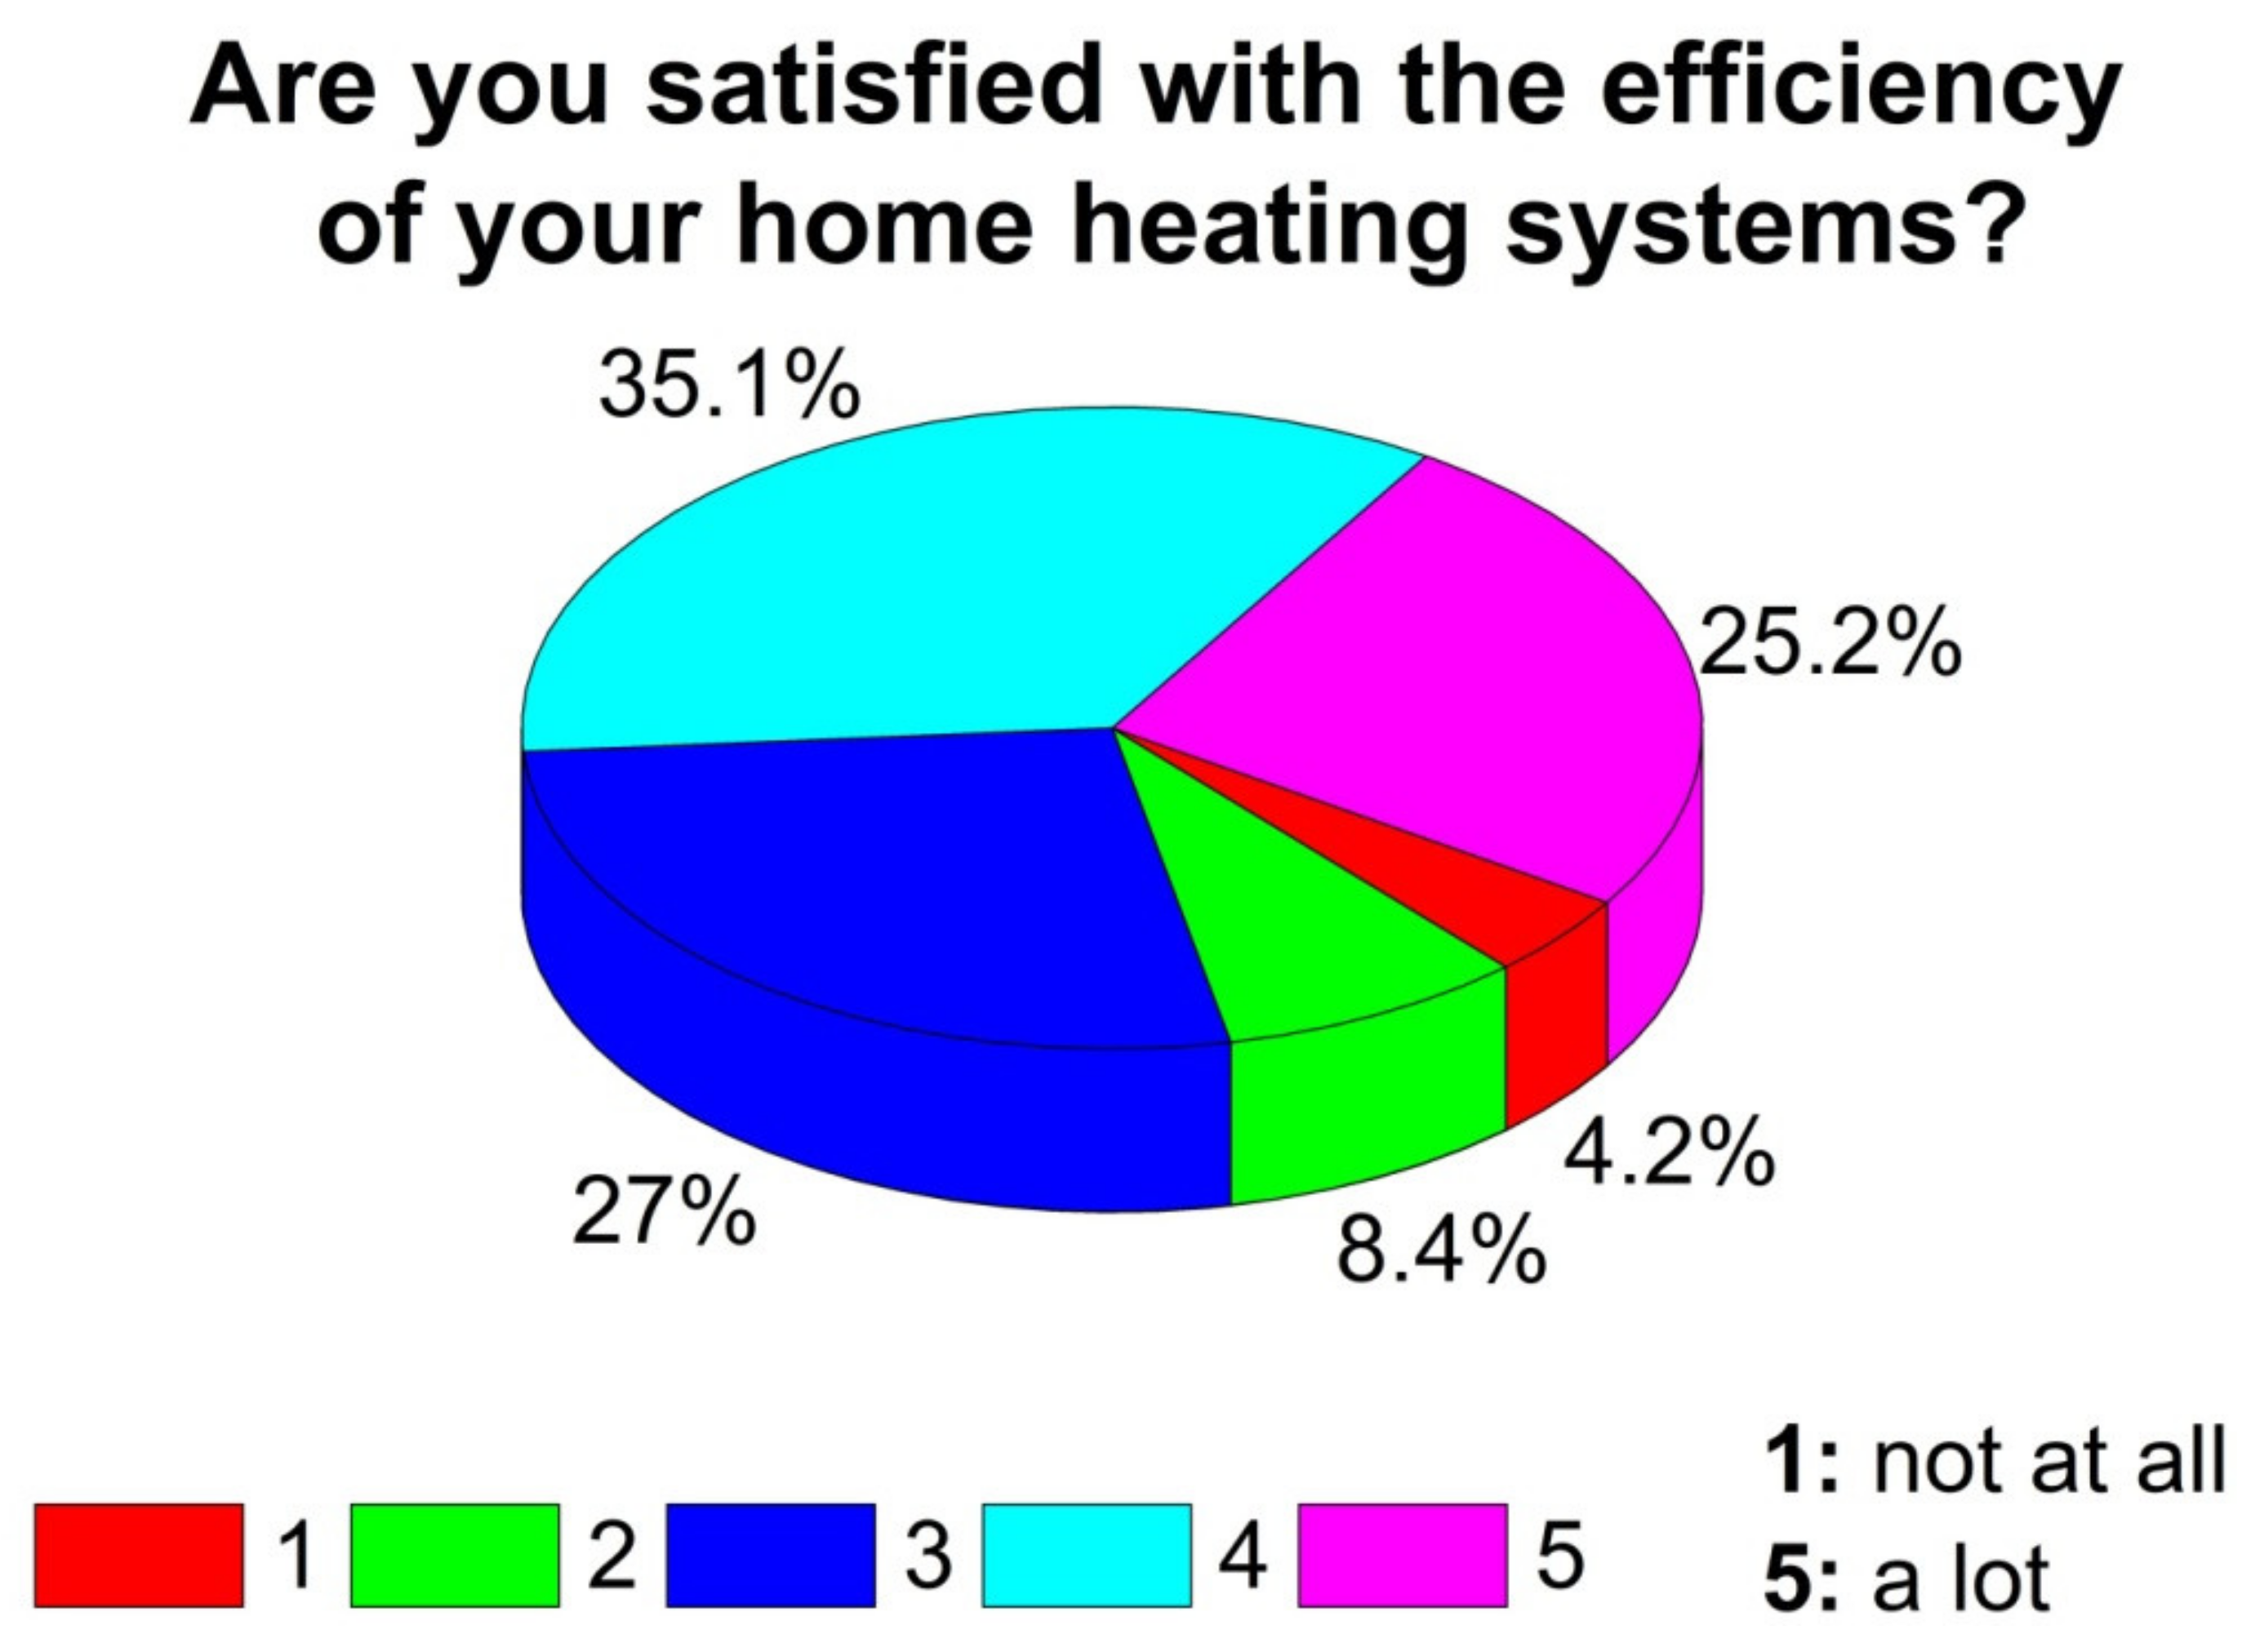
The estimation of the heating performance of the appliance used was also requested by the participants (Figure 6). With a scale from 1 (not at all satisfied) to 5 (very satisfied), people seemed to be quite satisfied (35.11%) with the efficiency of their heating systems. Of them, 26.2% have upgraded their heating system or have improved the energy efficiency of their residence (of which 41.6%, 36.1% and 22.3% is multi, one and two dwelling buildings, respectively) by changing windows (42.9%), improving the external insulation (24.8%), installing renewable energy systems (e.g., solar panels) (13.2%), changing the boiler (12.3%) and converting the open fireplace to an advanced one (6.7%).The age of the buildings that residents performed energy performance upgrades on is shown in Table S1. Buildings built 50 and 20 years ago received the higher percentage (25.41% and 25.74% respectively), indicating that residents perform housing renovations every twenty years. It is also interesting that the 19.14% and 38.02% of those using oil answered that they are very satisfied (answer 5) and satisfied (answer 4) while those using biomass are 32.52% and 44.39%, respectively, indicative of participants’ perceptions of heating performance. The preferable outdoor temperature range for heating their home is from 14 °C to 20 °C (Figure S3). Finally, an overview of the sample is presented in the Supplementary materials (Tables S2–S4). The majority of participants (approx. 83.28%) are older than 35 years, indicating that residential heating is not an appealing subject for young people while more than half (approx. 60.23%) reported having an annual income between 10,000 and 30,000 Euros.

3.3. Regional Missions

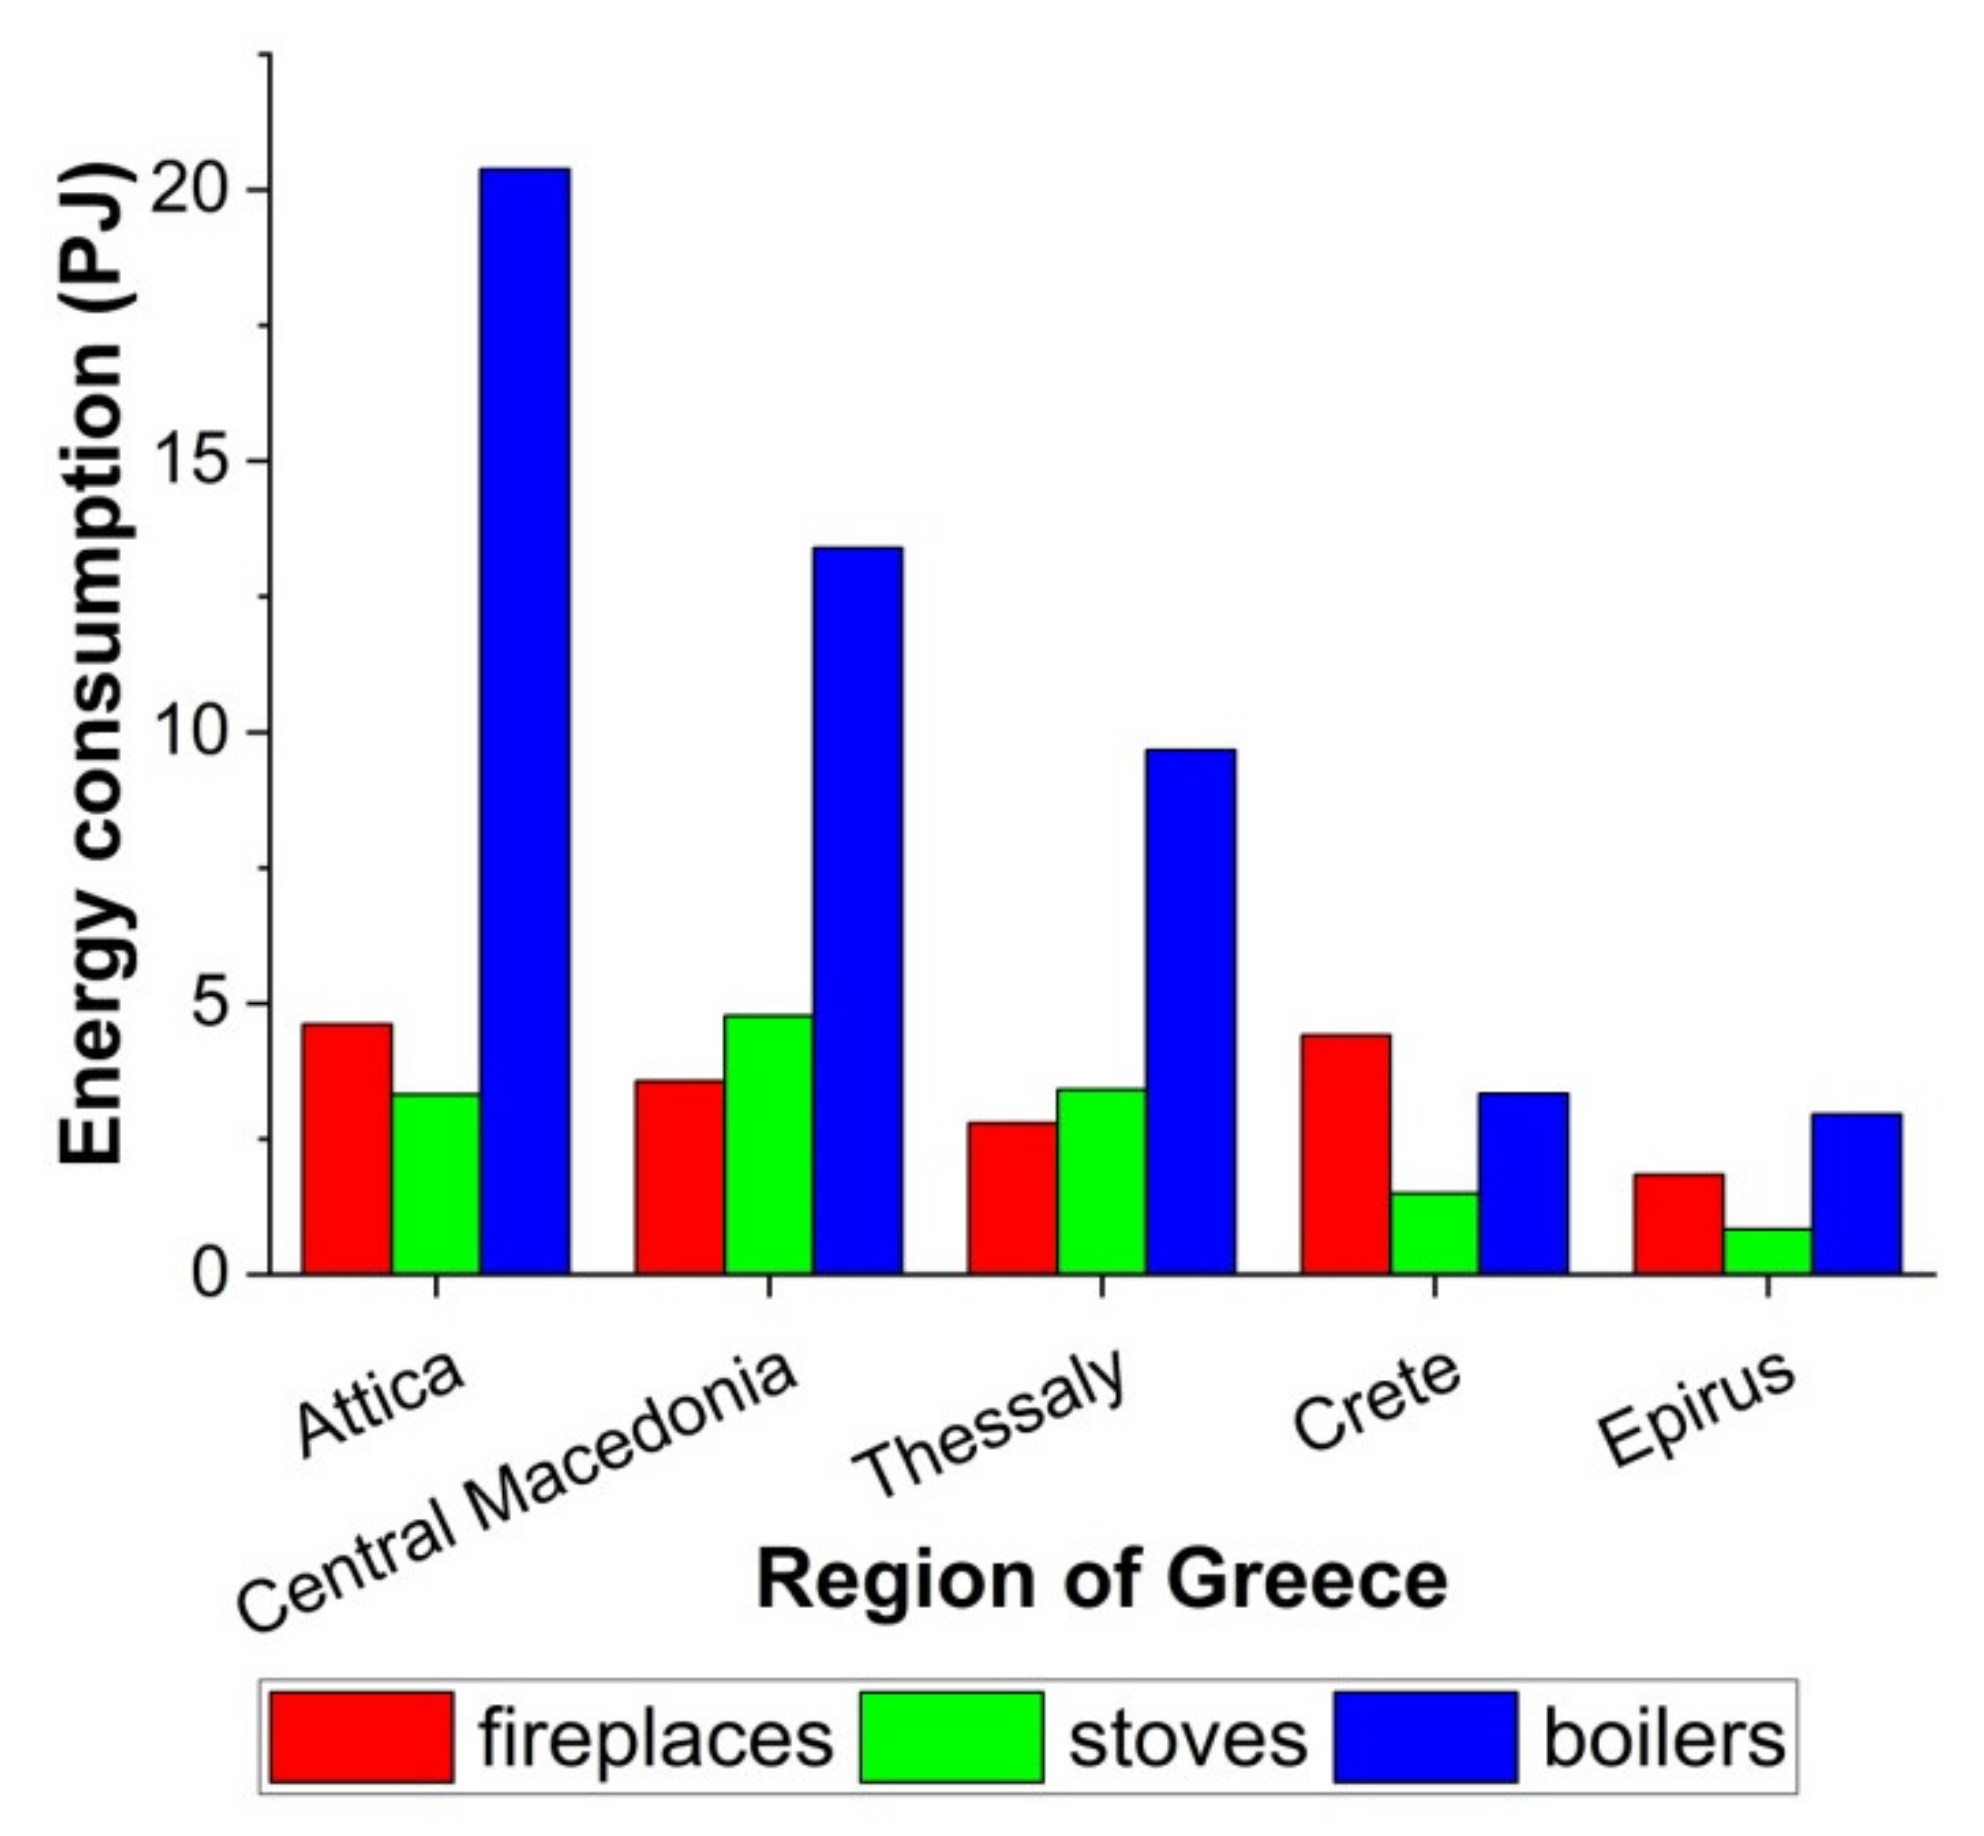
With the help of the survey’s responses, energy consumption per fuel type was attributed to the different heating appliances and emissions were calculated for the regions of Greece for the year 2017. Energy consumption per appliance type is presented in Figure 7 for selected regions. With the exception of Crete, the highest energy consumption is attributed to boilers since this is the main heating source. However, there is a clear distinction between the urban and rural areas. The two most populated cities in Greece (Athens and Thessaloniki) are located in Attica and Central Macedonia where more apartment buildings exist on which the space heating is mainly performed with central heating appliances (usually one boiler per building). On the other hand, in Crete and Epirus the use of fireplace is very popular (e.g., in Crete 4.4 PJ were consumed by fireplaces while only 3.3 PJ by boilers). As a result, the ratio of energy consumed by boilers to the one consumed by fireplaces is 4.4, 3.8, 0.8 and 1.6 for Attica, Central Macedonia, Crete and Epirus, respectively.
From the in depth study of the different fuels used by each appliance, it was found that in Crete wood consumption was subdivided to fireplaces, stoves and boilers by 73.5%, 22.4% and 4.1%, respectively, while the relative percentages for liquid fuels were 5.5% for stoves and 94.5% for boilers. However, in Attica, wood consumption was subdivided to fireplaces, stoves and boilers by 63.9%, 32% and 4.1%, respectively, and liquid fuels were almost totally used by boilers (97.2%). The consumption of pellets was also included in this research and it was subdivided to all appliances by 63.0% (fireplaces), 18.0% (stoves), 19.0% (boilers) for the region of Crete and by 12.4% (fireplaces), 61.9% (stoves), 25.7% (boilers) for the region of Attica. Similar work was made for the production of specific energy consumption data for each region of Greece.
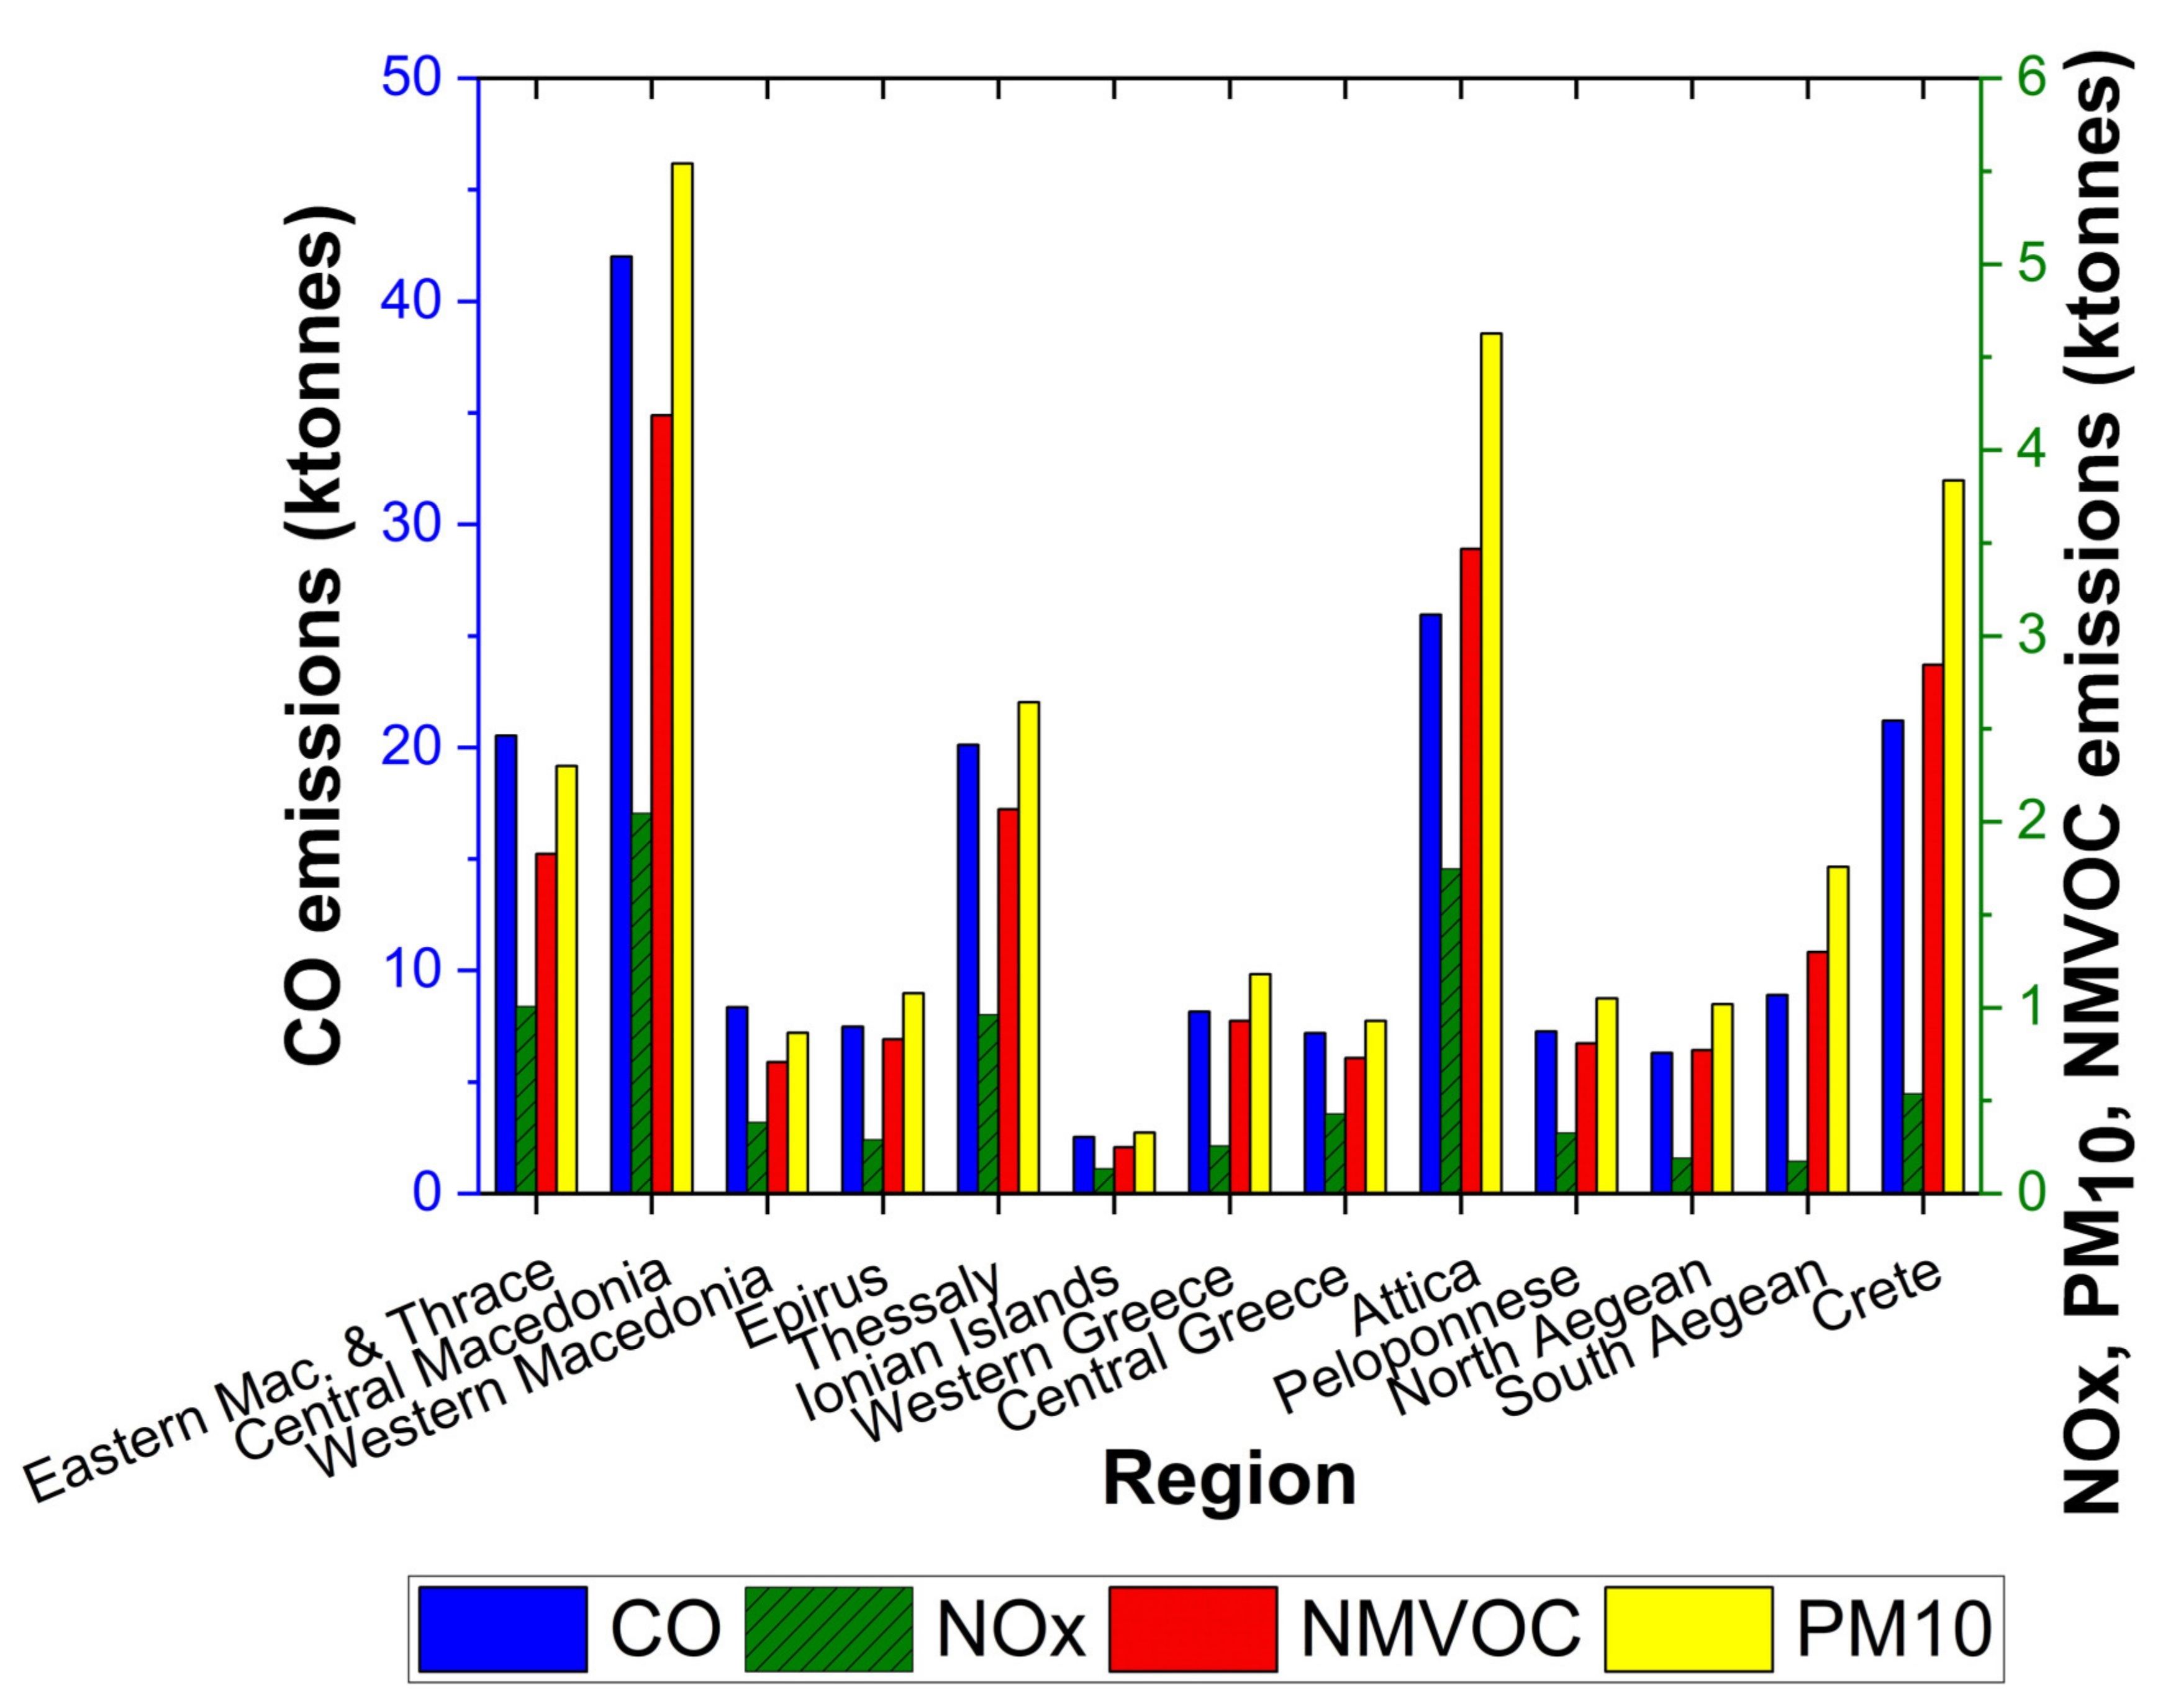
The analysis of the calculated emissions revealed that Central Macedonia, Attica, Crete and Thessaly are the ones with higher values (Figure 8). In particular, CO emissions were 42.0 ktonnes in Central Macedonia, 26.0 ktonnes in Attica, 21.2 ktonnes in Crete and 20.1 ktonnes in Thessaly, accounting for the 22.6%, 11.4% and 10.8% of the national emissions, respectively, while PM10 emissions in the above mentioned regions were 5.5 ktonnes, 4.6 ktonnes, 3.8 ktonnes and 2.6 ktonnes, respectively, accounting for the 20.4%, 14.1% and 9.7% of the national emissions. Apart from Attica, the other three regions are related to high biomass consumption, which is consequently responsible for the increased CO and PM10 emissions. Concerning NOx emissions, Central Macedonia (24.1% of the national total), Attica (20.6% of the national total), Eastern Macedonia (11.9% of the national total) and Thessaly (11.4% of the national total) have the highest values. NOx values are mainly associated with oil consumption and boilers. For instance, in Central Macedonia and Attica the 74.3% and 76.1% of NOx emissions, respectively, is due to the use of boilers. The percentage contribution of NMVOC emissions for the above-mentioned four regions is similar to the PM10 ones.
The energy consumption data used for the development of the Greek emission inventory submitted annually by the national authorities (Greece’s Informative Inventory Report, from now mentioned as Greece’s IIR) under the UNECE Convention on Long-range Transboundary Air Pollution and Directive (EU) 2016/2284 [43] followed a similar yearly variation for oil with this study; however, smaller values were attributed to biomass consumption, which consequently affect the emissions calculated. For example, the biomass consumption mentioned at the Greece’s IIR for the year 2017 is 29.1 PJ, while the relevant value used in this study is 52.8PJ for wood, 3.7 PJ for pellets and 0.32 PJ for briquettes. As a result, lower annual PM10 (10.3 ktonnes in the Greece’s IIR, 27.2 ktonnes in this study) and CO (110.8 ktonnes in the Greece’s IIR, 186.0 ktonnes in this study) emissions were reported for Greece for the year 2017 (source: complete set of NFR tables accompanying the Greece’s IIR; 2020_NFR_tables_v1_2, https://www.ceip.at/status-of-reporting-and-review-results/2020-submissions (accessed on 5 May 2021)).

3.4. Gridded and Temporarily Distributed Emissions

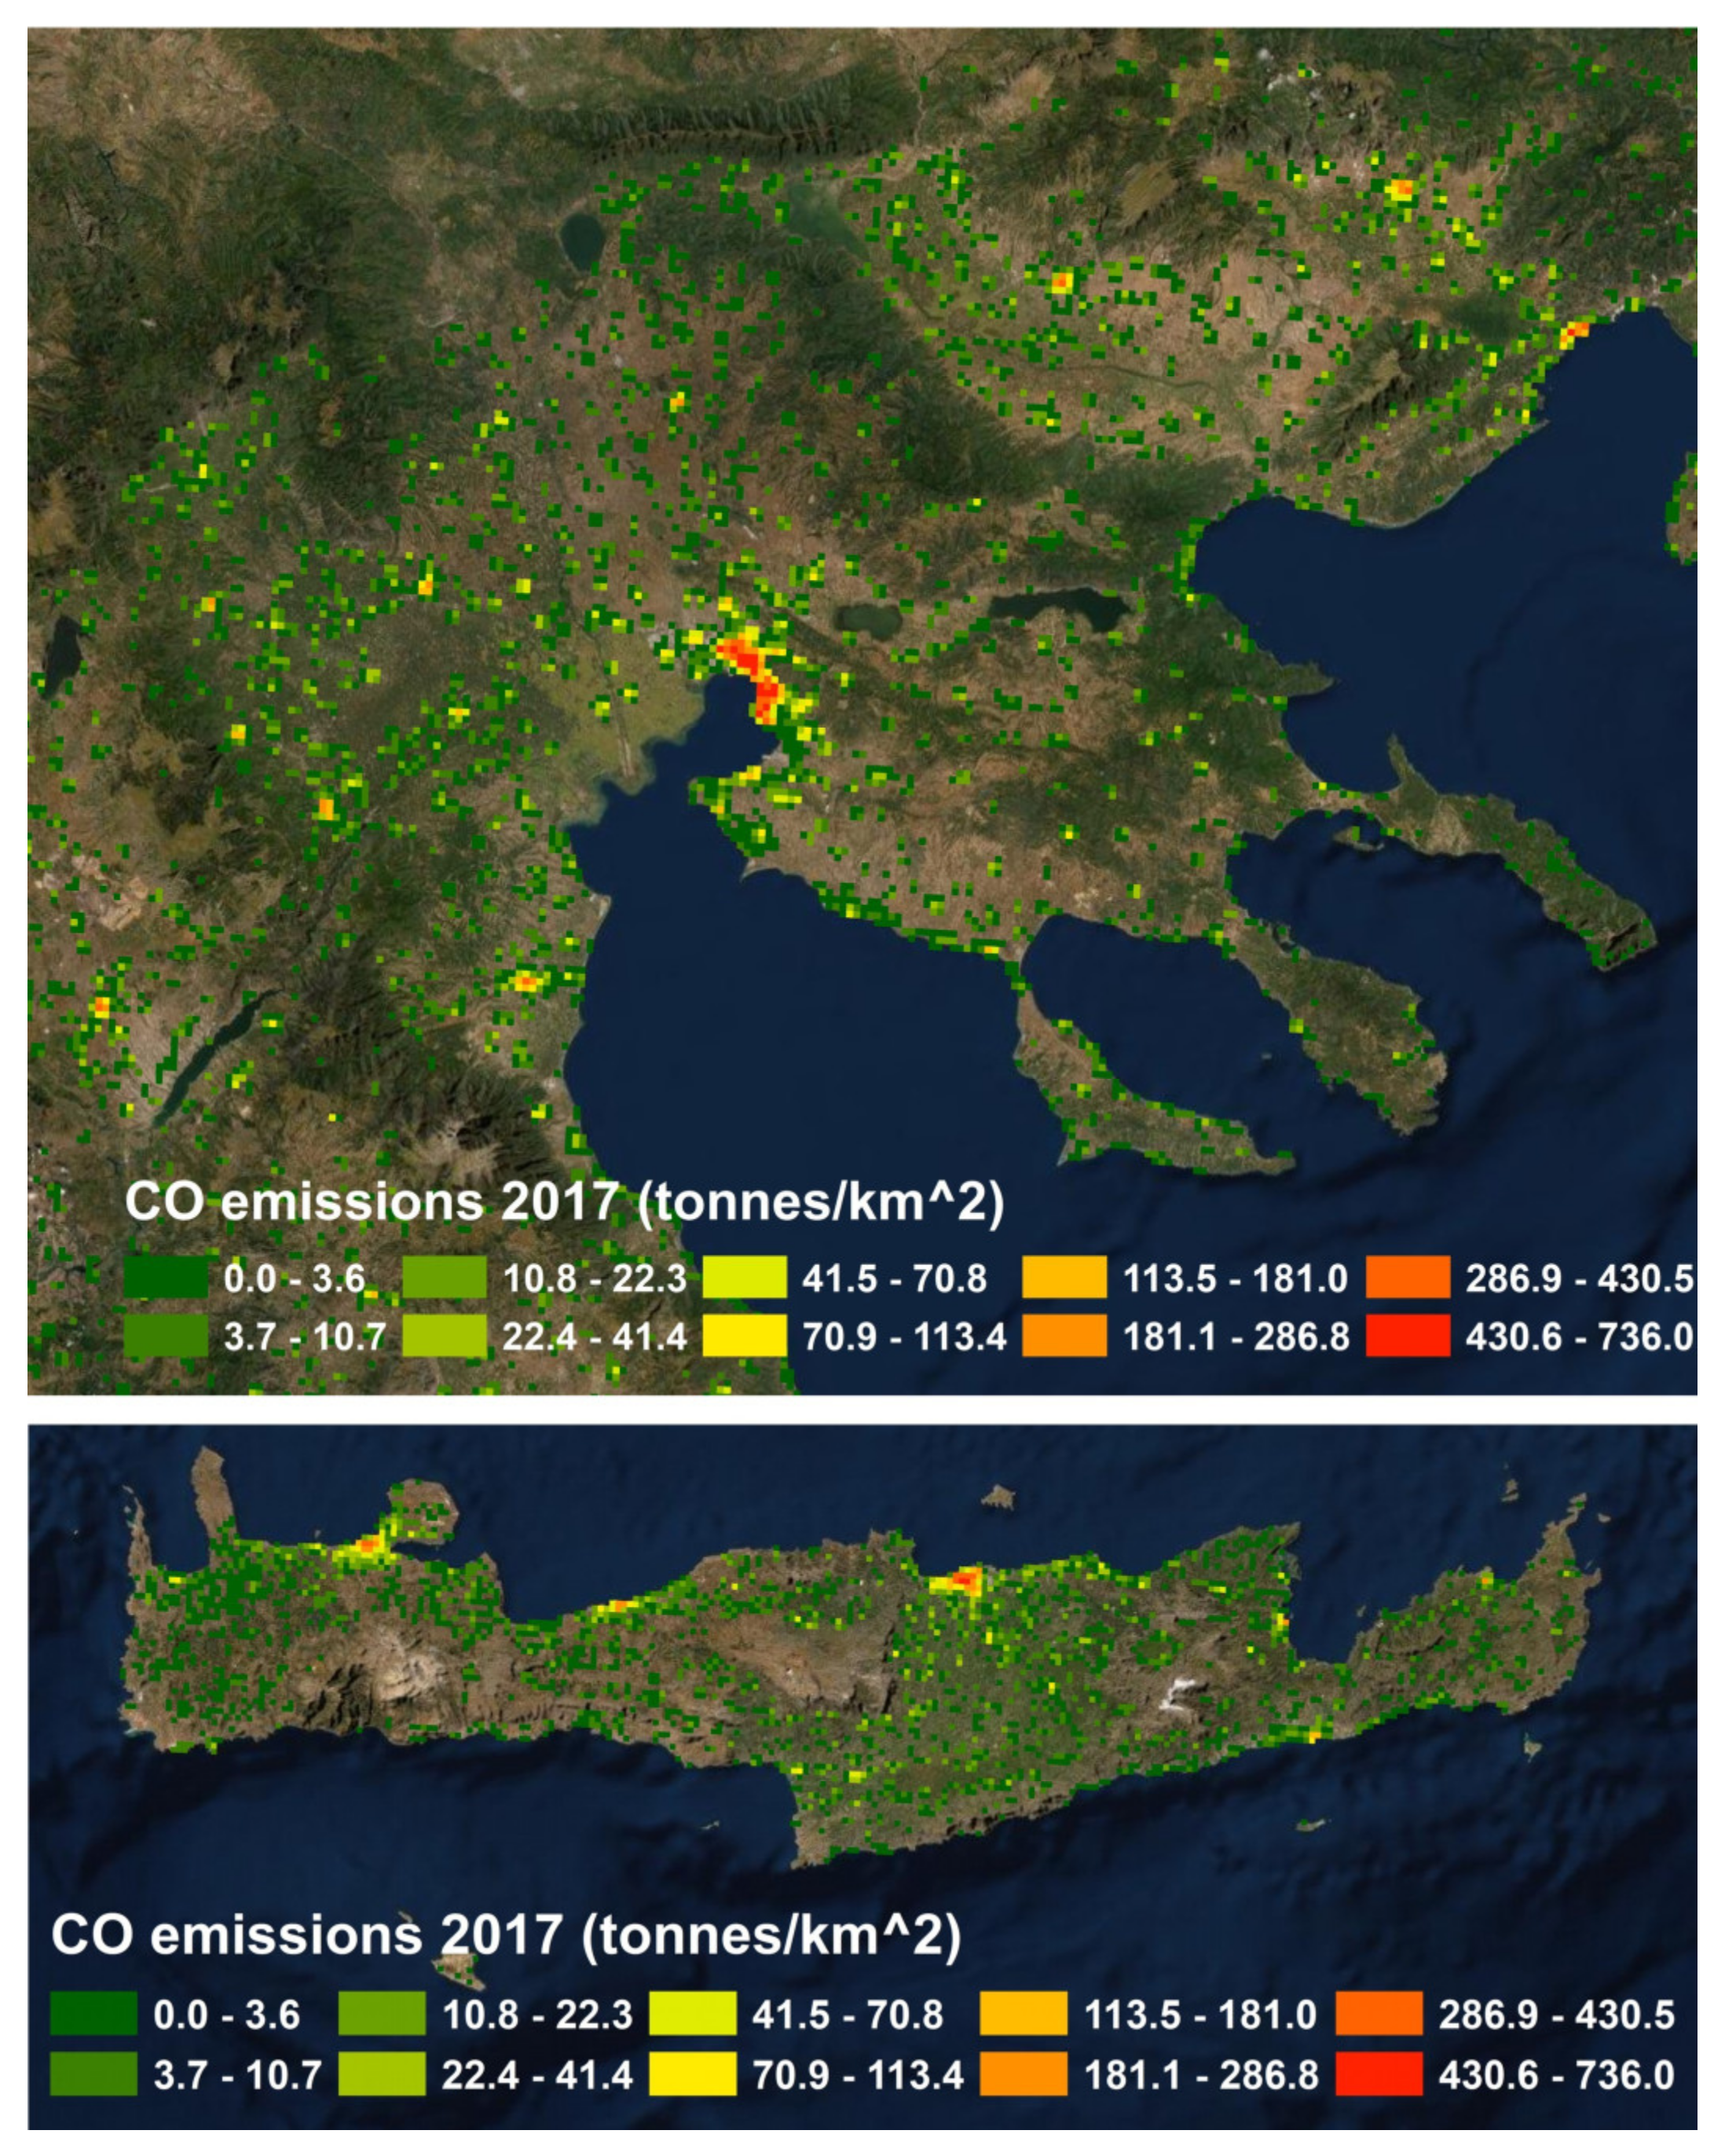
Indicative gridded CO emissions for the regions of Central Macedonia and Crete are presented in Figure 9. Higher values were attributed mainly to the urban areas of Central Macedonia and Crete due to the fact that they are densely populated and to rural areas that are related to high biomass burning (from 530.00 to 730.00 tonnes/km2), while at the rest areas the mean CO emissions were below 50.00 tonnes/km2. Generally, the calculation of the emissions for each region of Greece led to a more representative spatial allocation especially at the suburban and rural areas where the biomass burning is very popular.
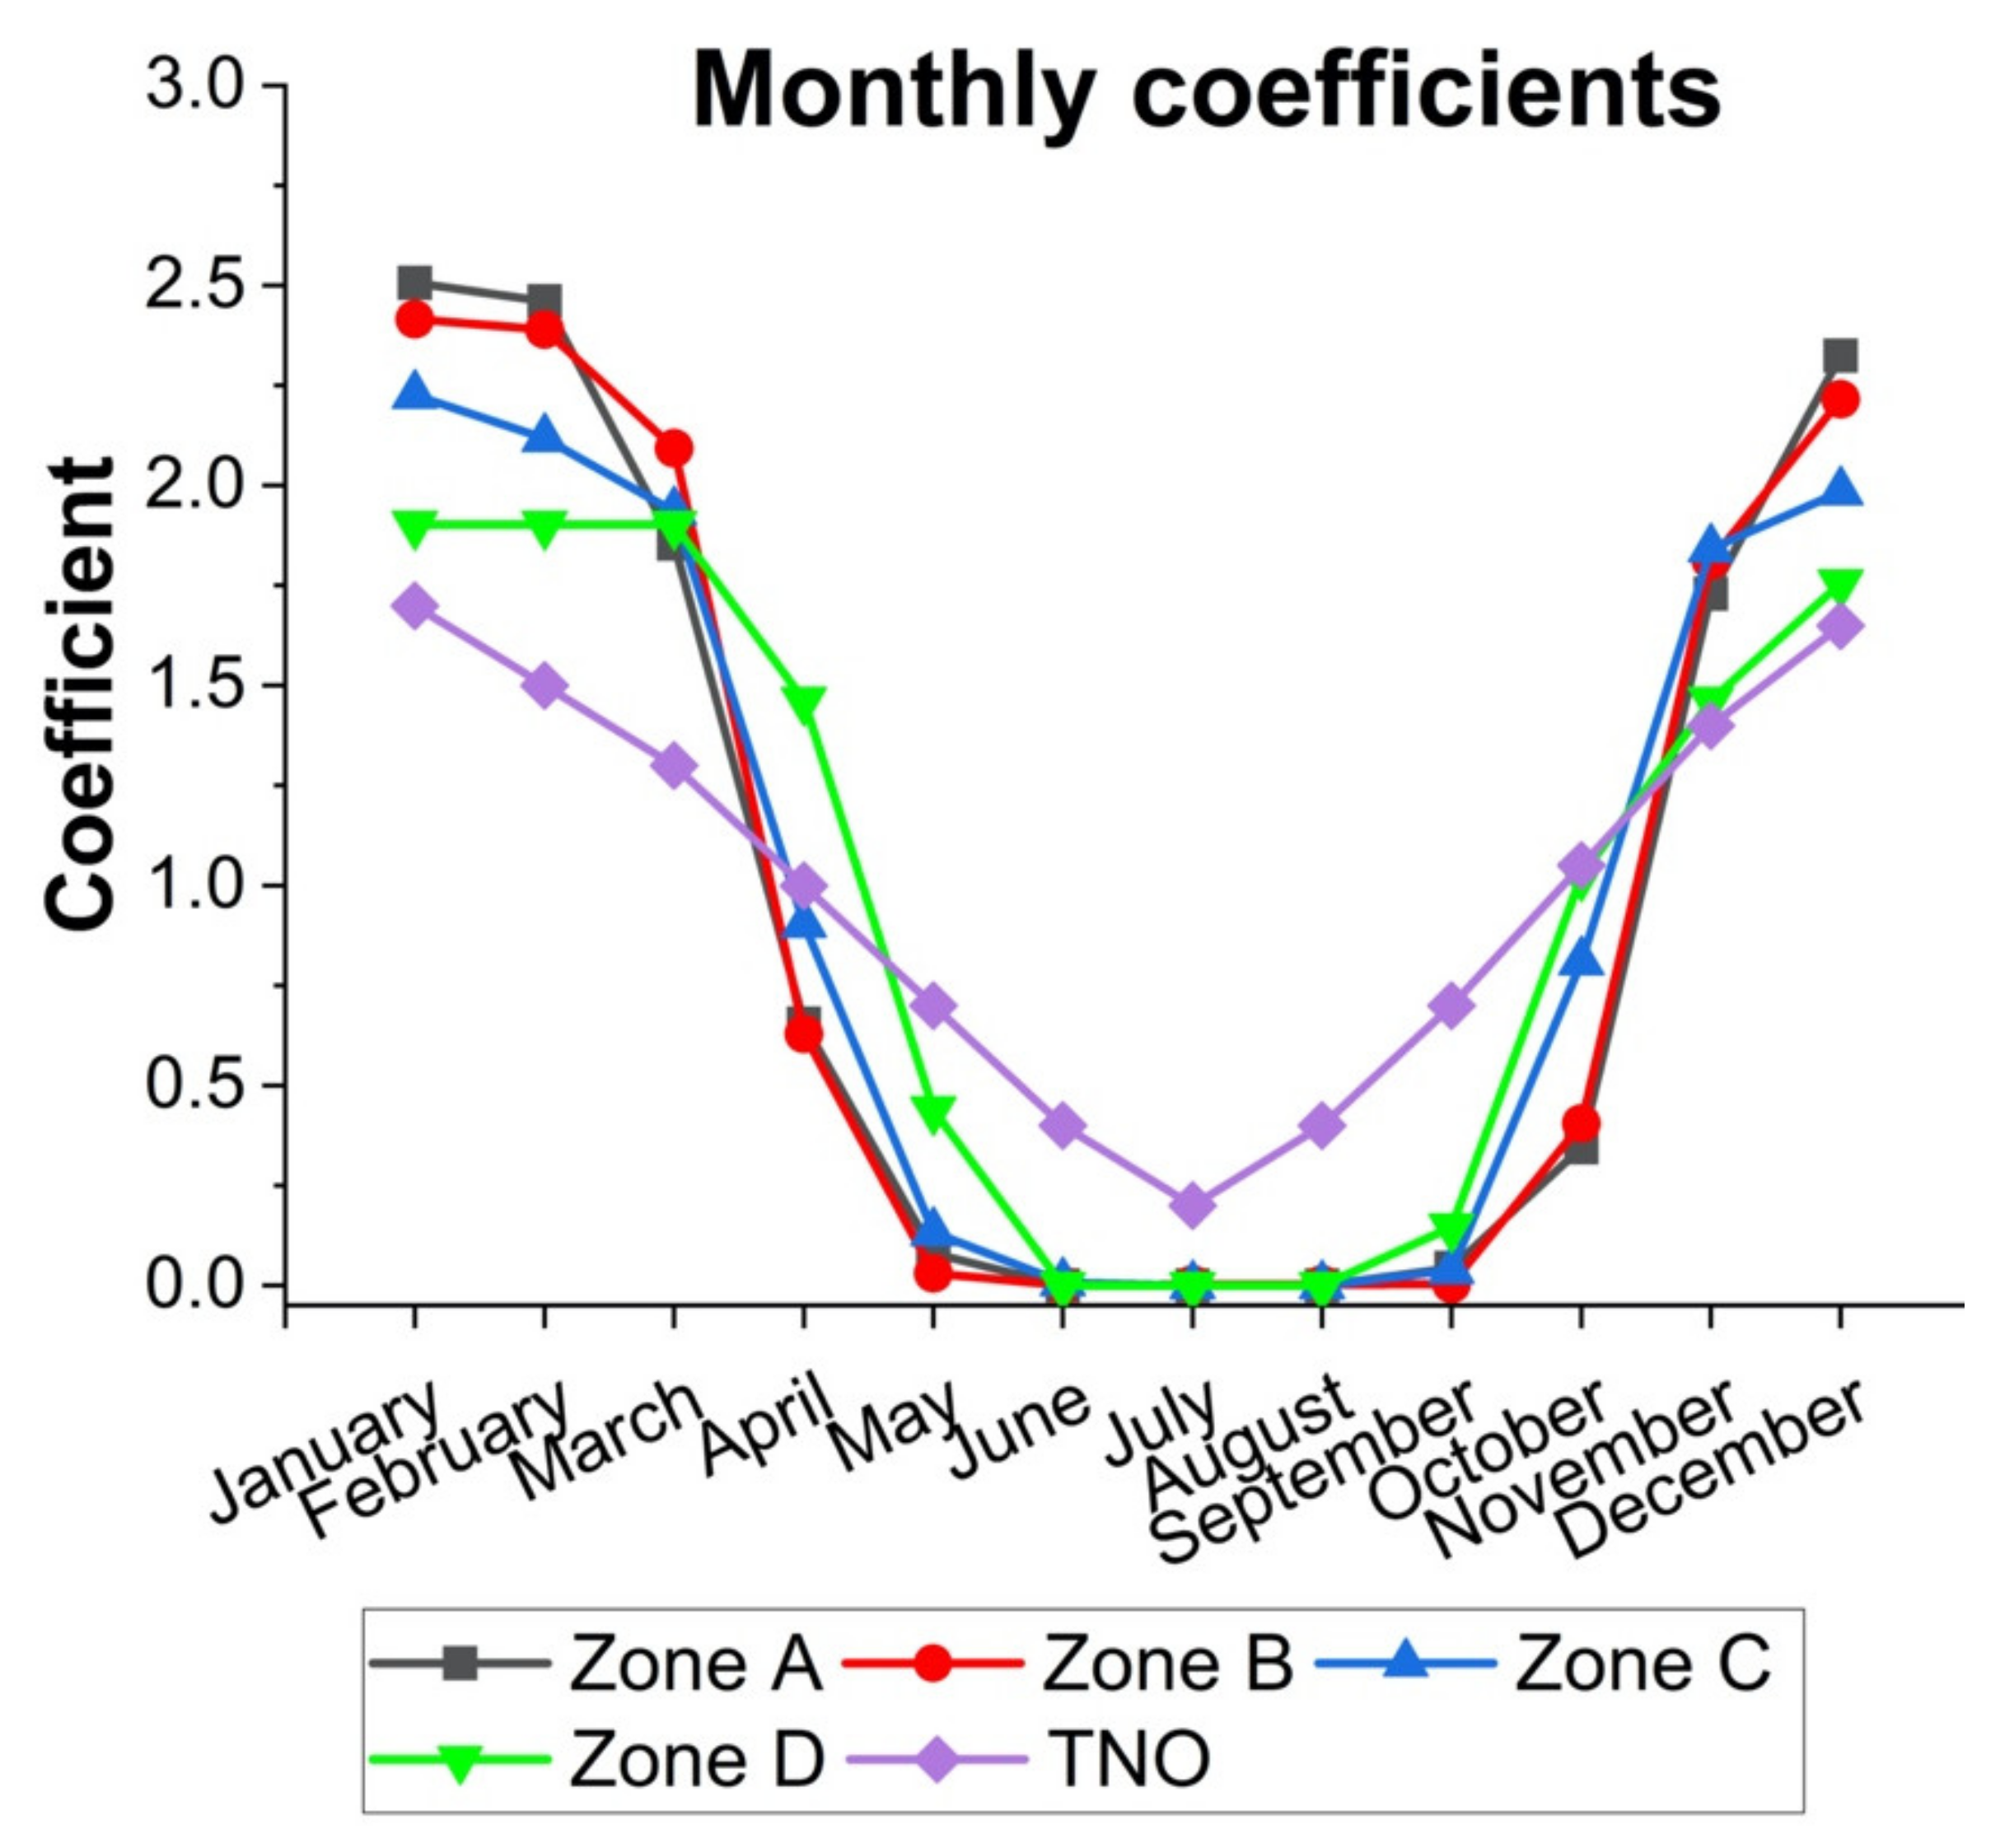
The monthly coefficients produced by this study for the four climatic zones are presented in Figure 10 and are also compared with those proposed by the TNO [44], while the monthly coefficients for each region of Greece are presented in the Supplementary materials (Table S5). It is obvious that the residential heating period is much shorter in Greece than the one proposed by TNO. It usually lasts from October to April and it is even shorter in southern Greece. For Zones A and B, higher values (≥1.7) attributed to November, December, January, February and March are indicative of the low temperatures during the above mentioned period, while values below or equal to 0.7are attributed to the rest of the months. The residential heating period is longer in northern Greece (Zone D) since monthly coefficients for May and September are above zero (0.4 and 0.1 respectively), while for the others they are zero. Moreover, higher coefficients are attributed to Zones C and D for the spring and autumn months in comparison to Zones A and B, due to the lower temperature in northern Greece in comparison to the southern Greek mainland (Attica, Peloponnese) and islands (Crete, Ionian Islands, Aegean South).
Concerning the weekly variation, the daily coefficients produced from the responses to the survey for the disaggregation of monthly emissions to a daily scale, are similar to the ones proposed by TNO. For the weekdays and weekends, the coefficients from TNO and the survey are 1.08 and 0.8 (TNO), 1.09, 0.77 for Saturday and 0.78 for Sunday (FEI-GREGAA), respectively (Table S6). Hourly coefficients were also produced based on the responses received (Figure S4), considering the heating period within the day (Table 2). Higher coefficients are attributed to the period 20:00–24:00 LT and early in the morning (6:00–10:00 LT). Measurements of fine particulate matter conducted in two Greek cities (Athens and Patras) by Florou et al. [45] and Stavroulas et al. [46] confirm the above hourly profile since it was found that the contribution of wood burning for residential heating was 80–90% higher during the evening in case of peak events.

4. Conclusions

Air pollution has a significant impact on human health, and it is therefore important to know the parameters that define local air quality and personal exposure. For this purpose, there is a need for quantified knowledge of the contribution of each appliance to the type of pollutants emitted to ensure the proper operation of heating systems and the selection of the fuel type. This can be achieved with the development of a detailed and fine space resolution emission inventory. In this work, we focused on the development of an emission inventory following a bottom up approach for the collection of localized residential heating patterns. As a result, updated gridded emissions were produced that can be used as an input in photochemical models for performing in depth air quality studies.
In Greece, CO and PM10 emissions had higher values followed by NMVOC and NOx. Biomass burning is related to CO and particles emissions, while NOx emissions are mostly affected by oil consumption and secondarily by biomass. The main heating appliance in Greece is the boiler (68.2% of responses), which is mainly associated with oil (69.8% of responses) and natural gas usage (19.4%) and less with biomass burning (4.9%). The use of air conditioning (15.0%), stoves (6.9%) and fireplaces (5.3%) follows. The geographical distribution of stoves and fireplaces (and thus biomass burning, CO and particles emissions) showed that they are very popular in rural areas since only 9.4% correspond to the region of Attica. The evaluation of people’s perceptions regarding the efficiency of the heating system revealed that the 26.2% of those that have upgraded the heating system of their residence are quite satisfied with the new heating system. Differences in the heating period were found between the regions of Greece; in northern Greece the heating activity lasts longer (from September to May) than in the southern Greek mainland (Attica, Peloponnese) and the islands.
From this research, it was obvious that the crowd sourcing approach to gathering data at the local scale can provide useful information for the development of a bottom up or hybrid (top down-bottom up) emission inventory and consequently more accurately depict the actual air quality. Future applications of the present work will include the examination of the co-benefits for urban air quality and the climate from using biofuels or/and green energy for residential heating.

Supplementary Materials

The following are available online at https://www.mdpi.com/article/10.3390/atmos12091178/s1, Questionnaire about the characteristics of residential heating in Greece (questions 1–28), Table S1. The age of the building that residents have performed changes in order to upgrade its heating performance, Table S2. The annual income of the participants to the survey, Table S3. The age groups of the participants to the survey, Table S4. Type of residence, Figure S1. Percentage use of the main and secondary heating source per number of responses, Figure S2. Responses received in terms of selecting biomass for space heating, Figure S3. The outdoor temperature below which people heat their residence, Figure S4. Responses received related to the period that participants heat their home, Table S5. Monthly coefficients per region of Greece, from TNO and black carbon (BC-NOA) measurements, Table S6. Daily coefficients provided by TNO and produced from this study from survey responses.

Author Contributions

Conceptualization, K.-M.F., K.P., V.K.; Methodology, K.-M.F.; Data analysis, K.-M.F., Writing—original draft preparation, K.-M.F., K.P., V.K.; Project administration, K.-M.F. All authors have read and agreed to the published version of the manuscript.

Funding

This research was funded by the project “Observatory of Air and Particulate Pollution over Greece (Acronym: AirPaP)”. This project has received funding from the Hellenic Foundation for Research and Innovation (HFRI) and the General Secretariat for Research and Innovation (GSRI), under grant agreement No 409.

Institutional Review Board Statement

Not applicable.

Informed Consent Statement

Not applicable.

Data Availability Statement

Not applicable.

Conflicts of Interest

The authors declare no conflict of interest.

References

  1. Nejat, P.; Jomehzadeh, F.; Taheri, M.M.; Gohari, M.; Muhd, M.Z. A global review of energy consumption, CO2 emissions and policy in the residential sector (with an overview of the top ten CO2 emitting countries). Renew. Sustain. Energy Rev. 2015, 43, 843–862. [Google Scholar] [CrossRef]
  2. United Nations. Emissions Gap Emissions Gap Report 2020; United Nations Environmental Programme: Nairobi, Kenya, 2020. [Google Scholar]
  3. Khzouz, M.; Gkanas, E.I.; Shao, J.; Sher, F.; Beherskyi, D.; El-Kharouf, A.; Qubeissi, M.A. Life Cycle Costing Analysis: Tools and Applications for Determining Hydrogen Production Cost for Fuel Cell Vehicle Technology. Energies 2020, 13, 3783. [Google Scholar] [CrossRef]
  4. Yaqoob, H.; Teoh, Y.H.; Goraya, T.S.; Sher, F.; Jamil, M.A.; Rashid, T.; Yar, K.A. Energy evaluation and environmental impact assessment of transportation fuels in Pakistan. Case Stud. Chem. Environ. Eng. 2021, 3, 100081. [Google Scholar] [CrossRef]
  5. Adeniyi, A.G.; Otoikhian, K.S.; Ighalo, J.O. Steam Reforming of Biomass Pyrolysis Oil: A Review. Int. J. Chem. React. Eng. 2019, 17, 20180328. [Google Scholar] [CrossRef]
  6. Yin, C.; Qiu, S.; Zhang, S.; Sher, F.; Zhang, H.; Xu, J.; Wen, L. Strength degradation mechanism of iron coke prepared by mixed coal and Fe2O3. J. Anal. Appl. Pyrolysis 2020, 150, 104897. [Google Scholar] [CrossRef]
  7. Zahid, I.; Ayoub, M.; Abdullah, B.B.; Nazir, M.H.; Zulqarnain; Kaimkhani, M.A.; Sher, F. Activation of nano kaolin clay for bio-glycerol conversion to a valuable fuel additive. Sustainability 2021, 13, 2631. [Google Scholar] [CrossRef]
  8. Sher, F.; Yaqoob, A.; Saeed, F.; Zhang, S.; Jahan, Z.; Klemeš, J.J. Torrefied biomass fuels as a renewable alternative to coal in co-firing for power generation. Energy 2020, 209, 118444. [Google Scholar] [CrossRef]
  9. Liu, L.; Qu, J.; Maraseni, T.N.; Niu, Y.; Zeng, J.; Zhang, L.; Xu, L. Household CO2 Emissions: Current Status and Future Perspectives. Int. J. Environ. Res. Puplic Health 2020, 17, 7077. [Google Scholar] [CrossRef] [PubMed]
  10. Ramacher, M.O.P.; Matthias, V.; Aulinger, A.; Quante, M.; Bieser, J.; Karl, M. Contributions of traffic and shipping emissions to city-scale NOx and PM2.5 exposure in Hamburg. Atmos. Environ. 2020, 237, 117674. [Google Scholar] [CrossRef]
  11. Vedrenne, M.; Borge, R.; Lumbreras, J.; Rodríguez, M.E.; de la Paz, D.; Pérez, J.; Manuel de Andrés, J.; Quaassdorff, C. A comprehensive approach for the evaluation and comparison of emission inventories in Madrid. Atmos. Environ. 2016, 145, 29–44. [Google Scholar] [CrossRef]
  12. Georgiou, G.K.; Kushta, J.; Christoudias, T.; Proestos, Y.; Lelieveld, J. Air quality modelling over the Eastern Mediterranean: Seasonal sensitivity to anthropogenic emissions. Atmos. Environ. 2020, 222, 117–119. [Google Scholar] [CrossRef]
  13. Saffari, A.; Daher, N.; Samara, C.; Voutsa, D.; Kouras, A.; Manoli, E.; Karagkiozidou, O.; Vlachokostas, C.; Moussiopoulos, N.; Shafer, M.M.; et al. Increased biomass burning due to the economic crisis in Greece and its adverse impact on wintertime air quality in Thessaloniki. Environ. Sci. Technol. 2013, 47, 13313–13320. [Google Scholar] [CrossRef]
  14. Papada, L.; Kaliampakos, D. Measuring energy poverty in Greece. Energy Policy 2016, 94, 157–165. [Google Scholar] [CrossRef]
  15. Fameli, K.-M.; Assimakopoulos, V.D. The new open Flexible Emission Inventory for Greece and the Greater Athens Area (FEI-GREGAA): Account of pollutant sources and their importance from 2006 to 2012. Atmos. Environ. 2016, 137, 17–37. [Google Scholar] [CrossRef]
  16. Fameli, K.M.; Kotrikla, A.M.; Psanis, C.; Biskos, G.; Polydoropoulou, A. Estimation of the emissions by transport in two port cities of the northeastern Mediterranean, Greece. Environ. Pollut. 2020, 257, 113598. [Google Scholar] [CrossRef] [PubMed]
  17. López-Aparicio, S.; Vogt, M.; Schneider, P.; Kahila-Tani, M.; Broberg, A. Public participation GIS for improving wood burning emissions from residential heating and urban environmental management. J. Environ. Manag. 2017, 191, 179–188. [Google Scholar] [CrossRef] [PubMed]
  18. Plejdrup, M.S.; Nielsen, O.-K.; Brandt, J. Spatial emission modelling for residential wood combustion in Denmark. Atmos. Environ. 2016, 144, 389–396. [Google Scholar] [CrossRef] [Green Version]
  19. Karim, M.R.; Naser, J. Numerical Modelling of Solid Biomass Combustion: Difficulties in Initiating the Fixed Bed Combustion. Energy Procedia 2017, 110, 390–395. [Google Scholar] [CrossRef]
  20. Savolahti, M.; Karvosenoja, N.; Tissari, J.; Kupiainen, K.; Sippula, O.; Jokiniemi, J. Black carbon and fine particle emissions in Finnish residential wood combustion: Emission projections, reduction measures and the impact of combustion practices. Atmos. Environ. 2016, 140, 495–505. [Google Scholar] [CrossRef]
  21. Vicente, E.D.; Alves, C.A. An overview of particulate emissions from residential biomass combustion. Atmos. Res. 2018, 199, 159–185. [Google Scholar] [CrossRef]
  22. Seljeskog, M.; Goile, F.; Skreiberg, O. Recommended Revisions of Norwegian Emission Factors for Wood Stoves. Energy Procedia 2017, 105, 1022–1028. [Google Scholar] [CrossRef]
  23. Fachinger, F.; Drewnick, F.; Gieré, R.; Borrmann, S. How the user can influence particulate emissions from residential wood and pellet stoves: Emission factors for different fuels and burning conditions. Atmos. Environ. 2017, 158, 216–226. [Google Scholar] [CrossRef]
  24. Wielgosiński, G.; Łechtańska, P.; Namiecińska, O. Emission of some pollutants from biomass combustion in comparison to hard coal combustion. J. Energy Inst. 2017, 90, 787–796. [Google Scholar] [CrossRef]
  25. Arabatzis, G.; Kitikidou, K.; Tampakis, S.; Soutsas, K. The fuelwood consumption in a rural area of Greece. Renew. Sustain. Energy Rev. 2012, 16, 6489–6496. [Google Scholar] [CrossRef]
  26. Santamouris, M.; Paravantis, J.A.; Founda, D.; Kolokotsa, D.; Michalakakou, P.; Papadopoulos, A.M.; Kontoulis, N.; Tzavali, A.; Stigka, E.K.; Ioannidis, Z.; et al. Financial crisis and energy consumption: A household survey in Greece. Energy Build. 2013, 65, 477–487. [Google Scholar] [CrossRef]
  27. Boemi, S.N.; Papadopoulos, A.M. Monitoring energy poverty in Northern Greece: The energy poverty phenomenon. Int. J. Sustain. Energy 2019, 38, 74–88. [Google Scholar] [CrossRef]
  28. Karytsas, S.; Polyzou, O.; Karytsas, C. Factors affecting willingness to adopt and willingness to pay for a residential hybrid system that provides heating/cooling and domestic hot water. Renew. Energy 2019, 142, 591–603. [Google Scholar] [CrossRef]
  29. Zhang, M.; Chen, W.; Shen, X.; Zhao, H.; Gao, C.; Zhang, X.; Liu, W.; Yang, C.; Qin, Y.; Zhang, S.; et al. Comprehensive and high-resolution emission inventory of atmospheric pollutants for the northernmost cities agglomeration of Harbin-Changchun, China: Implications for local atmospheric environment management. J. Environ. Sci. (China) 2021, 104, 150–168. [Google Scholar] [CrossRef]
  30. EEA. EMEP/EEA Air Pollutant Emission Inventory Guidebook 2019, Technical Guidance to Prepare National Emission Inventories; EEA Report No 13/2019; EEA: København, Denmark, 2019. [Google Scholar]
  31. HBS. Household Budget Survey 2017. Hellenic Statistical Authority, A0801_SFA05_TB_AN_00_2017_201_F_GR.xlsx, Data.2021. Available online: https://www.statistics.gr/en/statistics/-/publication/SFA05/2017 (accessed on 30 January 2020).
  32. Lagouvardos, K.; Kotroni, V.; Bezes, A.; Koletsis, I.; Kopania, T.; Lykoudis, S.; Mazarakis, N.; Papagiannaki, K.; Vougioukas, S. The automatic weather stations NOANN network of the National Observatory of Athens: Operation and database. Geosci. Data J. 2017, 4, 4–16. [Google Scholar] [CrossRef]
  33. Papamanolis, N. The first indications of the effects of the new legislation concerning the energy performance of buildings on renewable energy applications in buildings in Greece. Int. J. Sustain. Built Environ. 2015, 4, 391–399. [Google Scholar] [CrossRef] [Green Version]
  34. Caserini, S.; Marazzi, L.; Crovetto, M.; BallarinDenti, A.; Lapi, M.; Bosco, C.; Fraccaroli, A.; Fossati, G.; Guariso, G.; Gurrieri, G. An extensive survey on wood use for domestic heating in Lombardy: Implication for PM emission inventory. In Proceedings of the 14th International Emission Inventory Conference, Transforming Emission Inventories—Meeting Future Challenges Today, Las Vegas, NV, USA, 11–14 April 2005; US Environmental Protection Agency: Washington, DC, USA, 2005. [Google Scholar]
  35. DUKES. Digest of United Kingdom Energy Statistics 2015. 2015. Available online: https://assets.publishing.service.gov.uk/government/uploads/system/uploads/attachment_data/file/450302/DUKES_2015.pdf (accessed on 10 September 2019).
  36. CEC. Residential Wood Use Survey to Improve U.S. Black Carbon Emissions Inventory Data for Small-Scale Biomass Combustion; Commission for Environmental Cooperation: Montreal, QC, Canada, 2019; 60p, Unpublished. [Google Scholar]
  37. World Health Organization (WHO). Harmonized Survey Questions for Monitoring Household Energy Use and SDG Indicators 7.1.1 and 7.1.2. 2019. Available online: https://www.who.int/publications/m/item/list-format-harmonized-survey-questions-for-monitoring-household-energy-use-and-sdg-indicators (accessed on 30 April 2021).
  38. Wiinikka, H.; Grönberg, C.; Boman, C. Emissions of heavy metals during fixed-bed combustion of six biomass fuels. Energy Fuel 2013, 27, 1073–1080. [Google Scholar] [CrossRef]
  39. Zosima, A.T.; Tsakanika, L.A.V.; Ochsenkühn-Petropoulou, M.T. Particulate matter emissions, and metals and toxic elements in airborne particulates emitted from biomass combustion: The importance of biomass type and combustion conditions. J. Environ. Sci. Health Part A 2017, 52, 497–506. [Google Scholar] [CrossRef] [PubMed]
  40. Theodosi, C.; Tsagkaraki, M.; Zarmpas, P.; Grivas, G.; Liakakou, E.; Paraskevopoulou, D.; Lianou, M.; Gerasopoulos, E.; Mihalopoulos, N. Multi-yearchemical composition of the fine-aerosol fraction in Athens, Greece, withemphasis on the contribution of residentialheating in wintertime. Atmos. Chem. Phys. 2018, 18, 14371–14391. [Google Scholar] [CrossRef] [Green Version]
  41. Maenhaut, W.; Vermeylen, R.; Claeys, M.; Vercauteren, J.; Roekens, E. Sources of the PM10 aerosol in Flanders, Belgium, and re-assessment of the contribution fromwoodburning. Sci. Total Environ. 2016, 562, 550–560. [Google Scholar] [CrossRef] [PubMed]
  42. Nava, S.; Lucarelli, F.; Amato, F.; Becagli, S.; Calzolai, G.; Chiari, M.; Giannoni, M.; Traversi, R.; Udisti, R. Biomass burning contributions estimated by synergistic coupling of daily and hourly aerosol composition records. Sci. Total Environ. 2015, 511, 11–20. [Google Scholar] [CrossRef]
  43. YPEN. Ministry of Environment and Energy|Greece’s Informative Inventory Report (IIR); Submission under the UNECE Convention on Long-range Transboundary Air Pollution and national emissions of certain atmospheric pollutants; Ministry of Environment and Energy: Athens, Greece, 2020. [Google Scholar]
  44. TNO. TNO-Report B&O-A R 2005/297, LOTOS-EUROS: Documentation; (LOTOS-EUROS-v11-documentation.pdf); TNO Built Environment and Geoscienses: Amsterdam, The Netherlands, 2005. [Google Scholar]
  45. Florou, K.; Papanastasiou, D.K.; Pikridas, M.; Kaltsonoudis, C.; Louvaris, E.; Gkatzelis, G.I.; Patoulias, D.; Mihalopoulos, N.; Pandis, S.N. The contribution of wood burning and other pollution sources to wintertime organic aerosol levels in two Greek cities. Atmos. Chem. Phys. 2017, 17, 3145–3163. [Google Scholar] [CrossRef] [Green Version]
  46. Stavroulas, I.; Bougiatioti, A.; Grivas, G.; Paraskevopoulou, D.; Tsagkaraki, M.; Zarmpas, P.; Liakakou, E.; Gerasopoulos, E.; Mihalopoulos, N. Sources and processes that control the submicron organic aerosol composition in an urban Mediterranean environment (Athens): A high temporal-resolution chemical composition measurement study. Atmos. Chem. Phys. 2019, 19, 901–919. [Google Scholar] [CrossRef] [Green Version]
Figure 1. Energy consumption by households for space heating (period 2006–2017) in Greece.
Atmosphere 12 01178 g001
Figure 2. Mean monthly temperature for selected cities allocated at the four KENAK Zones. Values for Zones A to D refer to climatic data concerning the profile of the mean temperature at the respective zones.
Atmosphere 12 01178 g002
Figure 3. Number of responses received to the online survey, spatially allocated at the regions of Greece.
Atmosphere 12 01178 g003
Figure 4. The annual variation of CO, PM10, NMVOC and NOx emissions (left) as well as PAHs emissions (right).
Atmosphere 12 01178 g004
Figure 5. Number of responses received regarding the main/secondary heating source and fuel type.
Atmosphere 12 01178 g005
Figure 6. Participants’ perception regarding the efficiency of the heating system.
Atmosphere 12 01178 g006
Figure 7. Energy consumption by fireplaces, stoves and boilers for selected regions of Greece.
Atmosphere 12 01178 g007
Figure 8. CO, NOx, PM10 and NMVOC emissions (in tonnes) for each region of Greece for the year 2017.
Atmosphere 12 01178 g008
Figure 9. Gridded CO emissions at selected regions of Greece; Central Macedonia (top) and Crete (bottom).
Atmosphere 12 01178 g009
Figure 10. Monthly variation of coefficients produced in this study for each climatic zone of Greece and TNO coefficients.
Atmosphere 12 01178 g010
Table 1. The percentage use of the main source type and the climatic zone that each region belongs to (Number of answers received per region in parenthesis).
ZoneBoilerAir Condition & Electric RadiatorsFireplaceStoveOtherTotal Number of Responses per Region
CreteA65.17% (58)20.22% (18)10.11%
(9)
3.37%
(3)
1.12% (1)89
South AegeanA54.17% (13)29.17%
(7)
4.17%
(1)
8.33%
(2)
4.17% (1)24
PeloponneseA (& B) 160.00% (21)22.86%
(8)
5.71% (2)11.43%
(4)
0.00%
(0)
35
Ionian IslandsA & B 253.85% (7)15.38%
(2)
30.77%
(4)
0.00%
(0)
0.00%
(0)
13
AtticaB69.15% (390)20.39% (115)3.01%
(17)
6.38%
(36)
1.06% (6)564
North AegeanB57.14% (8)7.14%
(1)
21.43%
(3)
14.29% (2)0.00%
(0)
14
Western GreeceB61.65% (82)20.30% (27)6.77%
(9)
10.53%
(14)
0.75% (1)133
Central GreeceB (& C) 170.97% (22)12.90%
(4)
6.45%
(2)
6.45%
(2)
3.23% (1)31
EpirusB & C 272.97% (27)18.92%
(7)
5.41%
(2)
0.00%
(0)
2.70% (1)37
Central MacedoniaC73.08% (76)14.42% (15)4.81%
(5)
5.77%
(6)
1.92% (2)104
ThessalyC (& B) 182.43% (61)1.35%
(1)
8.11%
(6)
8.11%
(6)
0.00%
(0)
74
East Mac.&ThraceC (& D) 155.88% (19)20.59%
(7)
5.88%
(2)
11.76%
(4)
5.88% (2)34
Western MacedoniaD76.92% (10)7.69%
(1)
0.00%
(0)
7.69%
(1)
7.69% (1)13
Total 7942136280161167
1 A small part of this region belongs to the zone in parenthesis, 2 The area of this region belongs almost equally to two different zones.
Table 2. Coefficients (in Local Time) for the disaggregation of daily emissions in hourly scale (produced by the survey responses).
6:00–8:008:00–10:0010:00–12:0012:00–14:0014:00–16:0016:00–18:0018:00–20:0020:00–22:0022:00–24:00
Weekday0.1560.1070.0880.0830.0970.1070.1230.1390.102
Saturday0.1540.1070.0860.0850.1000.1070.1220.1330.106
Sunday0.1550.1070.0850.0840.1020.1080.1220.1330.105
Publisher’s Note: MDPI stays neutral with regard to jurisdictional claims in published maps and institutional affiliations.