Abstract
In this work, we investigate the ability of a data assimilation technique and space-borne observations to quantify and monitor changes in nitrogen oxides (NOx) emissions over Northwestern Greece for the summers of 2018 and 2019. In this region, four lignite-burning power plants are located. The data assimilation technique, based on the Ensemble Kalman Filter method, is employed to combine space-borne atmospheric observations from the high spatial resolution Sentinel-5 Precursor (S5P) Tropospheric Monitoring Instrument (TROPOMI) and simulations using the LOTOS-EUROS Chemical Transport model. The Copernicus Atmosphere Monitoring Service-Regional European emissions (CAMS-REG, version 4.2) inventory based on the year 2015 is used as the a priori emissions in the simulations. Surface measurements of nitrogen dioxide (NO2) from air quality stations operating in the region are compared with the model surface NO2 output using either the a priori (base run) or the a posteriori (assimilated run) NOx emissions. Relative to the a priori emissions, the assimilation suggests a strong decrease in concentrations for the station located near the largest power plant, by 80% in 2019 and by 67% in 2018. Concerning the estimated annual a posteriori NOx emissions, it was found that, for the pixels hosting the two largest power plants, the assimilated run results in emissions decreased by ~40–50% for 2018 compared to 2015, whereas a larger decrease, of ~70% for both power plants, was found for 2019, after assimilating the space-born observations. For the same power plants, the European Pollutant Release and Transfer Register (E-PRTR) reports decreased emissions in 2018 and 2019 compared to 2015 (−35% and −38% in 2018, −62% and −72% in 2019), in good agreement with the estimated emissions. We further compare the a posteriori emissions to the reported energy production of the power plants during the summer of 2018 and 2019. Mean decreases of about −35% and−63% in NOx emissions are estimated for the two larger power plants in summer of 2018 and 2019, respectively, which are supported by similar decreases in the reported energy production of the power plants (~−30% and −70%, respectively).
1. Introduction
Emissions of nitrogen oxides (NOx = NO + NO2) play a pivotal role in local and global atmospheric composition and air quality. NOx contributes to the formation of tropospheric ozone, peroxyacyl nitrate (PAN) and nitrate aerosols, and contributes to the environmental acidification [1]. Fossil fuel combustion, mainly originating from power plants, transport and industry, are the main anthropogenic sources of NOx in the atmosphere, while NOx is naturally emitted from soil, biomass burning and lightning [2]. Primarily, NOx is released in the form of NO that rapidly reacts with ozone and transforms into NO2, which is photodissociated during daytime.
The current anthropogenic emission inventories generally rely on the “bottom-up” approach, which uses geographical and statistical data [3,4]. Due to low temporal and spatial resolution of the underlying data, these estimates are highly uncertain. In addition, the input data for an inventory is usually not available in near-real-time but is only completed with a delay of at least one or more years. Unfortunately, rapid changes in tropospheric NO2 levels have been observed and have been attributed to both environmental policy measures [5,6] and global crises, such as the current COVID-19 pandemic [7,8]. A bottom-up emission inventory is understandably unable to represent such changes if it is used in studies that refer to recent years with such strong changes.
In a “top-down” approach, the discrepancy between chemical model predictions and space-borne atmospheric observations is minimized to find the best matching emissions. This approach is gaining more and more ground since satellite observations of improved quality and spatial coverage become available. In recent years, the methods employed to reduce the discrepancies between model and observations are advanced data assimilation techniques and use either in situ observations [9] or satellite retrievals [2,4]. The Ensemble Kalman Filter (EnKF) is such a data assimilation technique [10] that has already been employed in different atmospheric studies. An EnKF approach, used to constrain global NOx emissions based on Ozone Monitoring Instrument, OMI, tropospheric NO2 columns and a global Chemical Transport Model (CTM) by [2]. They reported that the a priori emissions were underestimated in regions of eastern China and United States, Southern Africa and central-western Europe. NOx emissions in Nanjing, China, were similarly studied [11] during a period when the government imposed air quality regulations during the Young Olympic Games in 2014. They detected reductions of at least 25% in NOx emissions in the region during the games.
In the current study, we estimate NOx emission changes in Northwest Greece based on the high spatial resolution Sentinel-5 Precursor (S5P) Tropospheric Monitoring Instrument (TROPOMI) observations and simulations using the LOTOS-EUROS CTM. The emissions of four lignite power plants operating in Northwest Greece are studied for the summer periods (i.e., June, July and August) of 2018 and 2019 and the data assimilation technique applied is a Local Ensemble Transform Kalman Filter system developed around the LOTOS-EUROS CTM. The lignite plants in the region are major and relatively isolated sources of emissions, which renders them an appropriate candidate to apply such an assimilation technique. The study is conducted for the summer periods only, when satellite NO2 time series are less susceptible to gaps due to cloudy days. Moreover, the shorter lifetime of NO2 in summer ([12,13]) facilitates determining NOx emissions sources from NO2 satellite observations.
This paper is organized in three sections. In Section 2, the region of Northwest Greece and the operating power plants are described in detail, followed by the different data sets, models and algorithms used in this work. In Section 3, we present the comparisons between the CTM NO2 columns for the summers of 2018 and 2019 and the TROPOMI tropospheric NO2 observations. The changes in estimated emissions between years 2018, 2019 and 2015 compare with the changes reported in the E-PRTR emissions database for the four power plants for the same years. We further validate the LOTOS-EUROS surface NO2 concentrations against in situ observations from air quality stations that are located near the power plants. Finally, the reported changes in the power plants’ energy production are compared with the calculated changes in emissions found from the inversion algorithm, providing further validation of the emission levels from the power plants. Conclusions and comments are presented in Section 4.
2. Materials and Methods
2.1. Power Plants in Northwest Greece
The Greek National Energy and Climate Plan (NCEP, https://ec.europa.eu/energy/sites/ener/files/el_final_necp_main_en.pdf, accessed on 8 July 2021) is a well-developed strategy that provides environmental objectives, policies and measures. The NCEP integrates the targets set in the Directive 2016/2284/EC concerning the reduction of national emissions of certain atmospheric pollutants, such as NOx, SO2 and NMVOC. Greece’s commitment regarding NOx emissions is a reduction of 31% for the period between 2020 and 2029 and a reduction of 55% after 2030 compared to 2005. According to the European Pollutant Release and Transfer Register (E-PRTR), the region of western Macedonia in Northwest Greece, reported the largest NOx emissions from lignite power plants (about 60 kt) for 2007 followed by the Aegean Sea islands and Crete. NOx emissions in the region of Northwest Greece are reported to decrease significantly in the following years, declining to ~17 kt in 2017. In this work, we hence focus on the regions of Northwest Greece, which hosts four of the largest lignite-burning power plants in Greece.
The topography of Northwest Greece is shown in Figure 1. In the centre of the area, a basin is located in 650 m above mean sea level, which is about ~50 km long and 10 to 25 km wide, surrounded by mountains of around 1350 m above mean sea level. Inside the basin, small hills are present. Vegetation is restricted to isolated trees and small bushes [14]. Four lignite-burning power plants (annotated in Figure 1), operated by the Greek Public Energy Corporation, are located in this basin, and use lignite from nearby open-pit coal-mines. In terms of total installed capacity, the biggest plant is Ag. Dimitrios (~1450 MW; 40.3920°N, 21.9280°E), located in the southeast of the region, followed by Kardia (~1100 MW, 40.4089°N, 21.7857°E), Amyntaio (~550 MW, 40.6178°N, 21.6858°E) and Meliti (~290 MW, 40.8153°N, 21.59829°E). In addition, one more lignite power plant, near the city of Bitola (~680 MW), is operating close to the border with the neighboring Republic of North Macedonia. The climate of the area is continental Mediterranean, characterized by high temperatures in summer and low temperatures in winter, while the prevailing winds during summer in the centre of the basin are mainly of NW, NNW and WNW directions (16.4, 15.6, and 9.9%, respectively) [14]. Nevertheless, the wind direction in the southern part of the basin is NE, dominated by the topography of the region. The villages and towns located in and around the basin, and their population are also shown in Figure 1. Finally, the locations of in situ air quality stations operating in the area are represented by black dots on the map.
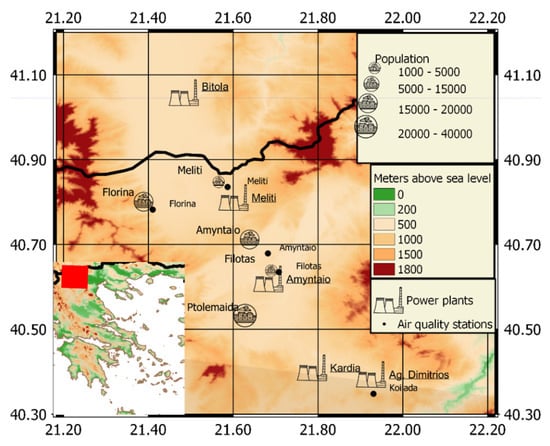
Figure 1.
The topography of the target region with the location of the power plants, cities and towns, and air quality stations.
The annual NOx 2015–2019 emissions, reported in E-PRTR based on measurements of the NOx mass concentrations, for the four large power plants in the region of Northwest Greece (dotted lines in Figure 2) are largest for the Ag. Dimitrios power plant, followed by Kardia, Amyntaio and Meliti, in accordance with their installed capacity. The energy production of the power plants (solid lines in Figure 2), reported by the Energy Exchange Group-EnEx (www.enexgroup.gr, accessed on 14 April 2021), follows the variability of the emissions throughout the years, showing large decreases in energy production in 2019 mainly in the Ag. Dimitrios and Kardia plants. The important reduction of NOx emissions in the region is further confirmed by NO2 column measurements from OMI aboard of the EOS-Aura satellite [15]. The deseasonalized monthly tropospheric NO2 columns at the satellite pixel where the large power plant of Ag. Dimitrios is located is shown in Figure S1 (top) between 2005 and 2020. Especially after 2016, strong reduction in NO2 levels is seen and corresponds very well with the reported decreases in Figure 2. Τhe mean annual tropospheric NO2 columns are shown in Figure S1 (bottom) together with the corresponding trend showing a decrease of about 2.5 × 10¹⁵ molec cm−2 (about −55%) per decade. Since the emissions reported by independent sources show an important decrease, even between the years 2018 and 2019, we study here the ability of the assimilation of satellite observations to sense these changes as well.
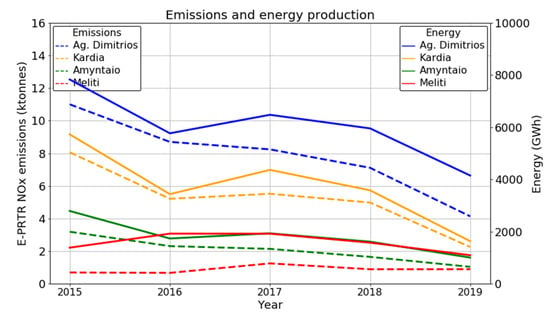
Figure 2.
Annual NOx emissions for the four power plants in the target region as reported by E-PRTR between 2015 and 2019 (dashed lines) and the annual energy reported by the Energy Exchange Group (solid lines) for the four power plants; Ag. Dimitrios (blue), Kardia (orange), Amyntaio (green) and Meliti (red).
2.2. The LOTOS-EUROS CTM
The LOTOS-EUROS (Long Term Ozone Simulation—EURopean Operational Smog model) (https://lotos-euros.tno.nl/, accessed on 7 July 2021) simulates the air pollution in the troposphere while a detailed description of the model is available in [16]. LOTOS-EUROS is one of the nine state-of-the-art systems used in the operational Copernicus Atmosphere Monitoring Services (CAMS, https://atmosphere.copernicus.eu/, accessed on 7 July 2021).
In this study, we use the model version 2.2.001. The simulations cover the domain in Northwest Greece (Figure 3) and expand from 40.2° to 41.2°N and 21.2° to 22.2°E. The horizontal spatial resolution is set to 0.1° longitude × 0.05° latitude (about 10 km × 5 km at Greece latitudes). In the vertical, ten hybrid sigma-pressure layers are used with a top at about 200 hPa; these are obtained as a coarsening of the layers in the meteorological input. The gas phase chemistry follows a modified version of Carbon Bond Mechanism IV scheme (CBM-IV) [17] while the aerosol chemistry uses the ISORROPIA II parameterization [18]. Meteorological variables are obtained at 7 km × 7 km spatial resolution from the Integrated Forecasting System (IFS) of the European Centre for Medium-Range Weather Forecasts (ECMWF). The surface-layer meteorological variables are obtained at hourly resolution while the 3-dimensional variables at model levels every 3 h [19]. Boundary and initial conditions are obtained from the Copernicus Atmosphere Monitoring Service (CAMS, https://atmosphere.copernicus.eu/, accessed on 7 July 2021), global near-real time (NRT) product, at a 3-hour temporal resolution and a spatial resolution of about 35 km. Anthropogenic emissions are taken from the CAMS-REG (CAMS-Regional European emissions) inventory version 4.2 for the year 2015 [20] at a spatial resolution of 0.1° longitude and 0.05° latitude while the emissions temporal profiles used are the default provided with the inventory. The latest available year in this inventory is 2015, and this year is therefore used for the simulations in this study. The emissions are vertically distributed in the model based on fixed height profiles following the approach of EURODELTA project [21]. The emissions are distributed over 8 vertical layers depending on the source category and type (area or point source). In particular, power plants emit from high stacks and more than 90% is considered to be emitted between 184 m and 552 m. The distribution from the height layers to the model layers is hence computed. Biogenic emissions are calculated online using actual meteorology and depend on a detailed land use and tree-species database described in [22]. Soil NO emissions are taken from a parametrization depending on soil type and soil temperature [23]. Emissions for lightning are not included in the simulations. Emissions from biomass burning are obtained from the Global Fire Assimilation System (GFAS) dataset [24].
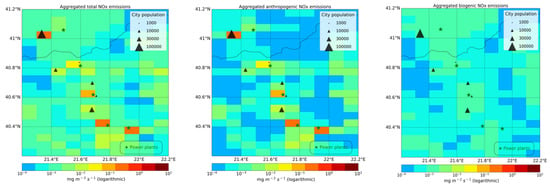
Figure 3.
NOx emissions used in the model in the summer of 2019. (a) Total emissions; (b) Anthropogenic emissions; (c) Biogenic emissions 2019. The green stars denote the power plant locations and the size of the black triangles represent the size of city population.
An extensive evaluation of the overall LOTOS-EUROS performance over Greece using ground-based measurements and satellite derived observations has been performed by [25]. In summary, it has been found that the modelled NO2 columns show a high spatial correlation (0.95) and a negative bias of −18% when compared with S5P/TROPOMI tropospheric columns over Athens in the summertime. The a priori emission inventory and boundary layer height assumptions were found to be significant sources of uncertainty in model simulations.
2.3. The A Priori NOx Emissions
The total a priori anthropogenic and biogenic emissions, used for the simulations in the summer of 2019, are shown in Figure 3. The power plant locations are identified by the green star symbols. The black triangles represent cities, the size of the triangle is proportional to the population.
Τhe sum of the anthropogenic emissions in the grid-cells where the power plants are located constitute more than 95% of the total emissions (including biogenic), making anthropogenic the primary NOx source in this region (Figure 3). The annual anthropogenic emissions from the point sources of public power sector in CAMS-REG over the pixels where the three larger power plants are located are by far dominant (>96%) compared to the rest emitting anthropogenic sources (Table 1). In the grid pixel where the smaller capacity, Meliti, power plant is located, the rest of the emitting anthropogenic emissions account for about 15% of the total anthropogenic emissions.

Table 1.
Annual NOx emissions from CAMS-REG emission inventory based on 2015 for the point sources of category A (public power) and the sum of sectors from area sources at the four grid pixels where the power plants are located.
2.4. The S5P/TROPOMI Satellite Observations
The Sentinel-5 Precursor (S5P) satellite, launched in October 2017, carries the TROPOsperic Monitoring Instrument (TROPOMI), a passive nadir-viewing spectrometer. TROPOMI provides measurements of the atmospheric composition at an unprecedented spatial resolution of 7 × 3.5 km2 at nadir (5.5 × 3.5 km2 since 6 August 2019) with near global coverage in one day. S5P is in an orbit at an altitude of 817 km with an overpass of around 13:30 local solar time [26]. The TROPOMI NO2 retrieval algorithm is based on the DOMINO NO2 retrieval that is used on its predecessor instrument OMI/Aura [27] and is developed by the Royal Netherlands Meteorological Institute (KNMI), described in the product Algorithm Theoretical Basis Document (ATBD, [28]). Validation studies indicated that TROPOMI systematically underestimates the NO2 columns at extremely polluted regions reaching up to biases of 30% [29,30,31], while it overestimates low NO2 columns [32,33]. Recent studies [29,32] suggest that the use of high-resolution a priori profiles from regional models (e.g., from the regional CAMS ensemble) will increase the retrieved tropospheric column by 10–30% over polluted locations with high emissions, explaining part of the bias. Notably, when model outputs are compared with TROPOMI observations using the averaging kernels (as is done in this paper), the a priori profile shape used in the retrieval does not influence the relative comparison. Other uncertainties are related to the surface albedo climatology, and cloud (aerosol) retrievals, and may be responsible for remaining biases of order 10–20%. The TROPOMI NO2 data are routinely validated by comparisons to ground-based reference measurements by the Mission Performance Center Validation Data Analysis Facility (VDAF, http://mpc-vdaf.tropomi.eu, accessed on 7 July 2021).
The NO2 S5P/TROPOMI observations used for the assimilation in the present study are obtained via the Copernicus Open Data Access Hub (https://s5phub.copernicus.eu/, accessed on 7 July 2021). The level 2 reprocessed data, RPRO, v01.02 for the summer of 2018, while for 2019 the offline data (OFFL v1.03) are used. The data are filtered for a quality assurance value higher than 0.75 to ensure mostly cloud-free pixels, as recommended by the Product User Manual (PUM, [34]).
2.5. Ensemble Kalman Filter around LOTOS-EUROS CTM
As mentioned above, the emissions used in the simulation model form a source of uncertainty. In the context of the data assimilation algorithm, the uncertain emissions are modelled according to:
where are the a priori emissions at time k and is a stochastic emission correction factor. In order to specify a smooth uncertainty as described in [35], the emission correction factor follows a structure of a colored noise process instead of a white noise that would be uncorrelated in time [36]. The colored noise has zero mean and standard deviation σ and is implemented by:
where is a white noise vector uncorrelated in time with zero mean and unity standard deviation. Factor α ∈ [0,1] is a time correlation parameter that is used to describe the temporal variation following:
where is a temporal length scale, and is the time step used. The choice of a suitable value for τ is described in Appendix A.
In the Ensemble Kalman Filter, the model uncertainty is represented by an ensemble of state vectors. Here, an augmented state vector is used, containing both the concentrations (c) and the emissions correction factors (. In this way, the assimilated states also provide an estimate of the emission correction. The state vectors are propagated in time using the LOTOS-EUROS model, , and the colored noise model:
The ensemble is propagated by the model until observations, y[k], become available. The observations are then used to analyze the ensemble such that the remain distribution is in agreement with the observations. The simulation of the observation by a state x is described by:
where H is the nonlinear observation operator used to transform the background states from the model space to the observational space; for the satellite NO2 observations this contains the averaging kernel (AK) of the satellite product. Vector is the observation representation error with zero mean and covariance R. The covariance R is defined by the retrieval errors provided by the observational data.
For the analysis the Local Ensemble Transform Kalman Filter-LETKF algorithm is used [37]. The algorithm analyses the state per grid cell. First, all the observations and the corresponding ensemble simulations within a certain distance from the grid cell are collected. This distance depends on the selection of a length-scale called localization radius, ρ. Observations within a distance of 3.5ρ from the grid cell are selected and weighted relative to the inverse of their distance from the grid cell and based on the ρ. These are then used to update the ensemble in the grid cell. For small length-scales, the analysis only changes the ensemble in the grid cells with or close to observations, while using a longer length-scale more observations are used for the analysis of a single grid cell. In this way, the observations that affect the point analysis in each time step depend on the length-scale. In this study, we defined a localization radius equal to 14 km following sensitivity experiments described in Appendix A. The required ensemble size depends (among others) on the choices for ρ and τ, the sensitivity experiments suggested that a small ensemble size of only 12 members is sufficient for the chosen configuration.
2.6. In Situ NO2 Measurements
For the validation of the simulations, as well as for choosing the optimal configuration of the assimilation system over the studied region, hourly in situ surface NO2 measurements from air quality stations in the region have been acquired for the summers of 2018 and 2019 (Dr Evagelopoulos V., University of Western Macedonia, private communication). The location of the stations is shown in Figure 1. Time series of NO2 measurements from the Koilada station [21.9307°E, 40.3557°N], located in the grid cell of the biggest power plant of the region, are shown in Figure 4. The NO2 mean concentration in the summer of 2018 is 6.22 ± 3.93 μg/m3, while in 2019 it is decreased to a mean value of 3.39 ± 2.74 μg/m3. Time series at the Florina station 21.4103, 40.7821, which is in the town of Florina, and the Amyntaio station 21.6818, 40.6789, which is ~8 km from the Amyntaio power plant and ~1.5 km from the town of Amyntaio, are available as supplementary material in Figure S2 and Figure S3.
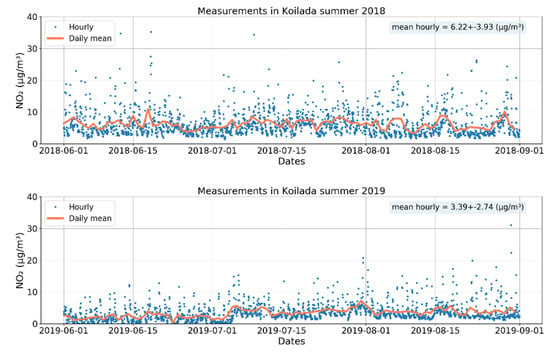
Figure 4.
Time series of NO2 hourly measurements (blue dots) at the station of Koilada and the daily mean NO2 (orange line) for the summer of 2018 (top) and 2019 (bottom).
3. Results and Discussion
3.1. LOTOS-EUROS NO2 Simulations and S5P/TROPOMI Observations
The S5P/TROPOMI tropospheric NO2 observations are regridded onto the model grid (0.10° × 0.05°) using a standard area-weighted averaging method. The observations are weighted depending on their distance from each grid point and the relative average is then calculated. Simulations of the regridded observations are then obtained by application of the AK of the satellite product to the LOTOS-EUROS concentrations. The simulated concentrations are first mapped to the retrieval’s a priori layers to make the comparison between them feasible; the model top at 200 hPa is exactly sufficient to cover the TROPOMI tropospheric column. In this way, the vertical sensitivity of the satellite instrument is taken into account in the comparisons between the model and the observations. The averaging kernels are applied to the model output at the closest time of the satellite overpass, which is on average between 11:00 and 12:00 UTC.
For the summer of 2019, the averaged NO2 tropospheric columns as observed by S5P/TROPOMI are shown in Figure 5a. The corresponding model NO2 values after the AK of the satellite retrieval are applied are shown in Figure 5b. The same figures for the summer of 2018 are shown in Figure S4. The number of available daily satellite observations over the two larger power plants is lower in 2018 compared to 2019, with ~53 and ~70 pixels, respectively. The retrievals and the simulations show similar spatial distributions, with higher values around the two largest power plants, Ag. Dimitrios and Kardia. However, large discrepancies in the absolute values of NO2 are found around the larger power plants where LOTOS-EUROS overestimates NO2 in comparison with S5P/TROPOMI observations. During the summer of 2019, LOTOS-EUROS simulates an average column of about 9 × 10¹⁵ molec cm−2 while TROPOMI observes about 2 × 10¹⁵ molec cm−2 over the same grid cell where Ag. Dimitrios is located (Table 2). A high model bias is also found over the power plant of Kardia (bias of 4.5 × 10¹⁵ molec cm−2), whereas the discrepancy is negligible over the small Meliti power plant. The column simulations are lower for the summer of 2018 than for the summer of 2019 (Figure 6) even though the a priori emissions used are the same. This can be attributed to the different meteorological conditions taking place that affect the NO2 levels together with the different number of daily available satellite observations.
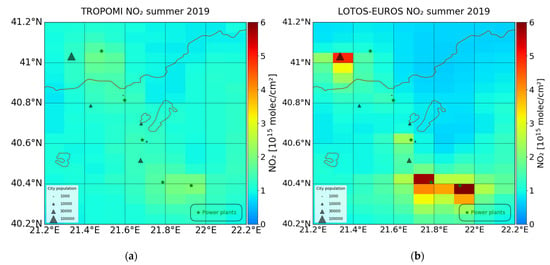
Figure 5.
Seasonal averaged NO2 tropospheric columns in the summer of 2019 (a) from S5P/TROPOMI (b) and LOTOS-EUROS CTM after the AK of the satellite product are applied.

Table 2.
Statistics (mean values, standard deviation and bias) of the S5P/TROPOMI and LOTOS-EUROS NO2 tropospheric columns in 1015 molec cm−2 for the summer of 2018 and 2019 over the four power plants.
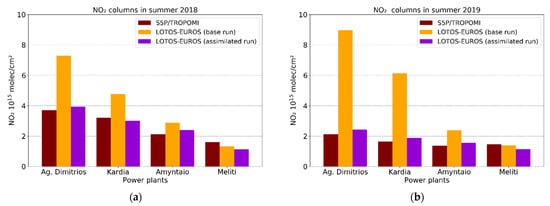
Figure 6.
Μean tropospheric NO2 columns observed by TROPOMI instrument (brown bars), simulated by LOTOS-EUROS (orange bars) and assimilated with S5P/TROPOMI (purple bars) for (a) the summer of 2018 and (b) the summer of 2019.
3.2. Updated Assimilated NOx Emissions
The choice for localization radius ρ and the temporal parameter τ is crucial for the performance of the assimilation system, and are studied with different sensitivity tests shown in Appendix A. The selected localization radius is 14 km and the temporal parameter is 7 days, since these values showed the best performance during the assimilation. A rather small ensemble size of 12 members was sufficient to obtain stable results, as also found in other studies using the same system [38].
After assimilation, the LOTOS-EUROS columns are decreased as expected (Figure 6). The biases between the assimilated columns and the observations over the four power plants are lower than 0.6 molec cm−2 for both 2018 and 2019. In the grid cell where Ag. Dimitrios is located, the average NO2 column in the summer of 2019 (2018) in the assimilated run is about 2.4 × 10¹⁵ molec cm−2 (4 × 10¹⁵ molec cm−2), while TROPOMI observes about 2 × 10¹⁵ molec cm−2 (3.70 × 10¹⁵ molec cm−2) during the same period.
The a priori and a posteriori NOx emissions during the summer of 2019 over the four grid pixels where the power plants are located are shown in Figure S5 for 2018 (top) and 2019 (bottom). The TROPOMI-based emissions are in general lower relative to the a priori emissions which refer to year 2015. The updated emissions over the power plant of Ag. Dimitrios are 38% and 63% lower than a priori emissions in 2018 and 2019, respectively (Table 3). Similarly, over the Kardia power plant the emissions were decreased by 27% in 2018 and by 63% in 2019. In 2018, over the Amyntaio plant negligible emission changes were inferred whereas in 2019 the a posteriori emissions are 37% lower than the a priori. Finally, over the smallest plant of Meliti no important differences are found, and only a small decrease of 11% is found for 2018 (Table 3).

Table 3.
Relative differences between a posteriori emissions estimated in the summer of 2018 and 2019 and a priori emissions used for the simulations over the four grid-pixels.
The daily time series of NOx emissions over the grid cell where Ag. Dimitrios is located is shown in top of Figure 7 for 2018 (left) and 2019 (right). A clear weekly profile is visible in the a priori emissions (orange line) representing the lower NOx emissions assumed during the weekends and stable emissions during the week. It is also shown that during July the emissions are slightly lower than in June and August (~−1% and ~−8%, respectively). However, the a posteriori emissions (purple line) do not follow these profiles. In 2018 the estimated emissions are found to strongly decrease in August by around 40% and 30% compared to June and July, respectively while in 2019 they remain low throughout the period of summer and decrease by 28% in August compared to June and July. A clear day-of-the week profile is not visible either. A large τ selection is reasonable for the case of the power plants, since a large day-to-day emission variation is not expected, but rather a relatively constant bias during all months. No changes in the diurnal variability are found (bottom of Figure 7), as could be expected, since only one satellite measurement per day is available. However, the a posteriori diurnal emissions in 2019 are much lower than the inferred emissions in 2018 and are decreased by more than 60% compared to the a priori emissions. The diurnal variability of NOx emissions of the rest of the power plants is given in Figure S6.
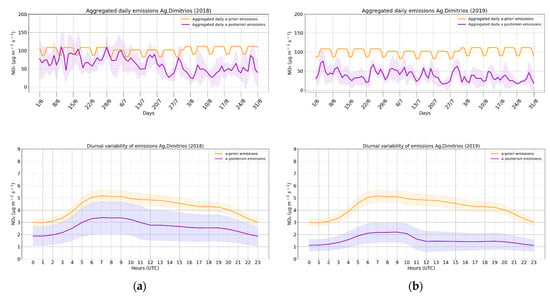
Figure 7.
(Top): Aggregated daily NOx a priori (orange line) and a posteriori (purple line) emissions and the propagated uncertainty (shaded purple area) derived from S5P/TROPOMI assimilation over the Ag. Dimitrios power plant (a) for the summer of 2018 and; (b) the summer of 2019. (Bottom): Diurnal variability and standard deviation of the same emissions.
The annual amount of NOx emitted from the power plants for the years 2018 and 2019 are obtained from the E-PRTR repository and compared to the estimated a posteriori emissions. To allow comparison with the yearly estimates of E-PRTR, we extrapolate the summertime a posteriori emissions to annual totals estimates assuming that there is no seasonal variability in the power plants emissions. The relative differences of the E-PRTR reported from 2015 to 2018 and 2019 are shown in Figure 8. The NOx emissions of the three larger power plants show a good overall agreement in both 2018 and 2019. The changes reported by E-PRTR in 2019 are −62% and −72% for Ag. Dimitrios and Kardia power plants, respectively, while the estimated changes are −70% for both power plants. In 2018, the changes reported by E-PRTR for Ag. Dimitrios and Kardia power plants are −35% and −38%, respectively, while the estimated changes in the a posteriori emissions are −50% and −42%, respectively, showing a good agreement in this case as well. The case of Meliti power plant is less representative of the grid cell where it is located, since as already discussed before (in Section 2.2) there are more emission sources in the region and the power plant has a small capacity (~290 MW). Moreover, in Figure 5 a first indication of transboundary pollution was evident. To further prove this, wind roses are plotted using the ECMWF wind components used for the simulations, for the hour closer to the TROPOMI overpass over the area (~12:00 UTC). Figure S7 and Figure S8 show the wind direction and speed over the pixels of the power plant and the city of Bitola, in the neighboring country (Republic of North Macedonia), for the summer of 2018 and 2019, respectively. The dominant winds for both seasons are North and Northeast. Furthermore, Figure S9 shows that the dominant winds over Meliti power plant are of a Northwest direction for both 2018 and 2019. According to these findings, it is safe to assume that NOx from Bitola is affecting the Meliti power plant near the border of the two countries.
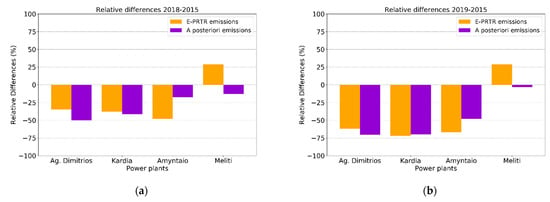
Figure 8.
Relative differences of E-PRTR annual reported emissions (orange bars) and the assimilated annual emissions (purple bars) (a) for 2018 and (b) 2019, both with respect to E-PRTR 2015 reported emissions.
3.3. Validation of the A Posteriori NOx Simulations
3.3.1. In Situ Measurements
In order to validate the a posteriori NOx simulations, surface NO2 concentrations simulated using the a priori emissions (base run) and the TROPOMI-based emissions (assimilated run) are compared with hourly in situ NO2 measurements. In Figure 9, the mean summer surface NO2 as simulated by the base run (left) and the assimilated run (right) are shown together with the mean summer NO2 values of the in situ stations in 2019 (Figure S10 for 2018), depicted as colored circles. The assimilated NO2 concentrations are reduced over the whole region and especially around the power plants of Ag. Dimitrios and Kardia compared to the base run (Figure 9 and Figure S10).
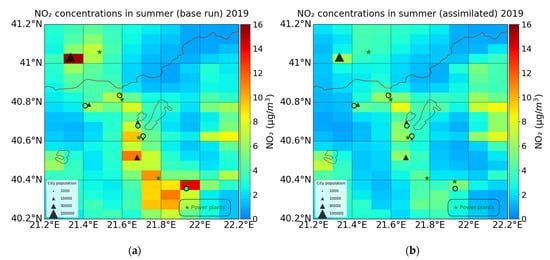
Figure 9.
LOTOS-EUROS surface simulations compared with the in situ measurements (colored circles). (a) base run for the summer of 2019; (b) assimilated run for the summer of 2019. The color of the circles indicates the average summer-time level of the in situ measurements.
The NO2 measurements of Koilada station, which is affected by the largest power plant in the area, are lower in 2019 (3.39 ± 2.74 μg/m3) compared to 2018 (6.22 ± 3.93 μg/m3). For both years the NO2 measurements are much lower than the base run results (bias of 10.52 μg/m3 in 2019 and 8.46 μg/m3 in 2018), while the assimilated run succeeds in reducing the bias (biases of 2.0 μg/m3 in 2019and 2.8 μg/m3 in 2018) (Table S1 and Table 4). Furthermore, the diurnal variability of the air quality observations in Koilada (Figure 10 and Figure S11 left) is better represented by the assimilated runs since the concentrations are much closer to the measurements, as is also found for the morning diurnal simulations at the Florina air quality station (Figure 10 and Figure S11 right).

Table 4.
Statistics of the comparison of LOTOS-EUROS surface simulations in the base and assimilated runs with surface measurements in the summer of 2019. P.P. refers to power plant.

Figure 10.
Diurnal variability of the simulated NO2 surface concentrations using the a priori emissions (orange lines), the a posteriori emissions from the S5P/TROPOMI assimilation (purple lines) and in situ measurements (black lines) of the station Koilada (left) and Florina (right) for the summer of 2019.
Similarly, surface NO2 concentrations measured from the Amyntaio air quality station, which is affected by the neighboring town and power plant, are lower than the base run results (bias 3.49 μg/m3 in 2019 and 1.13 μg/m3 in 2018), while the biases are reduced when compared with the assimilated concentrations (bias 1.73 μg/m3 and 0.85 μg/m3 in 2019 and 2018, respectively). It is also worth mentioning that the NO2 measurements in 2019 are lower than in 2018 in this case as well (4.00 ± 2.25 μg/m3 and 6.37±3.82 μg/m3, respectively).
Surface NO2 levels measured in Meliti station are high in 2019 (8.18 ± 6.46 μg/m3) and 2018 (10.93 ± 11.05 μg/m3) and the model underestimates the NO2 levels both before and after assimilation. This is possibly due to possible transboundary pollution from the Bitola power plant, already discussed in the literature [39]. To state that, as already discussed in Section 2.5, the prevailing winds of N–NW direction, appear to transport pollution from the power plant and the city of Bitola in Republic of North Macedonia to North Greece.
3.3.2. Energy Production of the Power Plants
In order to further evaluate the updated a posteriori NOx emissions, the reported monthly energy production data per power station are examined. The aforementioned data are available publicly through reports of the Day-ahead Scheduling Archive for Greece and are available online by the Energy Exchange Group-EnEx (www.enexgroup.gr, accessed on 14 April 2021). Monthly as well as yearly energy production data for the four power plants are extracted for years 2015, 2018 and 2019.
The total energy production per power plant for the summer period studied in years 2015, 2018 and 2019 is shown Figure 11a together with the a priori emissions in summer based in 2015 CAMS-REG emission inventory and the assimilated NOx emissions for 2018 and 2019 in Figure 11b. The energy production of the Ag. Dimitrios, Kardia and Amyntaio power plants decreases in 2018 and 2019 compared to 2015. These reductions are in accordance with the reductions found in the corresponding a posteriori NOx emissions (Figure 11b). It is also shown that energy production and NOx emissions in 2019 are even lower than in 2018. The relative differences between the a priori and a posteriori emissions directly compared to the relative differences between the power plant energy productions are shown in Table 5 for 2018–2015 and 2019–2015. Over the two larger power plants (Ag. Dimitrios and Kardia), the changes in energy and emissions are consistent for both 2018 and 2019. Larger decreases are found for both energy and emissions in 2019 compared to 2018 as well. In the case of the Meliti power plant, the emissions remain nearly the same, despite the fact that the energy production in 2019 is twice lower than in 2015 and 2018. Overall, the emission reduction is even more pronounced in 2019 compared to 2015 at the three largest power plants of Ag. Dimitrios, Kardia and Amyntaio and this is further confirmed by the reduction of the energy production in the same year that reaches at least 50%.
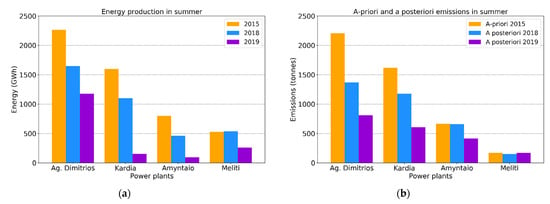
Figure 11.
Bar plots (a) of the energy production reported for the summer of 2015 (orange bars), 2018 (blue bars) and 2019 (purple bars); (b) of the a priori 2015 CAMS-REG emissions in summer (orange bars) and a posteriori emissions in the summer of 2018 (blue bars) and 2019 (purple bars) for the four power plants.

Table 5.
Relative differences between seasonal a posteriori and a priori emissions in the four pixels and energy production of the four power plants between 2018 and 2015 and 2019 and 2015.
4. Conclusions
In this work, an advanced data assimilation system is used to estimate the NOx emission changes at four lignite power plants operating in Northwest Greece. An ensemble Kalman filter operating around the LOTOS-EUROS CTM is employed to estimate the NOx surface emissions with a resolution of 0.1° in longitude and 0.05° in latitude using S5P/TROPOMI NO2 column retrievals. The a priori anthropogenic emissions are based on reports for 2015 and are obtained from Copernicus Atmosphere Monitoring Service-Regional European emissions (CAMS-REG) version 4.2. Our main conclusions can be summarized below.
- For 2019, the summertime a posteriori emissions estimated for the two largest power plants of Ag. Dimitrios and Kardia decreased by more than 60% compared to the a priori 2015 emissions, while in 2018 they are reduced by around 33%.
- Stronger decreases in the energy production are reported for the summer period of 2019 compared to the summer of 2018 as well, in line with the estimated emission reduction. The energy production of the Ag. Dimitrios power plant decreased by around 50% in 2019 compared to 2015, while in Kardia and Amyntaio energy decreased by 90% for the summer of 2019. In the summer of 2018, the energy production in the three larger power plants decreased by around 30–45%.
- The a posteriori annual emission changes estimated over the two larger power plants in 2018 compared to the a priori 2015 emissions are ~−40% to −50%, whereas the changes for 2019 are ~−70% for both power plants. These a posteriori annual NOx emissions agree well in line with the annual emissions reported by E-PRTR. The changes in the annual E-PRTR 2018 reported emissions compared to 2015 over Ag. Dimitrios and Kardia are −35% and −38%, while for 2019 this decrease rises to −62% and −72%, closely following the findings of this work.
- In situ NO2 measurements from air quality stations of Koilada and Amyntaio, which are directly affected by pollution from the power plants of Ag. Dimitrios and Amyntaio, show an improved agreement with the assimilated NO2 simulations compared to the base run which is based on the 2015 CAMS a priori emissions. The bias in the station of Koilada near the power plant of Ag. Dimitrios improves to 2 μg/m3 (2.83 μg/m3) from 10.5 μg/m3 (8.46 μg/m3) in 2019 (2018).
- The results for the Meliti power plant were found not to be representative of the grid cell where the plant is located due to presence of other emission sources affecting that grid cell. The dominant winds over the neighboring Bitola power plant are northerly for both summers of 2018 and 2019, showing that pollution may flow from the neighboring country of Republic of North Macedonia towards Northwest Greece.
Overall, the method proposed here is appropriate in detecting emission trends of local large emitters, and could be valuable also for regions in the world where no up-to-date emission inventories are available. The results of this study support the idea that NO2 observations of high temporal and spatial resolution can be used in data assimilation of a validated CTM via the use of the EnKF in order to improve NOx emissions.
Supplementary Materials
The following are available online at https://www.mdpi.com/article/10.3390/atmos12070900/s1, Figure S1: Top: Time series of deseasonalized mothly NO2 columns from OMI/AURA for the period between 2005 and 2020 at the pixel where Ag. Dimitrios is located. Bottom: Time series of mean annual NO2 columns from OMI/AURA at the same location. The shaded area denotes the standard deviation of the mean values and the trend is shown in blue, Figure S2: Timeseries of NO2 hourly measurements (blue dots) in the station of Florina and the daily mean NO2 (orange line) for the summer of 2018 (top) and 2019 (bottom). Figure S3: Timeseries of NO2 hourly measurements (blue dots) in the station of Amyntaio and the daily mean NO2 (orange line) for the summer of 2018 (top) and 2019 (bottom), Figure S4: Seasonal averaged NO2 tropospheric columns in summer 2018 (a) from S5P/TROPOMI; (b) and LOTOS-EUROS CTM after the AK of the satellite product are applied, Figure S5: (a) Aggregated NOx a priori emissions over the four grid pixels in Northwest Greece used for the base run in summer 2018 (top) and summer 2019 (bottom); (b) same for the NOx a posteriori emissions assimilated using S5P/TROPOMI observations, Figure S6: (a) Diurnal variability of NOx a priori and a posteriori emissions derived from TROPOMI assimilation over the power plants of Kardia (top), Amyntaio (middle) and Meliti (bottom) are located in summer 2018; (b) the same for summer 2019. The shaded areas refer to the standard deviation of the averaged values, Figure S7: Windroses for the pixels around around the power plant and city of Bitola in summer 2018, Figure S8: Windroses for the pixels around around the power plant and city of Bitola in summer 2019, Figure S9: Windroses for the pixels around the power plant and city of Meliti in summer 2018 (top) and 2019 (bottom), Figure S10: LOTOS-EUROS surface simulations compared with in situ measurements (coloured circles). (a) base run for summer 2018 (b) assimilated run for summer 2018. The color of the circles indicates the average summer-time level of the in situ measurements, Figure S11: (a) Diurnal variability of NO2 surface concentrations as simulated by the model using the a priori emissions (orange lines), the a posteriori emissions form S5P/TROPOMI assimilation (purple lines) and in situ measurements (black lines) of the station Koilada (left) and Florina (right) for summer 2018, Table S1: Statistics of the comparison of LOTOS-EUROS surface simulations with the a priori emissions (base run) and the simulations with the a posteriori emissions (assimilated) with in situ surface measurements in summer 2018. P.P. refers to power plant.
Author Contributions
Conceptualization, M.-E.K. and D.B.; Methodology, I.S. and M.-E.K.; Software, I.S. and A.S.; Supervision, M.-E.K. and D.B.; Visualization, I.S.; Writing—original draft, I.S. and M.-E.K.; Writing—review and editing, M.-E.K., A.S., A.M., D.B., T.S., J.v.G. and H.E. All authors have read and agreed to the published version of the manuscript.
Funding
This research has been co-financed by the European Union (European Regional Development Fund) and Greek national funds through the Operational Program “Competitiveness, Entrepreneurship and Innovation” (NSRF 2014–2020) by the “Panhellenic Infrastructure for Atmospheric Composition and Climate Change” project (MIS 5021516) and well as the “Innovative system for Air Quality Monitoring and Forecasting” project [code T1EDK-01697, MIS 5031298), implemented under the Action “Reinforcement of the Research and Innovation” Infrastructure.
Institutional Review Board Statement
Not applicable.
Informed Consent Statement
Not applicable.
Data Availability Statement
The S5P/TROPOMI observations are publicly available from the Copernicus Open Access Hub (https://scihub.copernicus.eu/ (accessed on 7 July 2021) ESA, 2021). The LOTOS-EUROS CTM simulations are available upon request. The air quality monitoring station data are available by personal communication with Evagelopoulos, V. by the University of Western Macedonia. The E-PRTR data are available via the website https://prtr.eea.europa.eu/ (accessed on 7 July 2021). The energy production reports are available online by the Energy Exchange Group-EnEx (www.enexgroup.gr, accessed on 14 April 2021). The OMI QA4ECV NO₂ Essential Climate Variable (ECV) precursor products are obtained from www.temis.nl (accessed on 7 July 2021).
Acknowledgments
We acknowledge the usage of modified Copernicus Sentinel data (2019–2020). Results presented in this work have been produced using the Aristotle University of Thessaloniki (AUTh) high-performance computing infrastructure and resources. Ioanna Skoulidou, Maria-Elissavet Koukouli, and Dimitris Balis would like to acknowledge the support provided by the IT Center of the AUTh throughout the progress of this research work.
Conflicts of Interest
The authors declare no conflict of interest.
Appendix A
Since different parameters may affect the performance of the assimilation system, a series of sensitivity tests were conducted in order to select the optimal configuration for the present study. The experiments were performed for July 2019 and the NO2 surface simulations from the base run, using the a priori NOx emissions, and the distinct assimilation experimental runs, using the updated a posteriori NOx emissions, are compared with hourly NO2 in situ measurements of the air quality station Koilada (Table A1). The in situ station Koilada is located at the same grid cell as the Ag. Dimitrios power plant, which is the pixel with the largest bias between the model predictions and the S5P/TROPOMI observations (Table A1).

Table A1.
Performance of the EnKF system for different parameters; the localization radius (ρ) and the temporal correlation parameter (τ). Hourly in situ measurements in the Koilada air quality station are compared with hourly surface simulations for July month. The statistics are given in μg/m3.
Table A1.
Performance of the EnKF system for different parameters; the localization radius (ρ) and the temporal correlation parameter (τ). Hourly in situ measurements in the Koilada air quality station are compared with hourly surface simulations for July month. The statistics are given in μg/m3.
| Localization Radius (ρ) in km | |||
|---|---|---|---|
| Configuration | Mean | Bias | RMSE |
| Base run | 13.05 | 9.17 | 12.21 |
| ρ = 0 | 8.37 | 4.49 | 7.40 |
| ρ = 5 | 7.46 | 3.58 | 6.36 |
| ρ = 7 | 7.20 | 3.31 | 6.01 |
| ρ = 14 | 6.56 | 2.68 | 5.31 |
| ρ = 20 | 6.49 | 2.61 | 5.23 |
| Temporal correlation parameter (τ) in days | |||
| Configuration | Mean | Bias | RMSE |
| Base run | 13.05 | 9.17 | 12.21 |
| τ = 1 | 8.83 | 4.95 | 8.04 |
| τ = 3 | 6.56 | 2.68 | 5.31 |
| τ = 5 | 5.82 | 1.94 | 4.52 |
| τ = 7 | 5.46 | 1.57 | 4.18 |
The first parameter examined is the localization radius (ρ) described in Section 2.4. The observations that affect the grid cell analysis in each time step depend on the length scale, which means that the larger the length selected the more observations are used for the analysis of a single grid cell. According to [40] a localization procedure will prevent spurious correlations that may appear in the analysis due to the finite ensemble size selected. For the sensitivity tests, a temporal correlation parameter was set equal to 3 days and 5 different values of ρ were examined: ρ of 0, 5, 7, 14 and 20 km. The performance improves when the length is increased to 14 km and the bias decreases to 2.68 μg/m3 (Table A1), compared to a bias of 12.21 μg/m3 of the base run and 6.01 μg/m3 when selecting ρ equal to 7 km. The bias does not improve significantly when the localization radius is further increased to 20 km (bias of 2.61 μg/m3) (Figure A1). Moreover, since this study is focused on point sources of power plants and in the area around the stations no other significant NOx sources are found, choosing a very large length may affect the results with observations of background values leading to an artificial NOx decrease.
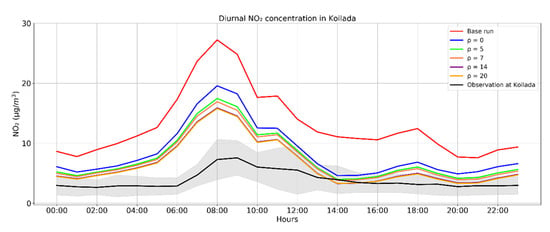
Figure A1.
Diurnal cycle of the assimilated NO2 simulations in July 2019 from the sensitivity tests using ρ values of 0, 5, 7, 14 and 20 km in the grid pixel where Koilada air quality station and Ag. Dimitrios power plant are located. The black line denotes the in situ measurement of Koilada station, with the associated standard deviation shown as a grey shaded area, while the red line the base run performed.
The second sensitivity experiment performed concerns the temporal correlation parameter (τ) described in Section 2.4. Different values of τ are studied in the assimilation system; τ of 1, 3, 5 and 7 days, while the localization radius during the tests is fixed and equal to 14 km. The overestimations of the NO2 simulations when compared to the in situ measurements reduces to a bias of 1.57 μg/m3 (Table A1) when τ is equal to 7 days while when τ is small the NO2 concentrations are less influenced and closer to the base run simulations (Figure A2). As a result, the temporal parameter used for the assimilations is set to 7 days.
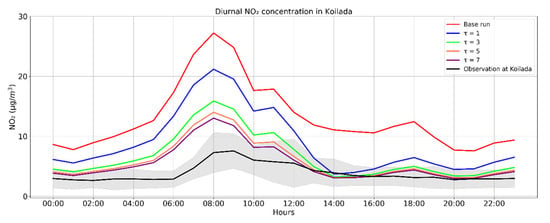
Figure A2.
Diurnal cycle of the assimilated NO2 simulations in July 2019 from the sensitivity tests using τ values of 1, 3, 5 and 7 days [different colored lines] in the grid pixel where Koilada air quality station and Ag. Dimitrios power plant are located. The black line denotes the in situ measurement of Koilada station, with the associated standard deviation shown as a grey shaded area, while the red line the base run performed.
References
- Varshney, C.K.; Singh, A.P. Passive samplers for NOx monitoring: A critical review. Environmentalist 2003, 23, 127–136. [Google Scholar] [CrossRef]
- Miyazaki, K.; Eskes, H.J.; Sudo, K. Global NOx emission estimates derived from an assimilation of OMI tropospheric NO2 columns. Atmos. Chem. Phys. 2012, 12, 2263–2288. [Google Scholar] [CrossRef] [Green Version]
- Streets, D.G.; Bond, T.C.; Carmichael, G.R.; Fernandes, S.D.; Fu, Q.; He, D.; Klimont, Z.; Nelson, S.M.; Tsai, N.Y.; Wang, M.Q.; et al. An inventory of gaseous and primary aerosol emissions in Asia in the year 2000. J. Geophys. Res. Atmos. 2003, 108. [Google Scholar] [CrossRef]
- Müller, J.-F.; Stavrakou, T. Inversion of CO and NO2 emissions using the adjoint of the IMAGES model. Atmos. Chem. Phys. 2005, 5, 1157–1186. [Google Scholar] [CrossRef] [Green Version]
- Castellanos, P.; Boersma, K.F. Reductions in nitrogen oxides over Europe driven by environmental policy and economic recession. Sci. Rep. 2012, 2, 1–7. [Google Scholar] [CrossRef]
- Duncan, B.N.; Lamsal, L.N.; Thompson, A.M.; Yoshida, Y.; Lu, Z.; Streets, D.G.; Hurwitz, M.M.; Pickering, K.E. A space-based, high-resolution view of notable changes in urban NOx pollution around the world (2005–2014). J. Geophys. Res. 2016, 121, 976–996. [Google Scholar] [CrossRef] [Green Version]
- Koukouli, M.E.; Skoulidou, I.; Karavias, A.; Parcharidis, I.; Balis, D.; Manders, A.; Segers, A.; Eskes, H.; Van Geffen, J. Sudden changes in nitrogen dioxide emissions over Greece due to lockdown after the outbreak of COVID-19. Atmos. Chem. Phys. 2021, 21, 1759–1774. [Google Scholar] [CrossRef]
- Bauwens, M.; Compernolle, S.; Stavrakou, T.; Müller, J.F.; van Gent, J.; Eskes, H.; Levelt, P.F.; Veefkind, J.P.; Vlietinck, J.; Yu, H.; et al. Impact of Coronavirus outbreak on NO2 pollution assessed using TROPOMI and OMI observations. Geophys. Res. Lett. 2020, 47, e2020GL087978. [Google Scholar] [CrossRef] [PubMed]
- Wu, H.; Tang, X.; Wang, Z.; Wu, L.; Li, J.; Wang, W.; Yang, W.; Zhu, J. High-spatiotemporal-resolution inverse estimation of CO and NOx emission reductions during emission control periods with a modified ensemble Kalman filter. Atmos. Environ. 2020, 236, 117631. [Google Scholar] [CrossRef]
- Evensen, G. Sequential data assimilation with a nonlinear quasi-geostrophic model using Monte Carlo methods to forecast error statistics. J. Geophys. Res. 1994, 99, 10143–10162. [Google Scholar] [CrossRef]
- Ding, J.; Van Der, A.R.J.; Mijling, B.; Levelt, P.F.; Hao, N. NOx emission estimates during the 2014 youth olympic games in Nanjing. Atmos. Chem. Phys. 2015, 15, 9399–9412. [Google Scholar] [CrossRef] [Green Version]
- Liu, F.; Beirle, S.; Zhang, Q.; Dörner, S.; He, K.; Wagner, T. NOx lifetimes and emissions of cities and power plants in polluted background estimated by satellite observations. Atmos. Chem. Phys. 2016, 16, 5283–5298. [Google Scholar] [CrossRef] [Green Version]
- Shah, V.; Jacob, D.J.; Li, K.; Silvern, R.; Zhai, S.; Liu, M.; Lin, J.; Zhang, Q. Effect of changing NOx lifetime on the seasonality and long-term trends of satellite-observed tropospheric NO2 columns over China. Atmos. Chem. Phys. 2020, 20, 1483–1495. [Google Scholar] [CrossRef] [Green Version]
- Triantafyllou, A.G. PM10 pollution episodes as a function of synoptic climatology in a mountainous industrial area. Environ. Pollut. 2001, 112, 491–500. [Google Scholar] [CrossRef]
- Levelt, P.F.; Joiner, J.; Tamminen, J.; Veefkind, J.P.; Bhartia, P.K.; Zweers, D.C.S.; Duncan, B.N.; Streets, D.G.; Eskes, H.; Van Der, R.A.; et al. The ozone monitoring instrument: Overview of 14 years in space. Atmos. Chem. Phys. 2018, 18, 5699–5745. [Google Scholar] [CrossRef] [Green Version]
- Manders, A.M.M.; Builtjes, P.J.H.; Curier, L.; Gon, H.A.C.D.; Hendriks, C.; Jonkers, S.; Kranenburg, R.; Kuenen, J.J.P.; Segers, A.J.; Timmermans, R.M.A.; et al. Curriculum vitae of the LOTOS-EUROS (v2.0) chemistry transport model. Geosci. Model Dev. 2017, 10, 4145–4173. [Google Scholar] [CrossRef] [Green Version]
- Schaap, M.; Timmermans, R.M.A.; Roemer, M.; Boersen, G.A.C.; Builtjes, P.J.H.; Sauter, F.J.; Velders, G.J.M.; Beck, J.P. The LOTOS-EUROS model: Description, validation and latest developments. Int. J. Environ. Pollut. 2008, 32, 270–290. [Google Scholar] [CrossRef]
- Fountoukis, C.; Nenes, A. ISORROPIA II: A computationally efficient thermodynamic equilibrium model for for K+–Ca2+–Mg2+–NH4+–Na+–SO42−–NO3−–Cl−–H2O aerosols. Atmos. Chem. Phys 2007, 7, 4639–4659. [Google Scholar] [CrossRef] [Green Version]
- Flemming, J.; Inness, A.; Flentje, H.; Huijnen, V.; Moinat, P.; Schultz, M.G.; Stein, O. Coupling global chemistry transport models to ECMWF’s integrated forecast system. Geosci. Model Dev. 2009, 2, 253–265. [Google Scholar] [CrossRef] [Green Version]
- Granier, C.; Darras, S.; Denier Van Der Gon, H.; Jana, D.; Elguindi, N.; Bo, G.; Michael, G.; Marc, G.; Jalkanen, J.-P.; Kuenen, J. The Copernicus Atmosphere Monitoring Service Global and Regional Emissions (April 2019 Version); HAL: Bangalore, India, 2019; pp. 1–55. [Google Scholar]
- Thunis, P.; Cuvelier, C.; Roberts, P.; White, L.; Post, L.; Tarrasón, L.; Tsyro, S.; Stern, R.; Kerschbaumer, A.; Rouїl, L.; et al. EURODELTA-II. Eval. Sect. Approach to Integr. Assess. Model. Incl. Mediterr. Sea EUR 2008, 23444. [Google Scholar] [CrossRef]
- Beltman, J.B.; Hendriks, C.; Tum, M.; Schaap, M. The impact of large scale biomass production on ozone air pollution in Europe. Atmos. Environ. 2013, 71, 352–363. [Google Scholar] [CrossRef] [Green Version]
- Novak, J.H.; Pierce, T.E. Natural emissions of oxidant precursors. Water Air Soil Pollut. 1993, 67, 57–77. [Google Scholar] [CrossRef]
- Kaiser, J.W.; Heil, A.; Andreae, M.O.; Benedetti, A.; Chubarova, N.; Jones, L.; Morcrette, J.J.; Razinger, M.; Schultz, M.G.; Suttie, M.; et al. Biomass burning emissions estimated with a global fire assimilation system based on observed fire radiative power. Biogeosciences 2012, 9, 527–554. [Google Scholar] [CrossRef] [Green Version]
- Skoulidou, I.; Koukouli, M.-E.; Manders, A.; Segers, A.; Karagkiozidis, D.; Gratsea, M.; Balis, D.; Bais, A.; Gerasopoulos, E.; Stavrakou, T.; et al. Evaluation of the LOTOS-EUROS NO2 simulations using ground-based measurements and S5P/TROPOMI observations over Greece. Atmos. Chem. Phys. 2021, 21, 5269–5288. [Google Scholar] [CrossRef]
- Veefkind, J.P.; Boersma, K.F.; Wang, J.; Kurosu, T.P.; Krotkov, N.; Chance, K.; Levelt, P.F. Global satellite analysis of the relation between aerosols and short-lived trace gases. Atmos. Chem. Phys. 2011, 11, 1255–1267. [Google Scholar] [CrossRef] [Green Version]
- Boersma, K.F.; Eskes, H.J.; Dirksen, R.J.; Van Der, A.R.J.; Veefkind, J.P.; Stammes, P.; Huijnen, V.; Kleipool, Q.L.; Sneep, M.; Claas, J.; et al. An improved tropospheric NO2 column retrieval algorithm for the Ozone Monitoring Instrument. Atmos. Meas. Tech. 2011, 4, 1905–1928. [Google Scholar] [CrossRef] [Green Version]
- Van Geffen, J.; Eskes, H.J.; Boersma, K.F.; Maasakkers, J.D.; Veefkind, J.P. TROPOMI ATBD of the Total and Tropospheric NO2 Data Products, Report S5P-KNMI-L2-0005-RP, Version 1.4.0; KNMI: De Bilt, The Netherlands, 2019; Available online: http://www.tropomi.eu/documents/atbd/ (accessed on 2 June 2021).
- Dimitropoulou, E.; Hendrick, F.; Pinardi, G.; Friedrich, M.M.; Merlaud, A.; Tack, F.; De Longueville, H.; Fayt, C.; Hermans, C.; Laffineur, Q.; et al. Validation of TROPOMI tropospheric NO2 columns using dual-scan multi-axis differential optical absorption spectroscopy (MAX-DOAS) measurements in Uccle, Brussels. Atmos. Meas. Tech. 2020, 13, 5165–5191. [Google Scholar] [CrossRef]
- Tack, F.; Merlaud, A.; Iordache, M.D.; Pinardi, G.; Dimitropoulou, E.; Eskes, H.; Bomans, B.; Veefkind, P.; Van Roozendael, M. Assessment of the TROPOMI tropospheric NO2 product based on airborne APEX observations. Atmos. Meas. Tech. 2021, 14, 615–646. [Google Scholar] [CrossRef]
- Verhoelst, T.; Compernolle, S.; Pinardi, G.; Lambert, J.C.; Eskes, H.J.; Eichmann, K.U.; Fjæraa, A.M.; Granville, J.; Niemeijer, S.; Cede, A.; et al. Ground-based validation of the Copernicus Sentinel-5P TROPOMI NO2 measurements with the NDACC ZSL-DOAS, MAX-DOAS and Pandonia global networks. Atmos. Meas. Tech. 2021, 14, 481–510. [Google Scholar] [CrossRef]
- Ialongo, I.; Virta, H.; Eskes, H.; Hovila, J.; Douros, J. Comparison of TROPOMI/Sentinel-5 Precursor NO2 observations with ground-based measurements in Helsinki. Atmos. Meas. Tech. 2020, 13, 205–218. [Google Scholar] [CrossRef] [Green Version]
- Zhao, X.; Griffin, D.; Fioletov, V.; McLinden, C.; Cede, A.; Tiefengraber, M.; Müller, M.; Bognar, K.; Strong, K.; Boersma, F.; et al. Assessment of the quality of tropomi high-spatial-resolution no2 data products in the greater toronto area. Atmos. Meas. Tech. 2020, 13, 2131–2159. [Google Scholar] [CrossRef]
- Eskes, H.J.; van Geffen, J.; Boersma, K.F.; Eichmann, K.U.; Apituley, A.; Pedergnana, M.; Sneep, M.; Veefkind, J.P.; Loyola, D. S5P/TROPOMI Level-2 Product User Manual Nitrogen Dioxide; ESA: Paris, France, 2020; Available online: http://www.tropomi.eu/documents/pum/ (accessed on 2 June 2020).
- Segers, A. Data Assimilation in Atmospheric Chemistry Models Using Kalman Filtering. Ph.D. Thesis, Delft University, Delft, Netherlands, 2002. [Google Scholar]
- Jazwinski, A.H. Stochastic Processes and Filtering Theory; Academic Press: New York, NY, USA, 1970; p. 699. [Google Scholar]
- Shin, S.; Kang, J.S.; Jo, Y. The Local Ensemble Transform Kalman Filter (LETKF) with a Global NWP Model on the Cubed Sphere. Pure Appl. Geophys. 2016, 173, 2555–2570. [Google Scholar] [CrossRef] [Green Version]
- Curier, R.L.; Timmermans, R.; Calabretta-Jongen, S.; Eskes, H.; Segers, A.; Swart, D.; Schaap, M. Improving ozone forecasts over Europe by synergistic use of the LOTOS-EUROS chemical transport model and in-situ measurements. Atmos. Environ. 2012, 60, 217–226. [Google Scholar] [CrossRef]
- Syrakos, A.; Efthimiou, G.C.; Lappas, A.; Sfetsos, A.; Gounaris, N.; Politis, M.; Bartzis, J.G.; Sotiropoulos, D.; Kotzinos, K.; Nikolaou, G.; et al. Assessment of the performance of the UoWM MM5-smoke-CMAQ operational system for west Macedonia. In Proceedings of the HARMO 2010-13th International Conference on Harmonisation within Atmospheric Dispersion Modelling for Regulatory Purposes, Bruges, Belgum, 3–6 June 2010; pp. 200–204. [Google Scholar]
- Ott, E.; Hunt, B.R.; Szunyogh, I.; Zimin, A.V.; Kostelich, E.J.; Corazza, M.; Kalnay, E.; Patil, D.J.; Yorke, J.A. A local ensemble Kalman filter for atmospheric data assimilation. Tellus Ser. Dyn. Meteorol. Oceanogr. 2004, 56, 415–428. [Google Scholar] [CrossRef]
Publisher’s Note: MDPI stays neutral with regard to jurisdictional claims in published maps and institutional affiliations. |
© 2021 by the authors. Licensee MDPI, Basel, Switzerland. This article is an open access article distributed under the terms and conditions of the Creative Commons Attribution (CC BY) license (https://creativecommons.org/licenses/by/4.0/).