Article

Composting and Methane Emissions of Coffee By-Products

by
Macarena San Martin Ruiz
*,
Martin Reiser
and
Martin Kranert
Institute for Sanitary Engineering, Water Quality and Solid Waste Management (ISWA), University of Stuttgart, Bandtäle 2, 70569 Stuttgart, Germany
*
Author to whom correspondence should be addressed.
Atmosphere 2021, 12(9), 1153; https://doi.org/10.3390/atmos12091153
Submission received: 10 August 2021 / Revised: 2 September 2021 / Accepted: 3 September 2021 / Published: 7 September 2021
(This article belongs to the Topic Climate Change and Environmental Sustainability)

Abstract

:
In the last 20 years, the demand for coffee production has increased detrimentally, heightening the need for production, which is currently driving the increase in land cultivation for coffee. However, this increase in production ultimately leads to the amplification of waste produced. This study aims to develop an experimental methodology for sustainable coffee by-products (Pulp (CP)) in Costa Rica for nutrient-rich compost. The performance of the experiments is to explore and optimize composting processes following its key parameters. This will allow quantifying the emissions rate to obtain an emission factor for CP during the open composting process and optimizing the conditions to minimize CH4 emissions using P and green waste (GW) materials. Five CP and GW mixtures were analyzed for the composting process for ten weeks, acting P as primary input material as a by-product. Quantification of the methane emissions was performed in two areas: composting area and open field deposition. Peak temperatures of compost appeared at twenty-five days for control and five days for GW added treatments. CP emission factors provide a similar result with the standard values recommended by the literature, accomplishing the emission reductions. Thus, this study designed and validated a sustainable protocol for transforming coffee by-products into compost.

1. Introduction

Agriculture is responsible for an essential portion of global emissions, contributing to 45% of their methane (CH4) emissions globally, impacting climate change [1]. In addition, gas concentrations act as indicators that show biological degradation, and this guides optimization possibilities of developing new strategies for emissions reduction [2]. Therefore, it is required to estimate greenhouse gas (GHG) emission rates as they are the flow of a pollutant expressed in weight per unit of time [3]. Emissions rates are necessary to calculate an emission factor, a representative value that attempts to relate the amount of a pollutant released into the atmosphere with an activity associated with the release of that pollutant [4]. The detection of gaseous emissions during composting coffee by-products is one of the most critical tools to meet the challenge of reducing CH4 emissions from the waste residues generated in the coffee processing industry [5,6]. Coffee is a worldwide used product and of the most valued commodities in trade, being one of the most important agricultural exports in Costa Rica [7]. In coffee processing, the production chain comprehends several steps. Firstly, the berries from the coffee plants are transported to be washed and peeled (de-pulping), separating the green beans from the pulp or husk [8]. The outer membrane that envelops the coffee bean is called the pulp (CP) (mesocarp), which contains 43% w/w of the morphology of the coffee fruit [9,10,11]. CP is one of the main by-products generated during the process [11]. It contributes to pollution, environmental and health problems of the surrounding waters, soil, and atmosphere when the coffee berries are ripe and processed during the wet method and mishandled [12,13]. Some researchers and the Costa Rican Coffee Institute (ICAFE) indicate CP management has been one of the challenged coffee by-products with the most significant volume of waste [9,14]. In addition, it accumulates for long periods, and it leads to the generation of foul odors, being a favorable environment for reproducing flies and other pests responsible for multiple diseases [15,16]. Currently, the country has a top priority: reducing GHG emissions in the coffee industry, together with a National Decarbonization Plan 2050 [17]. Hence, studying methane emissions during the composting of the coffee by-products and finding new approaches will be crucial to achieving future goals and mitigating the current challenges with coffee by-products each harvest.
Composting has been a promising technique for waste treatment in converting organic matter and agricultural residues into compost, even using minor technologies and operational expenses [18,19]. Aerobic composting involves the changes in the properties and degradation of the substrates [20]. In addition, the existence of aeration in the system gives biological products from the metabolism of the process, such as carbon dioxide, water, and [21,22] heat. During the composting process, three phases are observed in the aerobic decomposition: initial and degradation, conversion, and maturation. In addition, possess two types of microbial activity during this decomposition: thermophilic stage (45–70 °C) and mesophilic stage (15–45 °C) [21,23,24,25,26] The first stage is linked with the microbial activity of the material and is followed by a second stage, where the conversion of the organic material occurs [27]. The final stage is the maturation process, which occurs at ambient temperature and mesophilic micro-organisms play a role in finishing the product (mainly bacteria and fungi) [28]. Even if a composting technique is beneficial to the environment, GHG is present during the process, enhancing global warming [29]. The emissions will depend on the waste type and composition, key composting parameters such as C/N, temperature, moisture, pH [27,30], and the final use of the compost [31].
This study aims to develop an experimental methodology for sustainable coffee by-products for nutrient-rich compost following key composting parameters and quantify CH4 emissions rate to obtain an emission factor for CP from open composting processes to optimize operating conditions CH4 emissions. Furthermore, with the usage of improved management of coffee by-products, it will grand new approaches of the residue in the coffee industry. This will allow the communities and the coffee sector to receive a positive environmental impact where the aim is to reduce GHG emissions, odors, and pathogens generated. On the other hand, the farmers could make sustainable use of the compost in the future, returning soil amendment into their coffee plantations.

2. Materials and Methods

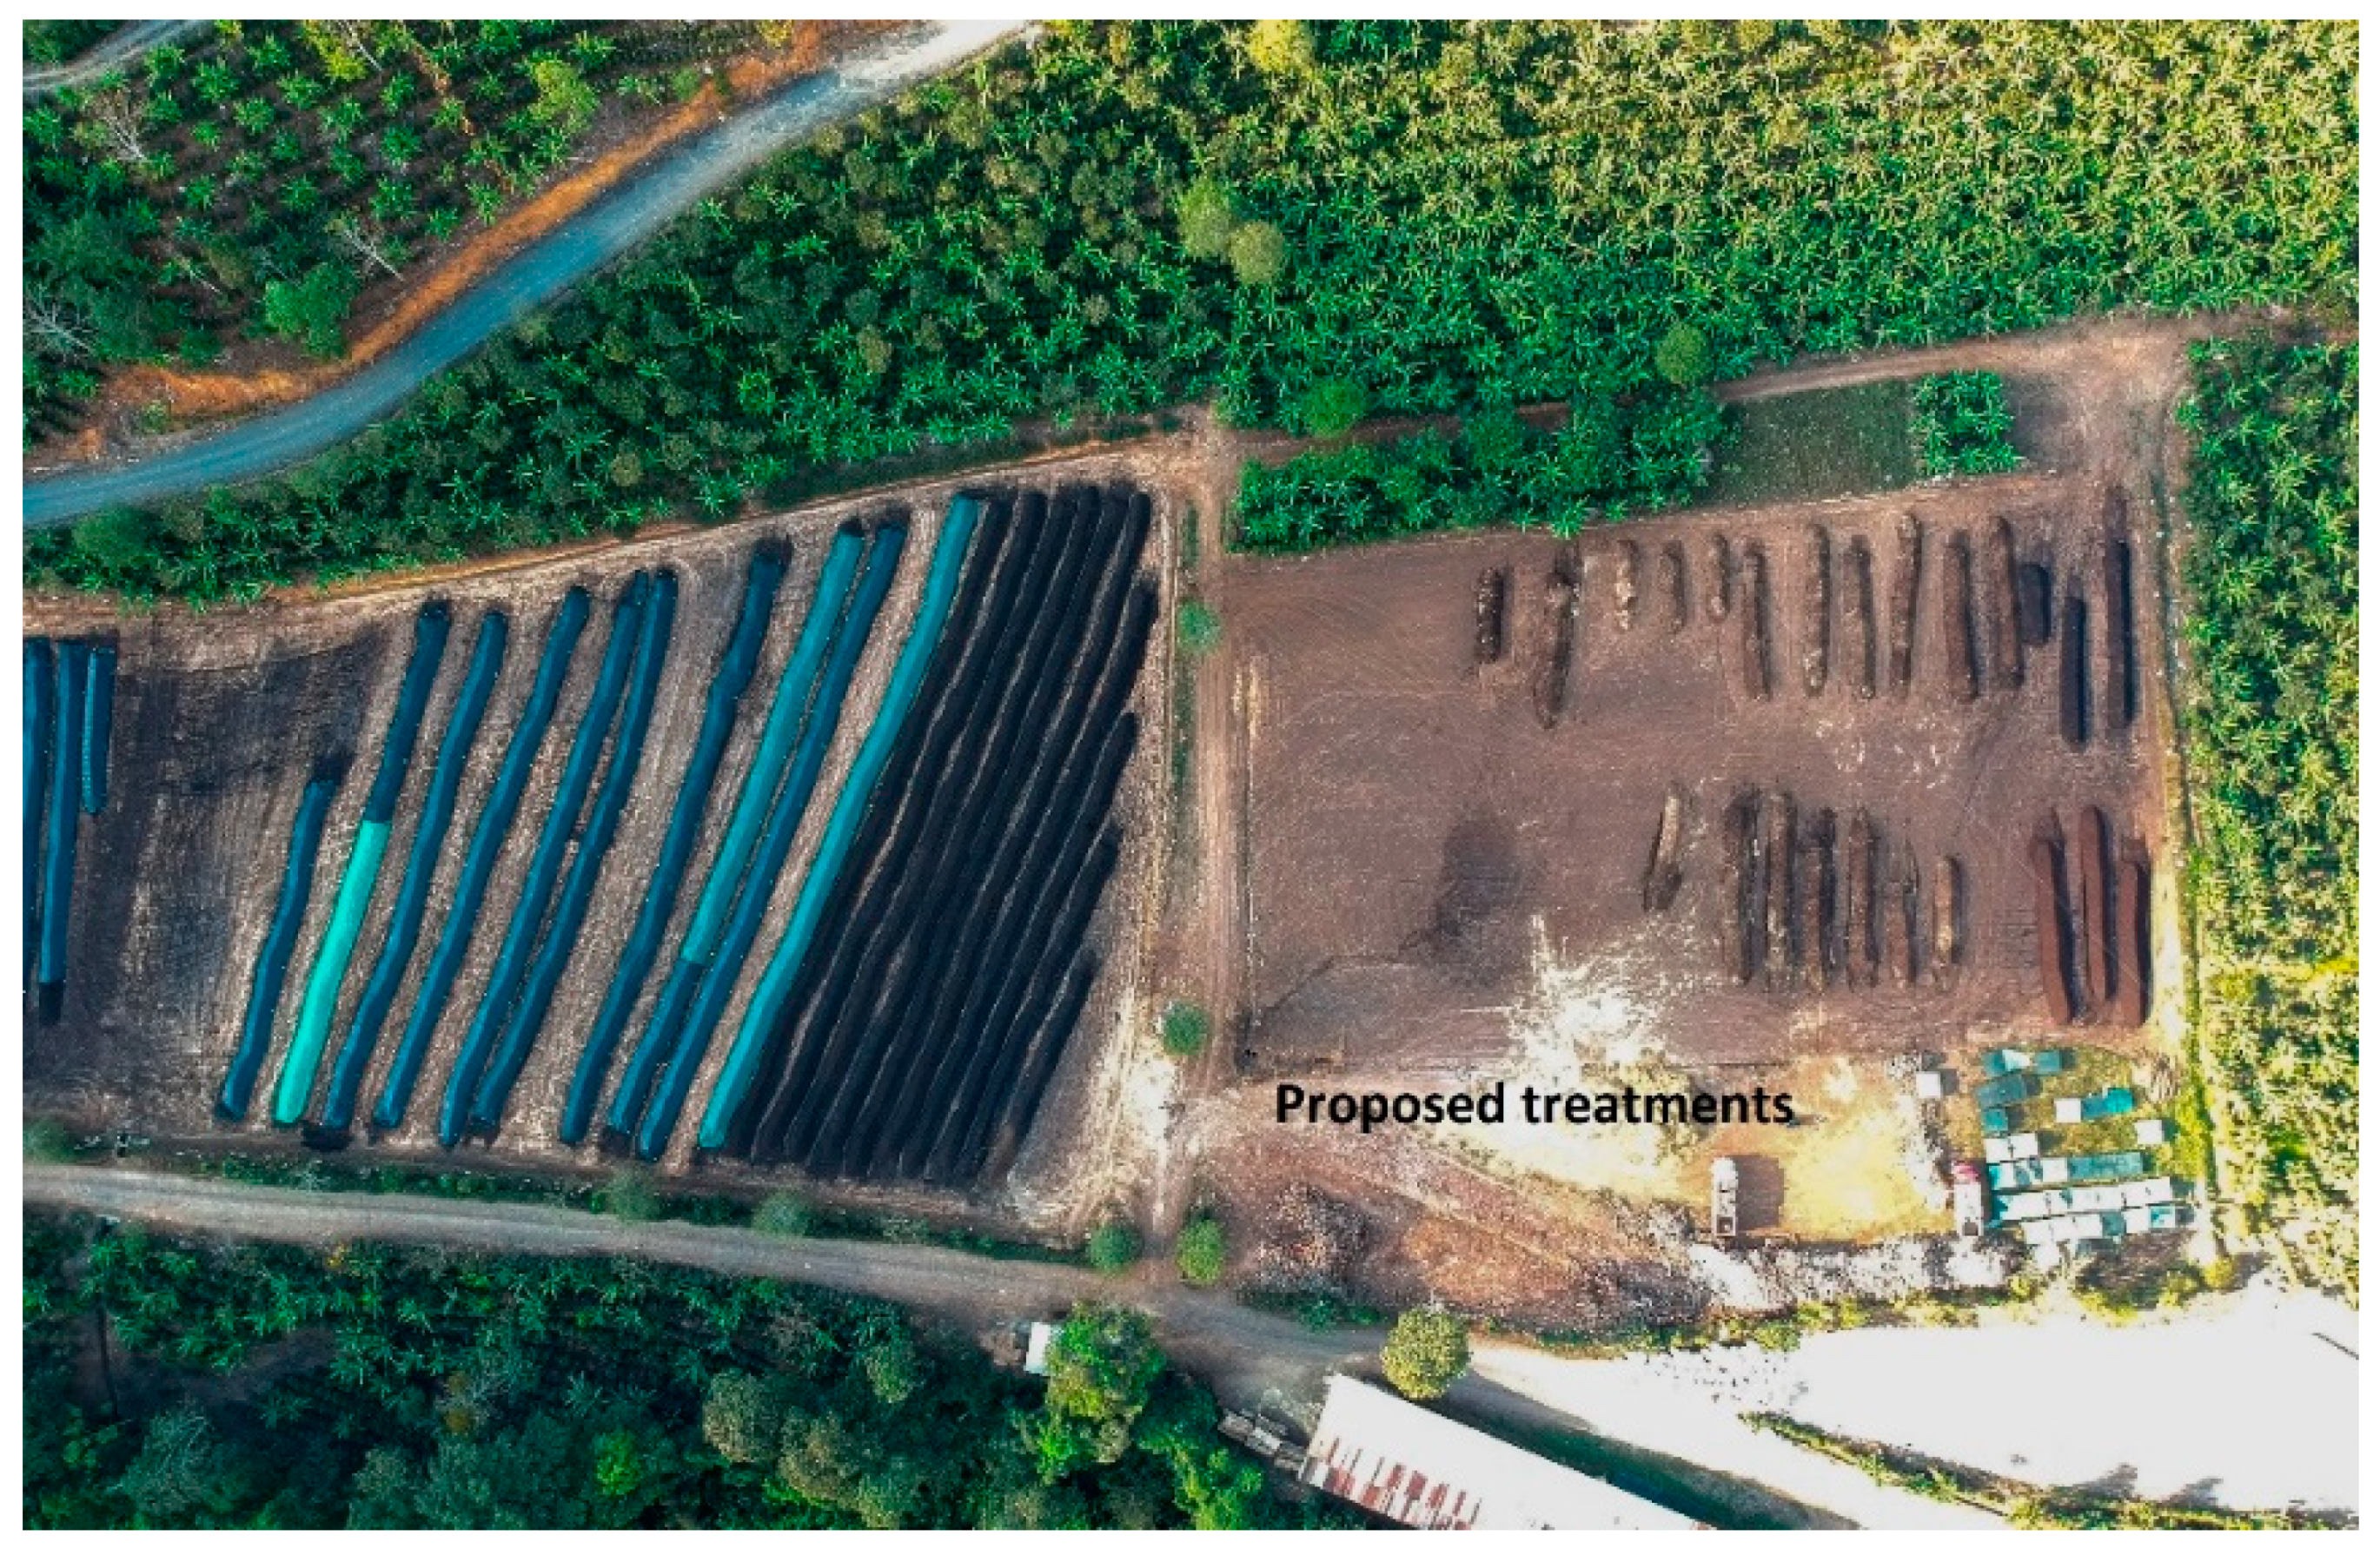
2.1. Compost Pile Construction and Mixing in the Study Area

The study was conducted in the biggest Costa Rican coffee mill in the country and located about 70 km south of the Capital San Jose, between 9°39′25.41′′ N and 84°01′32.08′′ W. The performance of the experiment was during the harvest and dry coffee season of 2019–2020 at an altitude of 1200–1900 m.a.s.l. [32]. The status quo of the current mill of study generates about 37,000 tons/ harvest of coffee by-products (1 harvest per year) and, 80–90% of CP is used for composting purposes. The so-called open field depositions are fields where CP is buried every harvest without composting treatment due to the lack of space for composting.
Currently, in the mill, the composting process is carried out just with CP as an input material; therefore, this current technique is taken as the control (TC). Open Windrow composting trials were formed using five different percentages of two types of feedstock: CP as a coffee by-product and green waste (GW) (Table 1). CP was collected directly from the mill after the industrial de-pulping process of the coffee cherries and transported into the composting area by trucks. The collection of GW was from the surroundings of the mill and shredded for the trials and windrow formations. GW was a mixture of wood sticks, Elephant grass (Pennisetum purpureum), African Stargrass (Cynodon plectostachyus), and pruning of trees from the surroundings, including coffee plants. The feedstock was in a triangular cross-section formed (approximately 1.2 m high, 2.6 m wide, and between 15–25 m long for all the treatments). The windrows were operated without forced aeration and turned weekly using a mechanical turner (Backhus® windrow turner) for the entire process. Previous studies [10,33] have shown that the optimal turning frequency for CP during the composting process was once per week to avoid anaerobic conditions inside the windrow and methane emissions. Therefore, these considerations were also taken into account for this study.
The primary input material was CP as a coffee by-product (>50% of input). A total of 318 Mg of CP and 74 Mg of GW was used to form 23 windrows for ten weeks (Figure 1). The treatments (percentage based on volume) were decided according to the feasibility of the mill in collecting the input materials of GW. Since the interest of the mill is the implementation of the proposed treatments, this information was considered for the windrow formation. Table 1 shows that the total of windrows was different for each treatment. The study was performed during the summer season in an open space in the mill. Hence, water loss and depletion to avoid a decrease in the activity of the micro-organisms were important factors to consider. Irrigation starting from week three until week six before each turning was needed to maintain the proper moisture content in the process for T1 to T5. The irrigation was based on the WC monitored weekly and temperature profiles for all the treatments.

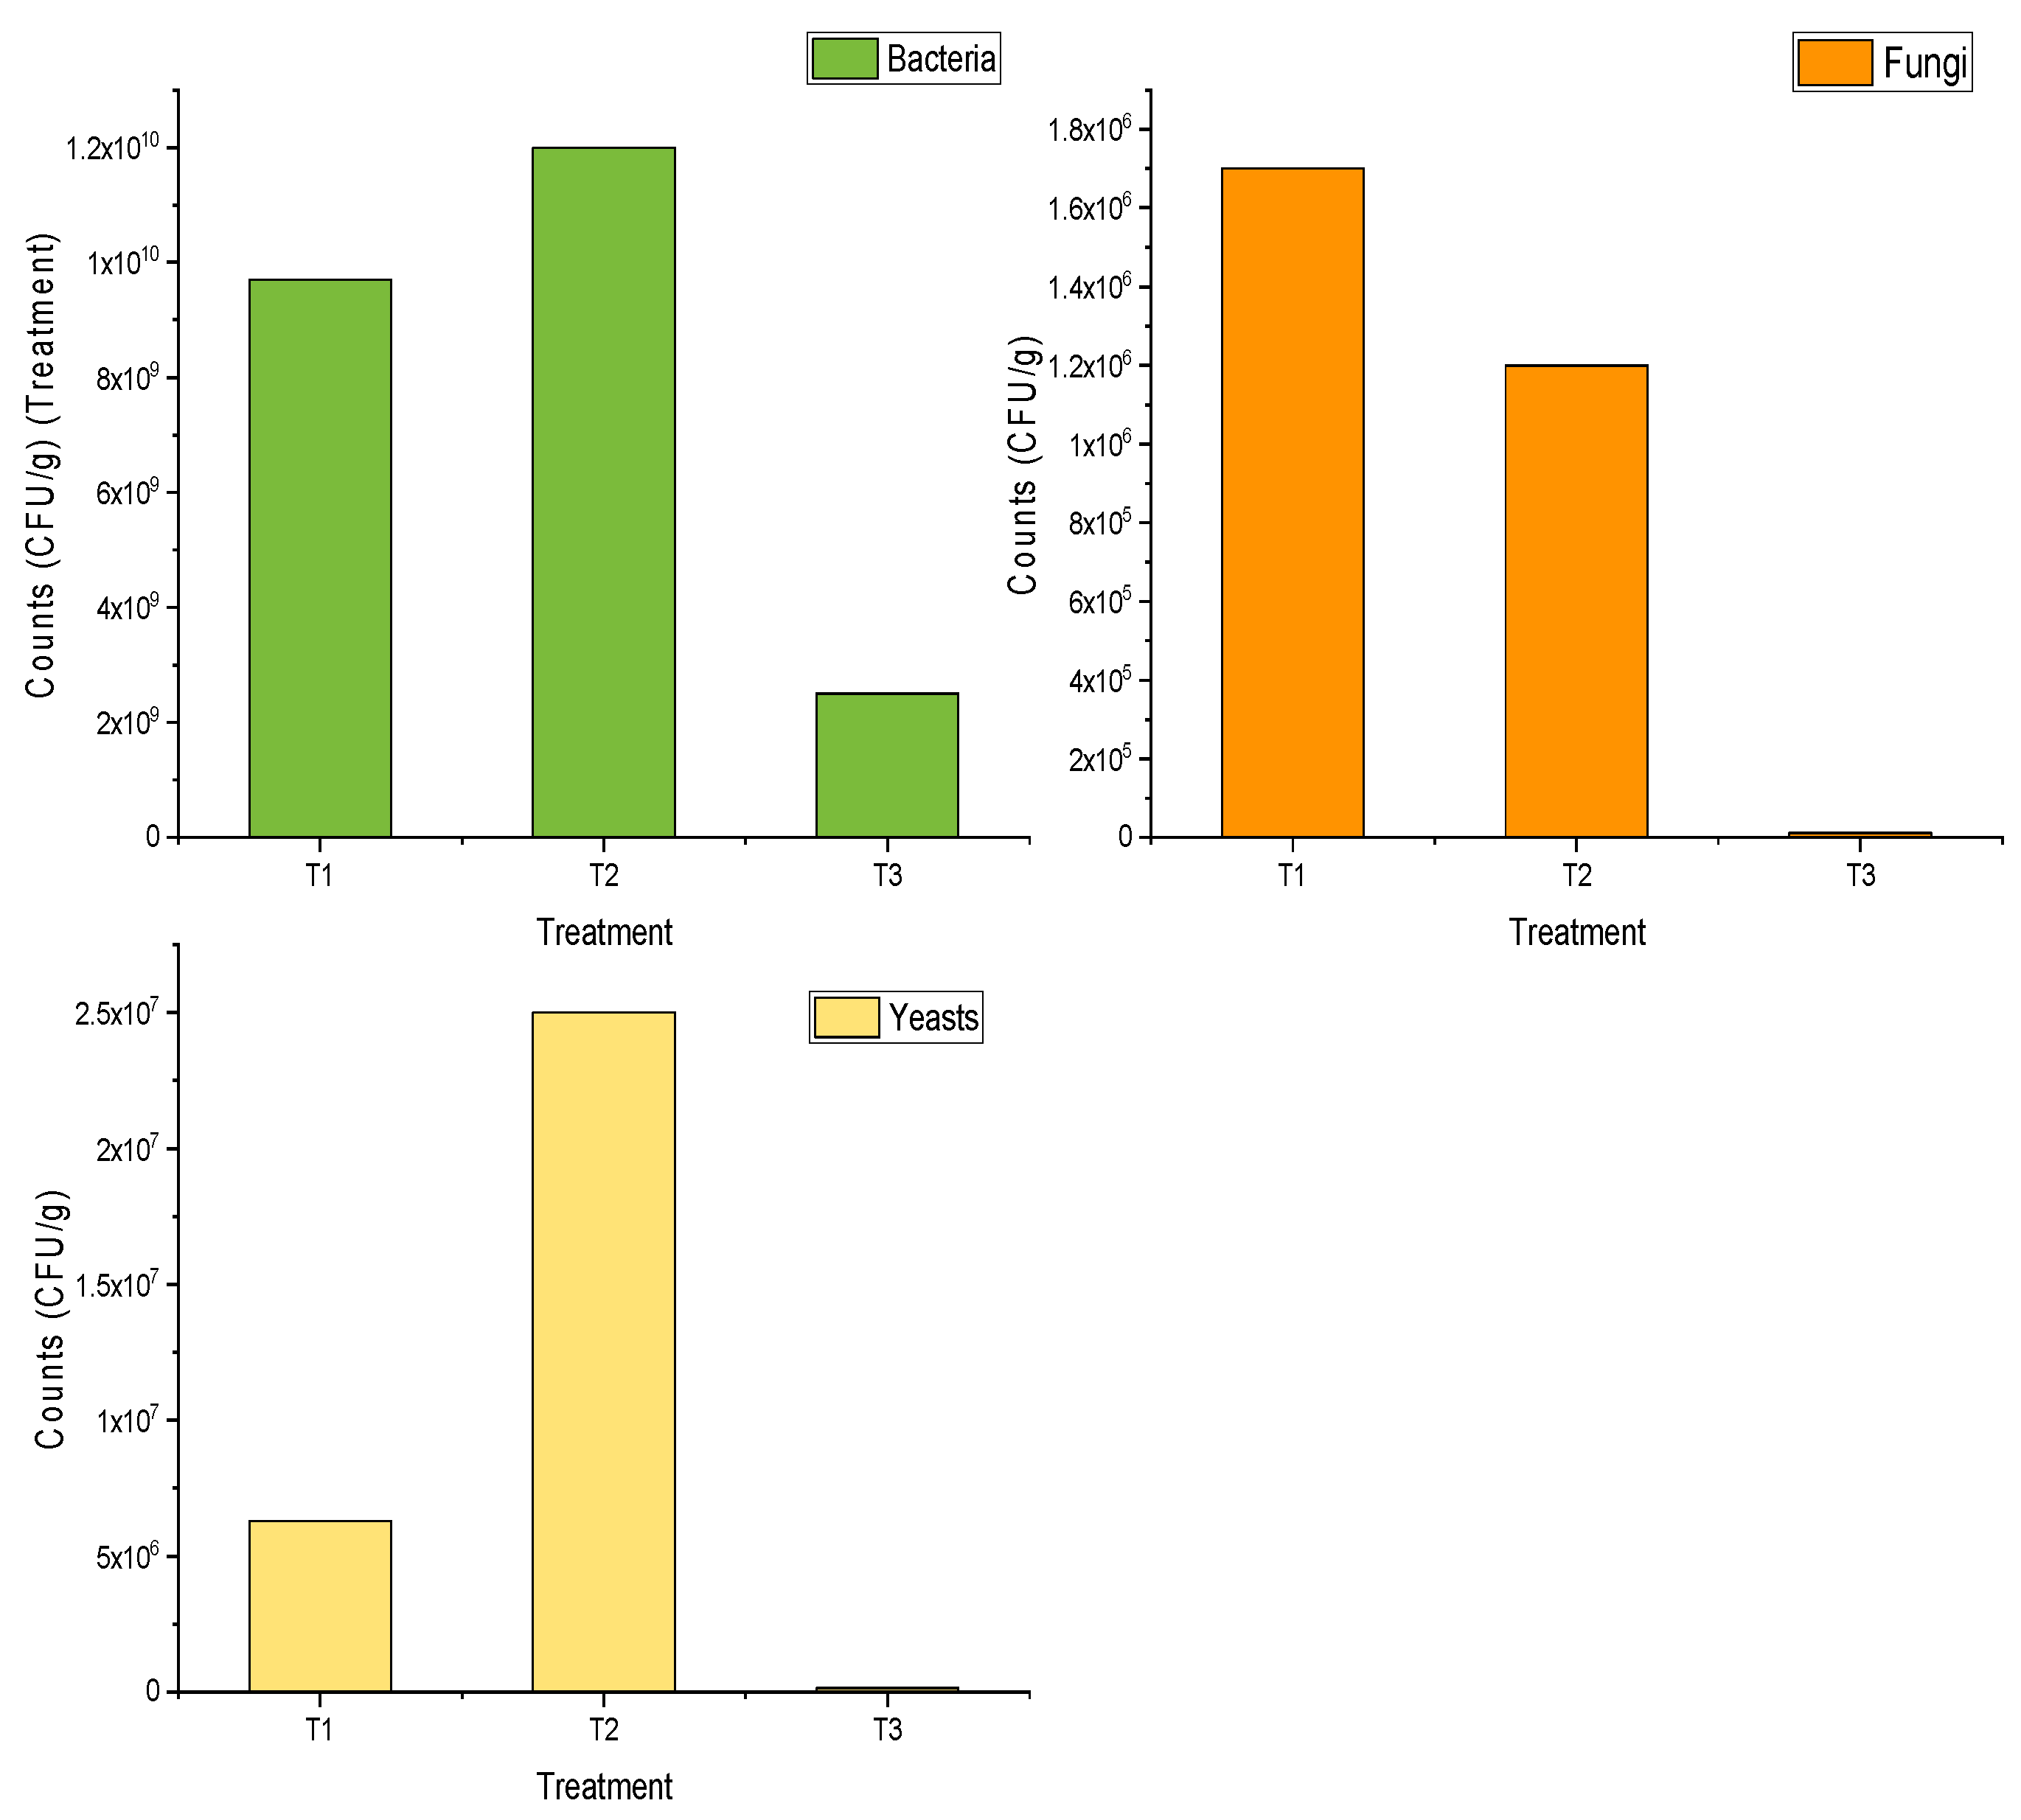
2.2. Compost Sample Analysis

Fresh Compost samples were used to quantify the gravimetric moisture content (MC), pH, bulk density (Ƿt), volatile solids (VS), and carbon to nitrogen (C/N) ratio during the process shown in Table 2. These results were analyzed in an accredited laboratory in Costa Rica for compliance with INTE ISO/IEC 17025 standards. The analysis was performed to obtain the properties of the raw materials and microbial population counts by a serial dilution technique. The procedure was made for pH and EC in water 10:25; Acidity, P, and K with Olsen Modified pH 8.5 (NaHCO3 0.5 N, EDTA 0.01M, Superfloc 127) 1:10. Acidity is determined by titration with NaOH; P by Colorimetry with Flow Injection Analyzer (FIA), and the rest of the elements by Atomic Absorption Spectrophotometry (AAS). Total %C and %N were determined with the C/N auto analyzer by dry combustion.
Once the windrow piles were formed, the MC, pH, and C/N ratio were measured weekly, and the temperature was taken manually daily by triplicate in all the windrows. The weekly samples were collected from five different locations and depths along the windrow. Thereafter, a representative sampling over the entire windrows to analyze MC and pH was obtained. All the sample analyses followed the German Quality Assurance Organization standards for Compost (BKG) [36]. Water content was calculated from field moist and oven-dry (105 °C for 48–72 h) mass of compost according to the DIN EN 1304. The pH was extracted from 20 g (wet weight) of compost with 180 mL of CaCl2 and assessed by potentiometric measurements. VS were performed and calculated according to the Federal Compost Quality Assurance Organization (FCQAO) and the DIN 18128. C/N ratios were analyzed using a Vario Max CN element analyzer elementar Analysensysteme GmbH® following the DIN ISO 10694. Three replicates of 10 g were inserted into a porcelain crucible into a muffle furnace at 550 °C. The samples were burned until constant weight according to the DIN 18128 and determined as sample weight loss.
After ten weeks, once the compost was finished, samples of each treatment were shipped to Germany to analyze each nutrient content and chemical parameters. A certified laboratory (PLANCO-TEC, Neu-Eichenberg) performed the mature compost analysis in Germany, following the BKG standards. The following methods were used for each parameter enlisted in Table 3: total nitrogen, MB BGK: 2013-05; total phosphate, potassium and magnesium DIN EN ISO 1 1885: 2009-09; soluble nitrate, ammonia, phosphate and potassium, VDLUFA I A 6.2.4.1: 2012; organic substances, DIN EN 13039: 2000-02; alkaline active ingredients MB BGK, 2006-09, soluble magnesium VDLUFA I A 6.2.4.1: 1997; Rotting degree, Methodenbuch (MB) BGK; Salinity, DIN EN 13038; Bulk Density, Plant tolerance (25% and 50% Substrate), MB BGK, 2006 and C/N ratio, QMP_BIK_C3808: 2018-09.

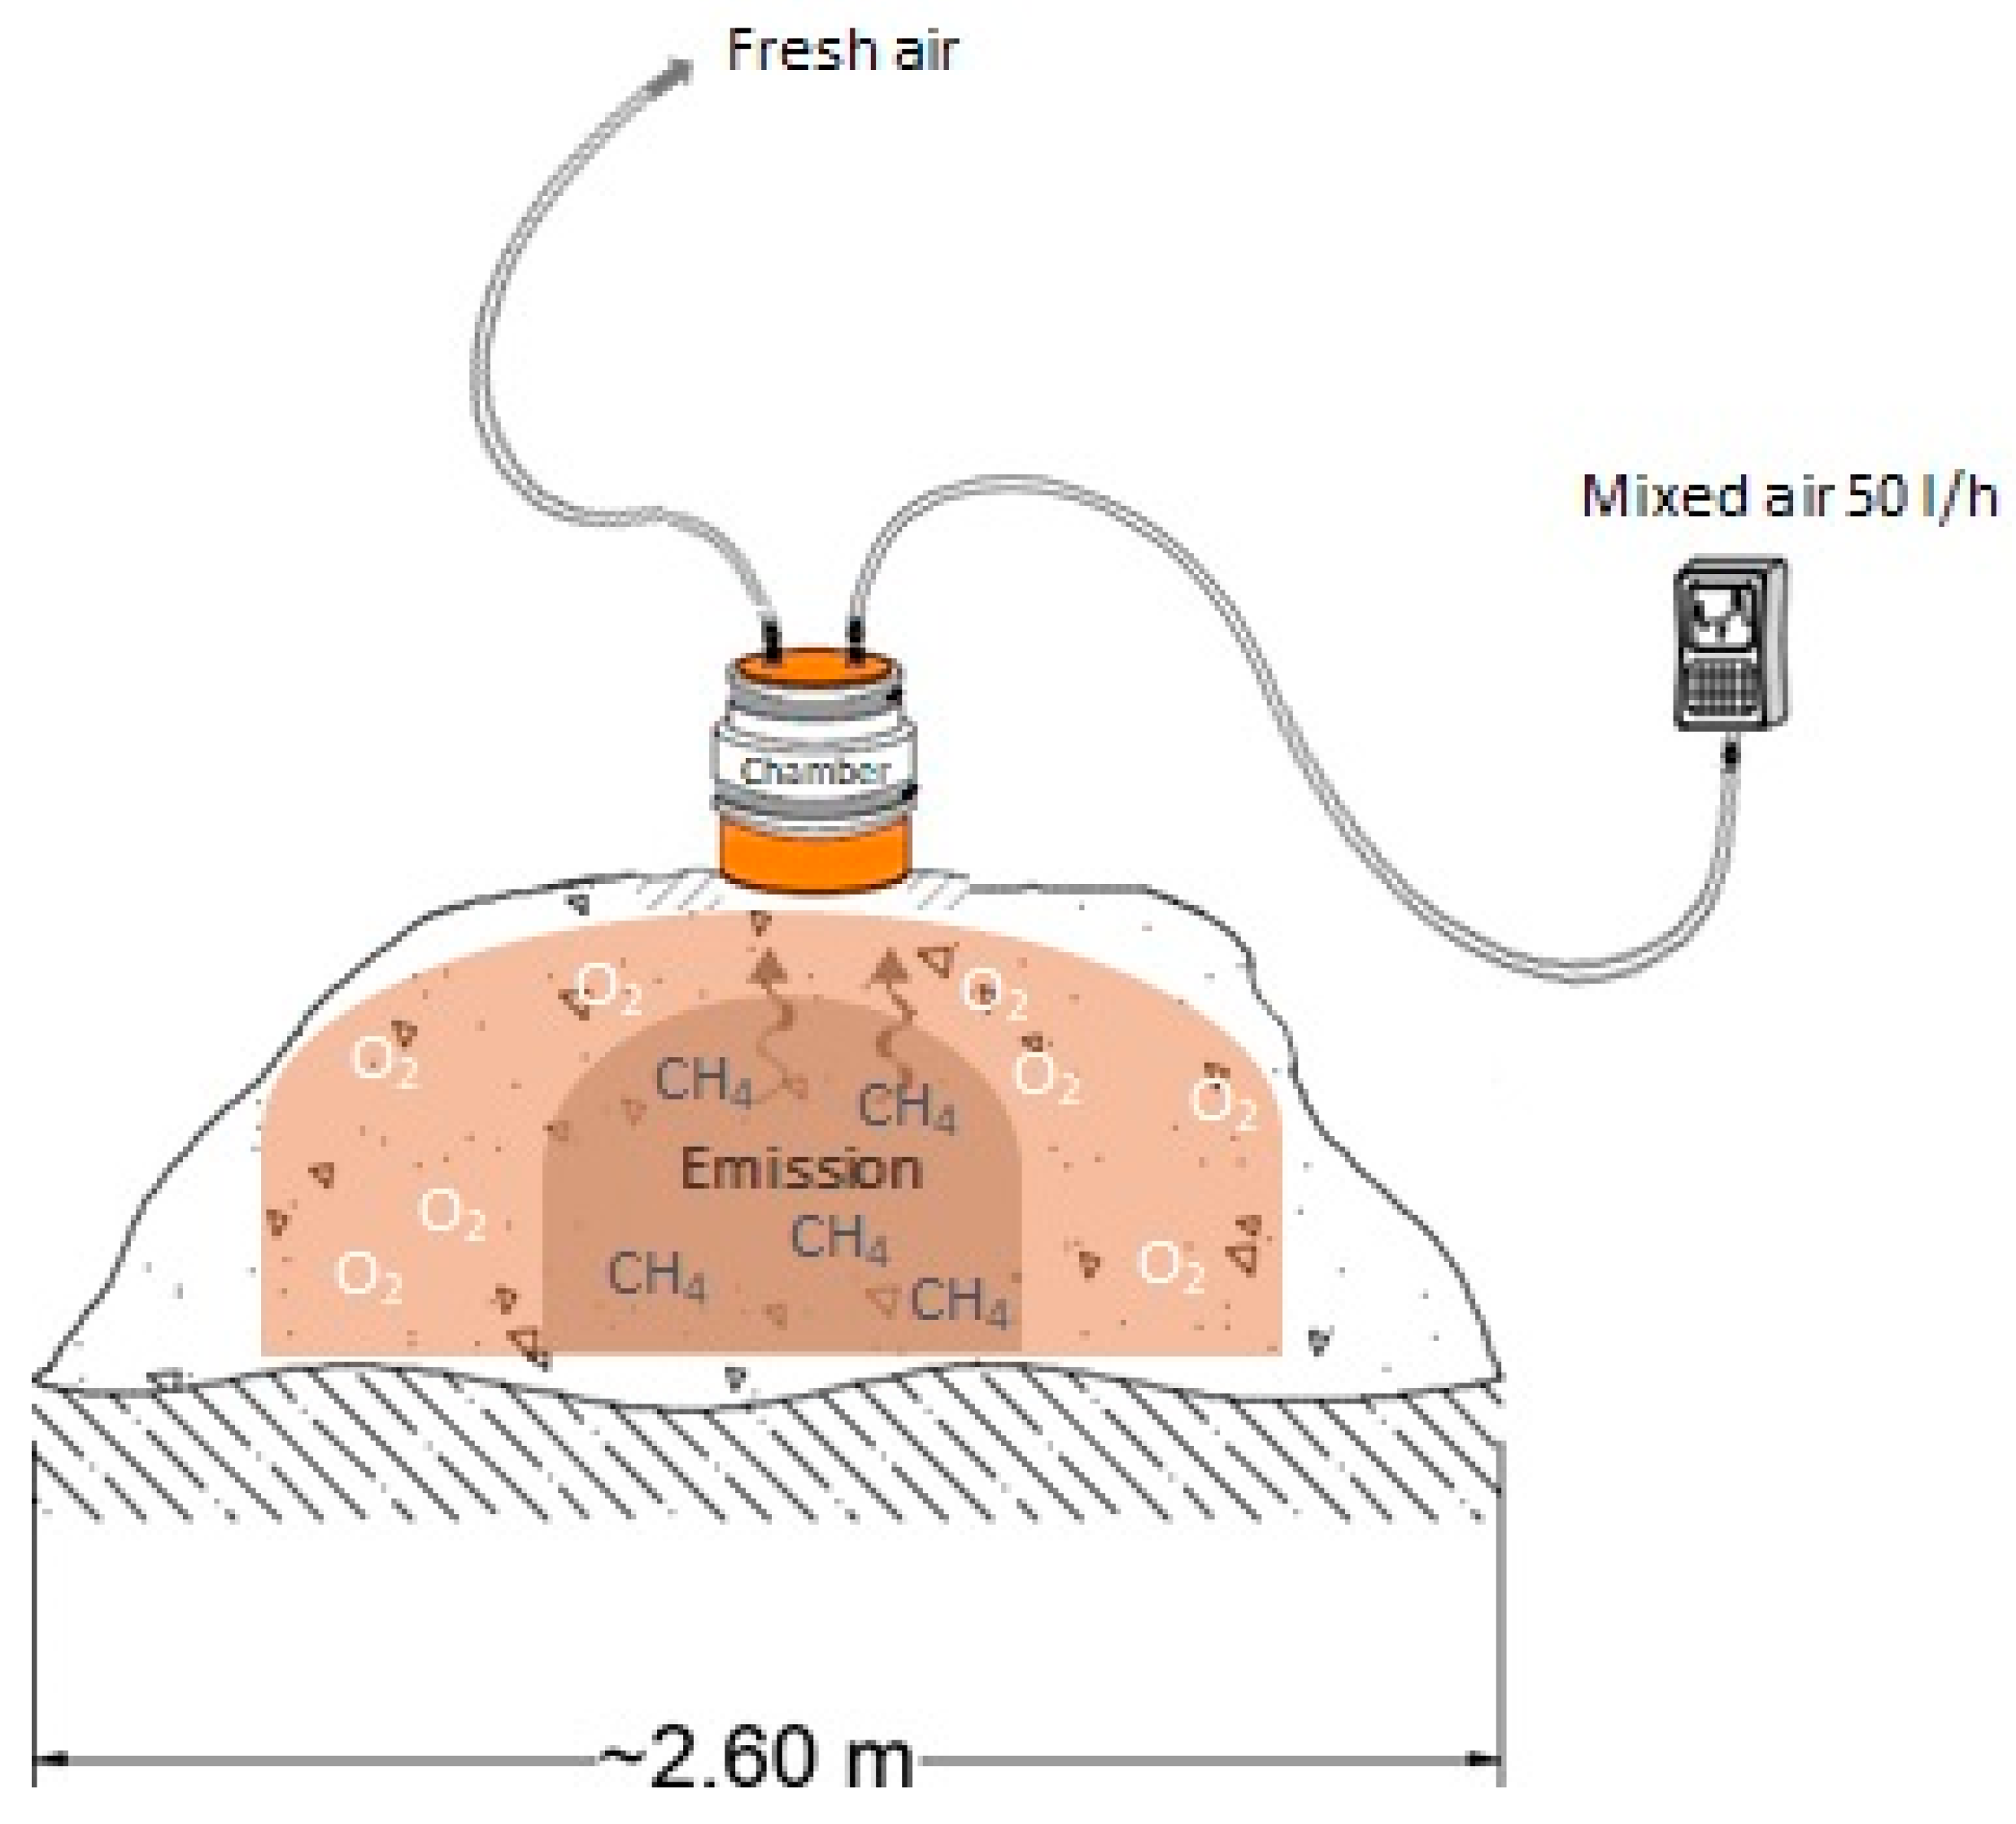
2.3. Methane Gas Sampling System

The measurements were carried out in open windrows and open field depositions. First, the focus was on whether the different windrow mixtures with coffee by-products could be comparable or compatible. Second, the differences in terms of gaseous emissions and when the volume mixture is distinct. Third, the results were compared with the mill (TC) current treatment where the composting occurs using CP as a raw material. Moreover, the determination of methane concentration was measured in the windrows and the field depositions. In this last one, the main focus occurred on determining the emissions over time (years), with the purpose to estimate how long the coffee by-products emit methane gaseous emissions when the CP is not treated.
Field deposition and TC are common practices in the country; therefore, it is a quantification essential to consider. A flux chamber was placed on top of the windrow piles and inserted approximately 5–10 cm deep into the windrow. This was made to seal the chamber against atmospheric influences to quantify the emissions. The upper part of the flux chamber is designed with two ports (Figure 2), one inlet connected to a hose, allowing the ambient air to enter and be mixed inside the chamber, producing a constant airflow. The second port is an outlet to connect the gas analyzer in the chamber to collect the inner gas. Then, with a gas detector device, the methane concentrations are determined.
Before the gas detection, an estimation of time for the measurements was made. The estimation was considered until the emissions remained permanently constant; therefore, no variation during the measurements could occur. The measurements were conducted weekly for 15 min by quadruplicate before turning the piles in two different windrows per treatment. The methane emissions sampling took place during the first six weeks of the composting process. Measurements were halted during summer without rain events. According to the manufacturer, the sensitivity of the gas detector device was from 0 ± 1 to 60 ± 3, represented in volume percent [37]. The calculation of the methane concentrations is crucial to determine the emission rates and the emission factors.

2.4. Emission Rates and Emission Factors

The flow quantifies emission rates through the flux chamber related to the treatment and quality of composting. After identifying a spot, the area is encapsulated to form an aerated chamber. A defined amount of air is extracted, covering the entire area required for sampling to function the constant flow of emissions and supply of ambient air. The flux chamber allows the flux gas to diffuse, which can measure the methane concentration over time and estimate the flux gas emission [38,39] The result is the volumetric flow rate extracted per unit of time [40]. Several factors were considered for the emissions rate calculation: the sampling chamber and chamber area, the volume, and flow volume. Methane emissions rates were calculated in g × m−2 × h−1 with following the equation [10,33,41,42]:
q C H 4 = C C H 4     V g a s A
qCH4—the emission rate of methane (g × m−2 × h−1); CCH4—methane concentration in (mg × m³); A—flux chamber area in (m²); Vgas—gas flow volume, (L × h−1).
The emission factor from a given source can be calculated as the mass ratio of gas emitted to initial fresh matter mass (kg × Mg–1). However, sometimes the feedstock is reported in units of dry mass. Emission factors related to the mass of CP treated in each treatment and calculated as:
E F C H 4 =   q C H 4   ×   t t r e a t   ×   A t r e a t     m t r e a t
EFCH4—the emission factor of methane related to the mass of CP treated (g × kg−1); qCH4—the emission rate of methane (g × m−2 × h−1); ttreat—duration (time) of treatment (h); Atreat—area of treatment (surface area of the emission) (m²); mtreat—the mass of treated material (mass of CP at the pile) (kg).

2.5. Statistical Analysis

A one-way analysis of variance (ANOVA) test was carried out to investigate the correlations between emissions rates and the period in weeks of composting in the windrows. A significance level of p ≤ 8.9 × 10⁻⁸ for the composting treatments was used for all mean values. In addition, the Tukey HSD test (α = 0.05) was used to assess significant differences between treatment means at a 5% probability level.

3. Results and Discussions

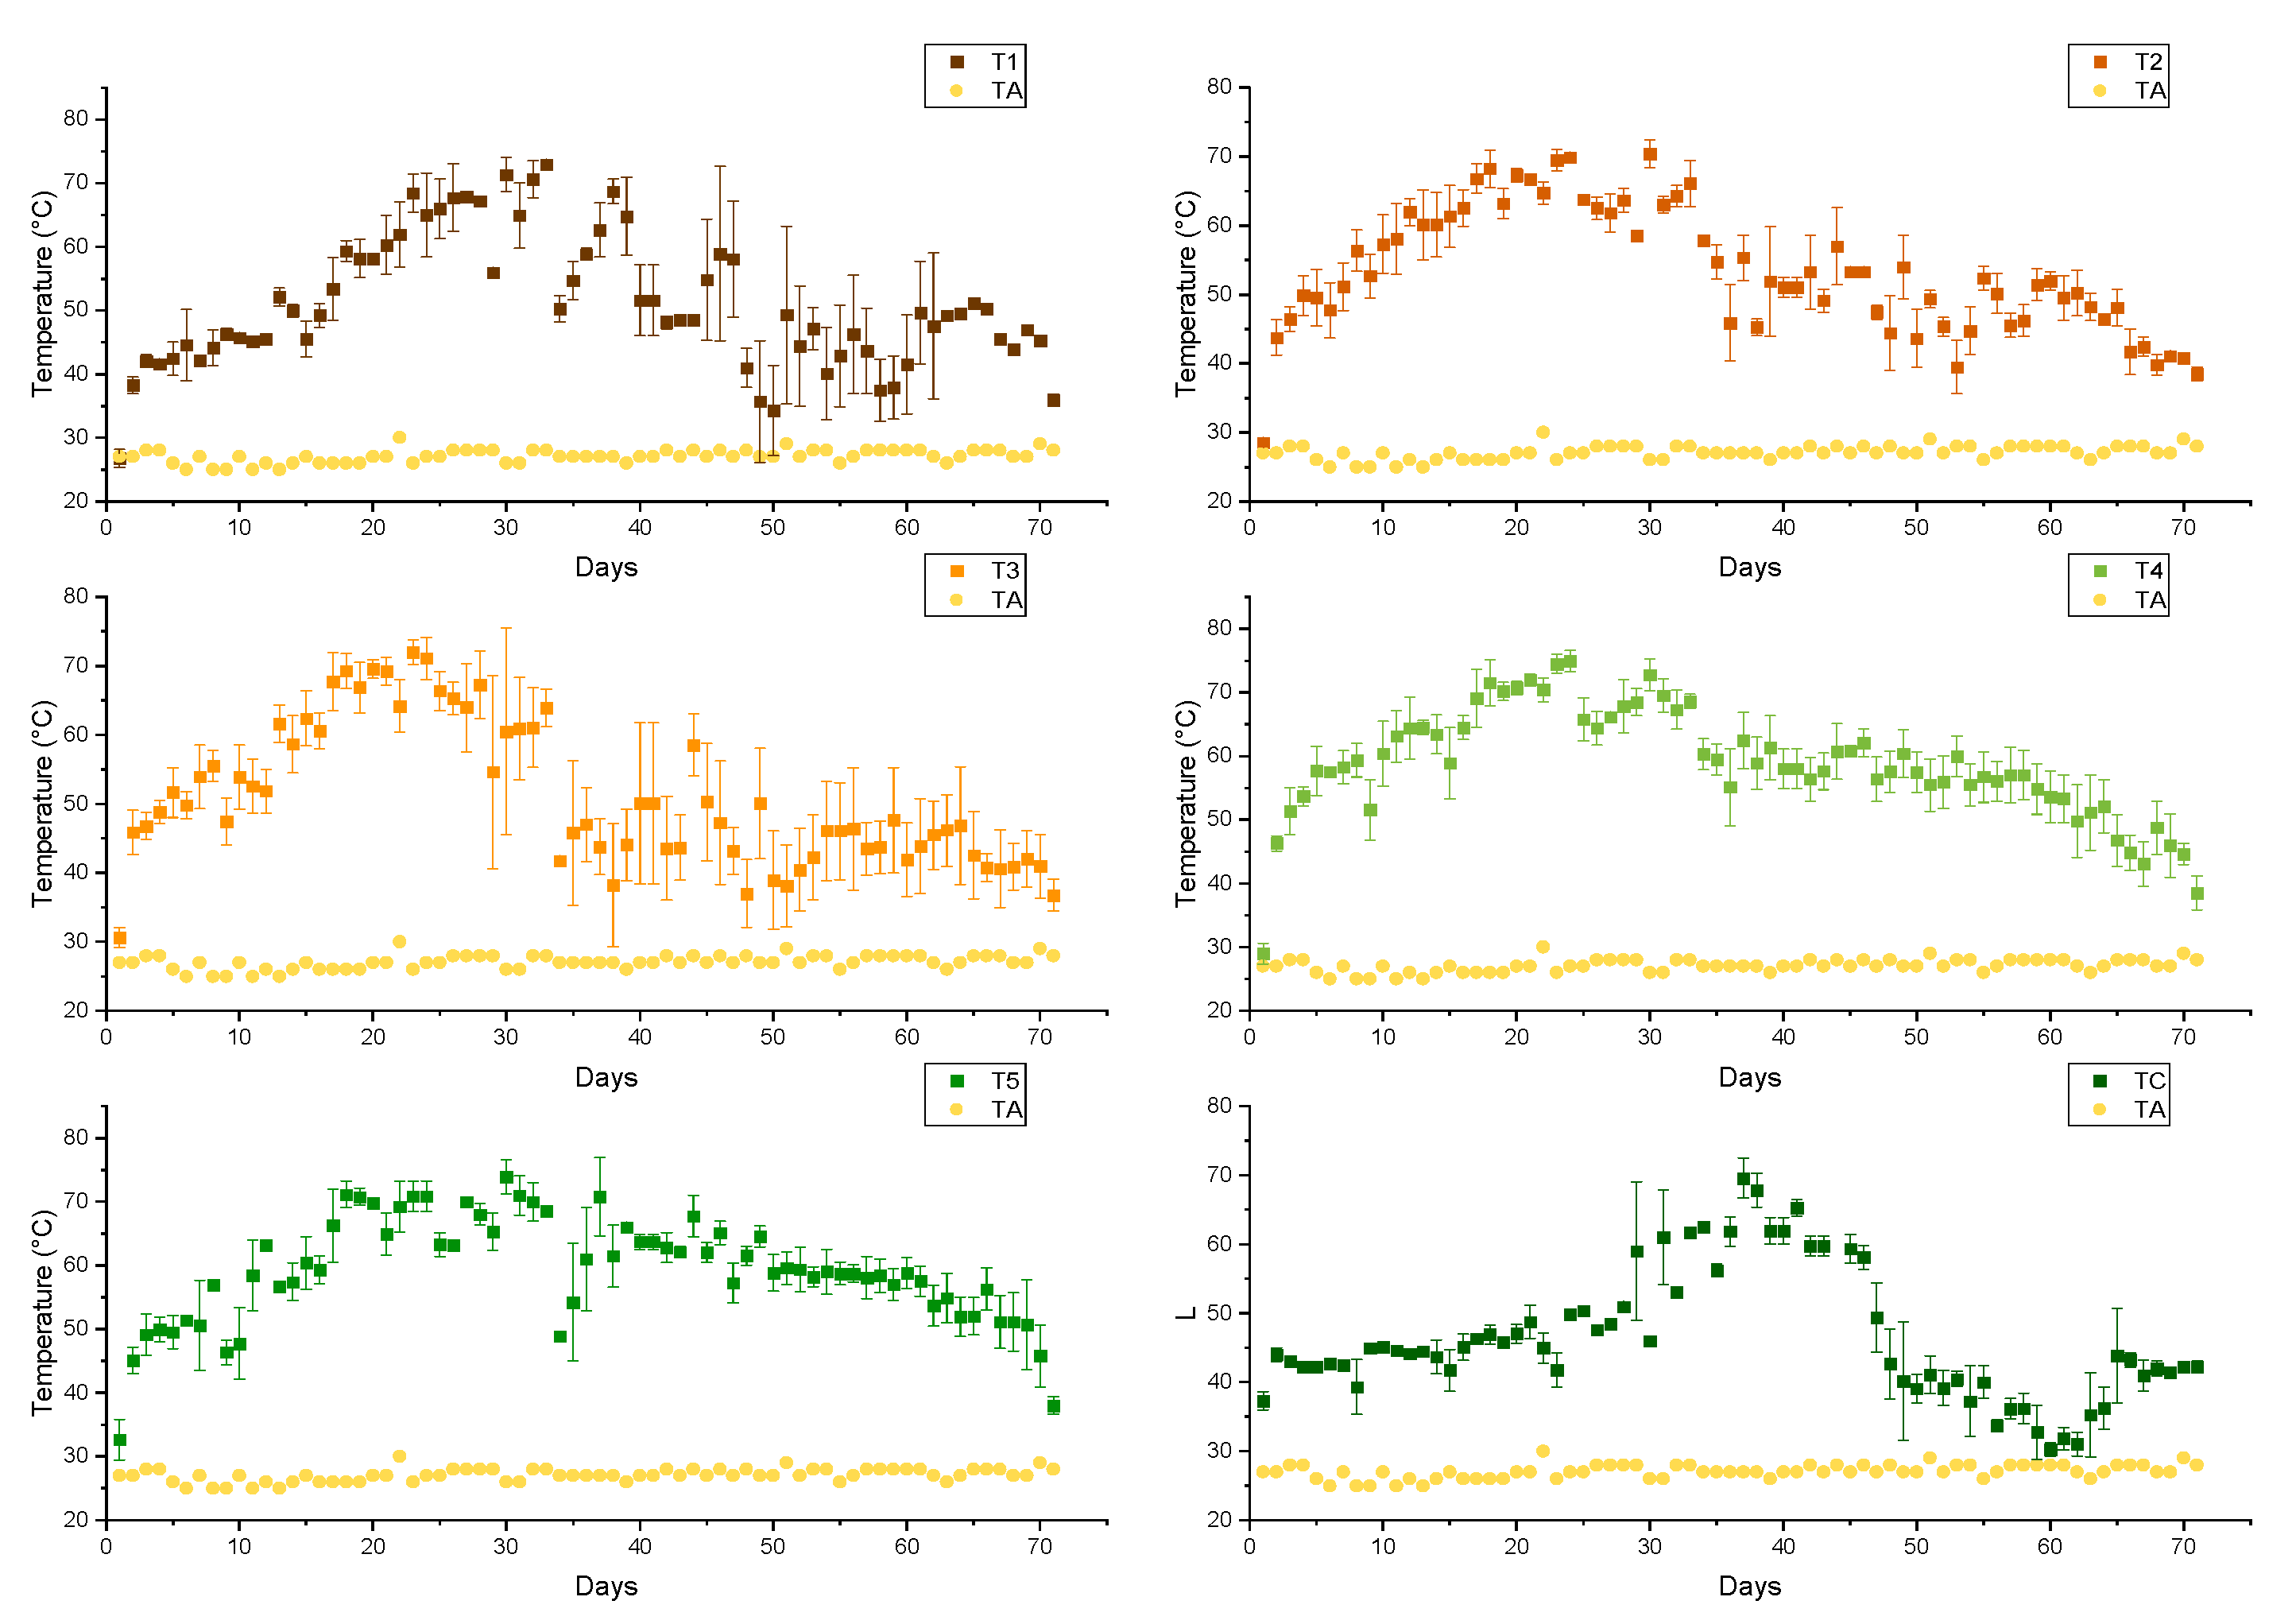
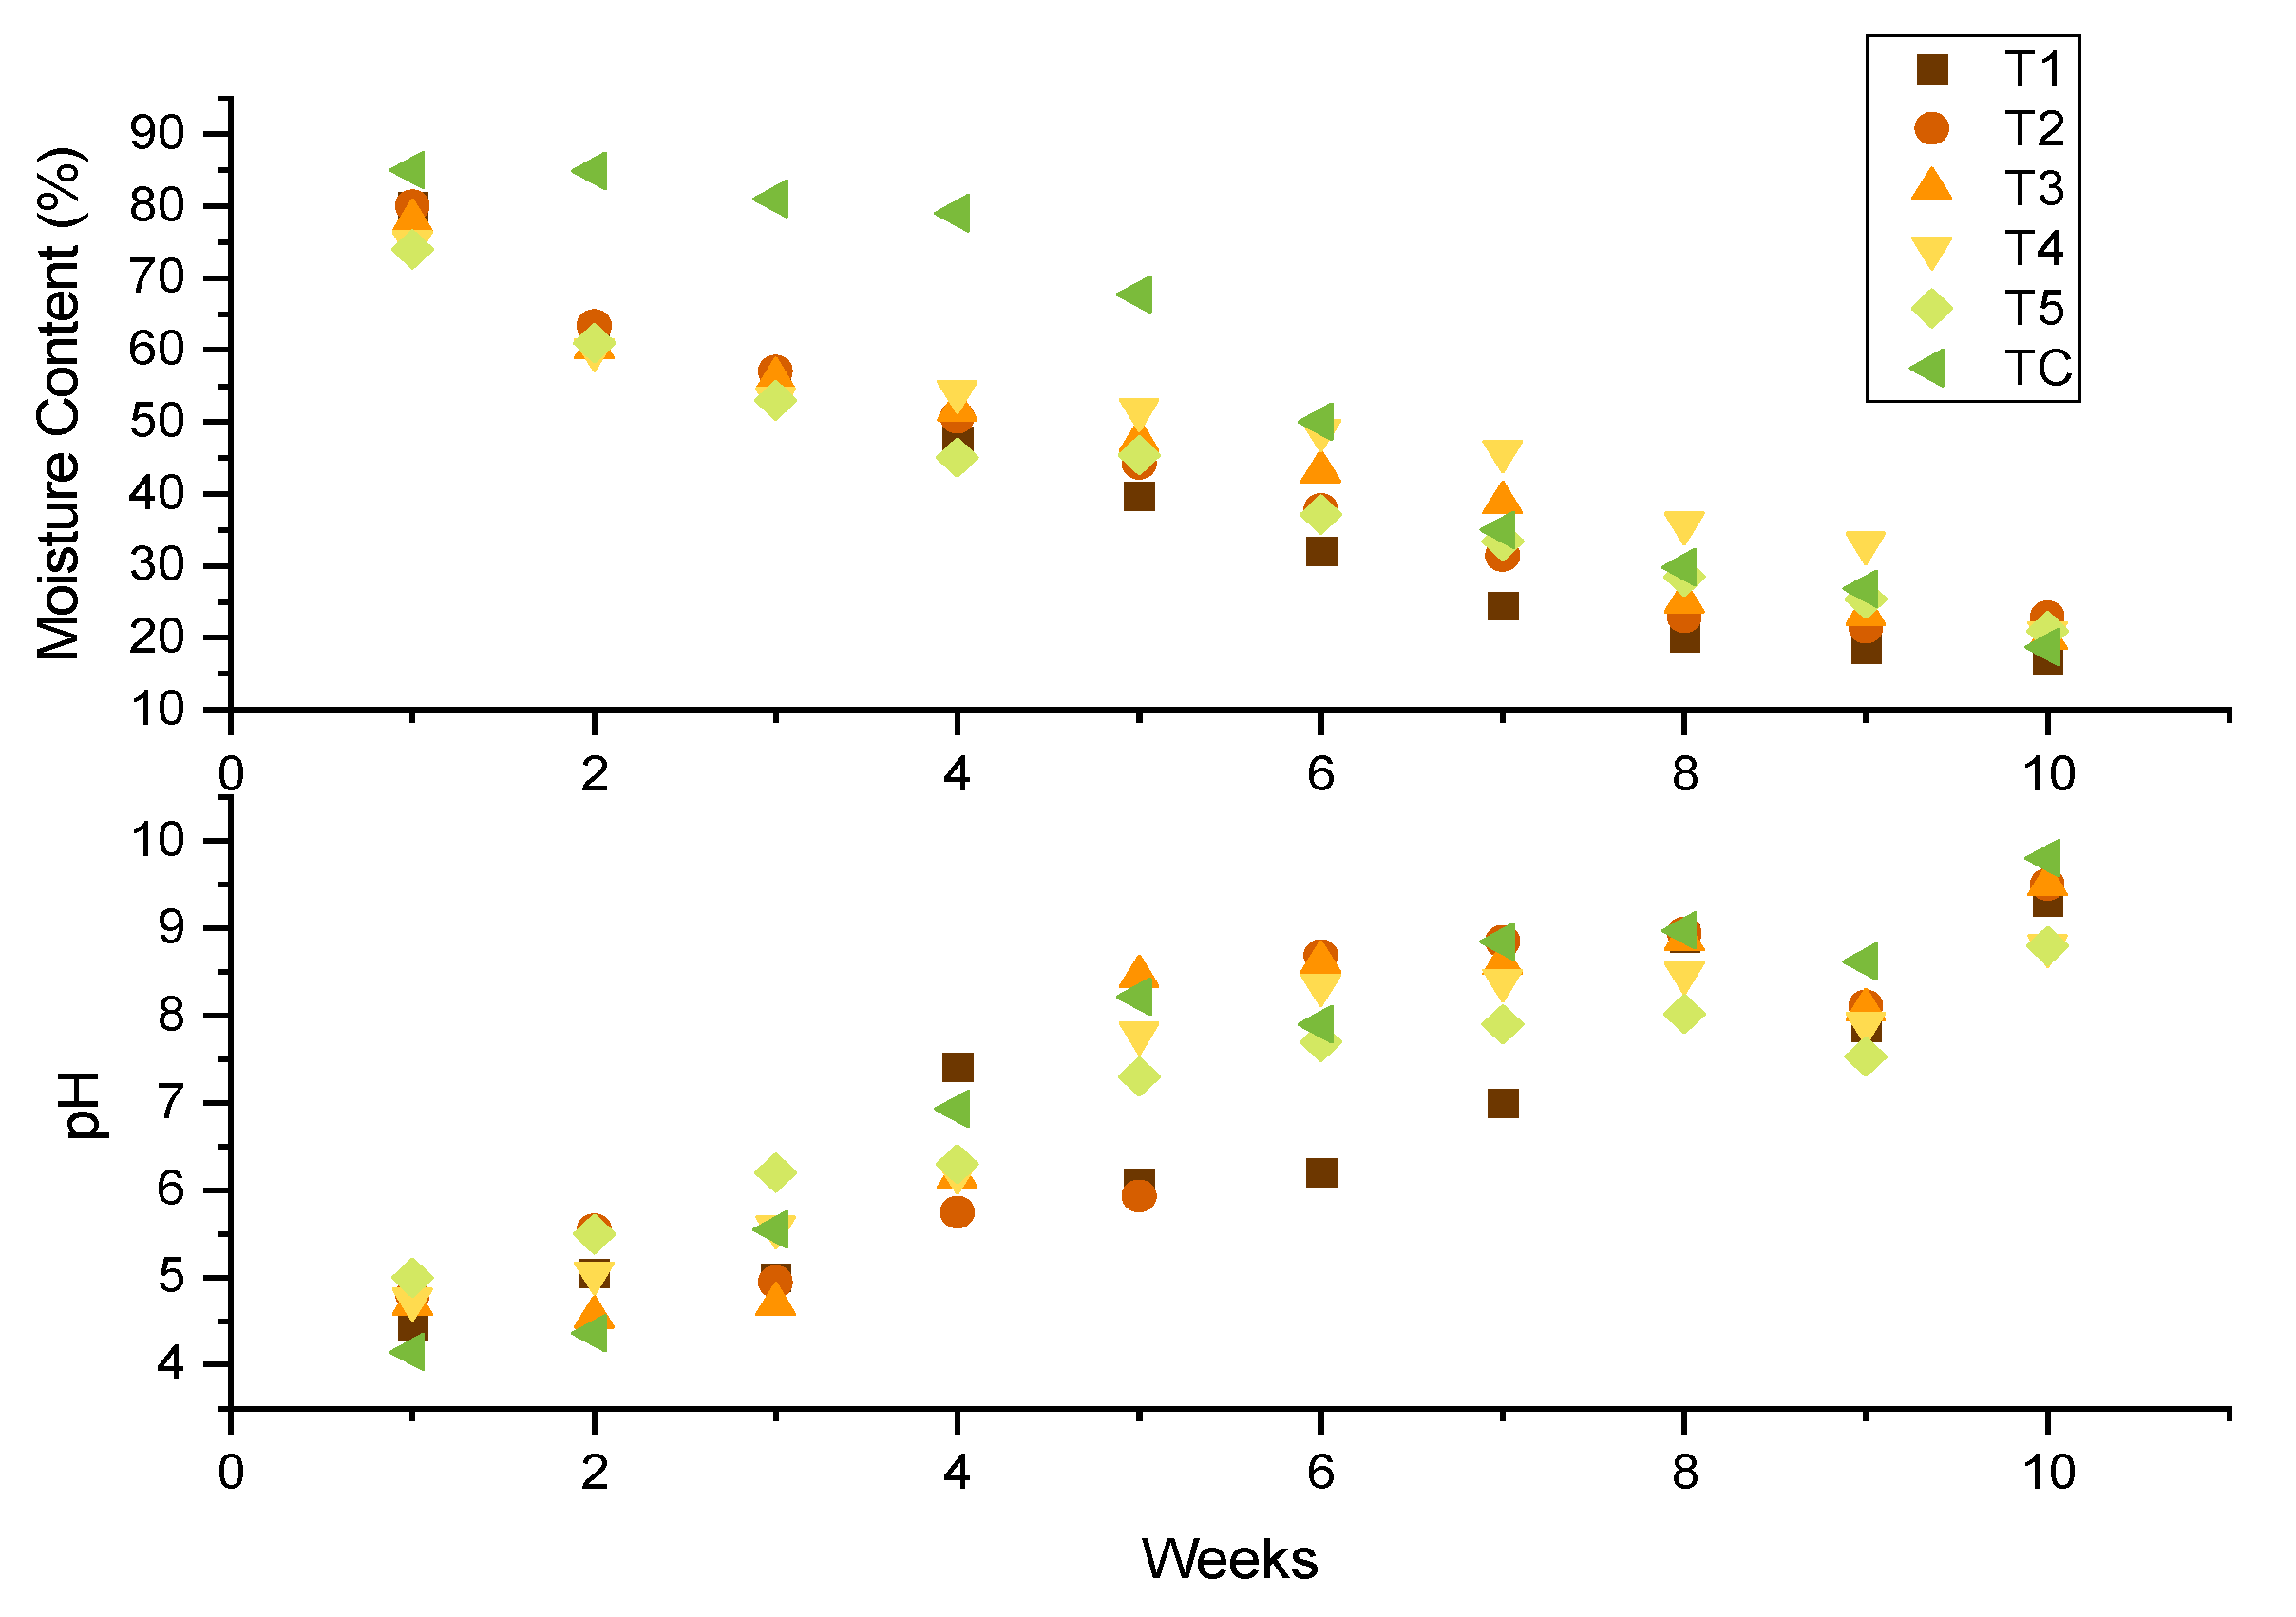
3.1. Environmental Conditions: Temperature, Moisture, and pH

At first, all the material is nearly identical, but heat is generated by increasing the temperature as the micro-organisms grow [43]. One of the indicators of microbial activity is the increase in temperature inside the windrow, where the temperature has traditionally been considered a fundamental variable in the control of composting [44]. Figure 3 shows the temperature profiles for all the windrows. TA refers to the ambient temperature. Additionally, during those 70 days of the composting process, the windrows experienced no rain events. Figure 3 shows a typical development for composting processes containing self-heating, cooling, and stabilization phases. The turning of the material caused low peaks, reflected in the graphs. Sanitation or hygiene is crucial to destroy pathogenic micro-organisms, seeds, and plant components for future sprouting [30,45]. The sanitation process in a windrow should experience at least 14 days of high temperatures (above 55 °C) to enhance the sanitation process [24,46]. The sanitation process was achieved in the temperatures profile for all the treatments maintaining the high temperature at least for the recommended period. The addition of green waste produced different behavior regarding temperature profiles and thermophilic stages within the windrows.
Comparing the temperature increased in the treatments, T1 accelerated the temperature profile by 38%, T2, T3, and T5 by 72%, and T4 is the most notorious by 83% compared with TC. During the maturation phase, the temperature in the windrows began to decrease until it reached temperatures of 35 °C among the windrows. TC experienced the increase in temperature and the thermophilic stage after 29 days, T1 after 18 days, T2, T3, and T5 after eight days, and T4 after five days of the composting process. The addition of green waste into the windrow has accelerated the degradation, microbial activity, and temperature profile within the windrows. T1 experienced the most extended period for reaching the thermophilic stage, attributed to the CP percentage in the piles (80% P). The observed variation in periods of high temperature could be attributed to the variation in the percentages of GW in each treatment [47]. For example, the behavior of T1 is the closest to the profile of the control TC. This is attributed toT1 containing the highest amount of CP in the composting treatment.
During aerobic windrow systems, moisture and aeration are important parameters to consider to enhance the biological activity inside the windrow [48]. It is recommended during the composting process to maintain a moisture content between 50–60% for favorable results [23] and the avoidance that water fully occupies the pores of the composting mass [44]. This parameter is essential for CH4 emissions control during composting and affects degradation and end-product features [5]. Furthermore, evaporation is linked to the lack of porosity and aeration in the system and the relationship between air to water ratio [30,49].
Microbial activity, including bacteria, fungi, and yeast, depends on temperature and moisture content [27]. The aim of this study was not the microbial counts weekly during the composting process. Instead, a general overview of the microbial activity was considered important to control the microbes in at least two treatments to ensure that the activity is higher than the control TC with the proposed technique. Quantitative analysis was based on colony counts and subsequent calculation of colony-forming units per gram (CFU/g) to estimate the viable number of bacteria, fungal cells in the samples during the third week of composting process for TC, T1, and T3 (Figure 4).
Results show that the microbial activity is higher for T1 and T5 than for TC. During the third week of composting, T1 and T2 reached thermophilic temperatures, and the amount of yeast from Figure 4 compared to TC can be linked to this event. Some studies show that higher temperatures for T1 and T5 induced an earlier microbial activity [50]. For this case, Figure 4 shows that temperature during the third week was below 50 °C, whereas T1 and T5 had temperatures above 50 °C. Low moisture content (below 40%) limits microbial activity [21].
On the other hand, very high moisture enhance anaerobic conditions because the pore spaces are filled with water rather than air [51]. Among those variables, the moisture content is considered one of the key parameters affecting the biodegradation process. Furthermore, some studies have suggested an important influence on microbial activity linked with MC than with the temperature [50]. In addition, the number of input materials can change the microbial communities, where T5 possesses the highest amount of green waste material among the piles. This ensures that adding materials to P improves the activity of the micro-organisms, enhancing the composting process.
Each windrow treatment varied regarding the response to water consumption and evaporation. The monitoring was important during the composting process to obtain sufficient conditions for T1–T5 and compare with the current treatment at mill TC. Over ten weeks, moisture content was measured among the different windrows represented in Figure 5. During the first week, all the treatments showed a high moisture content due to the high levels of moisture that CP possesses by itself (Table 2). After the second week, all the windrows except TC reached the recommended moisture content levels for the composting process. Thus, TC has reached the levels recommended after six weeks of the process. In TC occurred no variation during four weeks of pile age. The high value is attributed to the high MC of the coffee by-product. T1–T5 had rapid absorption with the percentages of the mixture of GW and CP. It was observed that the highest amount GW added in the windrow, the fastest was the reduction of the MC in the system after the second week of the composting process.Additionally, pH directly influences composting due to its action on the dynamics of microbial processes [52]. For this study, pH in all windrows rapidly increases within three weeks of all the treatments (Figure 5), showing a tendency. Subsequently, an alkaline state was seen for the rest of the composting process. Some authors have seen a link between the loss of organic acids and the generation of ammonia from the decomposition of proteins and this alkaline state [10,53,54,55]. In all the windrows, at the end of the process, the pH of the treatments was basic (8.8–9.8), indicating maturity since lower pH values would indicate anaerobic processes [56].
Some studies have shown that the alkalinity can be attributed to the high potassium (K) content of the input materials [57], such as using the CP as the primary raw input material for the process (Table 2) [58]. This observation was consistent with the results of this study, showing that the highest pH values were obtained in TC for the last week of the process. The windrows T1–T5 show results as a mature compost, whereas TC indicates an immaturity. The turning and aeration are also important to factor during the pH behavior in the window systems. Having good aeration and oxygen concentration is obtained low concentrations of organic acids enhancing the decomposition of these acids and giving a faster rise in the pH [59].
Once the ten-week composting period was achieved, and the low temperatures remained constant, the samples were shipped to Germany. They were delivered to an accredited testing laboratory for the BGK to analyze plant nutrients, soil amendment, and final physical parameters for the windrows. These results are summarized in Table 3. The elements include nitrogen (N), phosphorous (P), and K, which are fundamental macronutrients for microbial growth. [60]. The total of nutrients is essential since it can vary and allows the mill to determine an appropriate end-use for the compost. N, P, and K are the macronutrients that make the biggest uptake [61]. N is assimilated by the plants in the forms of nitrate (NO3) and ammonium (NH4+), P in forms of orthophosphate (H2PO4), and K in the forms of potassium oxide (K2O) [62]. Nevertheless, attention must be focused on the availability of these nutrients, which is known as a limiting growth and uptake factor [62]. In this case, T4 presents high levels of N and NO3, which the plant can assimilate immediately. It also contains high NH4+ levels, which need a process in the soil for the plant to absorb [60], giving a good combination of NO3 and NH4+. Finally, it contains the highest value of soluble magnesium (Mg), meaning practical use in crops in the future since the soils of coffee production possess a common Mg deficiency [63]. Furthermore, Mg gives color to the plant as it is the central atom of the chlorophyll molecule [64]. To summarize, T4 shows the best performance in the nutrient content, and it is suggested for future usage in the coffee plantations as an additional amendment. It contains high N, NO3, and Mg, which could be used as a plant stimulant in some phenological parts of the crop.
High salt levels can be unfavorable for seeds and plants when compost is for a nursery medium [65].TC showed the lowest plant compatibility test associated with the degree of rotting and the salt levels; meanwhile, the rest of the treatments proposed showed a >95% for plant compatibility and low salt content. Bulk density among the proposed treatments fulfills the BKG limit values (between 400–900 g/L); meanwhile, the control obtained the lowest bulk density value. This could carry consequences in compost application since the material can suffer high pore space and common water retention values, causing difficulties in future compost applications. The lowest C/N ratio was obtained in T5, whereas TC possesses the highest value. Even though CP owns low C/N, this increase is linked to the mineralization of organic N, promoting the ammonia emissions, leading to a high N loss when the initial C:N is low. [66].
On the other hand, the results show high total K values. They are attributed, as previously mentioned, to the high potassium content of the CP since it contains more nitrogen and K than other common finished materials as compost [9]. Regarding the organic substances, BKG recommends values higher of 30% based on dry mass for finished compost. Higher levels indicate that the compost is not finished, as is the case of TC. The rotting degree or self-heating test is considered an important parameter indicating heat in the windrow, showing signs of immaturity. The five categories of the interpretation scale are grouped, often made by professionals and European agencies, into three main classes. The lowest grade (I) is called “fresh compost”, the two intermediate grades (II, III) are called “active compost,” and the top two grades (IV, V) are called “finished compost” [36]. For all the treatments, the grade was IV and V except for the control.

3.2. Methane Gas Emissions

The CH4 is influenced by different factors such as temperature, moisture, and pH directly [67]. When the aeration is not proper and the moisture content increases in the windrow, this can result in high CH4 emissions affecting the oxygen restrictions in the microbiological metabolism in the windrow [5,68,69]. Methane emissions rates shown in Figure 6A were measured during the first six weeks of the composting process and compared if the addition of GW influences their emissions in the windrows. The highest value is TC with 38 g × m−2 × h−1 in the first week of composting. Comparing Figure 5 of MC and Figure 6, the first week of composting process possesses the highest value for moisture content among the study. Thus, the production of CH4 is also increased exponentially with the moisture level, allowing the formation of undesirables anaerobic zones enhancing the methanogenesis and anaerobic metabolism in the windrow [30,33]. Even if the composting treatment is under aerobic conditions, the diversity of the input materials, moisture content, temperature, biological microbial activity, and redox requirements could be developed in the window [2].
In this study, the reduction of CH4 during composting is accomplished if additional material is used, such as GW. The weekly highest values among the treatments were found for T1 and T2 with 3.1 g × m−2 × h−1 and 3.3 g × m−2 × h−1, respectively. Each value was found during the fourth week and for T3, T4, T5 with 6.4 g × m−2 × h−1, 3.6 g × m−2 × h−1, and 1.8 g × m−2 × h−1, respectively in the fifth week. Emissions formation increases faster when temperatures are over 65 °C [3]. Furthermore, a correlation between the temperature profiles and the emissions peaks is shown since the highest peaks of temperatures and emissions were found for the windrows during the same weeks of the composting process.
The presence of low pH, which illustrates the presence latency of organic acids, and the present of also CH4 emissions, indicates that anaerobic conditions have been since the initial formation of the windrow pile [68]. The reduction of total emissions CH4 was between 89–95% compared to the control treatment, which shows the difference of aeration and proper management within the treatments compared to the control. Researchers recommend that increasing the oxygen level available in the system is necessary during the first week [3]. In the fifth week, methane emissions were higher than in the first week for T1–T5. This could be attributed to the moisture suppressing the airflow since the material at that week is more compact. The pores in the feedstock are filled with water, favoring the formation of anaerobic conditions and methane emissions [31]. The emissions in the fifth week were the highest among the treatment compared to the control TC. The reduction of emissions with GW is added in the window is seen. In other studies, it has been found that CH4 emissions are present during the initial stage of the thermophilic phase since there is an oxygen solubility reduction, enhancing anaerobic zones in the windrow [70]. During CH4 emission exists other microbial factors affecting the gas transport and gas diffusion, including the presence of methanotrophic bacteria (these bacteria are colonizing the area nearby anaerobic zones being able to oxidize up to 98% of the CH4 formed in the windrow) [71].
A previous study [10] shows the magnitude of the CH4 emissions in open field depositions when the CP is not composted or pre-treated before field deposition, generating serious environmental concerns. Figure 6B shows the behavior of the methane emissions over the years when the CP is buried for a lifetime. The highest emission was in the second year with 53.7 g × m−2 × h−1. Equivalent emissions are seen in the first and the fifth year of field deposition with 25.6 and 24.4 g × m−2 × h−1. These results imply that the material is not degraded over time, producing continuous emissions of great magnitude when not treated correctly. This behavior of high CH4 emissions over this period is due to the properties of the CP. When it is buried with high moisture content, high material density, and a lack of aeration, anaerobic zones are created, enhancing the methane emissions.
Given this problem and its emissions, the mill aims for successive harvests to avoid this practice. For example, during the 2019–2020 harvest, open field depositions were made with about 630 Mg (6000 fanegas). In previous years, a minimum of 1500 Mg of CP was transported in the fields. It is clear that the depositions are a risk and a focus of emissions since they are large spaces of at least 925 m2 of surface area; therefore, the high levels of emissions over the years can be attributed to the surface area, amount of material, and the management in that area.
For the estimation of EF among all the treatments, it is shown in two different options. Firstly, a calculation of EF regarding the amount of CP added in each treatment. It is crucial to establish since there is no EF associated directly with CP in the literature, where the results show that the more CP added into the system, the higher EF is obtained. After this, an EF calculation was input to represent the treatments better and was compared with literature regarding green waste from some regulations in composting plants.
The government is currently developing a new national composting plan accomplishing the strategic guidelines of the National Decarbonization Plan 2050. The inventories of GHGs in Costa Rica regarding waste management are made by the National Meteorological Institute (IMN for its abbreviation in Spanish). Therefore, the results in this research are compared with the National Inventory’s values; nevertheless, it is necessary to be analyzed. These inventories are for municipal solid waste; therefore, these results cannot be thoroughly compared since the country does not explicitly relate to agricultural waste. On the other hand, there is no emission factor directly linked to CP; a comparison in the literature shows 4 g CH4/kg solid waste [72], 4 g CH4/kg waste treated [73], 2.2 g CH4/Mg GW FM [5], 4.7 and 7.6 g CH4/kg GW [74].
The emissions factors shown in Table 4 show the decrease of emissions comparing TC with the rest of the treatments. The utmost emission values found were in T3 and T4 with 14 g CH4/kg CP. The closest value compared to the literature is T5. One of the reasons could be the amount of GW added since it had the most significant amount of material in a pile. Compared with the literature values of biological treatments, these results present elevated values. However, with the proposed methodology for all the five treatments, these values are approaching the values recommended by the literature for composting. For the open field depositions, even if there is no management involved, the emissions factors represented the highest values among all the treatments, including the current treatment of the mill.

4. Conclusions

The study achieved the development of an experimental methodology using coffee by-products and GW. An improvement in the key parameters of composting was observed, such as temperature, pH, and WC profiles, when coffee by-products were mixed with GW for composting treatment. Therefore, waste valorization within the process is concluded together with the reduction of methane emissions. The proposed treatments experienced fewer methane emissions rates than the control; hence, implementing this technique suggests a good practice in the future for the coffee sector and the mill in Costa Rica. Results show that T2–T5 are strongly recommended treatments involving methane emissions, physical parameters during the process, plant nutrient content, and finished compost classified (Grade IV and V) following the BKG standards. Overall, this study promotes a better understanding of the performance of CP when the material is composted and their methane emissions during the process. This approach might be necessary for the future to guide a national mitigation plan in the agricultural and coffee sector of the country. In addition, it will be a helpful tool for the future calculations of the global emissions using a technology already studied in another place or another treatment plant. Suppose it is considered the agronomic and environmental aspects in an integrated manner. It is recommended to investigate further the benefits of using the compost and the relationship between GHG emitted during the process. The compost utilization can also compensate for this reduction in the long term in the coffee plantations. Continuous but robust research is suggested to develop emissions and factors that adequately cover national conditions to establish new inventories, especially for the coffee sector, including coffee by-products and management.

Author Contributions

Conceptualization: M.S.M.R., M.R.; methodology: M.R., M.S.M.R., and M.K.; validation: M.R., M.K., and M.S.M.R.; formal analysis: M.S.M.R., M.R.; investigation: M.S.M.R.; M.R., and M.K.; data curation: M.S.M.R., M.R.; writing—original draft preparation: M.S.M.R., M.R.; supervision: M.R., M.K., and M.S.M.R.; project administration: M.R., M.K. All authors have read and agreed to the published version of the manuscript.

Funding

This work has been financed by the Coffee Mill Coopetarrazú R.L in Costa Rica.

Acknowledgments

We gladly thank the personnel, laboratory assistances, students, and colleagues of the Institute for Sanitary Engineering, Water Quality and Solid Waste Management (ISWA) at the University of Stuttgart.

Conflicts of Interest

The authors declare no conflict of interest.

References

  1. Smith, P.; Bustamante, M.; Ahammad, H.; Clark, H.; Dong, H.; Elsiddig, E.A.; Haberl, H.; Harper, R.; House, J.; Jafari, M.; et al. Agriculture, Forestry and Other Land Use (AFOLU). In Climate Change 2014 Mitigation of Climate Change Mitigation of Climate Change. Contribution of Working Group III to the Fifth Assessment Report of the Intergovern-Mental Panel on Climate Change; Edenhofer, O., Pichs-Madruga, R., Sokona, Y., Farahani, E., Kadner, S., Seyboth, K., Adler, A., Baum, I., Brunner, S., Eickemeier, P., Eds.; Cambridge University Press: Cambridge, UK, 2014; pp. 811–922. [Google Scholar]
  2. Bridgham, S.D.; Richardson, C.J. Mechanisms controlling soil respiration (CO2 and CH4) in southern peatlands. Soil Biol. Biochem. 1992, 24, 1089–1099. [Google Scholar] [CrossRef]
  3. Vergara, S.E.; Silver, W.L. Greenhouse gas emissions from windrow composting of organic wastes: Patterns and emissions factors. Environ. Res. Lett. 2019, 14, 124027. [Google Scholar] [CrossRef]
  4. US EPA. AP 42, Fifth Edition Compilation of Air Pollutant Emission Factors, Volume 1: Stationary and Point Sources; US EPA: Research Triangle Park, NC, USA, 1995; pp. 1–10.
  5. Amlinger, F.; Peyr, S.; Cuhls, C. Green house gas emissions from composting and mechanical biological treatment. Waste Manag. Res. 2008, 26, 47–60. [Google Scholar] [CrossRef] [PubMed]
  6. Sánchez, A.; Gabarrell, X.; Artola, A.; Barrena, R.; Colón, J.; Font, X.; Komilis, D.; Taherzadeh, M.J.; Richards, T. Composting of Wastes. Resource Recovery to Approach Zero Municipal Waste, 1st. ed.; Taherzadeh, M.J., Richards, T., Eds.; Green Chemistry and Chemical Engineering: Boca Raton, FL, USA, 2015; pp. 77–106. [Google Scholar]
  7. Blinová, L.; Sirotiak, M.; Bartošová, A.; Soldán, M. Review: Utilization of Waste from Coffee Production. Res. Pap. Fac. Mater. Sci. Technol. Slovak Univ. Technol. 2017, 25, 91–101. [Google Scholar] [CrossRef] [Green Version]
  8. Chong, J.A.; Dumas, J.A. Coffee pulp compost: Chemical properties and distribution of humic substances. J. Agric. Univ. Puerto Rico 2012, 96, 77–87. [Google Scholar] [CrossRef]
  9. Braham, J.; Bressani, R. Coffee Pulp: Composition, Technology, and Utilization; IDRC: Ottawa, ON, Canada, 1979. [Google Scholar]
  10. San Martin Ruiz, M.; Reiser, M.; Hafner, G.; Kranert, M. A Study about Methane Emissions from Different Composting Systems for Coffee By-products on Costa Rica. Environ. Ecol. Res. 2018, 6, 461–470. [Google Scholar] [CrossRef]
  11. Chala, B.; Oechsner, H.; Latif, S.; Müller, J. Biogas Potential of Coffee Processing Waste in Ethiopia. Sustainability 2018, 10, 2678. [Google Scholar] [CrossRef] [Green Version]
  12. Beyene, A.; Kassahun, Y.; Addis, T.; Assefa, F.; Amsalu, A.; Legesse, W.; Kloos, H.; Triest, L. The impact of traditional coffee processing on river water quality in Ethiopia and the urgency of adopting sound environmental practices. Environ. Monit. Assess. 2011, 184, 7053–7063. [Google Scholar] [CrossRef]
  13. Desai, N.M.; Varun, E.; Patil, S.; Pimpley, V.; Murthy, P.S. Environment Pollutants During Coffee Processing and Its Valorization BT. In Handbook of Environmental Materials Management; Hussain, C.M., Ed.; Springer International Publishing: Cham, Switzerland, 2020; pp. 1–13. [Google Scholar]
  14. Misra, R.V.; Roy, R.N.; Hiraoka, H.; Food and Agriculture Organisation of the United Nations. FAO On-farm com-posting methods, Composting Methods and Techniques, Rome. 2003. Available online: http://www.fao.org/docrep/007/y5104e/y5104e05.htm (accessed on 17 February 2021).
  15. Sánchez, A.; Artola, A.; Font, X.; Gea, T.; Barrena, R.; Gabriel, D.; Sánchez-Monedero, M.Á.; Roig, A.; Cayuela, M.L.; Mondini, C. Greenhouse Gas from Organic Waste Composting: Emissions and Measurement. In CO2 Sequestration, Biofuels and Depollution. Environmental Chemistry for a Sustainable World; Lichtfouse, E., Schwarzbauer, J., Robert, D., Eds.; Springer: Cham, Switzerland, 2015; Volume 5. [Google Scholar] [CrossRef]
  16. Diaz, L.F.; De Bertoldi, M.; Bidlingmaier, W. Compost Science and Technology; Elsevier: Amsterdam, The Netherlands, 2007. [Google Scholar]
  17. Haug, R.T. The Practical Handbook of Compost Engineering, 1st ed.; Lewis Publishers: Atascadero, CA, USA, 1993. [Google Scholar]
  18. Shemekite, F.; Gómez-Brandón, M.; Franke-Whittle, I.H.; Praehauser, B.; Insam, H.; Assefa, F. Coffee husk composting: An investigation of the process using molecular and non-molecular tools. Waste Manag. 2014, 34, 642–652. [Google Scholar] [CrossRef] [Green Version]
  19. VDI Guideline: Emission Control Mechnical-Biological Treatment Facilities for Municipal Solid Waste; VDI 3475 Part 3; Beuth Verlag GmbH: Berlin, Germany, 2006.
  20. Kranert, M. Einführung in die Kreislaufwirtschaft: Planung-Recht-Verfahren; Springer: Vieweg, Wiesbaden, 2017. [Google Scholar]
  21. Shilev, S.; Naydenov, M.; Vancheva, V.; Aladjadjiyan, A. Composting of Food and Agricultural Wastes. In Utilization of By-Products and Treatment of Waste in the Food Industry; Springer: Berlin, Germany, 2006; pp. 283–301. [Google Scholar]
  22. Ghazifard, A.; Kasra-Kermanshahi, R.; Far, Z.E. Identification of thermophilic and mesophilic bacteria and fungi in Esfahan (Iran) municipal solid waste compost. Waste Manag. Res. 2001, 19, 257–261. [Google Scholar] [CrossRef]
  23. Azim, K.; Soudi, B.; Boukhari, S.; Perissol, C.; Roussos, S.; Alami, I.T. Composting parameters and compost quality: A literature review. Org. Agric. 2018, 8, 141–158. [Google Scholar] [CrossRef]
  24. IVillar, I.; Alves, D.; Garrido, J.; Mato, S. Evolution of microbial dynamics during the maturation phase of the composting of different types of waste. Waste Manag. 2016, 54, 83–92. [Google Scholar] [CrossRef] [Green Version]
  25. Zhu-Barker, X.; Bailey, S.K.; Paw, U.K.T.; Burger, M.; Horwath, W.R. Greenhouse gas emissions from green waste composting windrow. Waste Manag. 2017, 59, 70–79. [Google Scholar] [CrossRef]
  26. VDI Guideline: Emission Control Biological Waste Treatment Facilities Composting and Anaerobic Digestion Plant Capacities More Than Approx. 6; VDI 3575 Part 1; Beuth Verlag GmbH: Berlin, Germany, 2003.
  27. Sánchez, A.; Artola, A.; Font, X.; Gea, T.; Barrena, R.; Gabriel, D.; Sanchez-Monedero, M.A.; Roig, A.; Cayuela, M.L.; Mondini, C. Greenhouse gas emissions from organic waste composting. Environ. Chem. Lett. 2015, 13, 223–238. [Google Scholar] [CrossRef] [Green Version]
  28. Díaz, M.V.; Prada, P.; Mondragon, M. Optimización del proceso de compostaje de productos post-cosecha (cereza) del café con la aplicación de microorganismos nativos. Nova 2010, 8, 214. [Google Scholar] [CrossRef] [Green Version]
  29. Muzaifa, M.; Rahmi, F.; Syarifudin. Utilization of Coffee By-Products as Profitable Foods—A Mini Review. IOP Conf. Ser. Earth Environ. Sci. 2021, 672, 012077. [Google Scholar] [CrossRef]
  30. Ijanu, E.M.; Kamaruddin, M.A.; Norashiddin, F.A. Coffee processing wastewater treatment: A critical review on current treatment technologies with a proposed alternative. Appl. Water Sci. 2019, 10, 11. [Google Scholar] [CrossRef] [Green Version]
  31. Duong, B.; Marraccini, P.; Maeght, J.-L.; Vaast, P.; Lebrun, M.; Duponnois, R. Coffee Microbiota and Its Potential Use in Sustainable Crop Management. A Review. Front. Sustain. Food Syst. 2020, 4, 237. [Google Scholar] [CrossRef]
  32. Government of Costa Rica. National Decarbonization Plan, Costa Rica. 2019. Available online: https://unfccc.int/sites/default/files/resource/NationalDecarbonizationPlan.pdf (accessed on 16 February 2021).
  33. Moldvaer, A. Coffee Obsession, 1st ed.; Dorling Kindersley Limited: London, UK, 2014. [Google Scholar]
  34. San Martin Ruiz, M.; Reiser, M.; Kranert, M. Enhanced composting as a way to a climate-friendly management of coffee by-products. Environ. Sci. Pollut. Res. 2020, 27, 24312–24319. [Google Scholar] [CrossRef]
  35. SEPSA. Costa Rica. Equivalencias, Rendimientos, Pesos y Factores de Conversión Utilizados en Algunos Productos Agro-pecuarios. SEPSA, 2017. Available online: http://www.infoagro.go.cr/BEA/BEA24/BEA24/img_superficie_produccion/superficie_produccion_17.pdf (accessed on 16 February 2021).
  36. Ramírez, S.M.; Ballestero, Y.Q. Boletín Estadístico Agropecuario №29 |Serie Cronológica 2015–2018, Costa Rica. 2019. Available online: http://www.mag.go.cr/bibliotecavirtual/BEA-0029.PDF (accessed on 16 February 2021).
  37. BGK. Qualitätsmanagement-Handbuch (QMH), RAL-Gütesicherung Kompost (RAL-GZ 251). In QM-Handbuch Kompost; BGK- Bundesgütegemeinschaft Kompost e.V: Köln, Germany, 2017; p. 45. [Google Scholar]
  38. Hermann Sewering: Technisches Datenblatt · Multitec 540; Hermann Sewerin GmbH: Gütersloh, Germany, 2012.
  39. Bidlingmaier, W. Methods Book for the Analysis of Compost, 3rd ed.; Federal Compost Quality Assurance Organisation (FCQAO) Bundesgütegemeinschaft Kompost e.V. (BGK): Köln, Germany, 2003. [Google Scholar]
  40. VDI Guideline: Emission Control Facilities for Biological Waste Composting an Anaerobic (Co-)Digestion Plant Capacities up to Approx 6000 Mg/a A; VDI 3475 Part 2; Beuth Verlag GmbH: Berlin, Germany, 2005.
  41. VDI Guideline: Olfactometry Static Sampling; VDI 3880; Beuth Verlag GmbH: Berlin, Germany, 2011.
  42. Clauß, T.; Reinelt, T.; Vesenmaier, A.; Flandorfer, C.; Reiser, M.; Ottner, R.; Huber-Humer, M.; Flandorfer, C.; Stenzel, C.; Piringer, M.; et al. Recommendations for Reliable Methane Emission Rate Quantification at Biogas Plants; Deutsches Bio-masseforschungszentrum gemeinnützige GmbH: Leipzig, Germany, 2019. [Google Scholar]
  43. Liebetrau, J.; Reinelt, T.; Clemens, J.; Hafermann, C.; Friehe, J.; Weiland, P. Analysis of greenhouse gas emissions from 10 biogas plants within the agricultural sector. Water Sci. Technol. 2013, 67, 1370–1379. [Google Scholar] [CrossRef]
  44. Taiwo, L.B.; Oso, B.A. Influence of composting techniques on microbial succession, temperature and pH in a composting municipal solid waste. Afr. J. Biotechnol. 2004, 3, 239–243. [Google Scholar]
  45. Miyatake, F.; Iwabuchi, K. Effect of compost temperature on oxygen uptake rate, specific growth rate and enzymatic activity of microorganisms in dairy cattle manure. Bioresour. Technol. 2006, 97, 961–965. [Google Scholar] [CrossRef]
  46. Inserra, R.N.; Hampton, M.O.; Schubert, T.S.; Stanley, J.D.; Brodie, M.W.; Bannon, J.H.O. Guidelines for compost sanitation. Proc. Soil Crop Sci. Soc. Florida 2006, 65, 31–37. [Google Scholar]
  47. Jenkins, J. Sanitation by Composting, United States. 2011. Available online: https://humanurehandbook.com/downloads/Compost_Sanitation_Paper_9_2011.pdf (accessed on 22 April 2019).
  48. MHimanen, M.; Hänninen, K. Composting of Bio-Waste, Aerobic and Anaerobic Sludges–Effect of Feedstock on the Process and Quality of Compost. Bioresour. Technol. 2010, 102, 2842–2852. [Google Scholar] [CrossRef]
  49. Richard, T.; Hamelers, H.; Veeken, A.; Silva, T. Moisture Relationships in Composting Processes. Compos. Sci. Util. 2002, 10, 286–302. [Google Scholar] [CrossRef]
  50. Richard, T.L.; Veeken, A.H.M.; De Wilde, V.; Hamelers, H. Air-Filled Porosity and Permeability Relationships during Solid-State Fermentation. Biotechnol. Prog. 2004, 20, 1372–1381. [Google Scholar] [CrossRef]
  51. Liang, C.; Das, K.; McClendon, R. The influence of temperature and moisture contents regimes on the aerobic microbial activity of a biosolids composting blend. Bioresour. Technol. 2003, 86, 131–137. [Google Scholar] [CrossRef]
  52. Kim, E.; Lee, D.-H.; Won, S.; Ahn, H. Evaluation of Optimum Moisture Content for Composting of Beef Manure and Bedding Material Mixtures Using Oxygen Uptake Measurement. Asian-Australas. J. Anim. Sci. 2016, 29, 753–758. [Google Scholar] [CrossRef] [PubMed] [Green Version]
  53. Sundberg, C. Low pH as an inhibiting factor in the transition from mesophilic to thermophilic phase in composting. Bioresour. Technol. 2004, 95, 145–150. [Google Scholar] [CrossRef] [PubMed]
  54. Burg, P.; Zemánek, P.; Michálek, M. Evaluating of selected parameters of composting process by composting of grape pomace. Acta Univ. Agric. Silvic. Mendel. Brun. 2014, 59, 75–80. Available online: https://acta.mendelu.cz/media/pdf/actaun_2011059060075.pdf (accessed on 23 April 2019). [CrossRef] [Green Version]
  55. Sundberg, C. Improving Compost Process Efficiency by Controlling Aeration, Temperature and pH. Ph.D. Thesis, Swedish University of Agricultural Sciences, Uppsala, Sweden, 2005. [Google Scholar]
  56. Sánchez-Monedero, M.; Roig, A.; Paredes, C.; Bernal, M.P. Nitrogen transformation during organic waste composting by the Rutgers system and its effects on pH, EC and maturity of the composting mixtures. Bioresour. Technol. 2001, 78, 301–308. [Google Scholar] [CrossRef]
  57. Suler, D.J.; Finstein, M.S. Effect of Temperature, Aeration, and Moisture on CO2 Formation in Bench-Scale, Continuously Thermophilic Composting of Solid Waste. Appl. Environ. Microbiol. 1977, 33, 345–350. [Google Scholar] [CrossRef] [PubMed] [Green Version]
  58. Yeo, D.; Dongo, K.; Mertenat, A.; Lüssenhop, P.; Körner, I.; Zurbrügg, C. Material Flows and Greenhouse Gas Emissions Reduction Potential of Decentralized Composting in Sub-Saharan Africa: A Case Study in Tiassalé, Côte d’Ivoire. Int. J. Environ. Res. Public Heal. 2020, 17, 7229. [Google Scholar] [CrossRef] [PubMed]
  59. Zoca, S.M.; Penn, C.J.; Rosolem, C.A.; Alves, A.R.; Neto, L.O.; Martins, M.M. Coffee processing residues as a soil potassium amendment. Int. J. Recycl. Org. Waste Agric. 2014, 3, 155–165. [Google Scholar] [CrossRef] [Green Version]
  60. Beck-Friis, B.; Smårs, S.; Jónsson, H.; Eklind, Y.; Kirchmann, H. Composting of Source-Separated Household Organics At Different Oxygen Levels: Gaining an Understanding of the Emission Dynamics. Compos. Sci. Util. 2003, 11, 41–50. [Google Scholar] [CrossRef]
  61. Roy, R.N.; Finck, A.; Blair, G.J.; Tandon, H.L.S. Plant Nutrition for Food Security. A Guide for Integrated Nutrient Management. In Fertilizer and Plant Nutrition Bulletin 16; FAO, Ed.; Food and Agricultural Organization of United Nations: Rome, Italy, 2006; p. 348. [Google Scholar]
  62. Tong, J.; Sun, X.; Li, S.; Qu, B.; Wan, L. Reutilization of Green Waste as Compost for Soil Improvement in the Afforested Land of the Beijing Plain. Sustainability 2018, 10, 2376. [Google Scholar] [CrossRef] [Green Version]
  63. Gondek, M.; Weindorf, D.C.; Thiel, C.; Kleinheinz, G. Soluble Salts in Compost and Their Effects on Soil and Plants: A Review. Compos. Sci. Util. 2020, 28, 59–75. [Google Scholar] [CrossRef]
  64. Nzeyimana, I.; Hartemink, A.E.; de Graaff, J. Coffee Farming and Soil Management in Rwanda. Outlook Agric. 2013, 42, 47–52. [Google Scholar] [CrossRef] [Green Version]
  65. Senbayram, M.; Gransee, A.; Wahle, V.; Thiel, H. Role of magnesium fertilisers in agriculture: Plant–soil continuum. Crop. Pasture Sci. 2015, 66, 1219–1229. [Google Scholar] [CrossRef]
  66. Paradelo, R.; Devesa-Rey, R.; Cancelo-González, J.; Basanta, R.; Peña, M.; Diaz-Fierros, F.; Barral, M.T. Effect of a compost mulch on seed germination and plant growth in a burnt forest soil from NW Spain. J. Soil Sci. Plant Nutr. 2012, 12, 73–86. [Google Scholar] [CrossRef] [Green Version]
  67. Hao, X.; Benke, M.B. Nitrogen Transformation and Losses during Composting and Mitigation Strategies; Global Science Books: Isleworth, UK, 2008. [Google Scholar]
  68. Taconi, K.A.; Zappi, M.E.; French, W.T.; Brown, L.R. Methanogenesis under acidic pH conditions in a semi-continuous reactor system. Bioresour. Technol. 2008, 99, 8075–8081. [Google Scholar] [CrossRef] [PubMed]
  69. Ermolaev, E.; Sundberg, C.; Pell, M.; Smårs, S.; Jönsson, H. Effects of moisture on emissions of methane, nitrous oxide and carbon dioxide from food and garden waste composting. J. Clean. Prod. 2019, 240, 118165. [Google Scholar] [CrossRef]
  70. Jiang, T.; Schuchardt, F.; Li, G.; Guo, R.; Zhao, Y. Effect of C/N ratio, aeration rate and moisture content on ammonia and greenhouse gas emission during the composting. J. Environ. Sci. 2011, 23, 1754–1760. [Google Scholar] [CrossRef]
  71. Jäckel, U.; Thummes, K.; Kämpfer, P. Thermophilic methane production and oxidation in compost. FEMS Microbiol. Ecol. 2005, 52, 175–184. [Google Scholar] [CrossRef] [PubMed]
  72. IMN. Factores de Emisión Gases Efecto Invernadero, San José, Costa Rica. 2020. Available online: http://cglobal.imn.ac.cr/index.php/publications/factores-de-emision-gei-decima-edicion-2020/ (accessed on 10 February 2021).
  73. IPCC. Volume 5 Waste-Chapter 4 Biological Treatment of Solid Waste, 2006 IPPC Guidel. National Greenhouse Gas Inventories. 2006, pp. 4.1–4.8. Available online: http://www.ipcc-nggip.iges.or.jp/public/2006gl/vol5.html (accessed on 5 February 2021).
  74. ARB. Air Resources Board (ARB): Method for Estimating Greenhouse Gas Emission Reduction from Diversion of Organic Waste from Landfills to Compost Facilities. 2017. Available online: https://ww2.arb.ca.gov/sites/default/files/classic/cc/waste/cerffinal.pdf (accessed on 18 February 2021).
Figure 1. Aerial photo of the proposed treatments T1–5 (right section) and aerial photo of the current treatment at the mill TC (left section).
Atmosphere 12 01153 g001
Figure 2. Diagram flow principle of gas sampling on a passive source area in a windrow.
Atmosphere 12 01153 g002
Figure 3. Temperature profiles in all the types of windrows. TA: ambient temperature. Bars represent the standard error of the mean (n = 4).
Atmosphere 12 01153 g003
Figure 4. Comparison of mean colony-forming unit (CFU/g) for samples T1, T5, and TC during the third week of the composting process.
Atmosphere 12 01153 g004
Figure 5. Moisture content and pH profiles in all the types of windrows throughout CP composting. Values are the means (n = 3).
Atmosphere 12 01153 g005
Figure 6. (A) Methane emissions rate for all the treatments using coffee pulp for composting and (B) methane emissions rate in field deposition. Bars represent the standard error of the mean (n = 4).
Atmosphere 12 01153 g006
Table 1. Overview of the treatments based on volume and amount of pulp used for each treatment for 23 windrows.
TreatmentWindrow Percentage
Based on Volume
Total CP in Mg
per Treatment
Total Number of WindrowsTotal of Fanegas
per Treatment **
T180% CP–20% GW98.547937
T275% CP–25% GW36.953351
T370% CP–30% GW49.274468
T460% CP–40 % GW18.482176
T550% CP–50% GW9.24188
TC100% CP (Control)105.5861004
CP: coffee pulp, GW: green waste (grass clippings and weeds + structural materials), ** Fanega: typical Costa Rican coffee measure, where one Fanega corresponds to 105.2 kg of P and 253 kg of coffee fruit [34,35].
Table 2. Properties for the raw material used for the composting process.
ParametersMC (%)pHCE (mscm 1)C/N VS (%) DM *C (%)N (%)P (%)K (%)Ƿt g/L
SM 1556.22.759.377.2470.80.080.795.4
CP 2824.93.916.194.76442.30.113.17432
DGW 37.975.83591.27381.10.392.531.4
DM *: dry matter; SM 1: structural material; CP 2: coffee pulp; DGW 3: dry grass clippings and weeds.
Table 3. Final parameters of plant nutrients, soil amendment, and physical parameters of the compost treatments.
ParametersUnitsTCT1T2T3T4T5
Plant Nutrients
Total Nitrogen (N)% *1.611.141.061.371.361.31
Total Phosphate (P2O5)% *0.590.440.460.460.440.47
Total Potassium (K2O)% *4.282.952.873.192.962.93
Total Magnesium (MgO)% *0.360.290.360.350.330.33
Nitrate CaCl2-soluble (NO3-N)mg/L **8114128103276162
Ammonia CaCl2-soluble (NH4-N)mg/L **4540222366108
Phosphate CaCl2-soluble (P2O5) 1mg/L **2981331501226551
Potassium CaCl2-soluble (K2O)mg/L **10,70010,90011,4009750992010,400
Soil Amendment
Organic Substances% *60.443.937.547.345.140.4
Alkaline Active Ingredients (CaO)% *2.42.312.252.692.282.18
Magnesium CaCl2-solublemg/L **192744304843
Physical Parameters
Degree of Rotting-344555
Salinityg KCl/L **5.975.143.963.764.533.68
Bulk densityg/L **345502520414464504
PC 1 50% Substrate% * 759795103100102
PC 25% Substrate% *528290878895
C/N Ratio-222221201918
1 PC: plant compatibility (relative yield); * Fresh mass. ** Dry Mass.
Table 4. Emissions factors from all the treatments proposed.
TreatmentEF (g CH4/kg CP)EF (g CH4/kg Input)SD *
T143.935.10.23
T214.410.80.17
T320140.23
T423.4140.24
T511.65.80.14
TC1291292.96
D *: standard deviation of the mean values (n = 4).
Publisher’s Note: MDPI stays neutral with regard to jurisdictional claims in published maps and institutional affiliations.

