Abstract
In this study, the information potential of a two-step sequential extraction procedure was evaluated. For this purpose, first of all the elemental composition of Arctic PM10 samples collected in Ny-Ålesund (Svalbard Islands) from 28 February 2015 to 21 October 2015 was investigated. Enrichment Factors, Principal Component Analysis and Hierarchical Cluster Analysis were performed to identify PM10 sources and to understand the effects of short- and long-range transport processes. The investigation of the potential source areas was also aided by taking into account back-trajectories. Then, the sequential extraction procedure was applied to some of the samples in order to obtain more information on these sources. This approach allowed us to establish that most of the elements prevalently having an anthropogenic origin not only were present in higher concentrations, but they were also more easily extractable in late winter and early spring. This confirms the common statement that the anthropogenic portion of the elements present in a sample is generally loosely bound to the particulate matter structure, and so it is more easily extractable and releasable on the Arctic snowpack. Moreover, in the samples collected in late winter and early spring, even the elements prevalently having a crustal origin were more easily extractable, probably due to the particle size selection occurred during the long-range transport.
1. Introduction
It is widely recognised that the global climate change is first perceptible in the polar regions, due to alterations of water mass distribution and sea ice extension. It is known that the Arctic warming is occurring much more rapidly than the global average, and in particular, the Ny-Ålesund archipelago has experienced a significant rise in temperature over the last two decades [1,2]. Moreover, polar areas play a key role in regulating biogeochemical cycles, and hence the global climatic system, through complex “feedback” mechanisms. The understanding of the mechanisms regulating the interaction among air, oceans and ice in these areas is essential to predict the effects of the changes observed in the climate. In this scenario, the study of the chemical composition of atmospheric particulate matter in Arctic, the understanding of the transport mechanisms by which inorganic pollutants emitted in temperate and tropical areas reach Arctic and the possibility to interrelate this information with complementary features are important to understand the effect exerted by the climatic conditions on this area, as well as to highlight possible tendencies or anomalies of behaviour and future evolutions [3,4,5,6].
With this aim, it is important to know both total concentration and reactivity and availability of the metal species. In fact, although solubility depends on the chemical nature of compounds and particles considered, the distinction between soluble and insoluble fractions in the Arctic atmospheric aerosol may have two main applications: the identification of the relative contributions of different natural and anthropogenic sources of aerosol (for example continental, biogenic and marine); the understanding, on one hand, of the processes of generation and transport at short and long distance of the aerosol in Arctic and, conversely, of the tendency of the metals associated with atmospheric particulate solid phases to enter into biogeochemical cycles.
The determination of trace elements in airborne particulate matter samples (PM) collected in polar environments is generally performed by means of a direct microwave-assisted acid digestion [7,8,9]. Even though the determination of such low concentrations certainly requires the adoption of precautions to avoid contamination, this procedure is relatively easy and allows an accurate determination of PM element composition. However, in this way, it is not possible to distinguish the different chemical forms in which the elements are present in the samples.
The procedures allowing this distinction are called “speciation” and can be a useful tool for source apportionment studies, i.e., for studies focused on the source and provenance identification of the PM. Nevertheless, in practice, proper speciation is not easy to perform, and it is generally substituted by fractionation through sequential extraction procedures [10,11,12,13,14]. The latter have an operational nature and simply provide a classification of analytes according to their chemical properties (i.e., solubility) [12,15]. However, it is generally recognised that the anthropogenic portion of the elements in PM is more easily extractable than the crustal one [16,17].
Different extracting solutions, extraction methods, and techniques for the separation of the extract from the solid residue are currently used for the fractionation purpose, thus reducing the possibility to compare results obtained in different studies [11,13,18,19,20]. In a previous study, the most common extracting solutions (namely high purity water (HPW), 0.032 M HNO3, 0.022 M HCl, 0.11 M CH3COOH, and 0.012 M CH3COOH/CH3COONH4 buffer) and extraction methods (namely 16 h stirring and 15 min ultrasounds) used for the first step of element fractionation in PM were compared, in order to identify the procedure which gives the best estimation of the anthropogenic portion of the elements present in Arctic PM10 samples [21].
In this study, the information potential of the optimized two-step sequential extraction procedure (i.e., 0.032 M HNO3 and 16 h stirring, followed by a microwave-assisted acid digestion) was evaluated considering selected Arctic PM10 samples collected in Ny-Ålesund (Svalbard Islands, Norwegian Arctic) in 2015. Firstly, the elemental composition was determined by microwave digestion. Then, the sequential extraction procedure was applied to selected samples, in order to evaluate the different mobility and reactivity of the elements, which in turn determine their behaviour at the air-snow and air-ocean interfaces, and obtain more information on the PM10 sources. A wide variety of elements was determined, i.e., Al, As, Ba, Ca, Cd, Co, Cr, Cu, Fe, K, Mg, Mn, Na, Ni, Pb, Sb, Ti, V and Zn. To the best of our knowledge, our study is the first in which a fractionation procedure was applied to a large number of Arctic PM10 samples, although fractionation studies have already been performed in polar areas, namely on the Antarctic atmospheric particulate matter [10,13,14].
2. Materials and Methods
2.1. Study Area and Sampling
Ny-Ålesund (78°55′30″ N, 11°55′40″ E) is a small Arctic settlement mainly devoted to scientific research and environmental monitoring. It is located in the Norwegian Svalbard archipelago and, more precisely, in the Kongsfjorden, on the western coast of Spitsbergen Island [8]. The aerosol sampling was performed at the Gruvebadet atmospheric laboratory (40 m a.s.l.), situated about 800 m far from Ny-Ålesund. The location was established in order to minimize the influence of local pollution during measurements, which is kept low thanks to the prevailing wind direction (115° N) [22]. Moreover, a meteo-trigger system was used during sampling, in order to switch off the sampling devices when the wind was absent (<0.5 m/s) or came from the town [8,9].
A total of 58 PM10 samples were collected with a 4-days resolution during the 2015 sampling campaign, which started on 28 February and ended on 21 October. For the sake of brevity, the samples are named throughout the manuscript according to the sampling start date. The sampling took place by means of PTFE hydrophilic filters (Advantec, product code: H100A090C, 90 mm diameter, efficiency >99% for 0.3 μm particles) and an Echo HiVol sampler (TCR Tecora, 200 L/min). These filters have been used in previous studies [7,8,21] and featured extremely reproducible and low blanks. Before shipping them to the Gruvebadet station for the present sampling campaign, several filters were tested in laboratory to ensure their good performance with regard to blank values. Moreover, it should be noted that all the filters used in the 2015 sampling campaign derive from the same batch. The collected samples were placed in polycarbonate Petri dishes, sealed and immediately frozen at −20 °C; this temperature was maintained during all stages of transportation to Italy and storage.
2.2. Apparatus and Reagents
A Milestone ETHOS One microwave laboratory unit was used for both the direct digestion of PM10 samples and for the dissolution of the solid residues. According to the concentration levels, the analyses of extracts and mineralized residuals were carried out using a sector-field inductively coupled plasma mass spectrometer (SF-ICP-MS) or an inductively coupled plasma optical emission spectrometer (ICP-OES), as reported in the previous work [21]. For all the elements analysed in PM10 samples and in the samples obtained by applying the sequential extraction (Fraction I and II), the adopted operating conditions, experimentally determined limits of detection (LOD) and sample blanks (SB) are reported in Supplementary Tables S1 and S2, respectively. LOD values represent the analyte concentration corresponding to three times the standard deviation of the reagent blank. Sample blanks were prepared similarly to the samples, both by directly digesting and applying the sequential extraction procedure to some blank filters which had undergone the transport to and from the sampling site; SB concentrations were subtracted from sample concentrations, in order to eliminate the filter, travel, and storage contributions.
The nitric acid used both for the preparation of the extracting solution and for the microwave digestion was further purified by sub-boiling (s.b.) distillation in a quartz apparatus, from a 65% analytical grade solution. For the digestion of samples, ultrapure (u.p.) hydrogen peroxide (30%) was also used. Water was purified in a Milli-Q system, resulting in high purity water (HPW) with a resistivity of 18 MΩ∙cm. Appropriate standard solutions were prepared from concentrated (1000 mg L−1) single element solutions (Merck Millipore, Darmstadt, Germany).
2.3. Direct Digestion of PM10 Samples
For the direct digestion of samples, one quarter of each filter was used. The microwave-assisted digestion was performed in 30 mL tetrafluoromethoxyl vessels, which were then inserted into 100 mL tetrafluoromethoxyl vessels, according to the so-called “vessel-inside-vessel technology” [23]. The digestion mixture was composed of 2 mL s.b. HNO3 and 0.5 mL u.p. H2O2, according to the standard method for the measurement of Pb, Cd, As and Ni in the PM10 fraction of suspended particulate matter (UNI EN 14902:2005), while a mixture of 10 mL HPW and 1 mL analytical grade H2O2 was introduced in the bigger vessel. The temperature was ramped to 220 °C within 20 min and then kept constant at 220 °C for 20 min. After the digestion, the obtained solution was filtered through a Whatman Grade 5 cellulose filter (porosity 2.5 μm) to remove any insoluble particles and HPW was added up to 15 mL. Prior to digestion, the samples were left in contact with the digestion mixture for approximately 16 h, in order to ensure the complete impregnation of the filter.
All the steps of the analytical procedure (e.g., filter cuts and digestion preparation) were performed, whenever possible, under a Class-100 laminar flow hood. The reagent blanks, used for preparing the calibration standard solutions, were obtained by microwave-digesting the reagent mixture only. Calibration checks were run at frequent intervals (three times for each hour) during the analysis sequence.
2.4. Sequential Extraction of PM10 Samples
For the sequential extraction, 24 samples were selected. In this case, one half of each filter was used, and the procedure optimized in [20], and briefly described hereafter, was applied. The filter was cut into small pieces and immediately introduced into a 30 mL polycarbonate bottle, together with 10 mL of 0.032 M s.b. HNO3. The extraction was performed by stirring for 16 h at approximately 200 rpm. After the extraction, the suspension containing the insoluble fraction of the sample and the PTFE filter was vacuum-filtered through Advantec mixed cellulose ester filters. The solution (fraction I) was then acidified with 100 μL s.b. HNO3, and HPW was added up to 20 mL. The membrane filter, containing the insoluble fraction of the sample, was subsequently cut into four pieces with stainless steel scissors and microwave-digested using the vessel-inside-vessel technology [23] for obtaining fraction II. The digestion mixture was composed of 2 mL s.b. HNO3 and 0.5 mL u.p. H2O2, while a mixture of 10 mL HPW and 1 mL analytical grade H2O2 was introduced into the bigger vessel. The temperature was ramped to 220 °C within 20 min, followed by a dwell time of another 20 min. The obtained solution (fraction II) was subsequently filtered and HPW was added up to 20 mL. The extraction percentages were calculated with respect to the sum of fraction I and fraction II.
All the possible steps of the sequential extraction procedure were performed in a clean environment under a Class-100 laminar flow bench-hood, to avoid any possible contamination.
2.5. Data Analysis
For the graphical representation of the seasonal concentration trends, normalized values were used in order to eliminate the differences in concentration levels between elements. For this aim, all the concentration values were divided by the concentration of the first sample of the campaign [24]. In this way, the normalized value for each element in the first sample of the campaign (28 February) was always equal to 1.
Crustal and marine enrichment factors (CEFs and MEFs, respectively) were calculated as explained in [8], using Al and Na as reference elements [25,26]. The upper crust concentration reported by Wedepohl [27] and the average sea composition reported by Goldberg [28] were used for the purpose.
The datasets obtained by direct digestion and by sequential extraction of the PM10 samples were autoscaled and processed by Hierarchical Cluster Analysis (HCA) and Principal Component Analysis (PCA) using XlStat 2017 software package, an add-on of Microsoft Excel. Information on the principles of this technique can be found elsewhere [29,30,31].
2.6. HYSPLIT Back-Trajectories
Air mass back-trajectories were calculated using the NOAA HYSPLIT 4 transport model [32,33] and the GDAS meteorological data supplied by ARL (Air Resources Laboratory, College Park, MD, USA, http://ready.arl.noaa.gov, accessed on 22 July 2021). The back-trajectory starting point was the Gruvebadet laboratory (78.92° N, 11.89° E, 0.0 m AGL); the propagation time was 120 h and a new back-trajectory started every 6 h.
3. Results and Discussion
3.1. Direct Digestion of PM10 Samples
Table 1 reports the descriptive statistics of the element concentrations obtained from the direct digestion of all PM10 samples collected in 2015 while element concentrations (mean and standard deviation) in each PM10 sample are shown in Supplementary Tables S3 and S4; for converting the LOD from µg/L (or ng/L) to pg/m3 (or fg/m3), the actual solution volume and air volume of each sample were used and median and percentiles were calculated considering values below the LOD as equal to it.

Table 1.
Descriptive statistics of the element concentrations obtained from the direct digestion of all PM10 samples collected in 2015. All the values are expressed in pg/m3 except Al, Ca, Fe, K, Mg and Na, which are expressed in ng/m3.
As expected for Arctic PM10 samples, the concentrations were quite low, except for Al, Ca, Fe, K, Mg and Na, which generally have a natural origin. However, as it can be seen from the 5th and 95th percentiles, the concentrations exhibit a large variability throughout the sampling campaign. The elements having the lowest concentrations were Cd, Co and Sb. Cd showed a few concentration values below the LOD, precisely equal to 21% of the total, in the summer and early autumn. The other elements with concentrations below the LOD were Ti (for two samples) and Co, K and Zn (for one sample). The PM10 concentrations found in this campaign were comparable with the values determined during the previous Arctic spring-summer sampling campaigns carried out at Gruvebadet research station [8,9].
For trying to obtain a first subdivision of elements according to their sources, CEFs and MEFs were used. In this way, it was possible to identify elements prevalently having crustal (CEF < 10, MEF > 10), marine (MEF < 10, CEF > 10) or anthropogenic (CEF > 10, MEF > 10) origin [26,34,35]. The box plots of calculated CEFs and MEFs for all PM10 samples collected in 2015 are shown in Figure 1. From the graphs, it is possible to see that Ba, Co, Fe, Mn, Ti and V prevalently have a crustal origin, while Ca, K and Mg prevalently have a marine origin. Consequently, it is possible to infer an anthropogenic origin for all the other elements, i.e., As, Cd, Cr, Cu, Ni, Pb, Sb and Zn. However, it should be noted that some analytes prevalently deriving from crustal sources might also have, in some specific samples, an anthropogenic origin. This is evidenced in Figure 1a by the outliers of the box plots, which are sometimes quite higher than most of the other values.
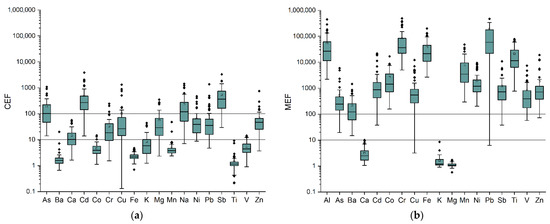
Figure 1.
Box plots showing (a) crustal and (b) marine enrichment factors calculated for all PM10 samples collected in 2015.
For gaining better insights into the sources of the analysed elements, HCA was performed taking into account the results of the direct digestion of all PM10 samples collected in 2015. The dendrogram in Figure 2 reveals the presence of four main clusters. Two of them can be attributed to natural sources (i.e., Ca, K, Mg and Na to a marine source and Al, Ba, Co, Fe, Mn, Ti and V to a crustal source), and perfectly meet the results obtained from the enrichment factor calculation. Furthermore, the analytes prevalently having a non-natural origin form two distinct clusters: one composed by Cr and Ni only, and one composed by As, Cd, Pb, Sb, Zn and, at a higher level of dissimilarity, Cu. Therefore, it is possible to hypothesize two distinct sources for these two groups of elements. The latter cluster is mainly composed of analytes generally attributed to mid-latitude anthropogenic sources, hence deriving from long-range transport processes from North America or Russia [8,36]. Conversely, Cr and Ni can be attributed to air masses coming from southwest Greenland, an area where early rock minerals are particularly rich in these elements [5,37]. In fact, at a higher level of dissimilarity, Cr and Ni belong to the same cluster of the elements prevalently having a crustal origin, and this might confirm this hypothesis.
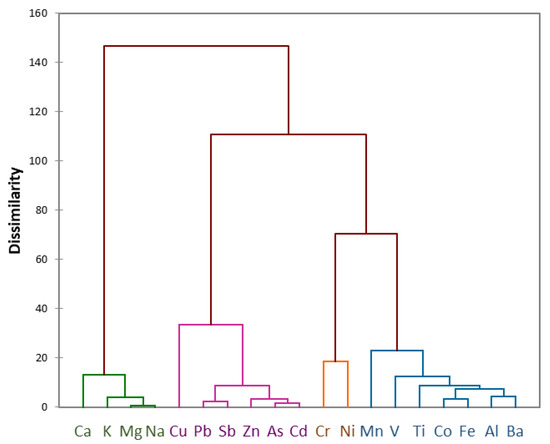
Figure 2.
Dendrogram obtained by HCA on the results of the direct digestion of all PM10 samples collected in 2015.
Figure 3a–d shows the seasonal trends registered for the four clusters of elements emerged from HCA. In all cases, a strong correlation can be seen, as expected, for elements having a common origin. Two marked concentration peaks were registered in March and April for prevalently anthropogenic elements, thus confirming their probable mid-latitude origin (Figure 3a). Indeed, the phenomenon known as “Arctic haze”, involving the long-range transport of air masses from mid-latitudes to the Arctic, is recognised to be particularly strong in winter and early spring [38,39,40]. As expected, the HYSPLIT back-trajectories calculated for the two spring samples (Figure 4a,b) having high concentrations, show that the air masses travelled long-distances before reaching Svalbard. In the first case, the air masses mainly came from Russia and North America (Greenland and Canada), but they also shortly travelled on a small part of Northern Europe lands. In the second case, a marked contribution from Russia is evident, but some back-trajectories still came from Greenland.
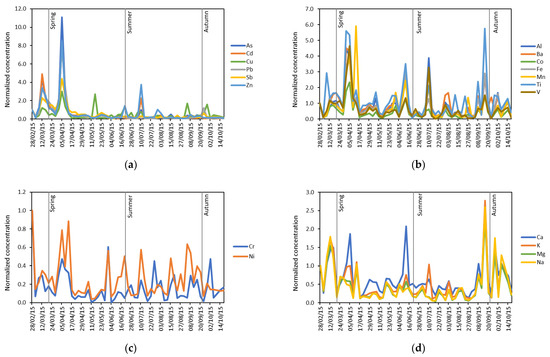
Figure 3.
Seasonal trends registered for the four clusters of elements emerged from HCA: (a) As, Cd, Cu, Pb, Sb, Zn; (b) Al, Ba, Co, Fe, Mn, Ti, V; (c) Cr, Ni; (d) Ca, K, Mg, Na.
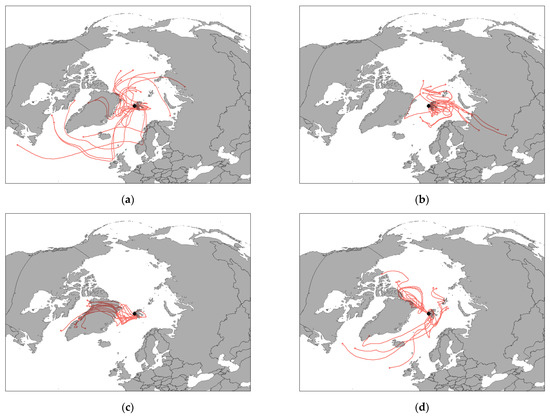
Figure 4.
HYSPLIT back-trajectories calculated for two samples collected in spring: (a) 12 March, (b) 5 April; and for two samples collected in autumn: (c) 16 September and (d) 28 September.
The marked peaks registered for anthropogenic elements are also present in Figure 3b–d, indicating that the air masses deriving from mid-latitudes, passing over great areas of land and ocean, become also enriched of both crustal and marine elements. However, the concentrations of crustal elements in Figure 3b display some more peaks in late spring and summer, which generally coincide with the ones in Figure 3c. Therefore, it is possible to hypothesize that the trends registered for crustal elements are the result of two different sources, i.e., Arctic haze long-range transport (in early spring) and erosion of enriched soils of southwest Greenland. This hypothesis is coherent with the calculated HYSPLIT back-trajectories, even though, in Figure 4b, a propagation time of 5 days is not sufficient for verifying if the air masses travelled over Greenland. However, the propagation time of the HYSPLIT back-trajectories cannot exceed 5 days, since after that period, the uncertainty of the model becomes too high. Finally, the concentrations of marine elements (Figure 3d) and partially those of crustal elements (Figure 3b) and of Cr and Ni (Figure 3c) show higher values in the samples collected in September-early October: this trend indicates again a greater contribution of aerosol coming from Greenland, confirmed by the calculated HYSPLIT back-trajectories for 16 September sample (Figure 4c), but also of local sources (marine spray and resuspension of the local soil), to the composition of PM10 in this period (Figure 4d). This behaviour could depend on a greater ice-free sea and ground surface, which determines a greater contribution of local sources to the Arctic atmospheric aerosol.
3.2. Sequential Extraction of PM10 Samples
The results of the sequential extractions, expressed in percentages, are reported in Supplementary Table S5 and shown in Figure 5. The outcomes are generally coherent with the prevalent source of each analyte identified by means of CEFs and MEFs. Indeed, prevalently marine analytes (namely Ca, K, Mg and Na), which are generally present in the airborne particles in the form of soluble salts, were mostly present in fraction I (Figure 5a–d). Similarly, the analytes prevalently having an anthropogenic origin (namely As, Cd, Cu, Pb, Sb and Zn), which are generally weakly bound to the particles, were mainly extracted in fraction I (Figure 5e–j). Conversely, prevalently crustal analytes (namely Al, Ba, Co, Fe, Mn, Ti and V), which are generally strongly bound to the mineral structure of the particles, were mostly present in fraction II (Figure 5k–q). With regard to Cr and Ni, the hypothesis made in Paragraph 3.1 seems to be confirmed: regardless their high CEFs and MEFs, these analytes were not easily extractable, as expected for elements mainly having a crustal origin (Figure 5r,s). Moreover, it is noteworthy to observe that when the concentration of both crustal and marine and anthropogenic elements increases, their more labile fraction (fraction I) increases to a greater extent than the residual one (fraction II). This is evident, for example, for the 28 September sample in which the concentrations of crustal and marine elements increase and their percentage extracted in fraction I also increases. This insight is very useful to better understand the transport, deposition and bioaccumulation processes of some elements, such as Fe, Mn, Ni, Pb and Zn. Indeed, it is essential to know their solubility, reactivity, and availability in the atmospheric aerosol to evaluate their behaviour at air/ocean/ice interfaces and the application of this two-step fractionation procedure, specifically developed and optimized for Arctic PM10, permitted to distinguish among different forms of some important elements (e.g., Fe, Mn, Cu, etc.) having different solubility, reactivity, and releasability.
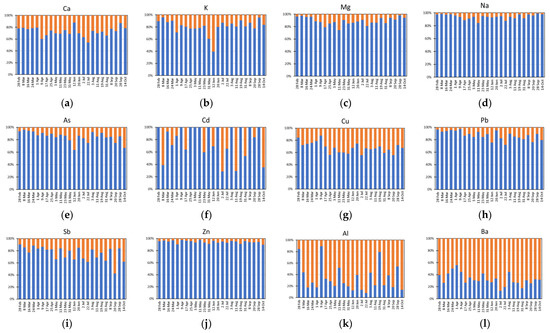
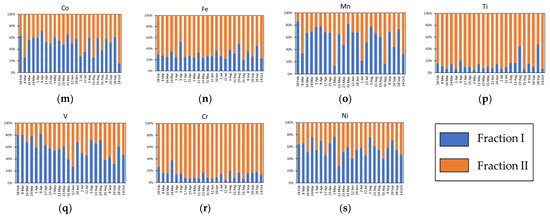
Figure 5.
Extraction percentages obtained by means of the sequential extraction procedure on analytes prevalently having different origins: (a–d) marine; (e–j) anthropogenic; (k–q) crustal; (r,s) crustal from enriched soils of southwest Greenland.
Supplementary Figure S1 shows score and loading plots obtained by means of Principal Component Analysis on the results of the sequential extraction. All analytes have positive loadings on PC1 (representing the 39.37% of the total variance), therefore this PC allows to discriminate samples according to the extractability of all elements. In particular, the analytes having the highest loadings on PC1 are all anthropogenic and crustal elements except Ti and Zn (namely Al, As, Ba, Cd, Co, Cu, Fe, Mn, Pb, Sb and V). By looking at the temporal trend of the PC1 scores shown in Figure 6, it is evident that the samples collected in late winter and early spring have positive scores, while the scores of the samples collected in late spring and early summer are mainly negative. However, in late summer and autumn there is a much higher variability since the scores are alternatively positive and negative.

Figure 6.
Temporal trend of the PC1 scores obtained by means of Principal Component Analysis on the results of the sequential extraction.
The observed temporal trend can be explained considering that, in winter and early spring, the long-range transport processes due to Arctic haze [38,39,40] strongly contribute to the Arctic airborne particulates. The air masses coming from mid-latitudes equivalently carry particles deriving from anthropogenic sources and particles deriving from rock erosion and soil resuspension of ice-free lands. The particles deriving from anthropogenic sources are generally small and can be easily transported. This causes not only an increase in the concentration of the above-mentioned analytes, but also an increase in their anthropogenic portion. Since the anthropogenic portion of each element is generally easily extractable [16,17], this also implies an increase of the extractability of these elements.
In contrast, only the smallest of the crustal particles can undergo such a long-range transport, thus causing a sort of size selection [3]. Considering that in winter and early spring the soil near to Ny-Ålesund is still completely covered by snow, the only crustal particles able to reach the sampling point in that season are the small particles travelling from mid-latitudes. This might easily explain the higher extractability of crustal elements in the samples collected at the beginning of the sampling campaign.
4. Conclusions
In this study, the source identification potential of a two-step sequential extraction procedure was evaluated and compared with the direct digestion of samples. For this purpose, the elemental composition of selected Arctic PM10 samples collected in Ny-Ålesund (Svalbard Islands) in 2015 was investigated. The multivariate analysis of the results obtained in this study, with the support of back-trajectory analyses, allowed to identify four main PM10 sources, namely marine, anthropogenic, crustal and Cr and Ni enriched-crustal, probably deriving from erosion of enriched soils of southwest Greenland. Moreover, a strong seasonal variation due to Arctic haze was evident. Even though the direct digestion of samples allowed a first source identification through CEFs and MEFs, the sequential extraction procedure provided a deeper comprehension of the specific sources and the transport processes of PM from mid-latitudes. Indeed, it was possible to establish that most of the elements prevalently having an anthropogenic origin (As, Cd, Cu, Pb, Sb and Zn) were also less strongly bound to the particulate matter structure and, therefore, generally more easily releasable onto the Arctic snowpack. Moreover, in the samples collected in late winter and early spring, even the elements prevalently having a crustal origin were more easily extractable, probably due to the particle size selection occurred during the long-range transport. Finally, it was evident that the fraction more weakly bound to the atmospheric particulate solid phases (fraction I) increased when increasing concentrations of the elements were observed. As a whole, this study made it possible to understand that the soluble fraction of the elements present in the Arctic atmospheric particulate is generally high, and greater in the late winter and early spring than in other seasons; it is, therefore, evident that the application of a two-step sequential extraction procedure to Arctic PM samples can be a valid tool to better understand the complex phenomena occurring in the Arctic atmosphere and at air/snow/ocean interfaces.
Supplementary Materials
The following are available online at https://www.mdpi.com/article/10.3390/atmos12091152/s1, Table S1: Experimental conditions, limits of detection (LOD) and sample blanks (SB) of the analytes of interest with the technique used for their determination after direct digestion, Table S2: Experimental conditions, limits of detection (LOD) and sample blanks (SB) of the analytes of interest with the technique used for their determination in fraction I and fraction II, Table S3: Major element concentrations in Arctic PM10 samples collected in 2015. All the values are expressed in ng/m3, Table S4: Minor and trace element concentrations in Arctic PM10 samples collected in 2015. All the values are expressed in pg/m3, Table S5: Extraction percentages obtained for fraction I on the samples subjected to sequential extraction, Figure S1: Principal Component Analysis performed on the results of the sequential extraction: (a) score and (b) loading plot.
Author Contributions
Conceptualization, M.M. and R.T.; methodology, E.C., F.A. and M.M.; validation, E.C.; formal analysis, E.C.; investigation, E.C. and A.G. (Annapaola Giordano); resources, M.M., A.G. (Agnese Giacomino) and O.A.; data curation, E.C. and A.G. (Annapaola Giordano); writing—original draft preparation, E.C.; writing—review and editing, M.M., A.G. (Agnese Giacomino), P.I., F.A. and O.A.; visualization, E.C.; supervision, M.M.; project administration, M.M.; funding acquisition, M.M., R.T., A.G. (Agnese Giacomino) and O.A. All authors have read and agreed to the published version of the manuscript.
Funding
This research was funded by the Italian Ministry of Education, University and Research (PRIN no. 2007L8Y4NB_002 and no. 20092C7KRC_002).
Institutional Review Board Statement
Not applicable.
Informed Consent Statement
Not applicable.
Acknowledgments
The authors thank CNR and its local staff for the logistic support that allowed the realization of the experimental activity and Mauro Mazzola of CNR-ISP for providing the HYSPLIT outputs used in this study.
Conflicts of Interest
The authors declare no conflict of interest. The funders had no role in the design of the study; in the collection, analyses, or interpretation of data; in the writing of the manuscript, or in the decision to publish the results.
References
- Serreze, M.C.; Barry, R.G. Processes and impacts of Arctic amplification: A research synthesis. Glob. Planet. Chang. 2011, 77, 85–96. [Google Scholar] [CrossRef]
- Maturilli, M.; Hanssen-Bauer, I.; Neuber, R.; Rex, M.; Edvardsen, K. The Atmosphere Above Ny-Ålesund: Climate and Global Warming, Ozone and Surface UV Radiation. In The Ecosystem of Kongsfjorden, Svalbard; Springer: Cham, Switzerland, 2019; pp. 23–46. ISBN 978-3-319-46425-1. [Google Scholar]
- Giardi, F.; Traversi, R.; Becagli, S.; Severi, M.; Caiazzo, L.; Ancillotti, C.; Udisti, R. Determination of Rare Earth Elements in multi-year high-resolution Arctic aerosol record by double focusing Inductively Coupled Plasma Mass Spectrometry with desolvation nebulizer inlet system. Sci. Total Environ. 2018, 613–614, 1284–1294. [Google Scholar] [CrossRef] [PubMed]
- Cappelletti, D.; Azzolini, R.; Langone, L.; Ventura, S.; Viola, A.; Aliani, S.; Vitale, V.; Brugnoli, E. Environmental changes in the Arctic: An Italian perspective. Rend. Fis. Acc. Lincei 2016, 27, S1–S6. [Google Scholar] [CrossRef]
- Becagli, S.; Caiazzo, L.; Di Iorio, T.; di Sarra, A.; Meloni, D.; Muscari, G.; Pace, G.; Severi, M.; Traversi, R. New insights on metals in the Arctic aerosol in a climate changing world. Sci. Total Environ. 2020, 741, 1–9. [Google Scholar] [CrossRef]
- Barbaro, E.; Zangrando, R.; Kirchgeorg, T.; Bazzano, A.; Illuminati, S.; Annibaldi, A.; Rella, S.; Truzzi, C.; Grotti, M.; Ceccarini, A.; et al. An integrated study of the chemical composition of Antarctic aerosol to investigate natural and anthropogenic sources. Environ. Chem. 2016, 13, 867–876. [Google Scholar] [CrossRef] [Green Version]
- Bazzano, A.; Soggia, F.; Grotti, M. Source identification of atmospheric particle-bound metals at Terra Nova Bay, Antarctica. Environ. Chem. 2015, 12, 245–252. [Google Scholar] [CrossRef]
- Conca, E.; Abollino, O.; Giacomino, A.; Buoso, S.; Traversi, R.; Becagli, S.; Grotti, M.; Malandrino, M. Source identification and temporal evolution of trace elements in PM10 collected near to Ny-Ålesund (Norwegian Arctic). Atmos. Environ. 2019, 203, 153–165. [Google Scholar] [CrossRef]
- Bazzano, A.; Ardini, F.; Grotti, M.; Malandrino, M.; Giacomino, A.; Abollino, O.; Cappelletti, D.; Becagli, S.; Traversi, R.; Udisti, R. Elemental and lead isotopic composition of atmospheric particulate measured in the Arctic region (Ny-Ålesund, Svalbard Islands). Rend. Lincei Sci. Fis. Nat. 2016, 27, S73–S84. [Google Scholar] [CrossRef]
- Annibaldi, A.; Truzzi, C.; Illuminati, S.; Bassotti, E.; Scarponi, G. Determination of water-soluble and insoluble (dilute-HCl-extractable) fractions of Cd, Pb and Cu in Antarctic aerosol by square wave anodic stripping voltammetry: Distribution and summer seasonal evolution at Terra Nova Bay (Victoria Land). Anal. Bioanal. Chem. 2007, 387, 977–998. [Google Scholar] [CrossRef]
- Canepari, S.; Perrino, C.; Olivieri, F.; Astolfi, M.L. Characterisation of the traffic sources of PM through size-segregated sampling, sequential leaching and ICP analysis. Atmos. Environ. 2008, 42, 8161–8175. [Google Scholar] [CrossRef]
- Canepari, S.; Astolfi, M.L.; Moretti, S.; Curini, R. Comparison of extracting solutions for elemental fractionation in airborne particulate matter. Talanta 2010, 82, 834–844. [Google Scholar] [CrossRef]
- Illuminati, S.; Annibaldi, A.; Truzzi, C.; Libani, G.; Mantini, C.; Scarponi, G. Determination of water-soluble, acid-extractable and inert fractions of Cd, Pb and Cu in Antarctic aerosol by square wave anodic stripping voltammetry after sequential extraction and microwave digestion. J. Electroanal. Chem. 2015, 755, 182–196. [Google Scholar] [CrossRef]
- Truzzi, C.; Annibaldi, A.; Illuminati, S.; Mantini, C.; Scarponi, G. Chemical fractionation by sequential extraction of Cd, Pb, and Cu in Antarctic atmospheric particulate for the characterization of aerosol composition, sources, and summer evolution at Terra Nova Bay, Victoria Land. Air Qual. Atmos. Health 2017, 10, 783–798. [Google Scholar] [CrossRef]
- Bacon, J.R.; Davidson, C.M. Is there a future for sequential chemical extraction? Analyst 2008, 133, 25–46. [Google Scholar] [CrossRef]
- Kyotani, T.; Iwatsuki, M. Characterization of soluble and insoluble components in PM2.5 and PM10 fractions of airborne particulate matter in Kofu city, Japan. Atmos. Environ. 2002, 36, 639–649. [Google Scholar] [CrossRef]
- Gouws, K.; Coetzee, P.P. Determination and partitioning of heavy metals in sediments of the Vaal Dam System by sequential extraction. Water SA 1997, 23, 217–226. [Google Scholar]
- Voutsa, D.; Samara, C. Labile and bioaccessible fractions of heavy metals in the airborne particulate matter from urban and industrial areas. Atmos. Environ. 2002, 36, 3583–3590. [Google Scholar] [CrossRef]
- Karthikeyan, S.; Joshi, U.M.; Balasubramanian, R. Microwave assisted sample preparation for determining water-soluble fraction of trace elements in urban airborne particulate matter: Evaluation of bioavailability. Anal. Chim. Acta 2006, 576, 23–30. [Google Scholar] [CrossRef]
- Limbeck, A.; Wagner, C.; Lendl, B.; Mukhtar, A. Determination of water soluble trace metals in airborne particulate matter using a dynamic extraction procedure with on-line inductively coupled plasma optical emission spectrometric detection. Anal. Chim. Acta 2012, 750, 111–119. [Google Scholar] [CrossRef]
- Conca, E.; Malandrino, M.; Giacomino, A.; Costa, E.; Ardini, F.; Inaudi, P.; Abollino, O. Optimization of a sequential extraction procedure for trace elements in Arctic PM10. Anal. Bioanal. Chem. 2020, 412, 7429–7440. [Google Scholar] [CrossRef]
- Mazzola, M.; Viola, A.; Lanconelli, C.; Vitale, V. Atmospheric observations at the Amundsen-Nobile Climate Change Tower in Ny-Ålesund, Svalbard. Rend. Lincei Sci. Fis. Nat. 2016, 27, 7–18. [Google Scholar] [CrossRef]
- Nóbrega, J.A.; Pirola, C.; Richter, R.C. Think Blank. Clean Chemistry Tools for Atomic Spectroscopy; Milestone Srl and Ikonos Srl: Sorisole, Italy, 2017. [Google Scholar]
- Conca, E.; Malandrino, M.; Giacomino, A.; Buoso, S.; Berto, S.; Verplanck, P.L.; Magi, E.; Abollino, O. Dynamics of inorganic components in lake waters from Terra Nova Bay, Antarctica. Chemosphere 2017, 183, 454–470. [Google Scholar] [CrossRef] [PubMed]
- Krnavek, L.; Simpson, W.R.; Carlson, D.; Domine, F.; Douglas, T.; Sturm, M. The chemical composition of surface snow in the Arctic: Examining marine, terrestrial, and atmospheric influences. Atmos. Environ. 2012, 50, 349–359. [Google Scholar] [CrossRef]
- Tahri, M.; Benchrif, A.; Bounakhla, M.; Benyaich, F.; Noack, Y. Seasonal variation and risk assessment of PM2.5 and PM2.5-10 in the ambient air of Kenitra, Morocco. Environ. Sci. Process. Impacts 2017, 19, 1427–1436. [Google Scholar] [CrossRef]
- Wedepohl, K.H. The composition of the continental crust. Geochim. Cosmochim. Acta 1995, 59, 1217–1232. [Google Scholar] [CrossRef]
- Goldberg, E.D. Chapter 5: Minor elements in sea water. In Chemical Oceanography; Riley, J.P., Skirrow, G., Eds.; Academic Press: London, UK, 1965; pp. 163–196. [Google Scholar]
- Einax, W.; Zwanziger, H.W.; Gei, S. Chemometrics in Environmental Analysis; Wiley-VHC: Weinhem, Germany, 1997. [Google Scholar]
- Massart, D.L.; Vandenginste, B.G.M.; Buydens, L.M.C.; De Jono, S.; Leqi, P.J.; Smeyers-Verbeke, J. Handbook of Chemometrics and Qualimetrics, Parts A and B; Elsevier: Amsterdam, The Netherlands, 1997. [Google Scholar]
- Ruxton, G.D.; Beauchamp, G. Some suggestions about appropriate use of the Kruskal-Wallis test. Anim. Behav. 2008, 76, 1083–1087. [Google Scholar] [CrossRef]
- Draxler, R.R.; Rolph, G.D. HYSPLIT (HYbrid Single-Particle Lagrangian Integrated Trajectory) Model Access via NOAA ARL READY. Available online: http://ready.arl.noaa.gov/HYSPLIT.php (accessed on 22 July 2021).
- Stein, A.F.; Draxler, R.R.; Rolph, G.D.; Stunder, B.J.B.; Cohen, M.D.; Ngan, F. NOAA’s HYSPLIT atmospheric transport and dispersion modeling system. Bull. Am. Meteorol. Soc. 2015, 96, 2059–2077. [Google Scholar] [CrossRef]
- Lai, A.M.; Shafer, M.M.; Dibb, J.E.; Polashenski, C.M.; Schauer, J.J. Elements and inorganic ions as source tracers in recent Greenland snow. Atmos. Environ. 2017, 164, 205–215. [Google Scholar] [CrossRef]
- Zajusz-Zubek, E.; Radko, T.; Mainka, A. Fractionation of trace elements and human health risk of submicron particulate matter (PM1) collected in the surroundings of coking plants. Environ. Monit. Assess. 2017, 189, 389. [Google Scholar] [CrossRef] [PubMed] [Green Version]
- Moroni, B.; Cappelletti, D.; Ferrero, L.; Crocchianti, S.; Busetto, M.; Mazzola, M.; Becagli, S.; Traversi, R.; Udisti, R. Local vs long-range sources of aerosol particles upon Ny-Ålesund (Svalbard Islands): Mineral chemistry and geochemical records. Rend. Lincei Sci. Fis. Nat. 2016, 27, S115–S127. [Google Scholar] [CrossRef]
- Wager, L.R.; Mitchell, R.L. The distribution of trace elements during strong fractionation of basic magma—A further study of the Skaergaard intrusion, East Greenland. Geochim. Cosmochim. Acta 1951, 1, 129–208. [Google Scholar] [CrossRef]
- Lupi, A.; Busetto, M.; Becagli, S.; Giardi, F.; Lanconelli, C.; Mazzola, M.; Udisti, R.; Hansson, H.C.; Henning, T.; Petkov, B.; et al. Multi-seasonal ultrafine aerosol particle number concentration measurements at the Gruvebadet observatory, Ny-Ålesund, Svalbard Islands. Rend. Lincei Sci. Fis. Nat. 2016, 27, S59–S71. [Google Scholar] [CrossRef]
- Udisti, R.; Bazzano, A.; Becagli, S.; Bolzacchini, E.; Caiazzo, L.; Cappelletti, D.; Ferrero, L.; Frosini, D.; Giardi, F.; Grotti, M.; et al. Sulfate source apportionment in the Ny-Ålesund (Svalbard Islands) Arctic aerosol. Rend. Lincei Sci. Fis. Nat. 2016, 27, S85–S94. [Google Scholar] [CrossRef]
- Quinn, P.K.; Shaw, G.E.; Andrews, E.; Dutton, E.G.; Ruoho-Airola, T.; Gong, S.L. Arctic haze: Current trends and knowledge gaps. Tellus B 2007, 59, 99–114. [Google Scholar] [CrossRef] [Green Version]
Publisher’s Note: MDPI stays neutral with regard to jurisdictional claims in published maps and institutional affiliations. |
© 2021 by the authors. Licensee MDPI, Basel, Switzerland. This article is an open access article distributed under the terms and conditions of the Creative Commons Attribution (CC BY) license (https://creativecommons.org/licenses/by/4.0/).