
Bioclimatic Conditions of June 2019 in Poland on a Multi-Year Background (1966–2019)


Abstract
:1. Introduction
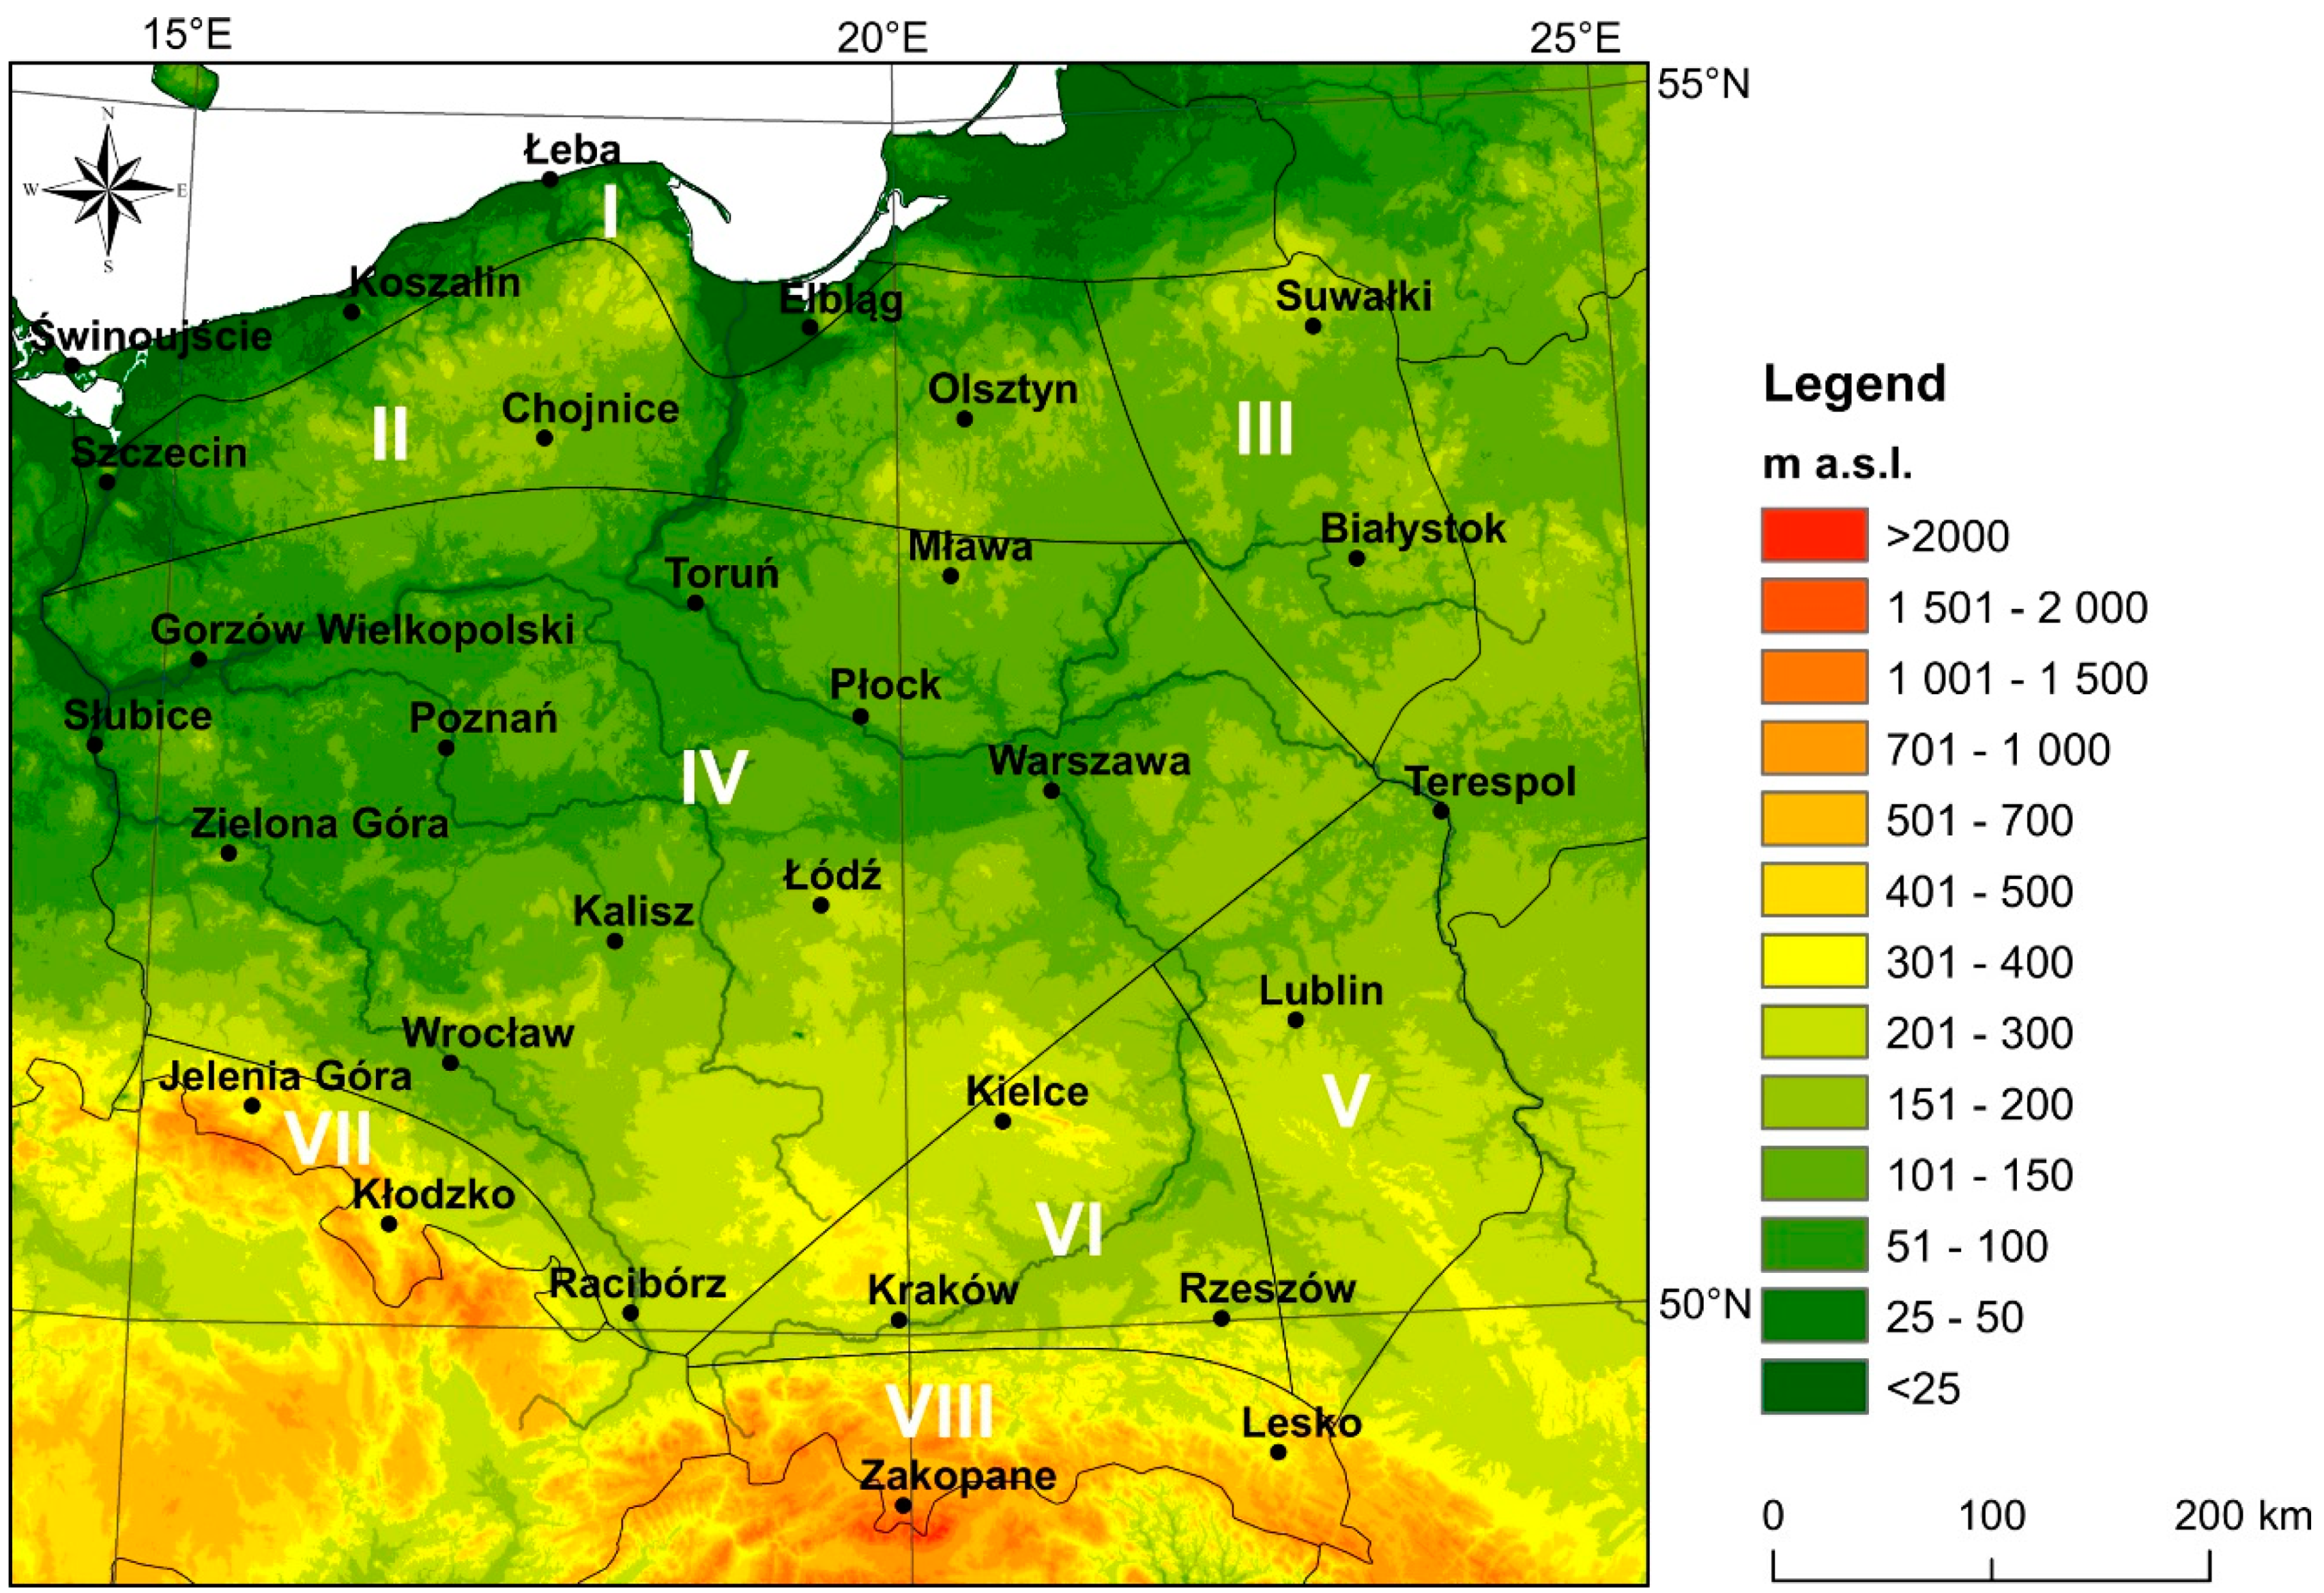
2. Data and Methods
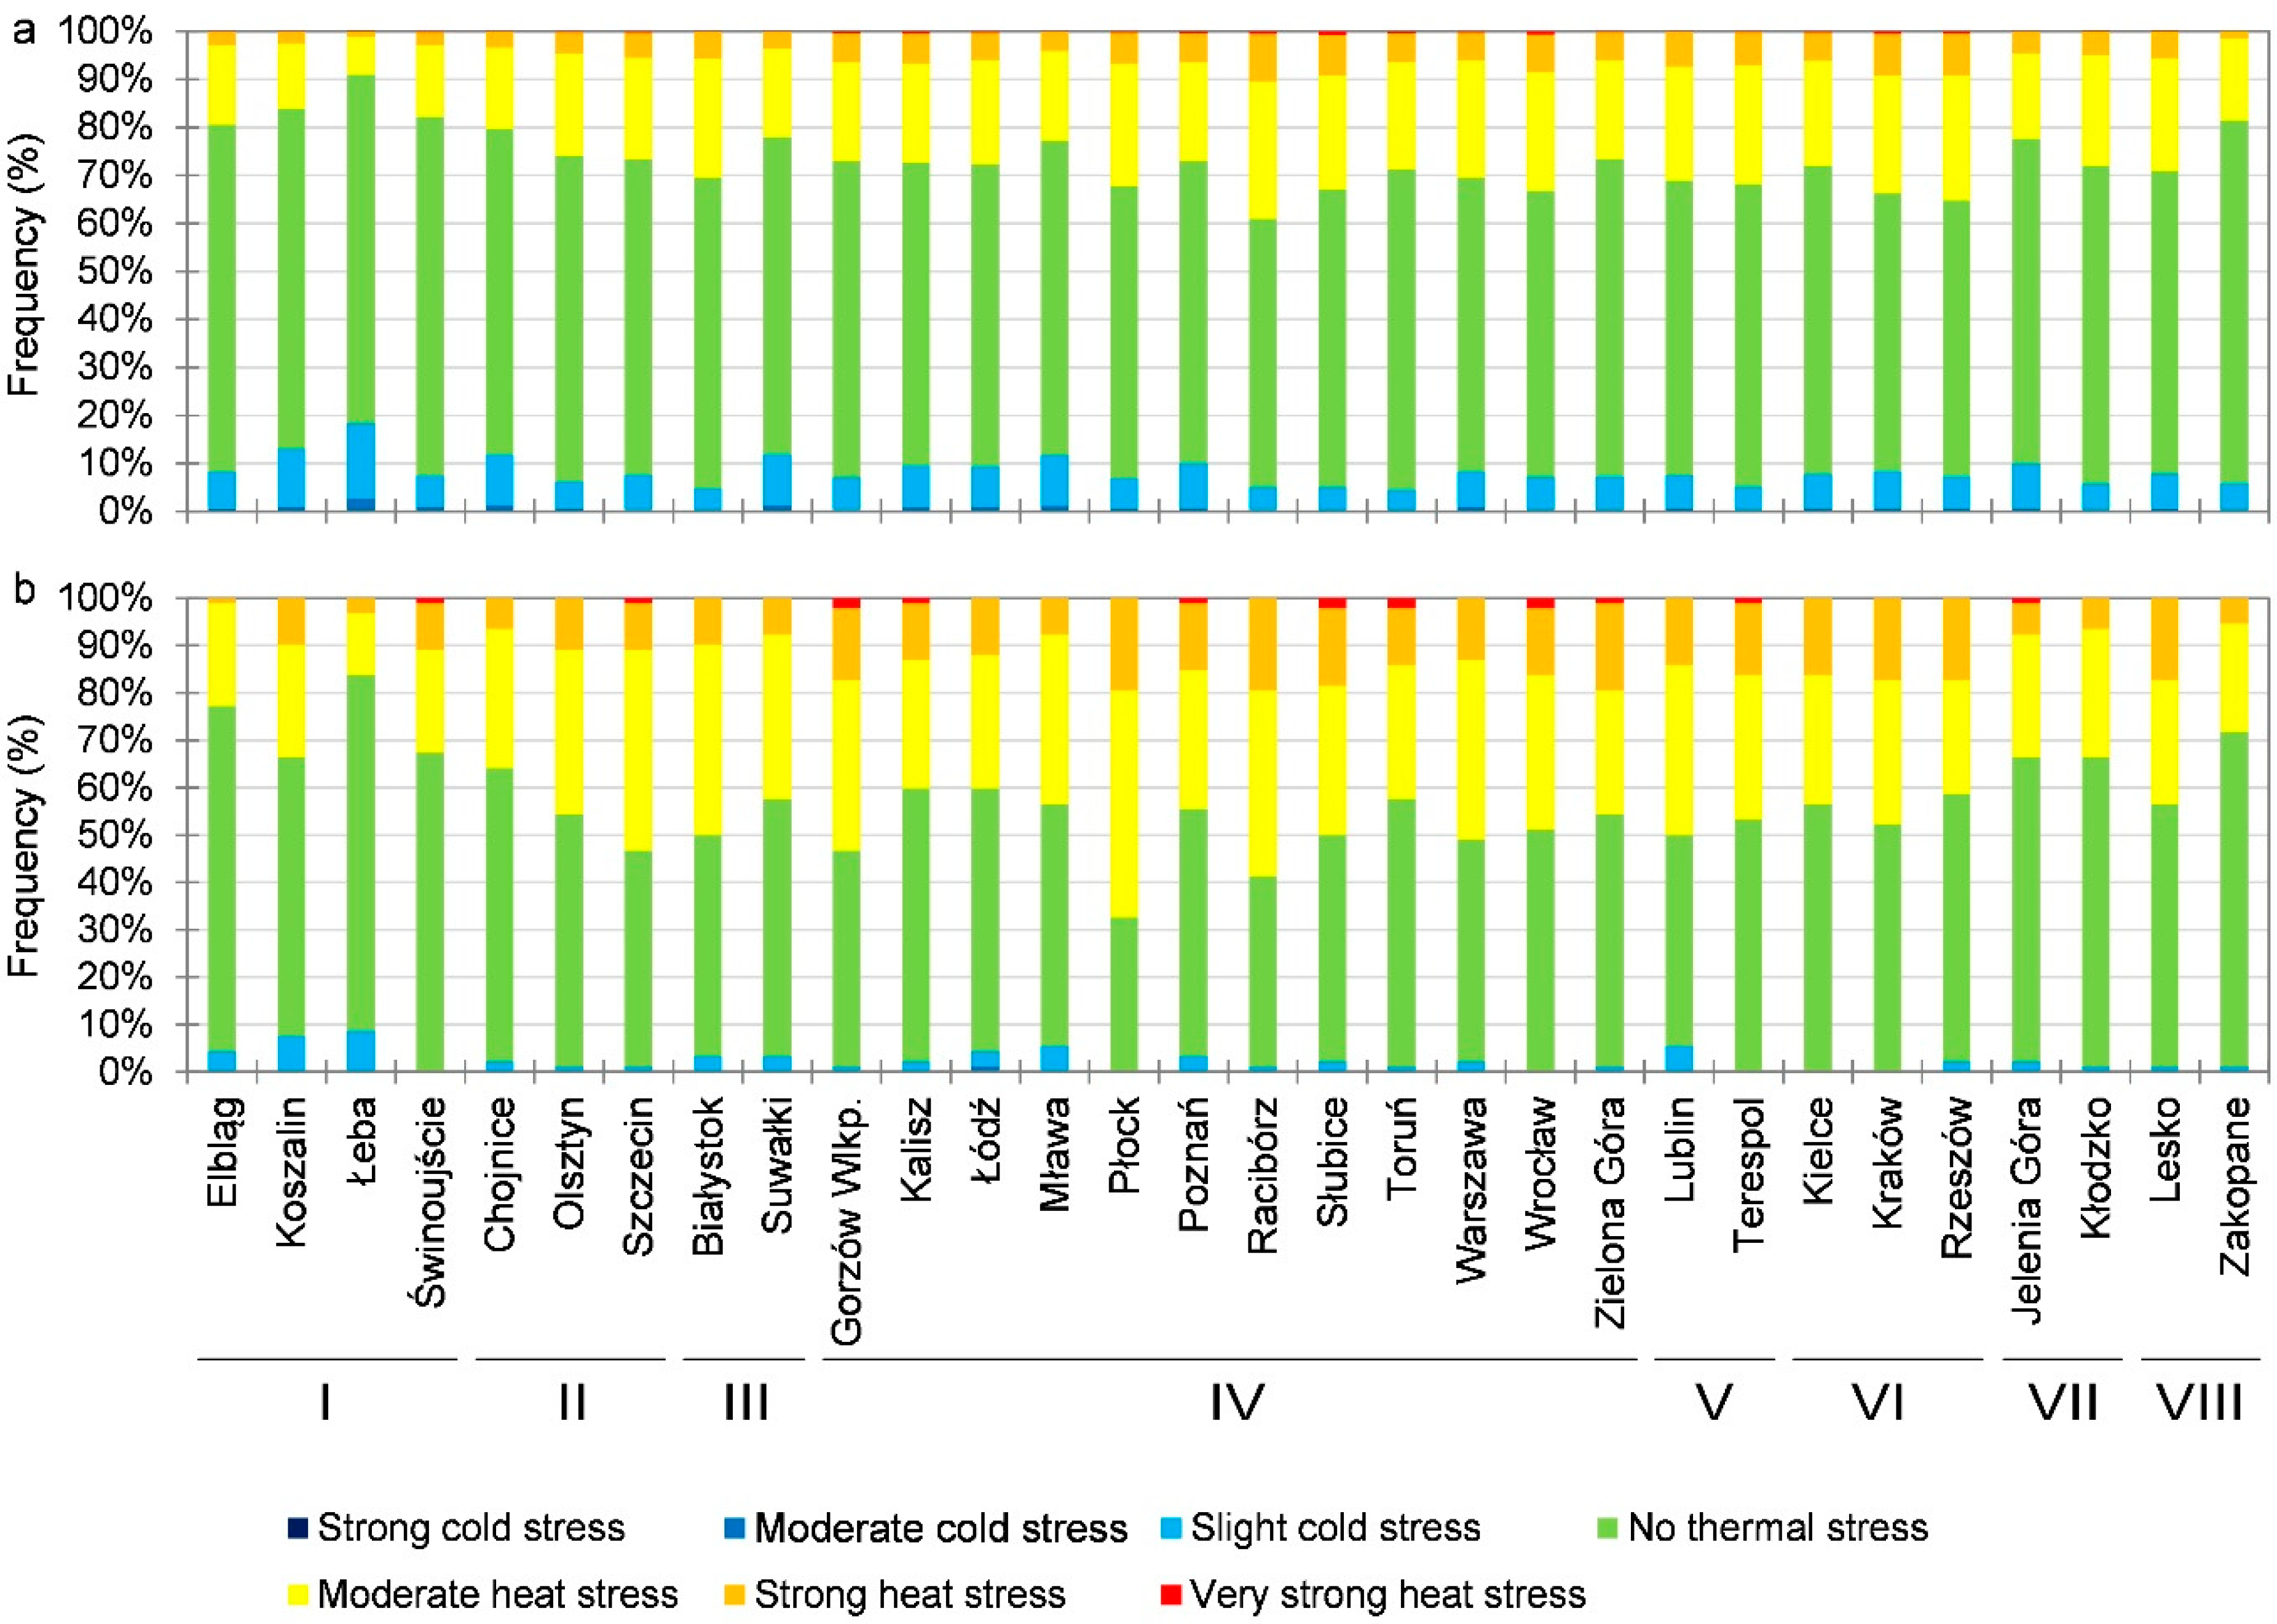
3. Results
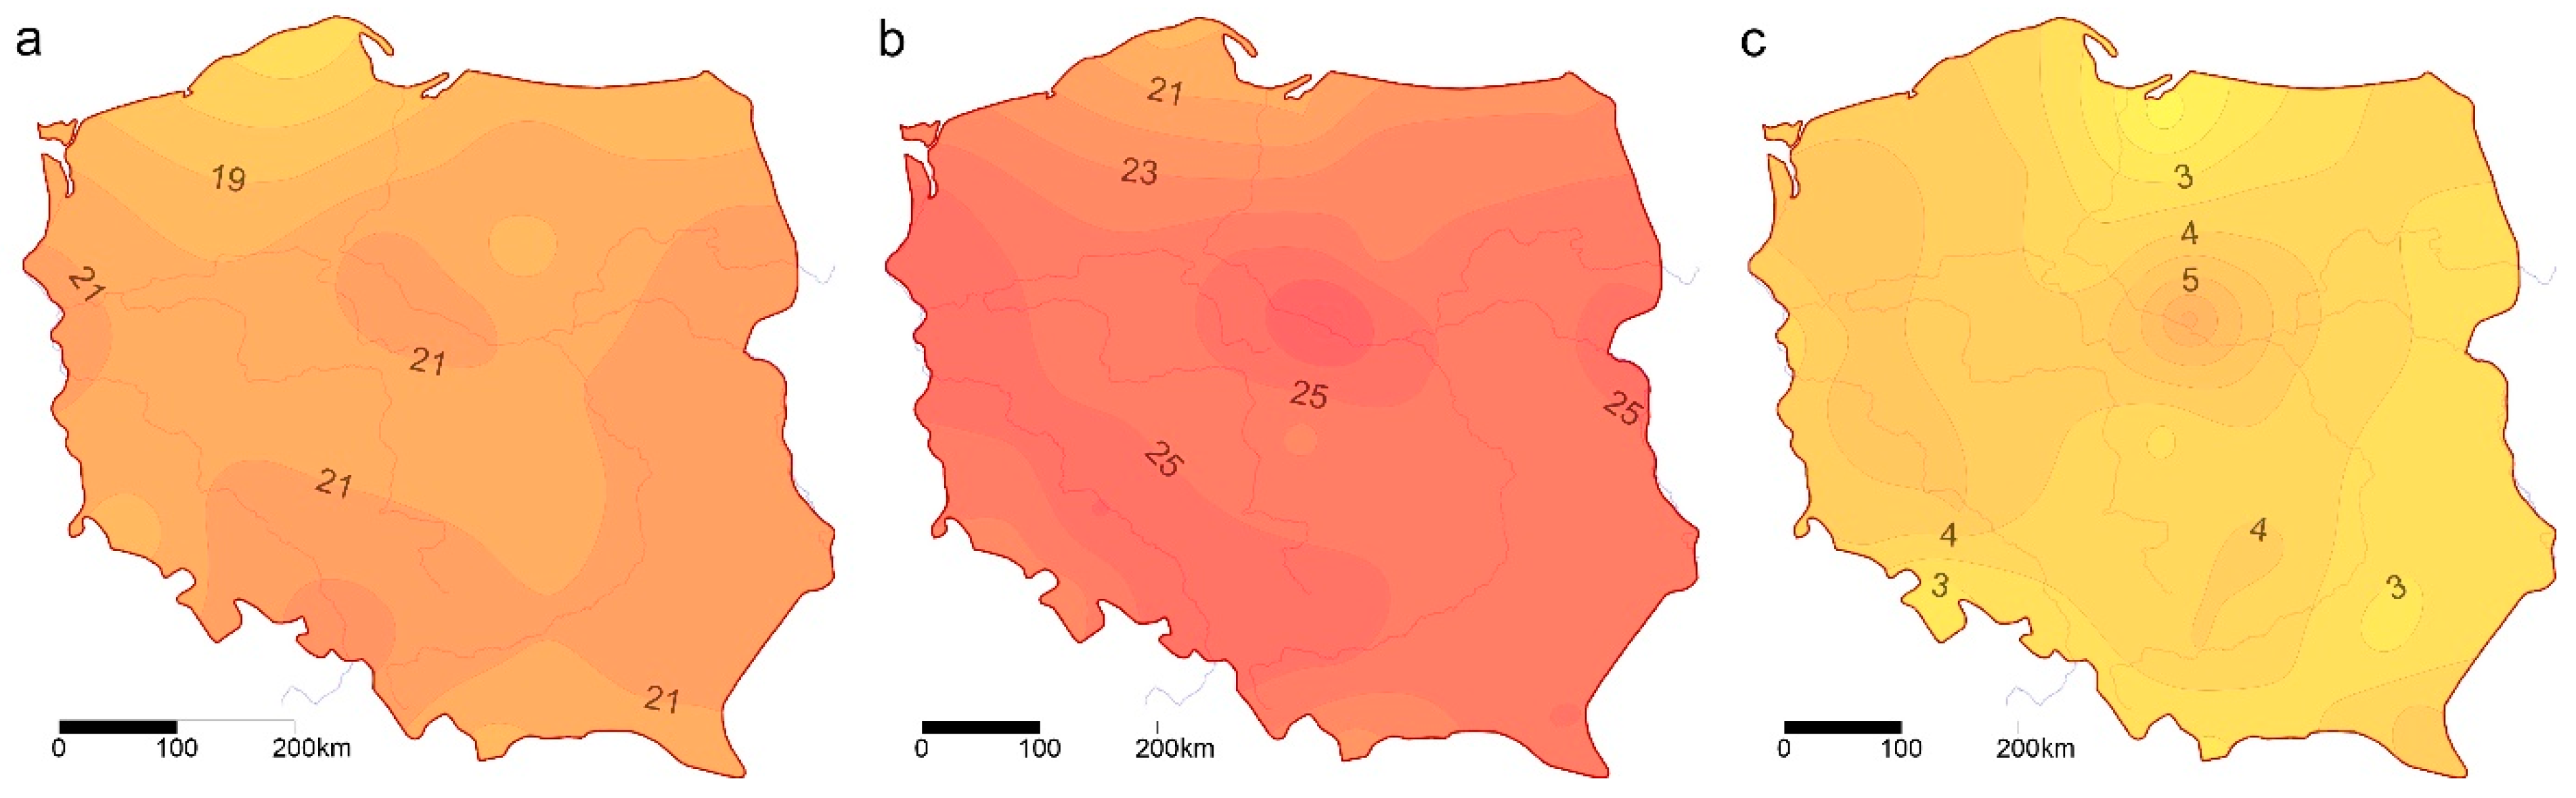
3.1. UTCI in the Summer Season in the Years 1966–2019 and 2019
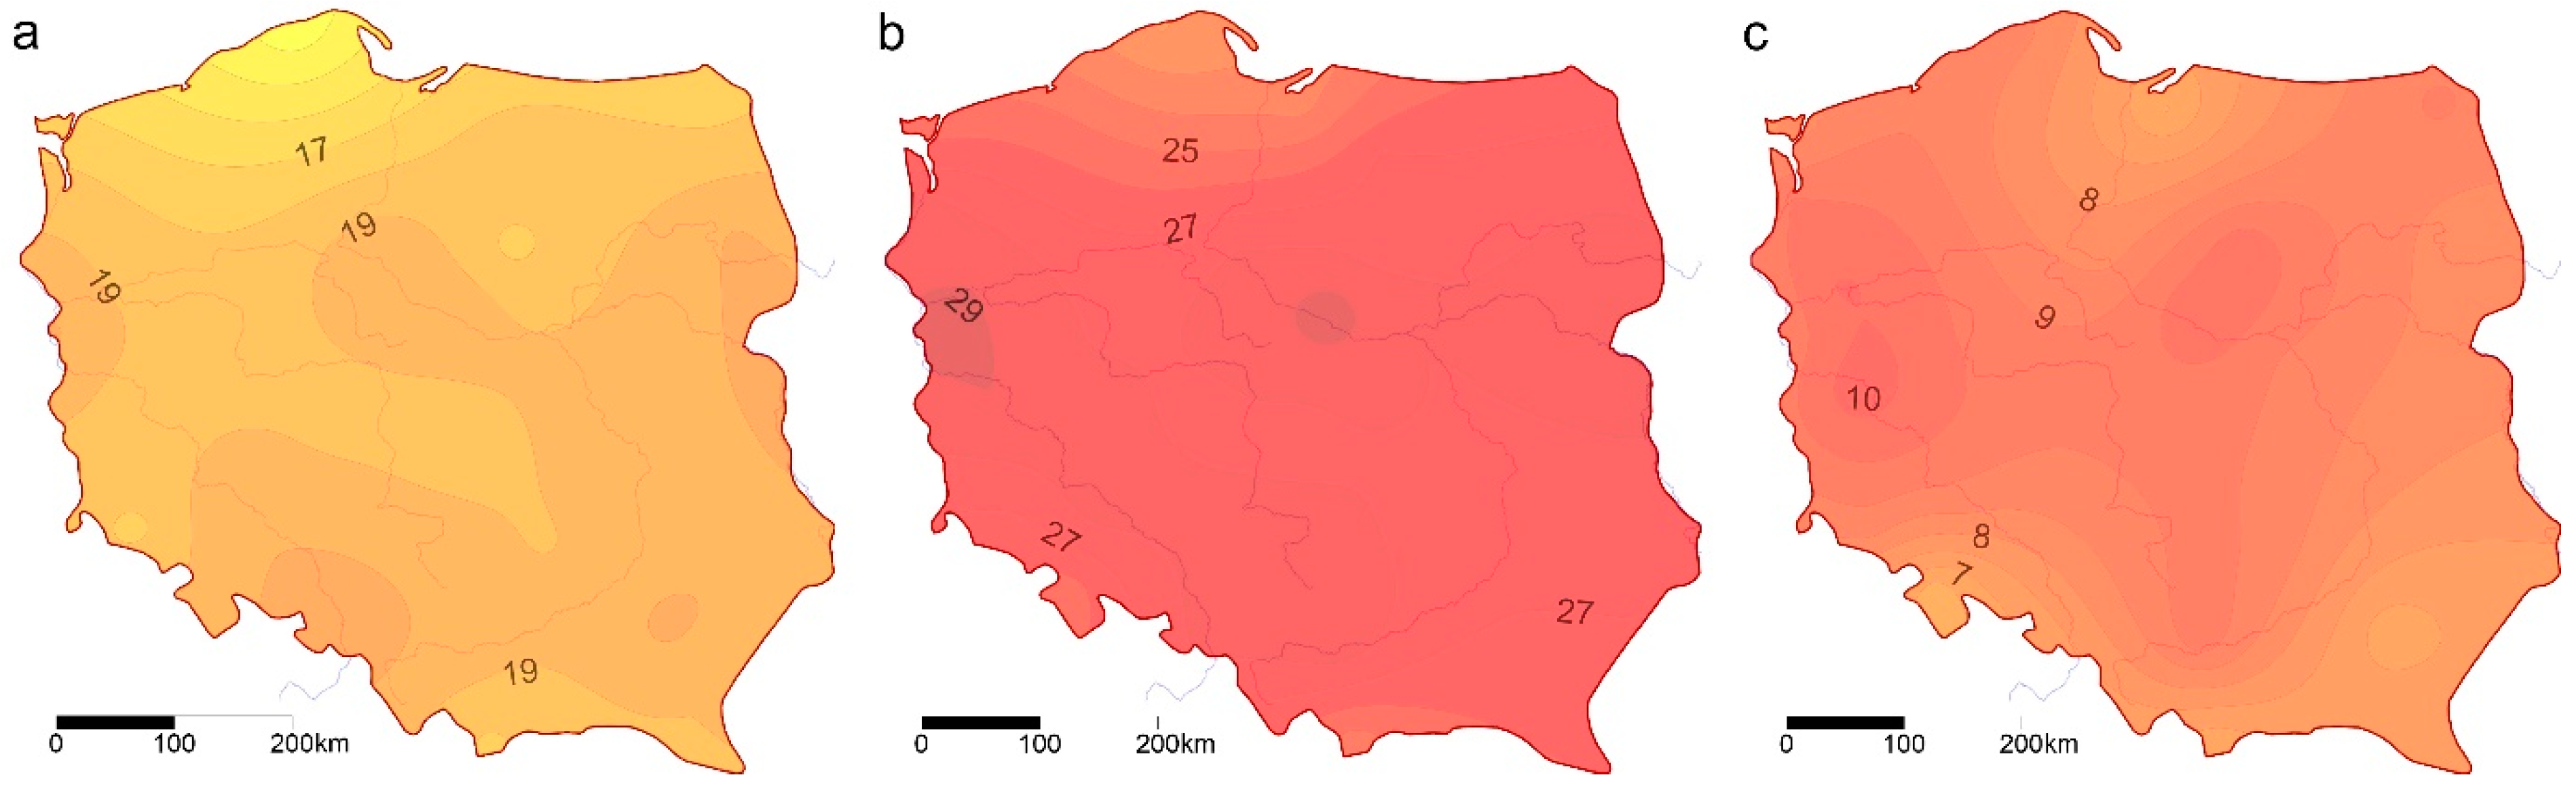
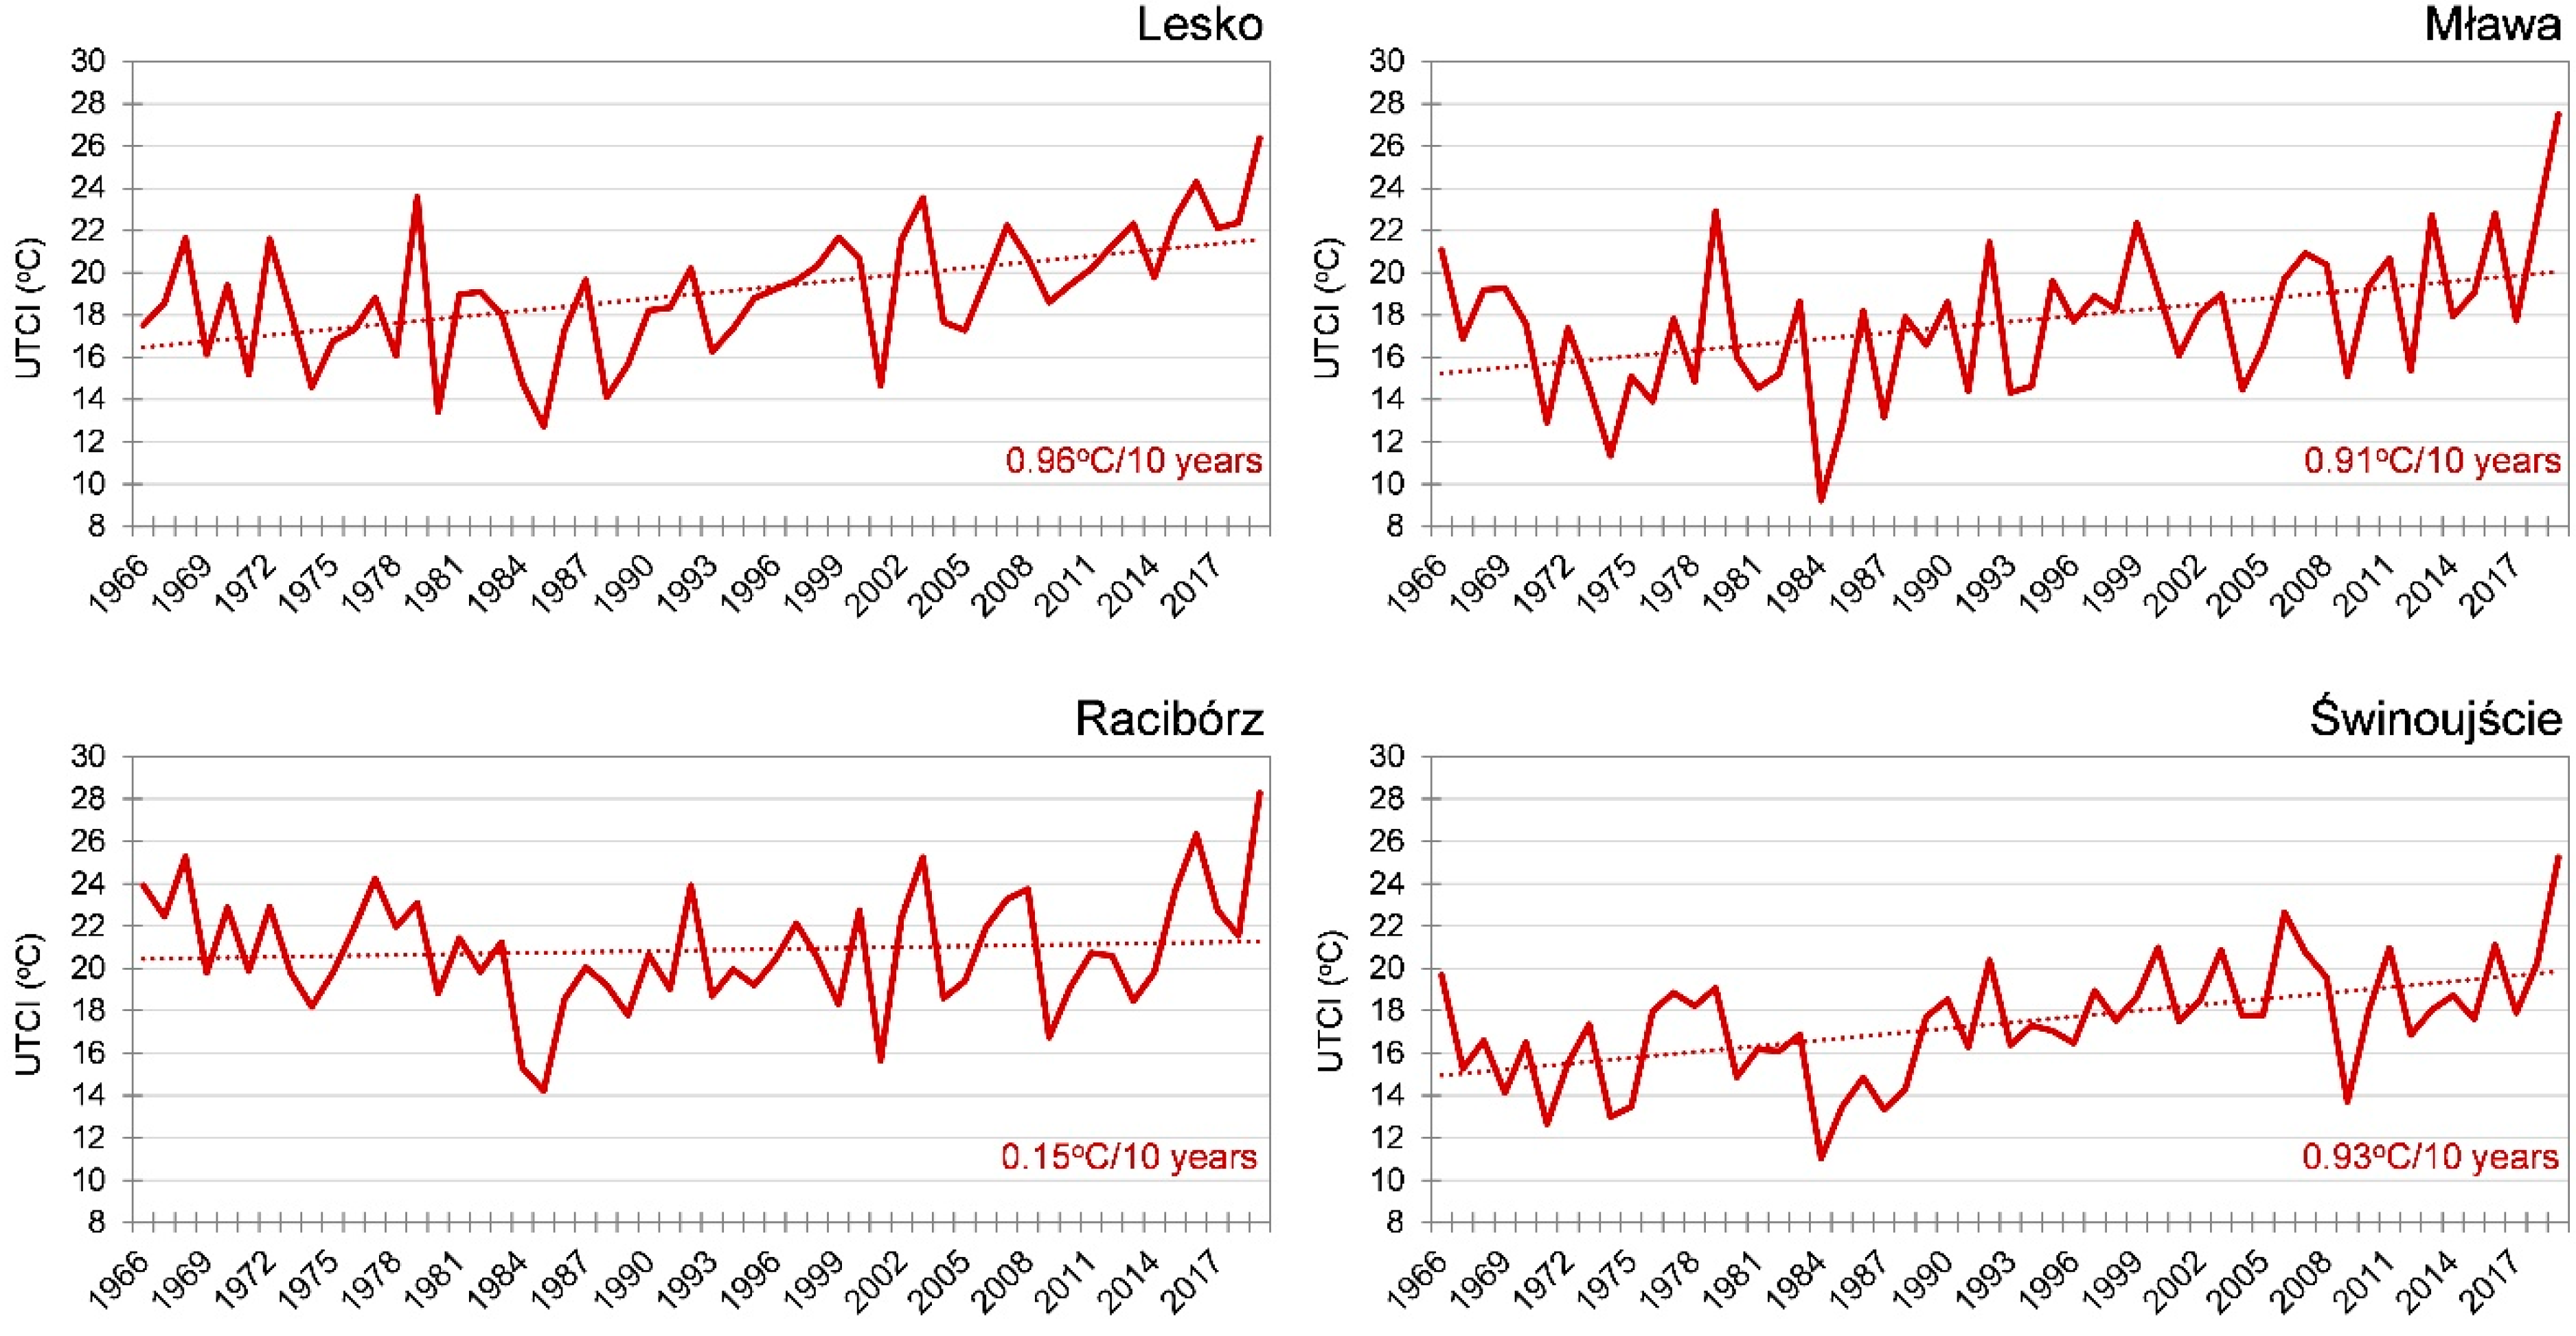
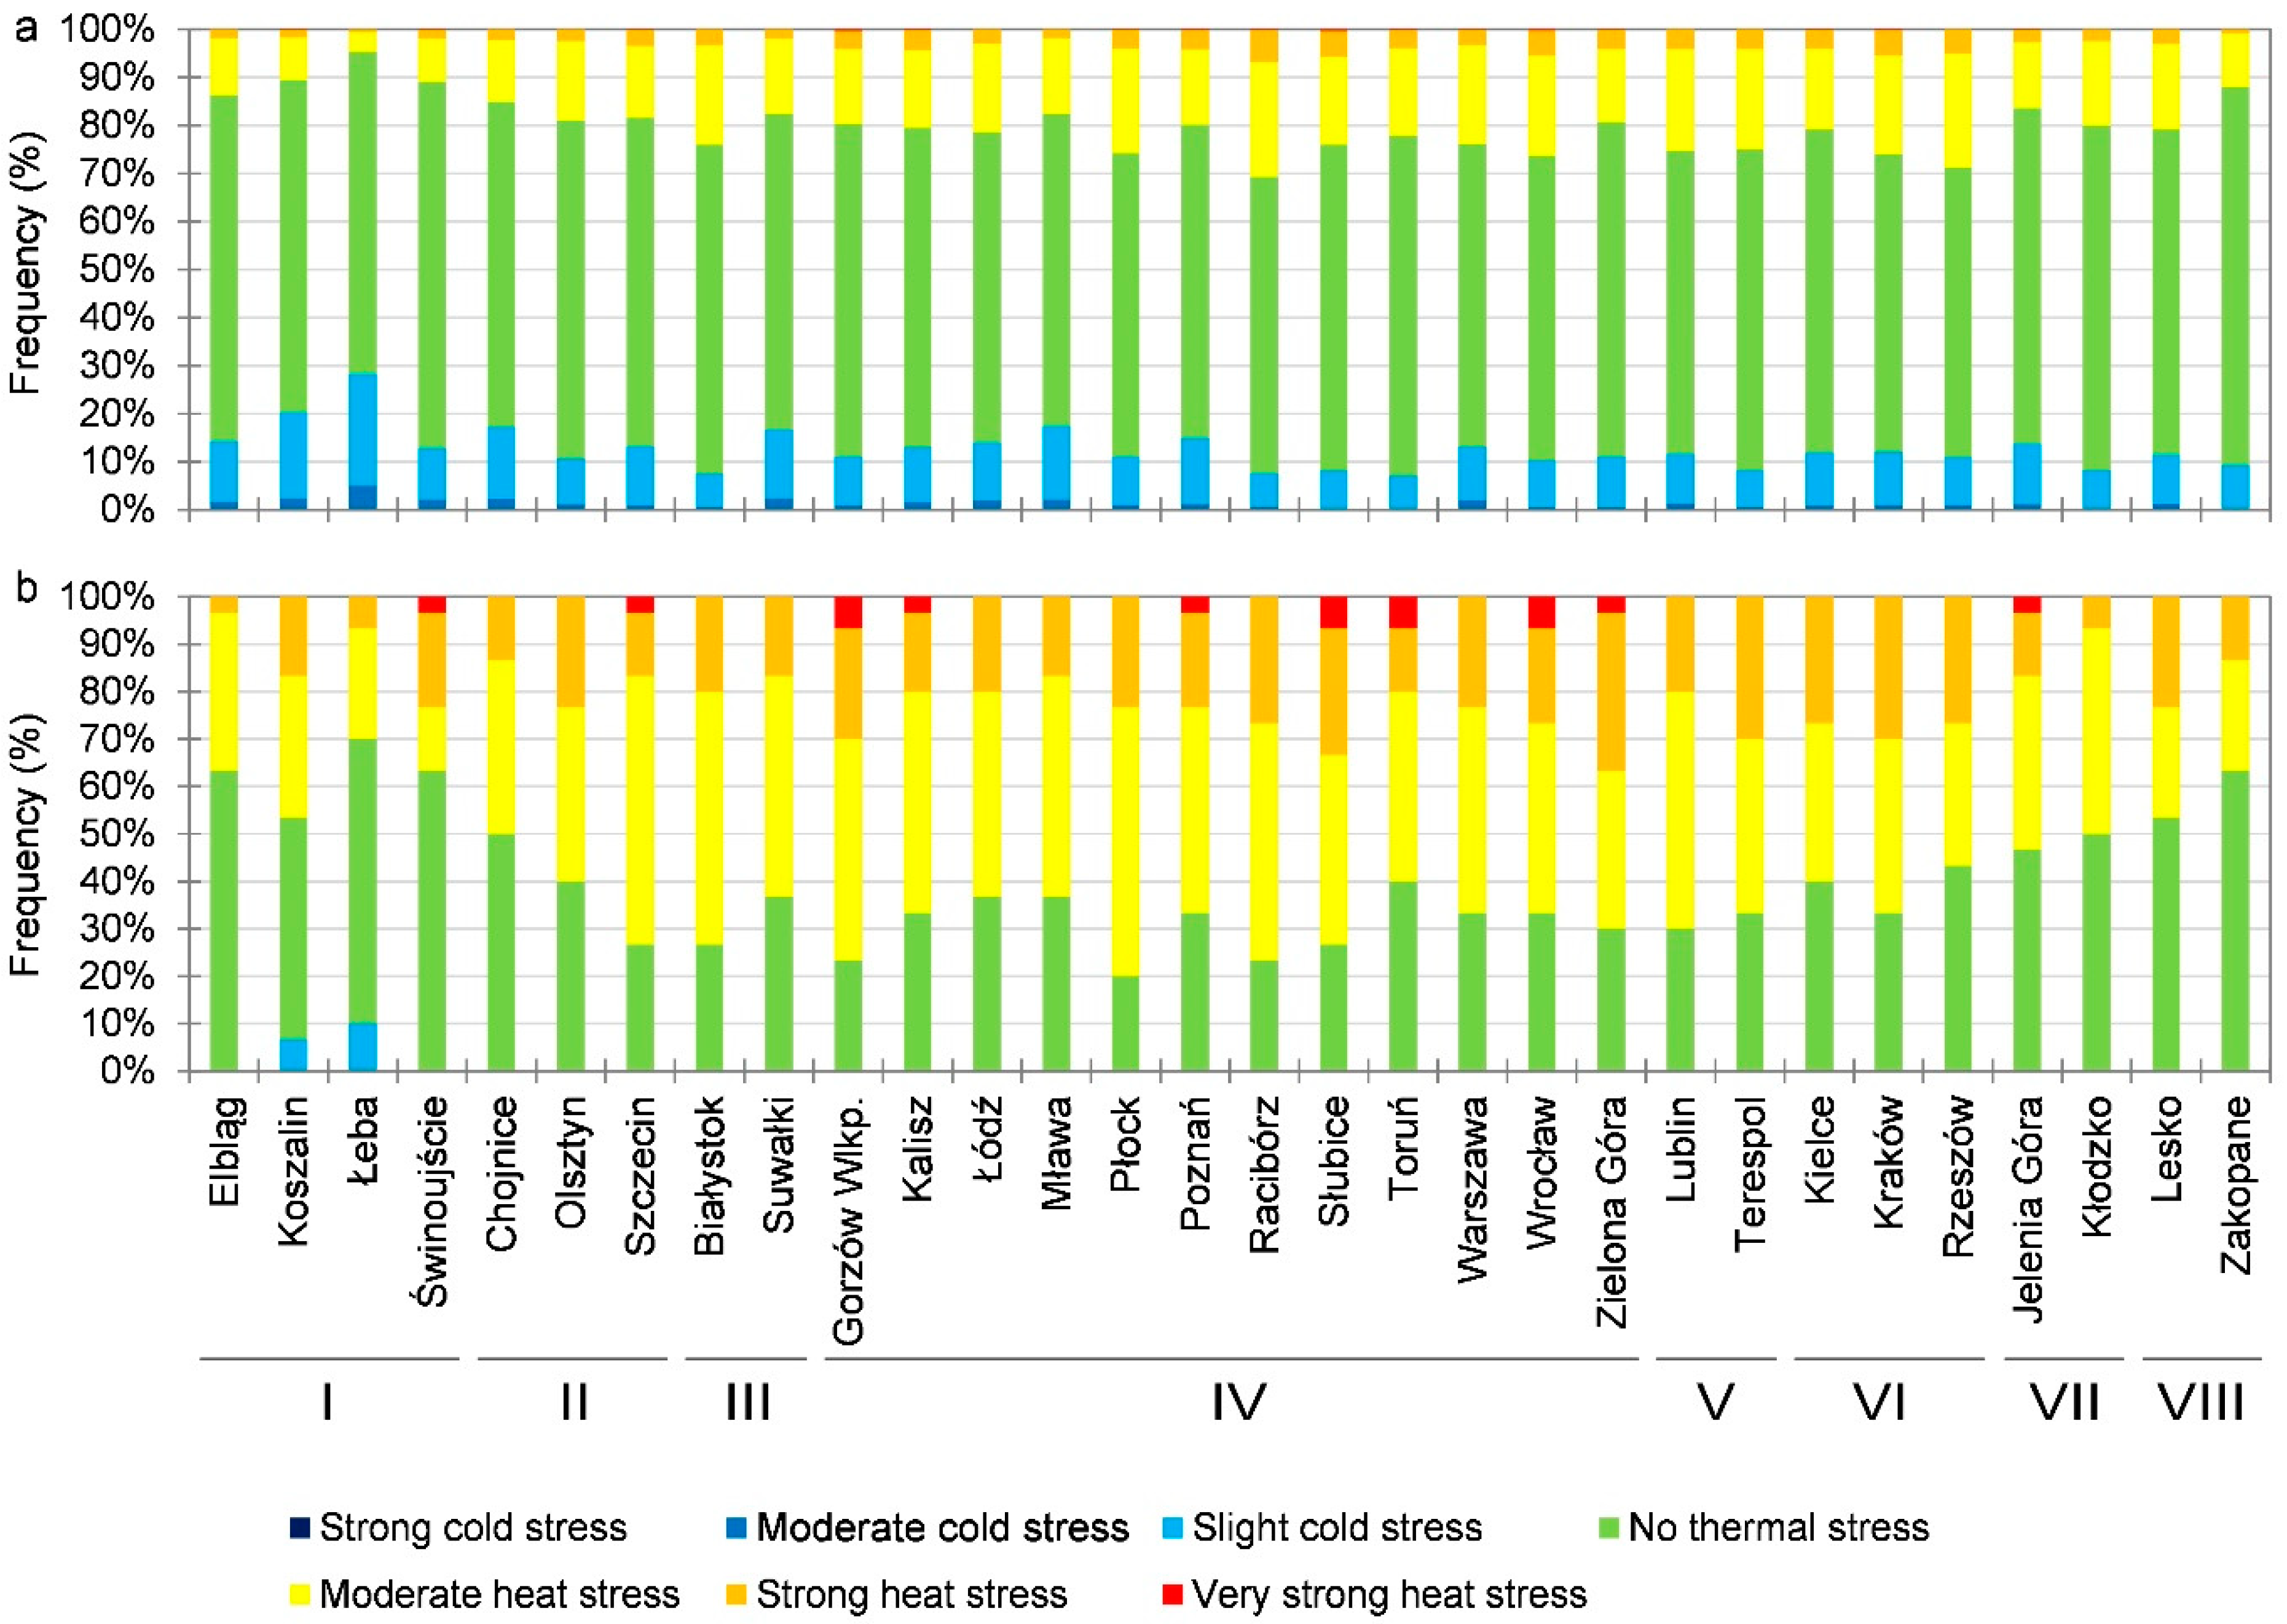
3.2. UTCI in June in the Years 1966–2019 and 2019
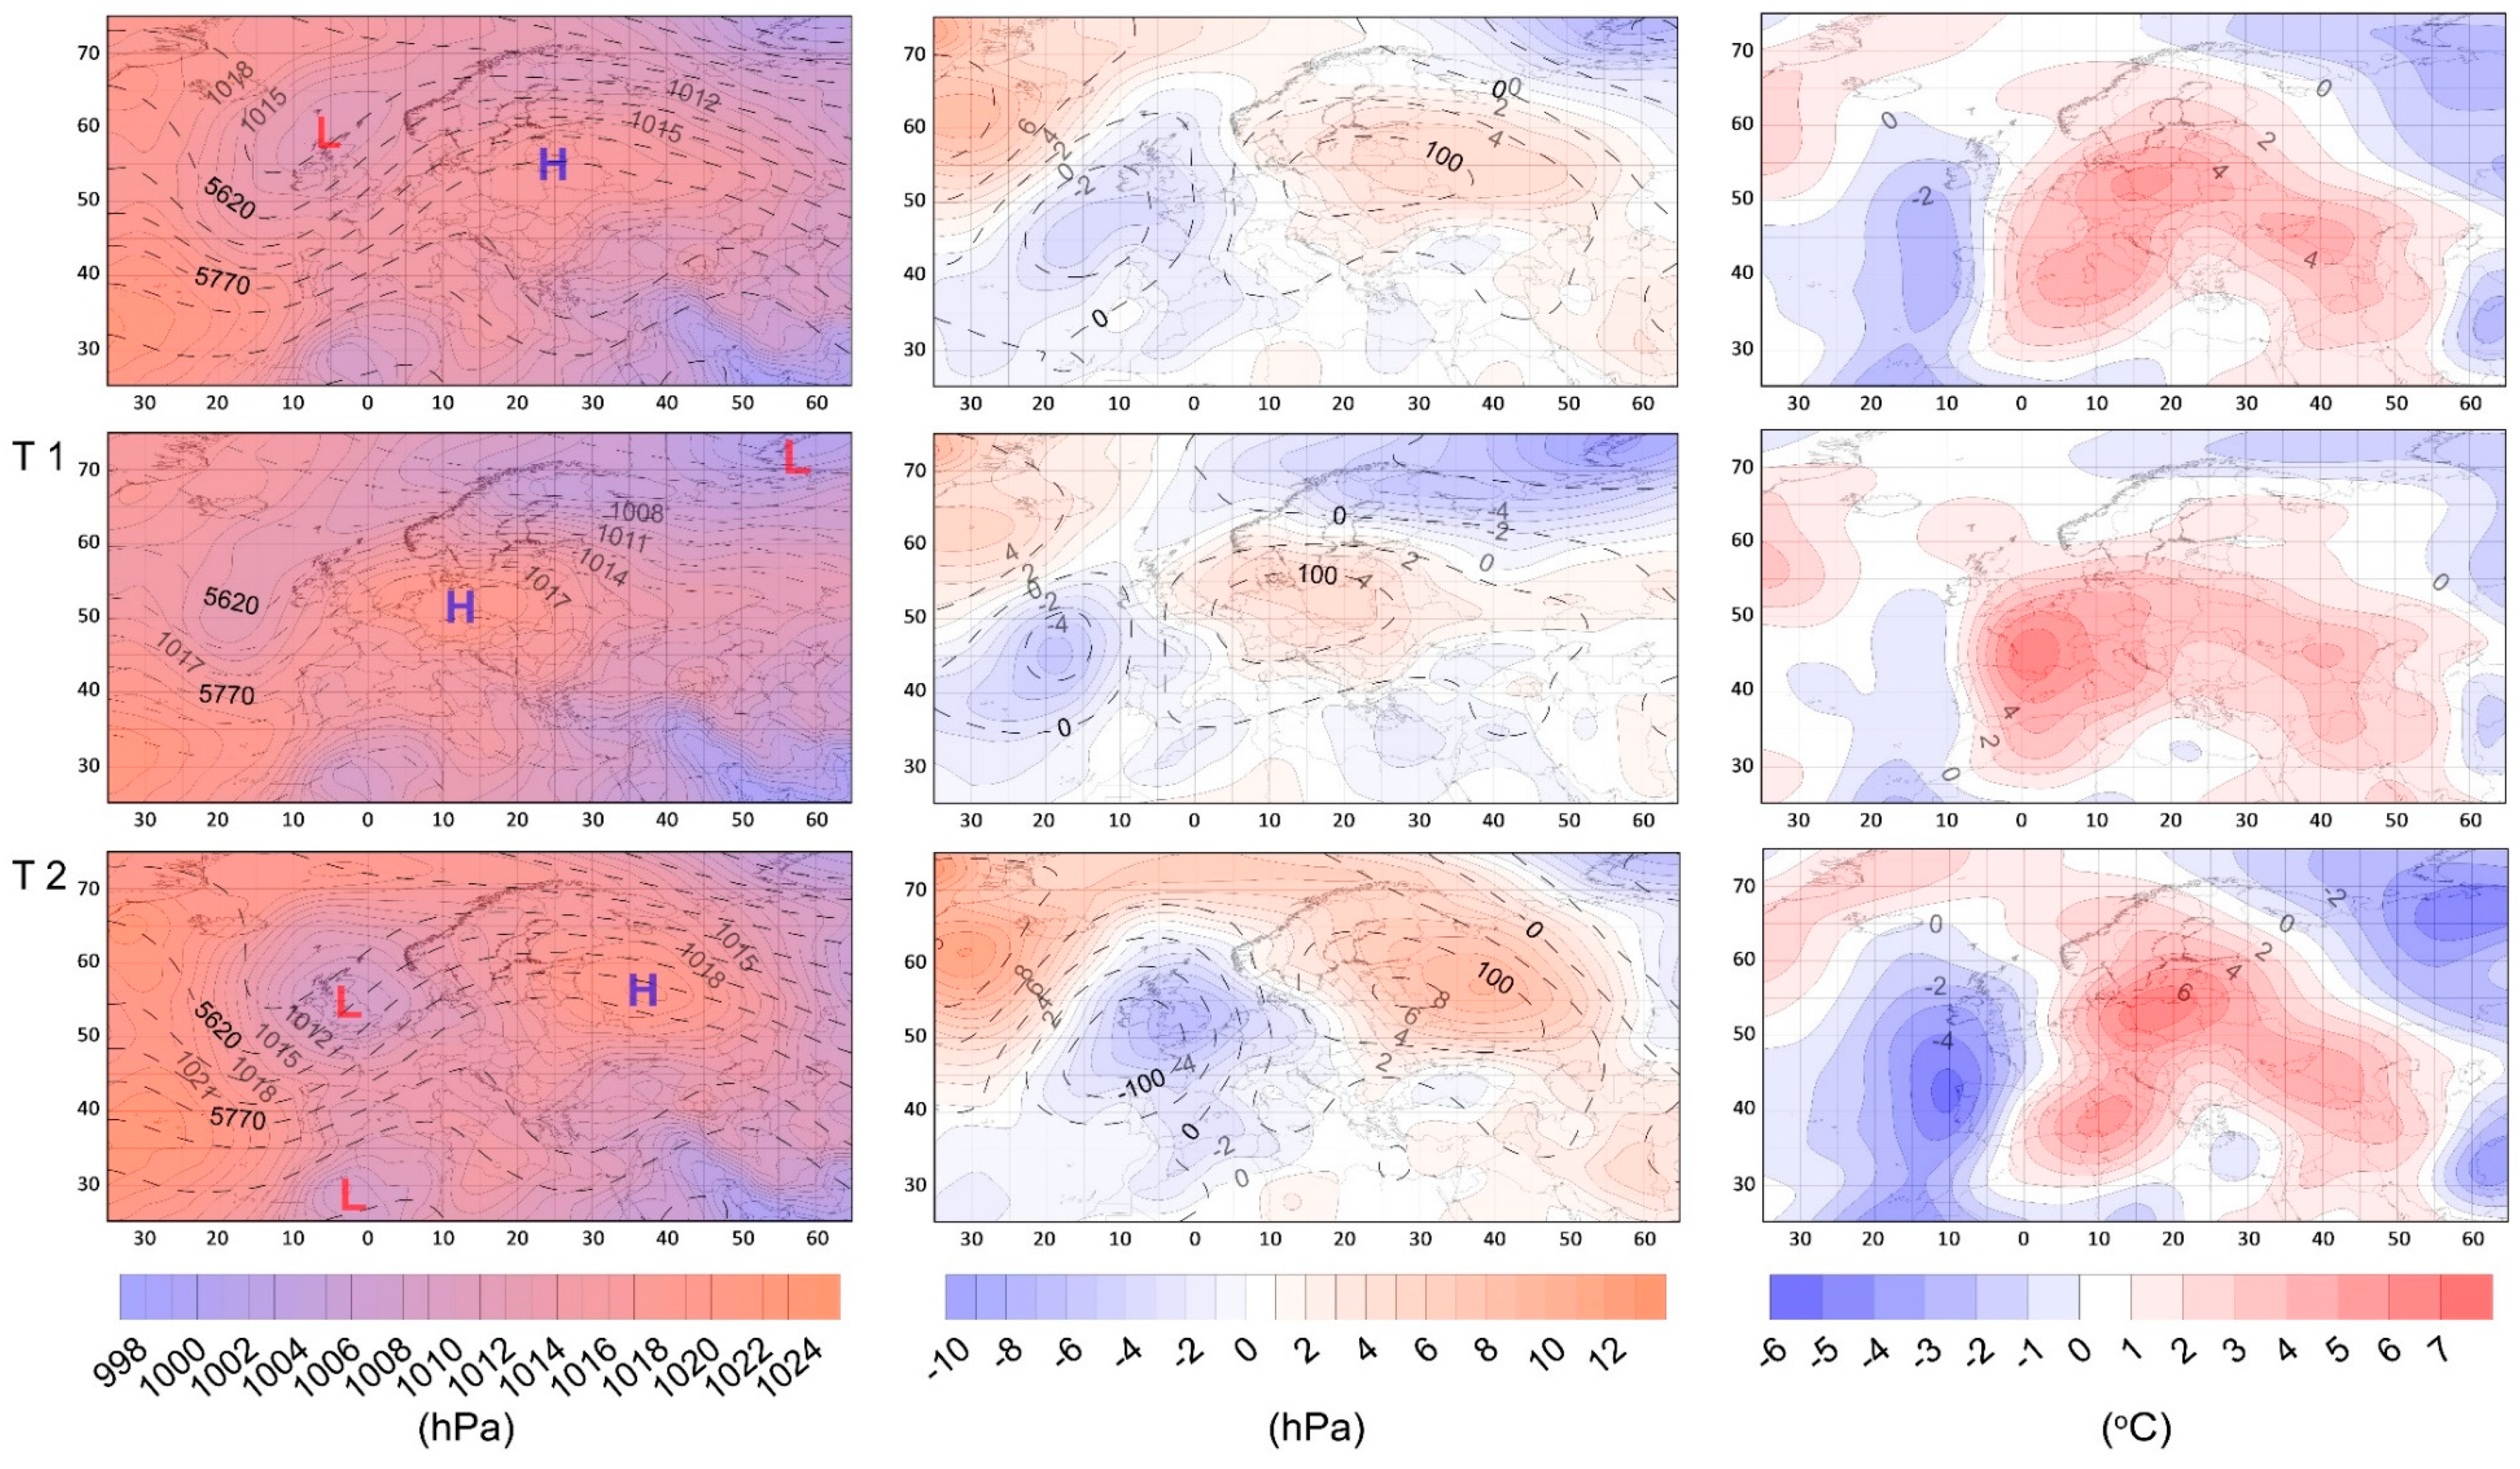
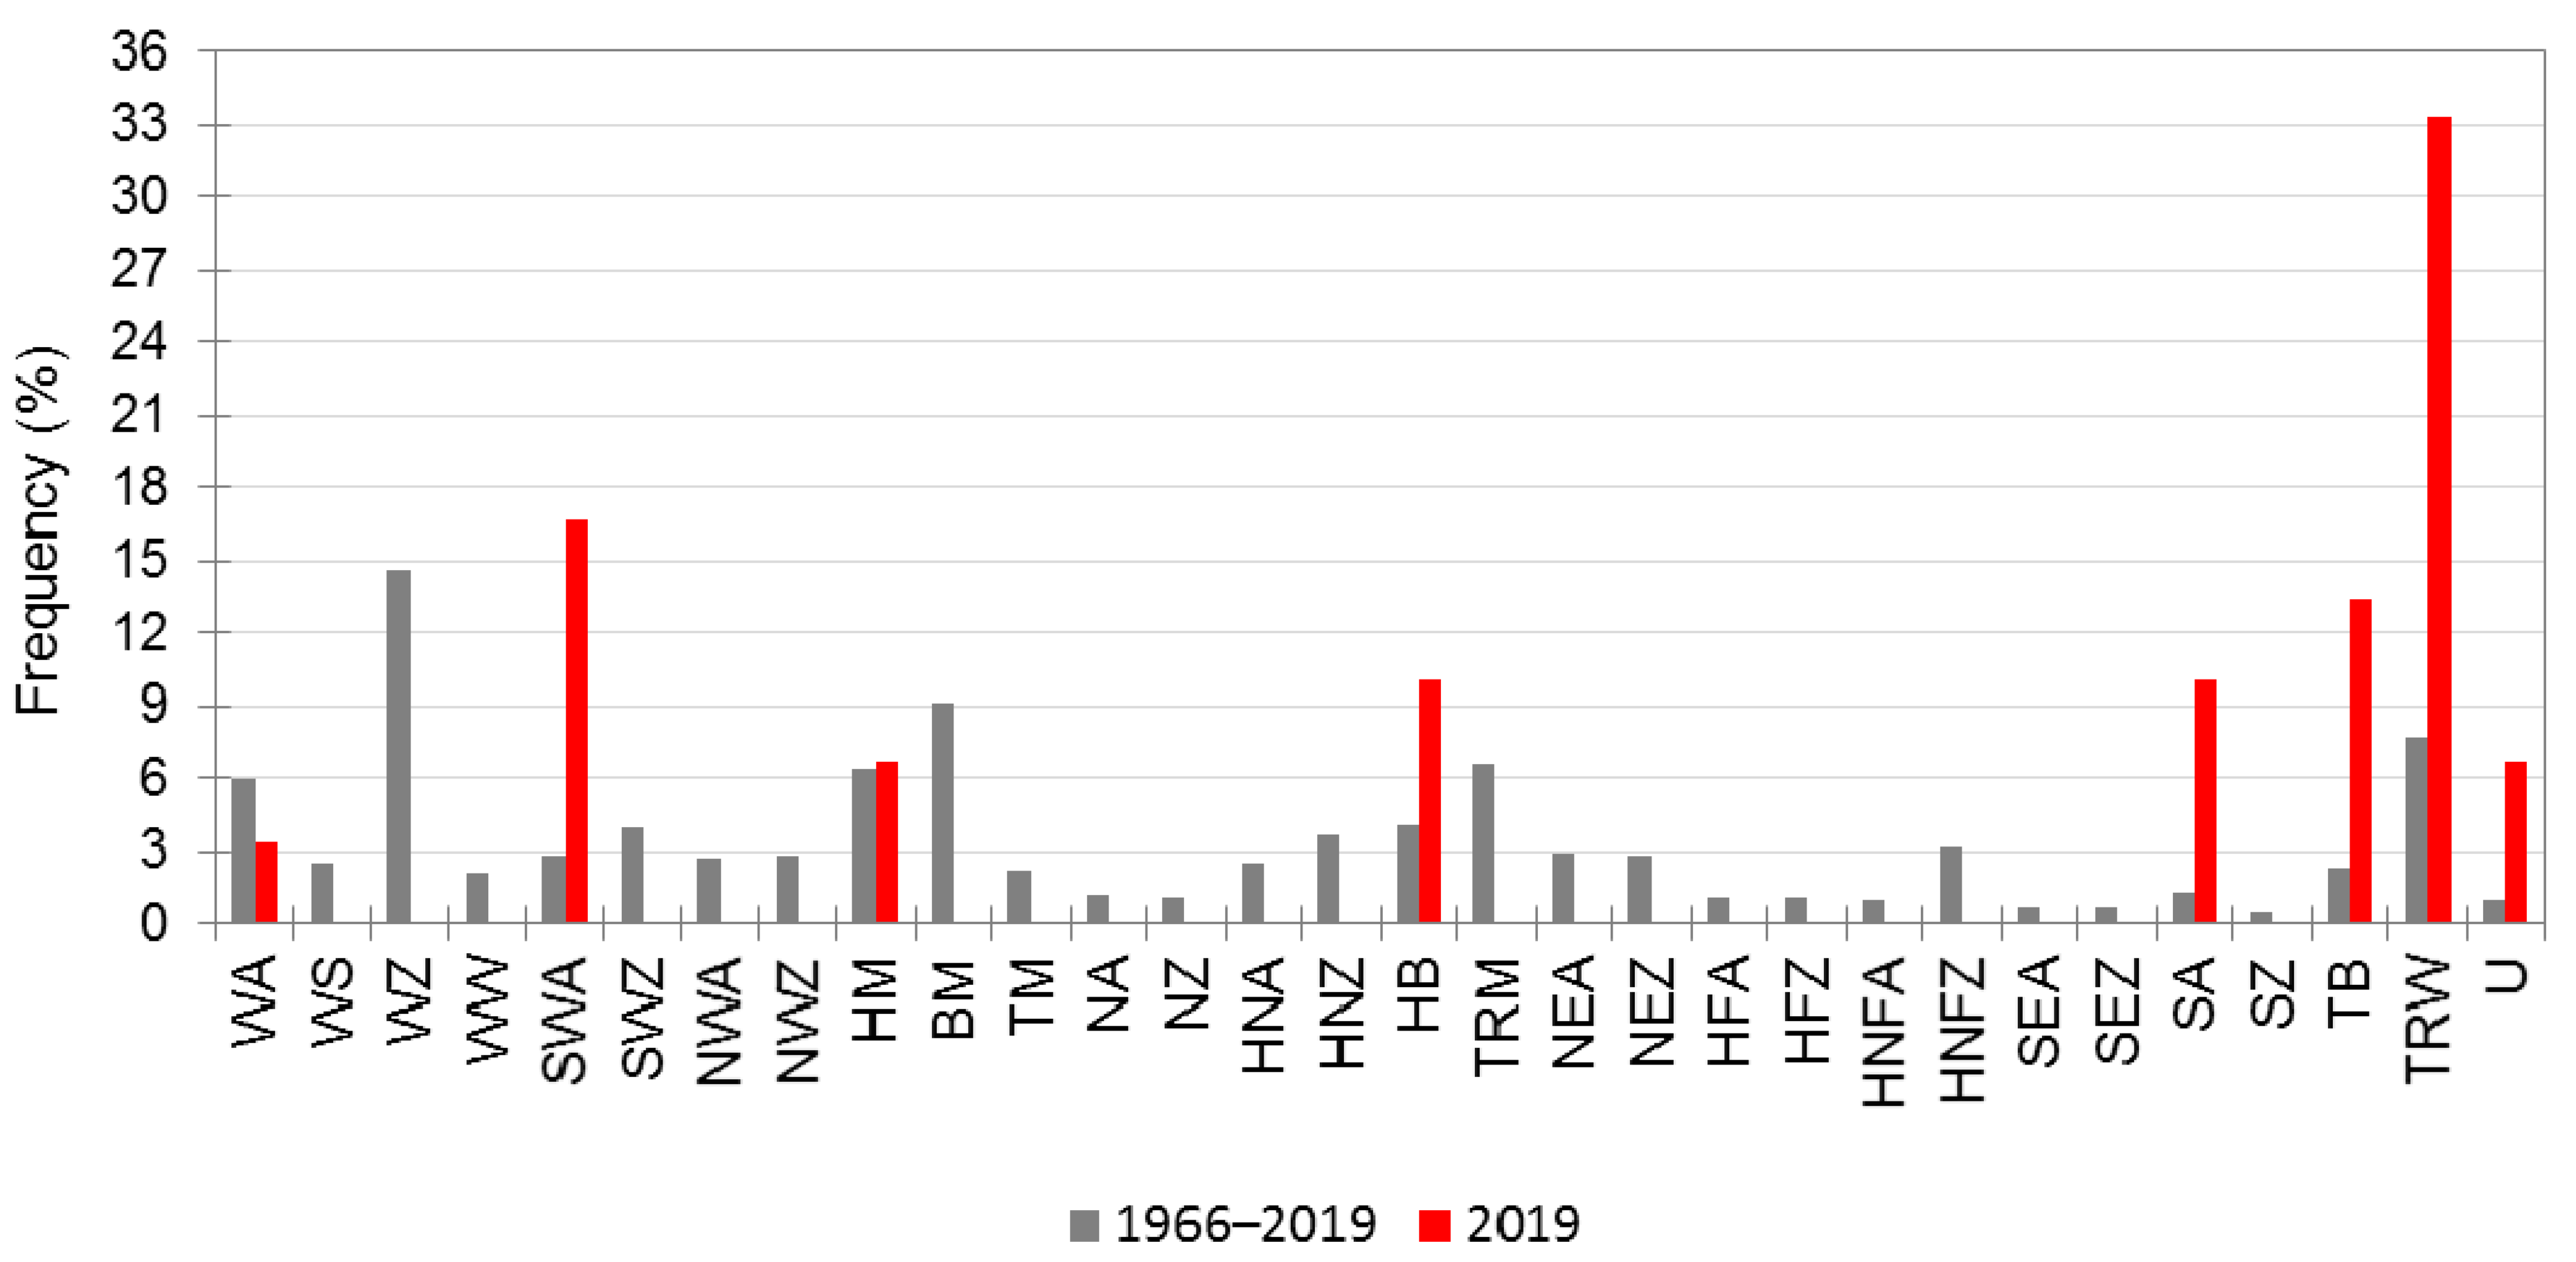
3.3. Effect of Atmospheric Circulation
4. Discussion and Summary
5. Conclusions
Funding
Institutional Review Board Statement
Informed Consent Statement
Data Availability Statement
Conflicts of Interest
References
- IPCC. Climate Change 2013: The Physical Science Basis. Contribution of Working Group I to the Fifth Assessment Report of the Intergovernmental Panel on Climate Change; Cambridge University Press: Cambridge, UK; New York, NY, USA, 2013. [Google Scholar]
- IPCC. Climate Change 2021: The Physical Science Basis. Contribution of Working Group I to the Sixth Assessment Report of the Intergovernmental Panel on Climate Change; Cambridge University Press: Cambridge, UK, 2021. [Google Scholar]
- NOAA. 2020. Available online: https://www.ncdc.noaa.gov/sotc/global/201713 (accessed on 4 May 2021).
- Hoy, A.; Hänsel, S.; Maugeri, M. An endless summer: 2018 heat episodes in Europe in the context of secular temperature variability and change. Int. J. Climatol. 2020, 40, 6315–6336. [Google Scholar] [CrossRef] [Green Version]
- Tomczyk, A.M.; Bednorz, E. The extreme year—Analysis of thermal conditions in Poland in 2018. Theor. Appl. Climatol. 2020, 139, 251–260. [Google Scholar] [CrossRef] [Green Version]
- Zahradníček, P.; Brázdil, R.; Štěpánek, P.; Trnka, M. Reflections of global warming in trends of temperature characteristics in the Czech Republic, 1961–2019. Int. J. Climatol. 2021, 41, 1211–1229. [Google Scholar] [CrossRef]
- Van Oldenborgh, G.J.; Philip, S.; Kew, S.; Vautard, R.; Boucher, O.; Otto, F.; Haustein, K.; Soubeyroux, J.M.; Ribes, A.; Robin, Y.; et al. Human Contribution to the Record-Breaking June 2019 Heat Wave in France; World Weather Attribution (WWA): Amsterdam, The Netherlands, 2019. [Google Scholar]
- Sulikowska, A.; Wypych, A. How Unusual Were June 2019 Temperatures in the Context of European Climatology? Atmosphere 2020, 11, 697. [Google Scholar] [CrossRef]
- Xu, P.; Wang, L.; Liu, Y.; Chen, W.; Huang, P. The record-breaking heat wave of June 2019 in Central Europe. Atmos. Sci. Lett. 2020, 21, e964. [Google Scholar] [CrossRef] [Green Version]
- Ma, F.; Yuan, X.; Jiao, Y.; Ji, P. Unprecedented Europe Heat in June–July 2019: Risk in the Historical and Future Context. Geophys. Res. Lett. 2020, 47, L087809. [Google Scholar] [CrossRef]
- Matzarakis, A.; Muthers, S.; Graw, K. Thermische Belastung von Bewohnern in Städten bei Hitzewellen am Beispiel von Freiburg (Breisgau). Bundesgesundheitsblatt-Gesundheitsforschung-Gesundheitsschutz 2020, 63, 1004–1012. [Google Scholar] [CrossRef]
- Michelozzi, P.; de Donato, F.; Accetta, G.; Forastiere, F.; D’Ovidio, M.; Perucci, C.; Kalkstein, L.S. Impact of heat waves on mortality—Rome, Italy June–August 2003. Morb. Mortal. Wkly. Rep. 2004, 53, 369–371. [Google Scholar]
- Vandentorren, S.; Suzan, R.; Medina, S.; Pascal, M.; Maulpoix, A.; Cohen, J.C.; Ledrans, M. Mortality in 13 French Cities during the August 2003 Heat Wave. Am. J. Public Health 2004, 94, 1518–1520. [Google Scholar] [CrossRef] [PubMed]
- Rebetez, M.; Dupont, O.; Giroud, M. An analysis of the July 2006 heatwave extent in Europe compared to the record year of 2003. Theor. Appl. Climatol. 2006, 95, 1–7. [Google Scholar] [CrossRef] [Green Version]
- Muthers, S.; Laschewski, L.; Matzarakis, A. The Summers 2003 and 2015 in South-West Germany: Heat Waves and Heat-Related Mortality in the Context of Climate Change. Atmosphere 2017, 8, 224. [Google Scholar] [CrossRef] [Green Version]
- Grumm, R.H. The Central European and Russian heat event of July–August 2010. Bull. Am. Meteorol. Soc. 2011, 92, 1285–1296. [Google Scholar] [CrossRef] [Green Version]
- Otto, F.E.L.; Massey, N.; Van Oldenborgh, G.J.; Jones, R.G.; Allan, M.R. Reconciling two approaches to attribution of the 2010 Russian heat wave. Geophys. Res. Lett. 2012, 39, L04702. [Google Scholar] [CrossRef] [Green Version]
- Hoy, A.; Hänsel, S.; Skalak, P.; Ustrnul, Z.; Bochníček, O. The extreme European summer of 2015 in a long-term perspective. Int. J. Climatol. 2017, 37, 943–962. [Google Scholar] [CrossRef]
- Krzyżewska, A.; Dyer, J. The August 2015 mega-heatwave in Poland in the context of past events. Weather 2018, 73, 207–214. [Google Scholar] [CrossRef]
- Tomczyk, A.M.; Bednorz, E. Heat waves in Central Europe and tropospheric anomalies of temperature and geopotential heights. Int. J. Climatol. 2019, 39, 4189–4205. [Google Scholar] [CrossRef]
- Robine, J.M.; Cheung, S.L.; Le Roy, S.; Van Oyen, H.; Herrmann, F.R. Report on Excess Mortality in Europe during Summer 2003. EU Community Action Programme for Public Health; European Commission: Brussels, Belgium, 2007. [Google Scholar]
- Matzarakis, A.; Mayer, H.; Iziomon, M.G. Applications of a universal thermal index: Physiological Equivalent Temperature. Int. J. Biometeorol. 1999, 43, 76–84. [Google Scholar] [CrossRef]
- Matzarakis, A.; Rutz, F.; Mayer, H. Modelling radiation fluxes in simple and complex environment—Application of the RayMan model. Int. J. Biometeorol. 2007, 51, 323–334. [Google Scholar] [CrossRef]
- Błażejczyk, K.; Bröde, P.; Fiala, D.; Havenith, G.; Holmér, I.; Jendritzky, G.; Kampmann, B. UTCI—New index for assessment of heat stress in man. Przegląd Geogr. 2010, 82, 49–71. (In Polish) [Google Scholar]
- Błażejczyk, K.; Epstein, Y.; Jendritzky, G.; Staiger, H.; Tinz, B. Comparison of UTCI to selected thermal indices. Int. J. Biometeorol. 2012, 56, 515–535. [Google Scholar] [CrossRef] [Green Version]
- Kolendowicz, L.; Półrolniczak, M.; Szyga-Pluta, K.; Bednorz, E. Human-biometeorological conditions in the southern Baltic coast based on the universal thermal climate index (UTCI). Theor. Appl. Climatol. 2018, 134, 363–379. [Google Scholar] [CrossRef] [Green Version]
- Matzarakis, A.; Fröhlich, D.; Bermon, S.; Adami, P.E. Quantifying Thermal Stress for Sport Events—The Case of the Olympic Games 2020 in Tokyo. Atmosphere 2018, 9, 479. [Google Scholar] [CrossRef] [Green Version]
- Roshan, G.H.R.; Ghanghermeh, A.A.; Kong, Q. Spatial and temporal analysis of outdoor human thermal comfort during heat and cold waves in Iran. Weather Clim. Extrem. 2018, 19, 58–67. [Google Scholar] [CrossRef]
- Pecelj, M.M.; Lukić, M.Z.; Filipović, D.J.; Protić, B.M.; Bogdanović, U.M. Analysis of the Universal Thermal Climate Index during heat waves in Serbia. Nat. Hazards Earth Syst. Sci. 2020, 20, 2021–2036. [Google Scholar] [CrossRef]
- Tomczyk, A.M.; Owczarek, M. Occurence of strong and very strong heat stress in Poland and its circulation conditions. Theor. Appl. Climatol. 2020, 139, 893–905. [Google Scholar] [CrossRef] [Green Version]
- Bröde, P.; Krüger, E.L.; Fiala, D. UTCI: Validation and practical application to the assessment of urban outdoor thermal comfort. Geogr. Pol. 2013, 86, 11–20. [Google Scholar] [CrossRef]
- Krzyżewska, A.; Wereski, S.; Demczuk, P. Biometeorological conditions during an extreme heatwave event in Poland in August 2015. Weather 2019, 75, 183–189. [Google Scholar] [CrossRef]
- Tomczyk, A.M.; Bednorz, E.; Matzarakis, A. Human-biometeorological conditions during heat waves in Poland. Int. J. Climatol. 2020, 40, 5043–5055. [Google Scholar] [CrossRef]
- Wibig, J. Heat waves in Poland in the period 1951–2015: Trends, patterns and driving factors. Meteorol. Hydrol. Water Manag. 2018, 6, 37–45. [Google Scholar] [CrossRef]
- Tomczyk, A.M.; Bednorz, E.; Półrolniczak, M.; Kolendowicz, L. Strong heat and cold waves in Poland in relation with the large-scale atmospheric circulation. Theor. Appl. Climatol. 2019, 137, 1909–1923. [Google Scholar] [CrossRef] [Green Version]
- Kuchcik, M. Mortality and thermal environment (UTCI) in Poland—Long-term, multi-city study. Int. J. Biometeorol. 2020, 65, 1529–1541. [Google Scholar] [CrossRef] [PubMed]
- Błażejczyk, K. Bioklimatyczne uwarunkowania rekreacji i turystyki w Polsce. Pr. Geogr. 2004, 192. [Google Scholar]
- Bröde, P.; Fiala, D.; Błażejczyk, K.; Holmer, I.; Jendritzky, G.; Kampmann, B.; Tinz, B.; Havenith, G. Deriving the operational procedure for the Universal Thermal Climate Index (UTCI). Int. J. Biometeorol. 2012, 56, 481–494. [Google Scholar] [CrossRef] [Green Version]
- Fiala, D.; Lomas, K.J.; Stohrer, M. A computer model of human thermoregulation for a wide range of environmental conditions: The passive system. J. Appl. Physiol. 1999, 87, 1957–1972. [Google Scholar] [CrossRef] [PubMed]
- Fiala, D.; Lomas, K.J.; Stohrer, M. Computer prediction of human thermoregulatory and temperature responses to a wide range of environmental conditions. Int. J. Biometeorol. 2001, 45, 143–159. [Google Scholar] [CrossRef]
- Błażejczyk, K.; Błażejczyk, M. BioKlima; Verion 2.6; Polish Academy of Sciences: Warszawa, Poland, 2006; Available online: www.igipz.pan.pl/bioklima.html (accessed on 5 May 2020).
- Błażejczyk, K.; Jendritzky, G.; Bröde, P.; Fiala, D.; Havenith, G.; Epstein, Y.; Psikuta, A.; Kampmann, B. An introduction to the Universal Thermal Climate Index (UTCI). Geogr. Pol. 2013, 86, 5–10. [Google Scholar] [CrossRef] [Green Version]
- Ward, J.H. Hierarchical grouping to optimize an objective function. J. Am. Stat. Assoc. 1963, 58, 236–244. [Google Scholar] [CrossRef]
- Kalnay, E.; Kanamistu, M.; Kistler, R.; Collins, W.; Deaven, D.; Gandin, L.; Iredell, M.; Saha, S.; White, G.; Woollen, J.; et al. The NMC/NCAR 40–Year Reanalysis Project. Bull. Am. Meteorol. Soc. 1996, 77, 437–471. [Google Scholar] [CrossRef] [Green Version]
- Werner, P.C.; Gerstengarbe, F.W. Katalog der Großwetterlagen Europas (1881–2009) nach Paul Hess und Helmut Brezowsky; PIK Report 119; Potsdam Institute for Climate Change Impact Research: Potsdam, Germany, 2010. [Google Scholar]
- Krzyżewska, A.; Wereski, S.; Dobek, M. Summer UTCI variability in Poland in the twenty-first century. Int. J. Biometeorol. 2020, 65, 1497–1513. [Google Scholar] [CrossRef]
- Di Napoli, C.; Pappenberger, F.; Cloke, H.L. Assessing heat-related health risk in Europe via the Universal Thermal Climate Index (UTCI). Int. J. Biometeorol. 2018, 62, 1155–1165. [Google Scholar] [CrossRef] [Green Version]
- Shevchenko, O.; Snizhko, S.; Matzarakis, A. Recent trends on human thermal bioclimate conditions in Kyiv, Ukraine. Geogr. Pol. 2020, 93, 89–106. [Google Scholar] [CrossRef] [Green Version]
- Okoniewska, M.; Więcław, M. Long term variability of bioclimate conditions in the second half of the 20 century based on Universal Thermal Climate Index. J. Health Sci. 2013, 3, 116–129. (In Polish) [Google Scholar]
- Anderson, G.B.; Bell, M.L. Heat waves in the United States: Mortality risk during heat waves and effect modification by heat wave characteristics in 43 U.S. communities. Environ. Health Perspect. 2011, 119, 210–218. [Google Scholar] [CrossRef] [PubMed] [Green Version]
- Kuchcik, M. Thermal conditions in Poland at the turn of the 20th and 21st centuries, and their impact on mortality. Geogr. Stud. 2017, 263. Available online: https://rcin.org.pl/igipz/dlibra/publication/85081?tab=1&language=en (accessed on 28 August 2021).
- Błażejczyk, K.; Idzikowska, D.; Błażejczyk, A. Forecast changes for heat and cold stress in Warsaw in the 21st century, and their possible influence on mortality risk. Pap. Glob. Chang. 2013, 20, 47–62. [Google Scholar] [CrossRef]
- Miszuk, B.; Otop, I.; Strońska, M.; Schwarzak, S.; Surke, M. Tourism-climate conditions and their future development in the Polish-Saxon border area. Meteorol. Z. 2016, 25, 421–434. [Google Scholar] [CrossRef]
- Matzarakis, A.; Endler, C. Climate change and thermal bioclimate in cities: Impacts and options for adaptation in Freiburg, Germany. Int. J. Biometeorol. 2010, 54, 479–483. [Google Scholar] [CrossRef]


| UTCI (°C) | Stress Category | UTCI (°C) | Stress Category |
|---|---|---|---|
| above +46 | Extreme heat stress | +9 to 0 | Slight cold stress |
| +38 to +46 | Very strong heat stress | 0 to −13 | Moderate cold stress |
| +32 to +38 | Strong heat stress | −13 to −27 | Strong cold stress |
| +26 to +32 | Moderate heat stress | −27 to −40 | Very strong cold stress |
| +9 to +26 | No thermal stress | below −40 | Extreme cold stress |
| Grosswettertype (GWT) | Symbol | Grosswetterlage (GWL) |
|---|---|---|
| West | WA | West Circulation, anticyclonal |
| WZ | West Circulation, cyclonal | |
| WS | Southern West Circulation | |
| WW | Angled West Circulation | |
| Southwest | SWA | Southwest Circulation, anticyclonal |
| SWZ | Southwest Circulation, cyclonal | |
| Northwest | NWA | Northwest Circulation, anticyclonal |
| NWZ | Northwest Circulation, cyclonal | |
| Central Europe High | HM | Central European High |
| BM | Central European Ridge | |
| Central Europe Low | TM | Central European Low |
| North | NA | North Circulation, anticyclonal |
| NZ | North Circulation, cyclonal | |
| HNA | Norwegian Sea High, anticyclonal | |
| HNZ | Norwegian Sea High, cyclonal | |
| HB | British Isles High | |
| TRM | Central Europe Trough | |
| Northeast | NEA | Northeast Circulation, anticyclonal |
| NEZ | Northeast Circulation, cyclonal | |
| East | HFA | Fennoscandian High, anticyclonal |
| HFZ | Fennoscandian High, cyclonal | |
| HNFA | Norwegian Sea/Fennoscandia High, anticyclonal | |
| HNFZ | Norwegian Sea/Fennoscandia High, cyclonal | |
| Southeast | SEA | Southeast Circulation, anticyclonal |
| SEZ | Southeast Circulation, cyclonal | |
| South | SA | South Circulation, anticyclonal |
| SZ | South Circulation, cyclonal | |
| TB | British Isles Low | |
| TRW | Western Europe Trough | |
| U | Undefined |
| Station | Changes [°C/10 Years] | Station | Changes [°C/10 Years] | ||
|---|---|---|---|---|---|
| Summer | June | Summer | June | ||
| Łeba | 0.17 | 0.19 | Warszawa | 0.81 | 0.75 |
| Koszalin | 0.46 | 0.33 | Terespol | 0.74 | 0.61 |
| Elbląg | 0.22 | 0.19 | Zielona Góra | 0.60 | 0.59 |
| Suwałki | 1.06 | 0.82 | Kalisz | 0.20 | 0.13 |
| Świnoujście | 0.98 | 0.93 | Łódź | 0.66 | 0.67 |
| Olsztyn | 0.40 | 0.24 | Lublin | 0.68 | 0.68 |
| Chojnice | 0.50 | 0.42 | Wrocław | 0.49 | 0.42 |
| Szczecin | 0.49 | 0.42 | Jelenia Góra | 0.64 | 0.58 |
| Białystok | 0.64 | 0.48 | Kielce | 0.51 | 0.55 |
| Mława | 0.95 | 0.91 | Kłodzko | 0.42 | 0.45 |
| Toruń | 0.61 | 0.56 | Rzeszów | 0.69 | 0.66 |
| Gorzów Wielkopolski | 0.60 | 0.61 | Kraków | 0.75 | 0.79 |
| Płock | 0.69 | 0.60 | Racibórz | 0.25 | 0.15 |
| Poznań | 0.76 | 0.64 | Lesko | 0.96 | 0.96 |
| Słubice | 0.52 | 0.57 | Zakopane | 0.65 | 0.66 |
Publisher’s Note: MDPI stays neutral with regard to jurisdictional claims in published maps and institutional affiliations. |
© 2021 by the author. Licensee MDPI, Basel, Switzerland. This article is an open access article distributed under the terms and conditions of the Creative Commons Attribution (CC BY) license (https://creativecommons.org/licenses/by/4.0/).
Share and Cite
Tomczyk, A.M. Bioclimatic Conditions of June 2019 in Poland on a Multi-Year Background (1966–2019). Atmosphere 2021, 12, 1117. https://doi.org/10.3390/atmos12091117
Tomczyk AM. Bioclimatic Conditions of June 2019 in Poland on a Multi-Year Background (1966–2019). Atmosphere. 2021; 12(9):1117. https://doi.org/10.3390/atmos12091117
Chicago/Turabian StyleTomczyk, Arkadiusz Marek. 2021. "Bioclimatic Conditions of June 2019 in Poland on a Multi-Year Background (1966–2019)" Atmosphere 12, no. 9: 1117. https://doi.org/10.3390/atmos12091117
APA StyleTomczyk, A. M. (2021). Bioclimatic Conditions of June 2019 in Poland on a Multi-Year Background (1966–2019). Atmosphere, 12(9), 1117. https://doi.org/10.3390/atmos12091117