Article

Observation and Inversion of Aerosol Particle Size Distribution over Yinchuan Area

1
School of Electrical and Information Engineering, North Minzu University, North Wenchang Road, Yinchuan 750021, China
2
Key Laboratory of Atmospheric Environment Remote Sensing of Ningxia, North Wenchang Road, Yinchuan 750021, China
*
Author to whom correspondence should be addressed.
Atmosphere 2021, 12(8), 992; https://doi.org/10.3390/atmos12080992
Submission received: 9 June 2021 / Revised: 24 July 2021 / Accepted: 28 July 2021 / Published: 31 July 2021
(This article belongs to the Special Issue Atmospheric Aerosol Optical Properties)

Abstract

:
Particle size distribution is one of the important microphysical parameters to characterize the aerosol properties. The aerosol optical depth is used as the function of wavelength to study the particle size distribution of whole atmospheric column. However, the inversion equation of the particle size distribution from the aerosol optical depth belongs to the Fredholm integral equation of the first kind, which is usually ill-conditioned. To overcome this drawback, the integral equation is first discretized directly by using the complex trapezoid formula. Then, the corresponding parameters are selected by the L curve method. Finally the truncated singular value decomposition regularization method is employed to regularize the discrete equation and retrieve the particle size distribution. To verify the feasibility of the algorithm, the aerosol optical depths taken by a sun photometer CE318 over Yinchuan area in four seasons, as well as hazy, sunny, floating dusty and blowing dusty days, were used to retrieve the particle size distribution. In order to verify the effect of truncated singular value decomposition algorithm, the Tikhonov regularization algorithm was also adopted to retrieve the aerosol PSD. By comparing the errors of the two regularizations, the truncated singular value decomposition regularization algorithm has a better retrieval effect. Moreover, to understand intuitively the sources of aerosol particles, the backward trajectory was used to track the source. The experiment results show that the truncated singular value decomposition regularization method is an effective method to retrieve the particle size distribution from aerosol optical depth.

1. Introduction

Atmospheric aerosol has a long-term and far-reaching impact on the natural environment and social environment. It has played an extremely important role in changing the energy balance of the earth, reducing visibility, reducing sunlight and affecting the local climate and human health, which has caused widespread attention and deep discussion [1]. The aerosol particle size distribution (PSD) is the most important microphysical property parameter and is also an indicator of environmental quality. The physical and chemical properties of aerosol particles with different size distributions are quite different [2]. Yinchuan area is located in northwest China and belongs to a typical semi-arid temperate continental climate. Long-term observations with the sun photometer CE-318 and in-depth research using regularization algorithms on the PSD will provide valuable data and theoretical support for monitoring and improving atmospheric pollution and researching climate change in Yinchuan. Therefore, accurately describing aerosol PSD has important significance to further study climate change.
So far, there are various methods for measuring aerosol PSD. The optical particle counters, aerodynamic particle sizer (APS), wide range particle spectrometer (WPS), scanning mobility particle sizer (SMPS) and differential mobility particle sizer (DMPS) are the traditional in situ measuring instruments, which use fixed-point direct measurement by counting single particle and can directly obtain the number concentration, mass concentration and surface area concentration.
Many results about aerosol properties using optical particle counters can be found in the existing literatures. In 1997, T. Hussein et al. used a DMPS in Helsinki, Finland to measure the aerosol PSD; studied the daily, monthly and yearly variation; and proved that the temporal variation of PSD was closely related to traffic activities [3]. In 2005, J. Volckensa et al. used an APS to measure the transmission efficiency of solid particles and liquid droplets [4]. In 2016, S. Pfeifer et al. used 15 APSs to compare and analyze the flow-rate accuracy, particle sizing and unit-to-unit variability of the particle number size distribution at the St. Paul Reactor, Minnesota, USA. The results showed that, in order to quantitatively measure aerosol with high quality, a traceable reference method for particle number concentration in the size range of 0.5–3 μm is needed [5]. In 2006, Y. Gu and S. Niu used an APS-3310A to analyze the blowing dusty, floating dusty and dusty days in the Helen Mountain area, and found that the PSD belongs to the log-normal distribution through spectral fitting [6]. In 2008, Z. Liu et al. used an APS to observe the number and volume concentration of atmospheric particles in Beijing before and after the Olympic Games and found that the average particle mass concentrations during the Olympic Games was lower than that during the non-Olympic Games period [7]. In 2011, Q. Shang et al. used the WPS and other instruments to observe and analyze the aerosol concentration in the northern suburbs of Nanjing and found that there was an obvious diurnal variation trend for aerosol concentration, which was closely related to human activities and was greatly affected by relative humidity [8]. In 2015, A. Huang et al. used the solar radiation data obtained by the ASD spectrometer on Yongxing Island and applied the Monte Carlo method to randomly generate four aerosol components to approximate the extinction equation for inverting the aerosol PSD. The results showed that the component proportion of the aerosol in Yongxing Island was similar to the marine aerosol of the standard radiation atmosphere model [9].
In remote sensing methods for detecting and retrieving aerosol PSD, lidar and sun photometer are the main remote sensing instruments. They have their advantages and disadvantages. The advantage of lidar inversion PSD is that it can measure the extinction coefficient and backscattering coefficient profile to retrieve PSD at each height, but it is also some disadvantages, such as being more expensive, costly, affected by weather and background light, worse measurement at day, and limited measurement distance. The sun photometer can use the direct radiation data, namely aerosol optical depth (AOD), to invert the PSD of the entire atmospheric column; the sun photometer is smaller and more portable compared to lidar, but it can only be used during daytime [10]. According to their advantages and disadvantages, many researchers have conducted some observations. In 1983, G. K. Yue et al. obtained aerosol PSD in the stratosphere by measuring the extinction of solar radiation passing through the aerosol medium at two different wavelengths [11]. In 2000, O. Dubovik and M. D. King derived a complete set of aerosol optical properties from sun and sky radiance measurements based on statistical principles [12]. However, the Dubovik algorithm code is not publicly available and cannot be used for CE-318 data acquired at non-AERONET sites. In 2002, I. Veselovskii et al. used the backscattering coefficients at 355, 532 and 1064 nm and the extinction coefficients at 355 and 532 nm to obtain aerosol PSD by an improved minimum deviation algorithm in Lindenberg [13]. In 2006, A. K. Jagodnicka et al. presented a new algorithm based on direct fitting and lidar signal to retrieve the PSD from multi-wavelength lidar profiles in the vicinity of convective clouds in Warsaw [14]. In 2015, M. J. Granados et al. calculated the particle volume size distribution in southeastern Spain using a combination of active and passive remote sensing with the help of the inversion code (LIRIC). The results showed a strong increase in the volume concentration of the fine modes with increasing relative humidity [15]. In 2020, A. P. Chaikovsky et al. discussed the synergy of ground-based and satellite optical remote sensing measurements in atmospheric aerosol studies, introduced an algorithm for processing lidar and radiosensing data that allows the calculation of some microphysical properties, including PSD, and verified the feasibility of the algorithm using remote sensing data from a joint observation network [16]. In China, W. Gong et al. used a sun photometer to observe the AOD of the four seasons from March 2012 to February 2013 in the Wuhan area, and found that, in spring, autumn and winter, the retrieved PSDs were dual-modal but were multimodal in summer [17]. In 2014, J. Mao et al. used AODs taken by a sun photometer to invert aerosol PSD based on the Phillips-Twomey method in the Yinchuan area, and the results showed that the PSD in spring was significantly larger than in the other three seasons, due to dusty days [18]. In 2017, Y. Cui combined the extinction coefficient and back scattering coefficient of 355, 532 and 1064 nm measured by lidar and used a regularization method to invert aerosol PSD in Xi’an with small inversion errors [19].
The inversion of aerosol PSD from the aerosol optical depths (AOD) or extinction coefficients by using remote sensing instruments, such as a sun photometer and lidar, belongs to the Fredholm integral equation of the first kind, it is ill-conditioned. In order to solve this type of equation, the Phillips-Twomey method added a smooth factor to constrain the inversion process, which enhanced the stability of the inverting process [20,21]. In light-scattering particle size measurement technology, based on the traditional non-negative Philips-Twomey (NNPT) algorithm, L. Shan et al. proposed an iterative NNPT (INNPT) algorithm for PSD inversion, which showed that the INNPT inversion algorithms have good inversion accuracy to some extent [22].
In this paper, the truncated singular value decomposition (TSVD) regularization method was used to retrieve the aerosol PSD from the AODs obtained by the sun photometer, and the backward trajectory was used to analyze the aerosol particle sources. In fact, the TSVD regularization method can supply a useful solution for the inversion of PSD using AOD data of sun photometer CE-318 acquired at non-AERONET sites, which has important scientific significance and research value on aerosol microphysical properties. This section introduces the research background and significance of the topic and introduces the status of research on ground monitoring, as well as the remote sensing measurement of PSD. Section 2 mainly presents the inversion principle of aerosol PSD from AODs. The experiment results are analyzed in Section 3. The main conclusions are discussed in Section 4.

2. Inversion of PSD

According to the Mie scattering theory, the AOD and aerosol PSD of the whole atmosphere column can be expressed as
τ ( λ ) = r 0 r M π r 2 Q e x t ( r , λ , m ) n ( r ) d r = r 0 r M 3 4 r Q e x t ( r , λ , m ) v ( r ) d r
where τ ( λ ) denote the AOD; r is the particle radius; m is the negative refractive index; λ is the wavelength, and K ( r , λ , m ) = π r 2 Q e x t ( r , λ , m ) is defined as the kernel function; Q e x t ( r , λ , m ) is the extinction efficiency factor; n ( r ) is the aerosol PSD to be determined, and v(r) is the particle volume size distribution. Because the Yinchuan area is surrounded by four deserts, namely Badain jaran Desert, Ulan buh Desert, Tengger Desert and Mu us Desert, the dust weather is frequent, dust particles are often the dominant aerosol type, and the complex refractive index can be defined as 1.55 + 0.01i [23,24,25]. It should be pointed out that the fixed complex refractive index will inevitably introduce errors in the retrieval of PSD, but the errors will cancel each other out in the optical calculation. As discussed by King [26], the sensitivity of the refractive index of spectral attenuation measurement is quite weak. In this paper, λ is wavelengths of CE-318 sun photometer, including 1640, 1020, 870, 670, 550, 440, 380 and 340 nm. The value range of r is 0.01 to 5 μm, and the step value is 0.01 μm, so there are a total of 500 values for r.
Equation (1) belongs to the Fredholm integral equation of the first kind; in fact, the extinction efficiency factor is oscillating and unstable with the change of scale, so the equation is ill-conditioned. It means that a small disturbance in the data will lead to a larger disturbance in the approximate solution. Therefore, regularization is needed to solve the ill-posed problem after discretization [27]. In this paper, the integral equation will be discretized by the compound trapezoidal formula, and then the PSD will be retrieved by the TSVD and Tikhonov regularization method, respectively. Figure 1 shows the inversion flow chart of aerosol PSD. Firstly, AODs are obtained by a sun photometer, and the kernel function is obtained by the Mie scattering theory. After the discretization of the integral equation, the L curve was used to obtain regularization parameters; both the TSVD and Tikhonov regularization method were used to solve X, which was the aerosol particles volume size distribution, and then the aerosol particles volume size distribution was converted to the number size distribution.

2.1. Discretization

As mentioned above, the Fredholm integral equation of the first kind is discretized by the complex trapezoidal formula [28]; therefore, the discretization of Equation (1) can be given by [29]
τ ( λ ) = h 2 3 4 r Q e x t ( r 1 , λ , m ) v ( r ) + h j = 2 n 1 3 4 r Q e x t ( r j , λ , m ) v ( r ) + h 2 3 4 r Q e x t ( r n , λ , m ) v ( r )
It is assumed that the separation error can be ignored. Equation (1) can be written by
τ = A n
where A is the kernel function, which is an 8 × 500 matrix; τ is the AOD for the 8 wavelengths, which is a column vector of 8 × 1, and N is the aerosol PSD, which is denoted by a column vector of 500 × 1. They can be expressed as:
A = [ A i j ] = [ ω 1 K ( λ 1 , r 1 ) , ω 2 K ( λ 1 , r 2 ) , ω n K ( λ 1 , r n ) ω 1 K ( λ 2 , r 1 ) , ω 2 K ( λ 2 , r 2 ) , ω n K ( λ 2 , r n ) ω 1 K ( λ m , r 1 ) , ω 2 K ( λ m , r 2 ) , ω n K ( λ m , r n ) ]
  τ = [ τ 1 τ 2 τ m ] = [ τ ( λ 1 ) τ ( λ 2 ) τ ( λ m ) ] N = [ n 1 n 2 n n ] = [ n ( r 1 ) n ( r 2 ) n ( r n ) ]
For aerosol PSD, the kernel function K ( r , λ , m ) = π r 2 Q e x t ( r , λ , m ) is the number of concentration weight functions, when r is very small, according to the theory of Mie scattering theory; Q e x t tends to 0, and the weight function obtained is very small. With the gradual increase of r, the weight function also increases relatively and differs by many orders of magnitude from that when r is relatively small, which causes a large error and affects the inversion accuracy. For volume size distribution, the kernel function is 3 4 r Q e x t ( r , λ , m ) ; when r is smaller,   1 r is larger, which can effectively adjust the value of the weight function. The relationship between the aerosol particle volume size distribution and number size distribution is defined by
d N d r = 3 v ( r ) 4 π r 3
Therefore, firstly, the aerosol particles volume size distribution is retrieved, and then the particle number size distribution is obtained according to Equation (4).

2.2. Regularization

In the decentralization process, since there exists separation error and Equation (3) is an integral equation in essence, the solution of Equation (3) is often not unique. For Equation (3), the singular value of matrix A gradually attenuates to 0 and the matrix A is ill-conditioned (the conditions number of A is very large), when there is little difference in two PSDs, namely N1 and N2, but the difference between τ1 and τ2 will be very large. In aerosol solution properties, the uniqueness of the solution can be proved, and its actual existence depends on the correctness of the Mie scattering theory. In fact, for discrete ill-conditioned equations, the ill-conditioned problems do not mean that meaningful approximate solutions cannot be calculated. Conversely, the effect of ill conditions means that the standard approach cannot be used to calculate such a solution directly, while some more complex approaches are necessary to ensure that a meaningful solution can be calculated, which is the basic goal of the normalization approach [30]. In this paper, the TSVD and the Tikhonov regularization algorithm are selected to invert the aerosol PSD in Yinchuan area.

2.2.1. Selection of Regularization Parameters

The selection of regularization parameters is the trade-off among fidelity of controlling the retrieved data and the input data and the smoothness of the solution. The commonly used normalization parameter selection methods include the Morozov discrepancy principle, the general cross-validation (GCV) method and the L curve method [31]. The Morozov discrepancy principle often depends on the noise situation in the data; in many cases, the noise level is unknown, so generally an estimation or assumption is taken, but this assumption may be wrong. Even given precise noise, the regularization result obtained by this method is probably over smooth. For the GCV method, the minimum point obtained is smooth, which increases the uncertainty of the minimum point and causes inaccuracy in the regularization results. Compared with the above two methods, when the singular value of coefficient matrix A has been calculated, the L curve regularization parameter can effectively overcome the defects of the above two methods [32].
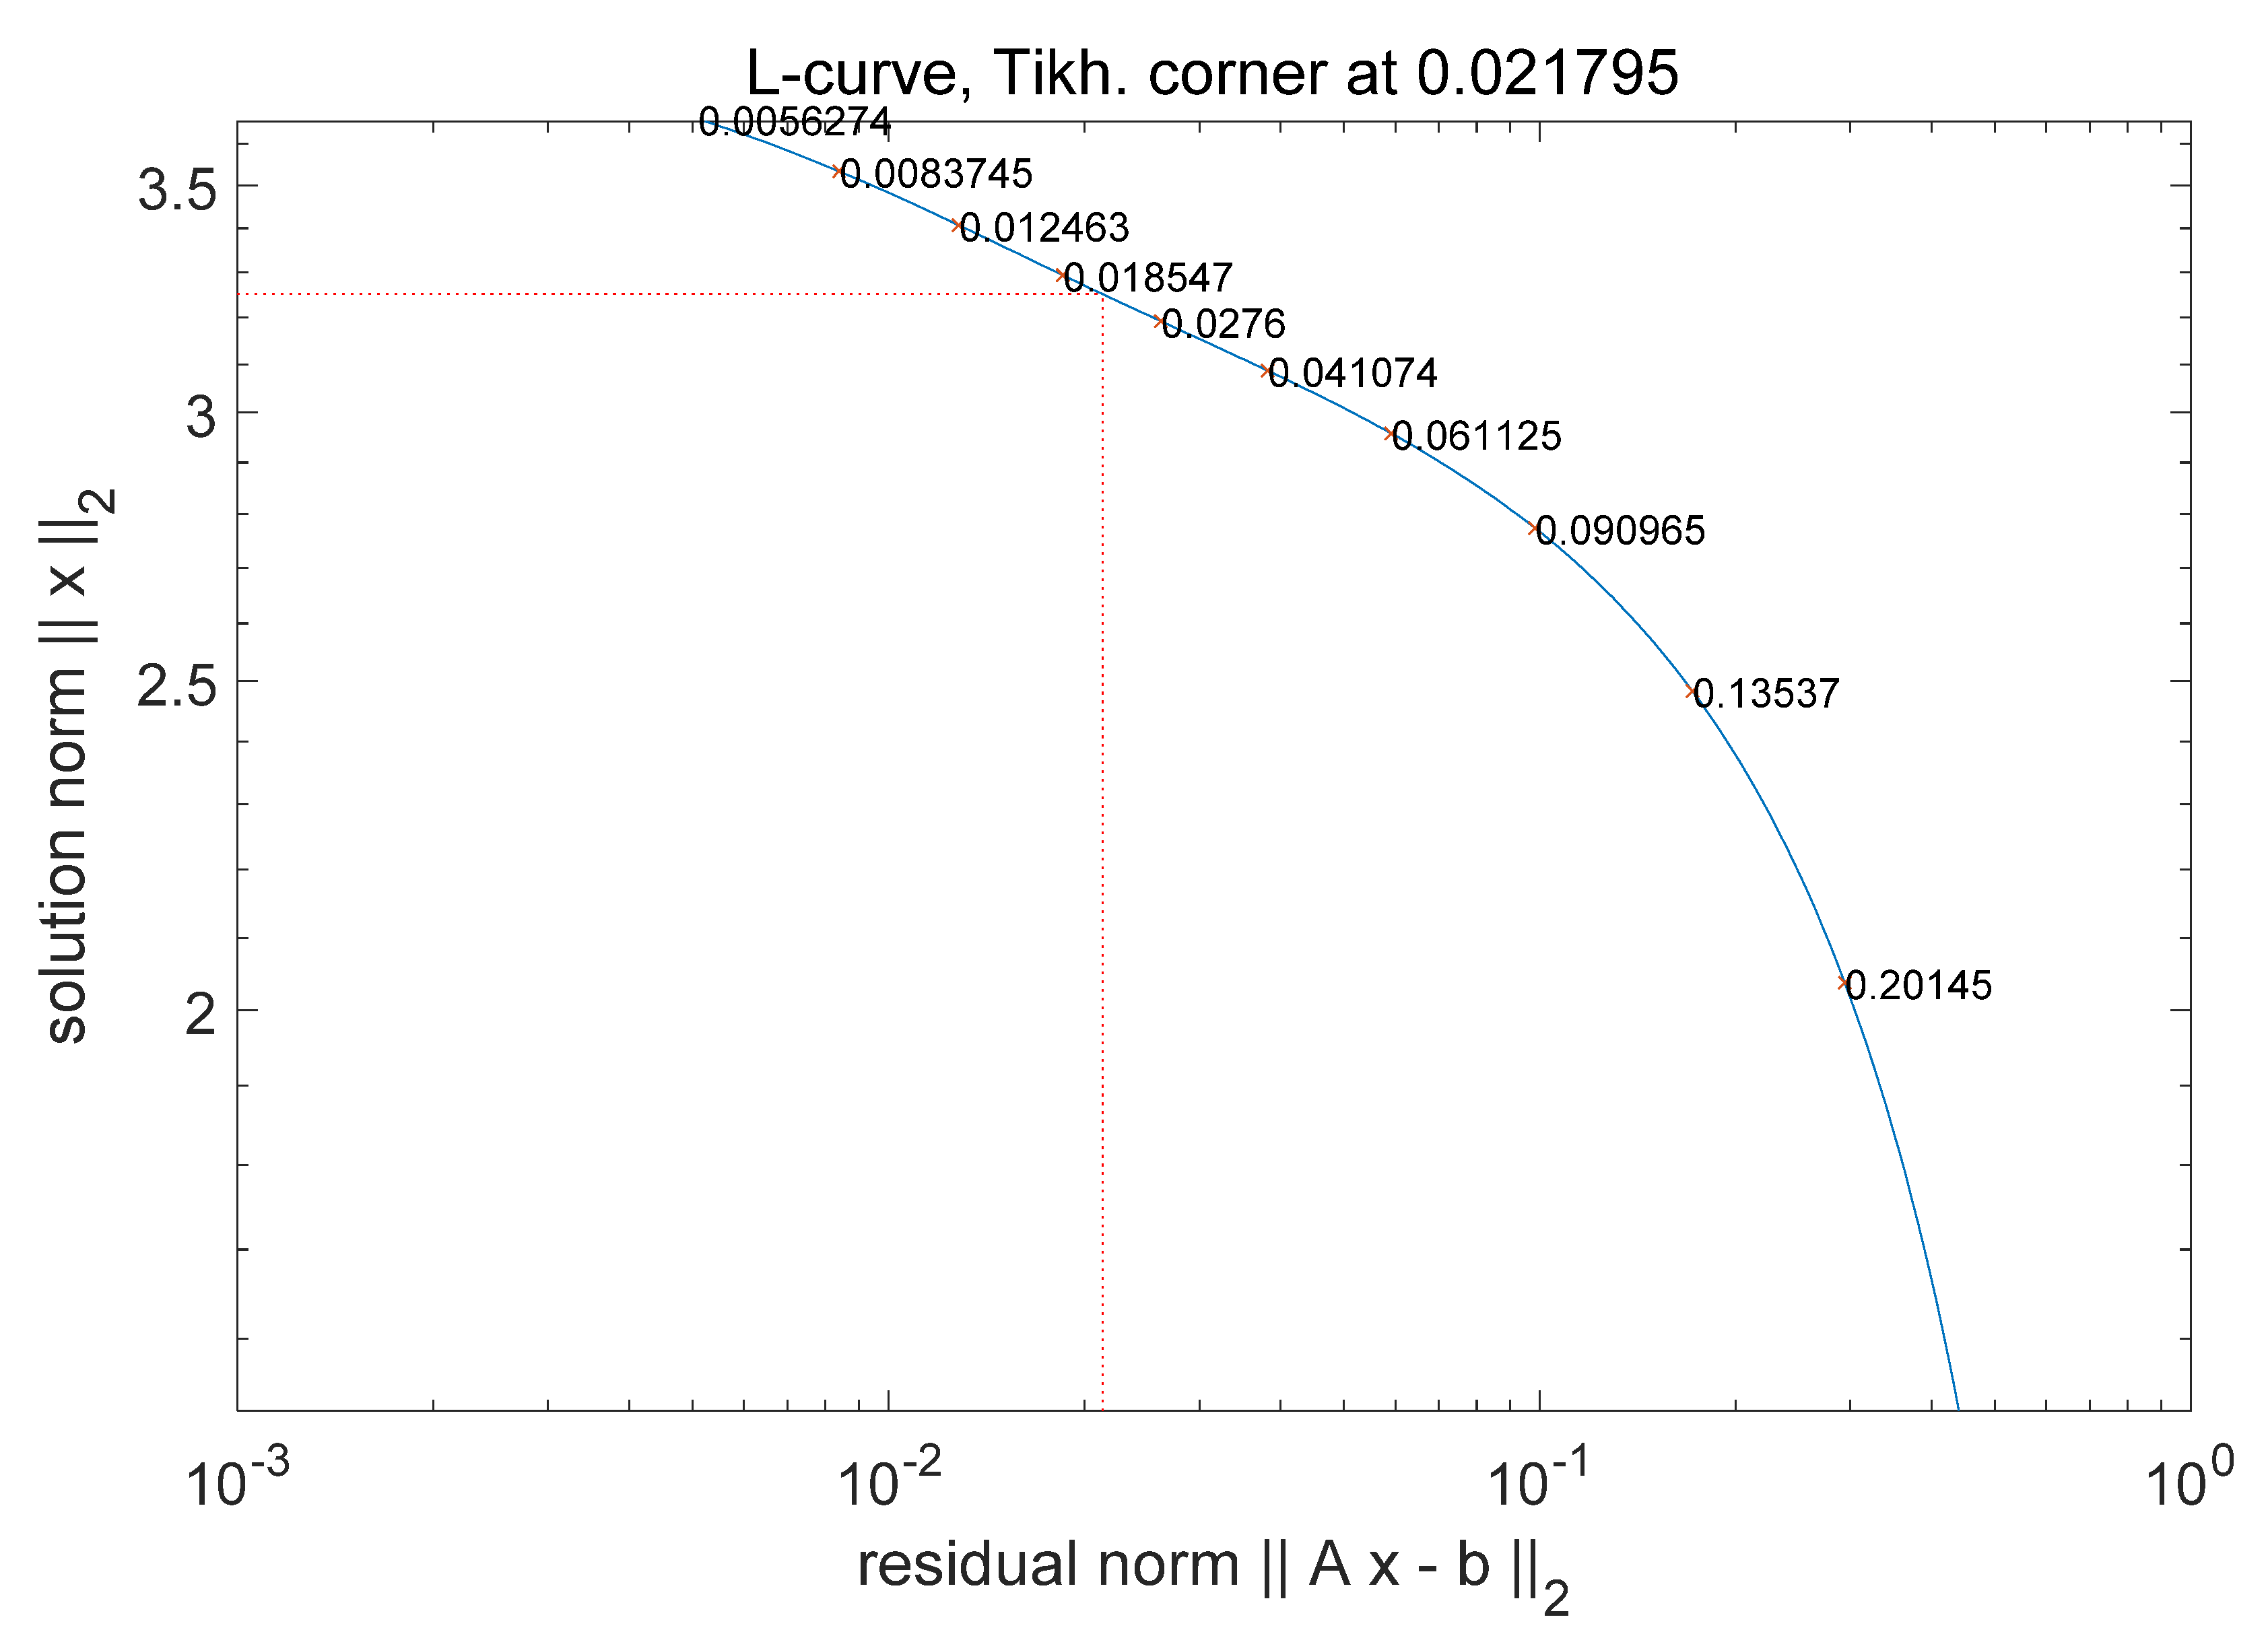
The L curve method is a heuristic method to determine regularization parameters under the condition that the original data error level is unknown [33]. On the log-log axis, by using of the norm of solutions and norm of residual error, the solutions of possible regularization parameters are drawn, and most of the curves formed are L-shaped, so it is called the L curve method. In this way, the L curve clearly displays the trade-off between minimizing the residual norm and the side constraint. A set of λ in the inversion process is chosen as an example. The regularization parameter λ can be determined by comparing the results of the curve shown in Figure 2. A in the figure has the same meaning as Equation (4); x is the N sought in Equation (4), and b represents τ. From Figure 2, the abscissa represents the perturbation error, i.e., the residual bound norm, the ordinate represents the regularization error, i.e., the solution-bound norm, It can be seen from the figure that the perturbation error and the regularization error can be well-balanced when λ = 0.021795, which is denoted by the red dashed line points.

2.2.2. TSVD Regularization

For τ = A n , n = A 1 τ , the matrix A (M*N) can be divided into U, Σ and V according to the singular value decomposition
A = U Σ V T
Σ = d i a g ( δ 1 , , δ n )  
where U is the M*N matrix; V is N*N matrix; Σ is M*N matrix, and δ i is the singular value of A. Therefore A 1 can be given by
A 1 = V Σ 1 U T
If we introduce
Σ λ 1 = d i a g ( δ 1 δ 1 2 + λ , , δ N δ N 2 + λ )
According to Equation (6), it can be written by [34]
n λ = i = 1 N δ i δ i 2 + λ ( u i T τ ) v i
The regularization parameter can be obtained from the L curve.

2.2.3. Tikhonov Regularization

Tikhonov regularization is a classic and the most commonly used regularization method. The basic idea is that the minimum deviation of the integral value in Equation (1), specified on the right hand side τ = τ ^ ϵ (affected by error), is stabilized by a auxiliary continuous non-negative function S. This “stabilizer” limits the smoothness of the solution by fixing the appropriate degree of regularity. Therefore, in Tikhonov regularization, the integral Equation (1) is substituted into the following minimum problem:
m i n n ( 0 K ( l , r , m ) n ( r ) d r τ ( l ) 2 + λ S n )
where ‖•‖ stands for the norm function; Sn(r) is the selected smoothing function, and the p-order differential function is expressed as:
S n ( r ) = 0 + | d p n ( r ) d r p | 2 d r     p = 0 , 1 , 2 ,
The use of this function takes advantage of the empirical smoothing property of a p-order functional because it involves conditions for the function and its derivatives. The most common choice is p = 2.
The minimum problem of Equation (12) can be discretized as:
R n m i n λ ( n ) = ( A n τ 2 2 + λ H n 2 2 ) n m i n
where H represents the discrete approximation of a differential operator of order p, and the rank of H is p. The regularization parameter λ can be obtained from the L-curve. In fact, the solution of Equation (14) can be obtained by fitting the regularization operator R λ for n inversions, and the expression of n λ is given by:
n λ = R λ 1 ( τ ϵ ) = R λ 1 ( τ t r u e + ϵ )

3. Experiment Results and Analysis

The Yinchuan area belongs to the typical semi-arid climate in northwest China and has a high altitude, a dry climate, and, especially in spring, frequent dusty weather. A sun photometer CE318 is located at the roof of No. 17 teaching building in North Minzu University (38.497 N, 106.103 E) and started to work in September 2012. Up to now, more than 110,000 measurements were carried out. In this paper, the AODs obtained by the sun photometer CE318, including four seasons, floating dusty days, blowing dusty days and hazy days, were selected as input to invert the PSDs. The AOD in this paper is inverted by the ASTPWin software that comes with CE-318, and the Langley method is used to calibrate the direct radiation data. When it is rainy, the rain sensor works and the sun photometer stops working, or when there is strong sandstorm weather and heavy hazy, the visibility is too low to cause the instrument to work continuously. When clouds appear, the presence of clouds will cause a significant increase in AOD, which can be distinguished and filtered by the difference between the left and right scan values.

3.1. Analysis of AODs in Different Seasons and Different Weathers

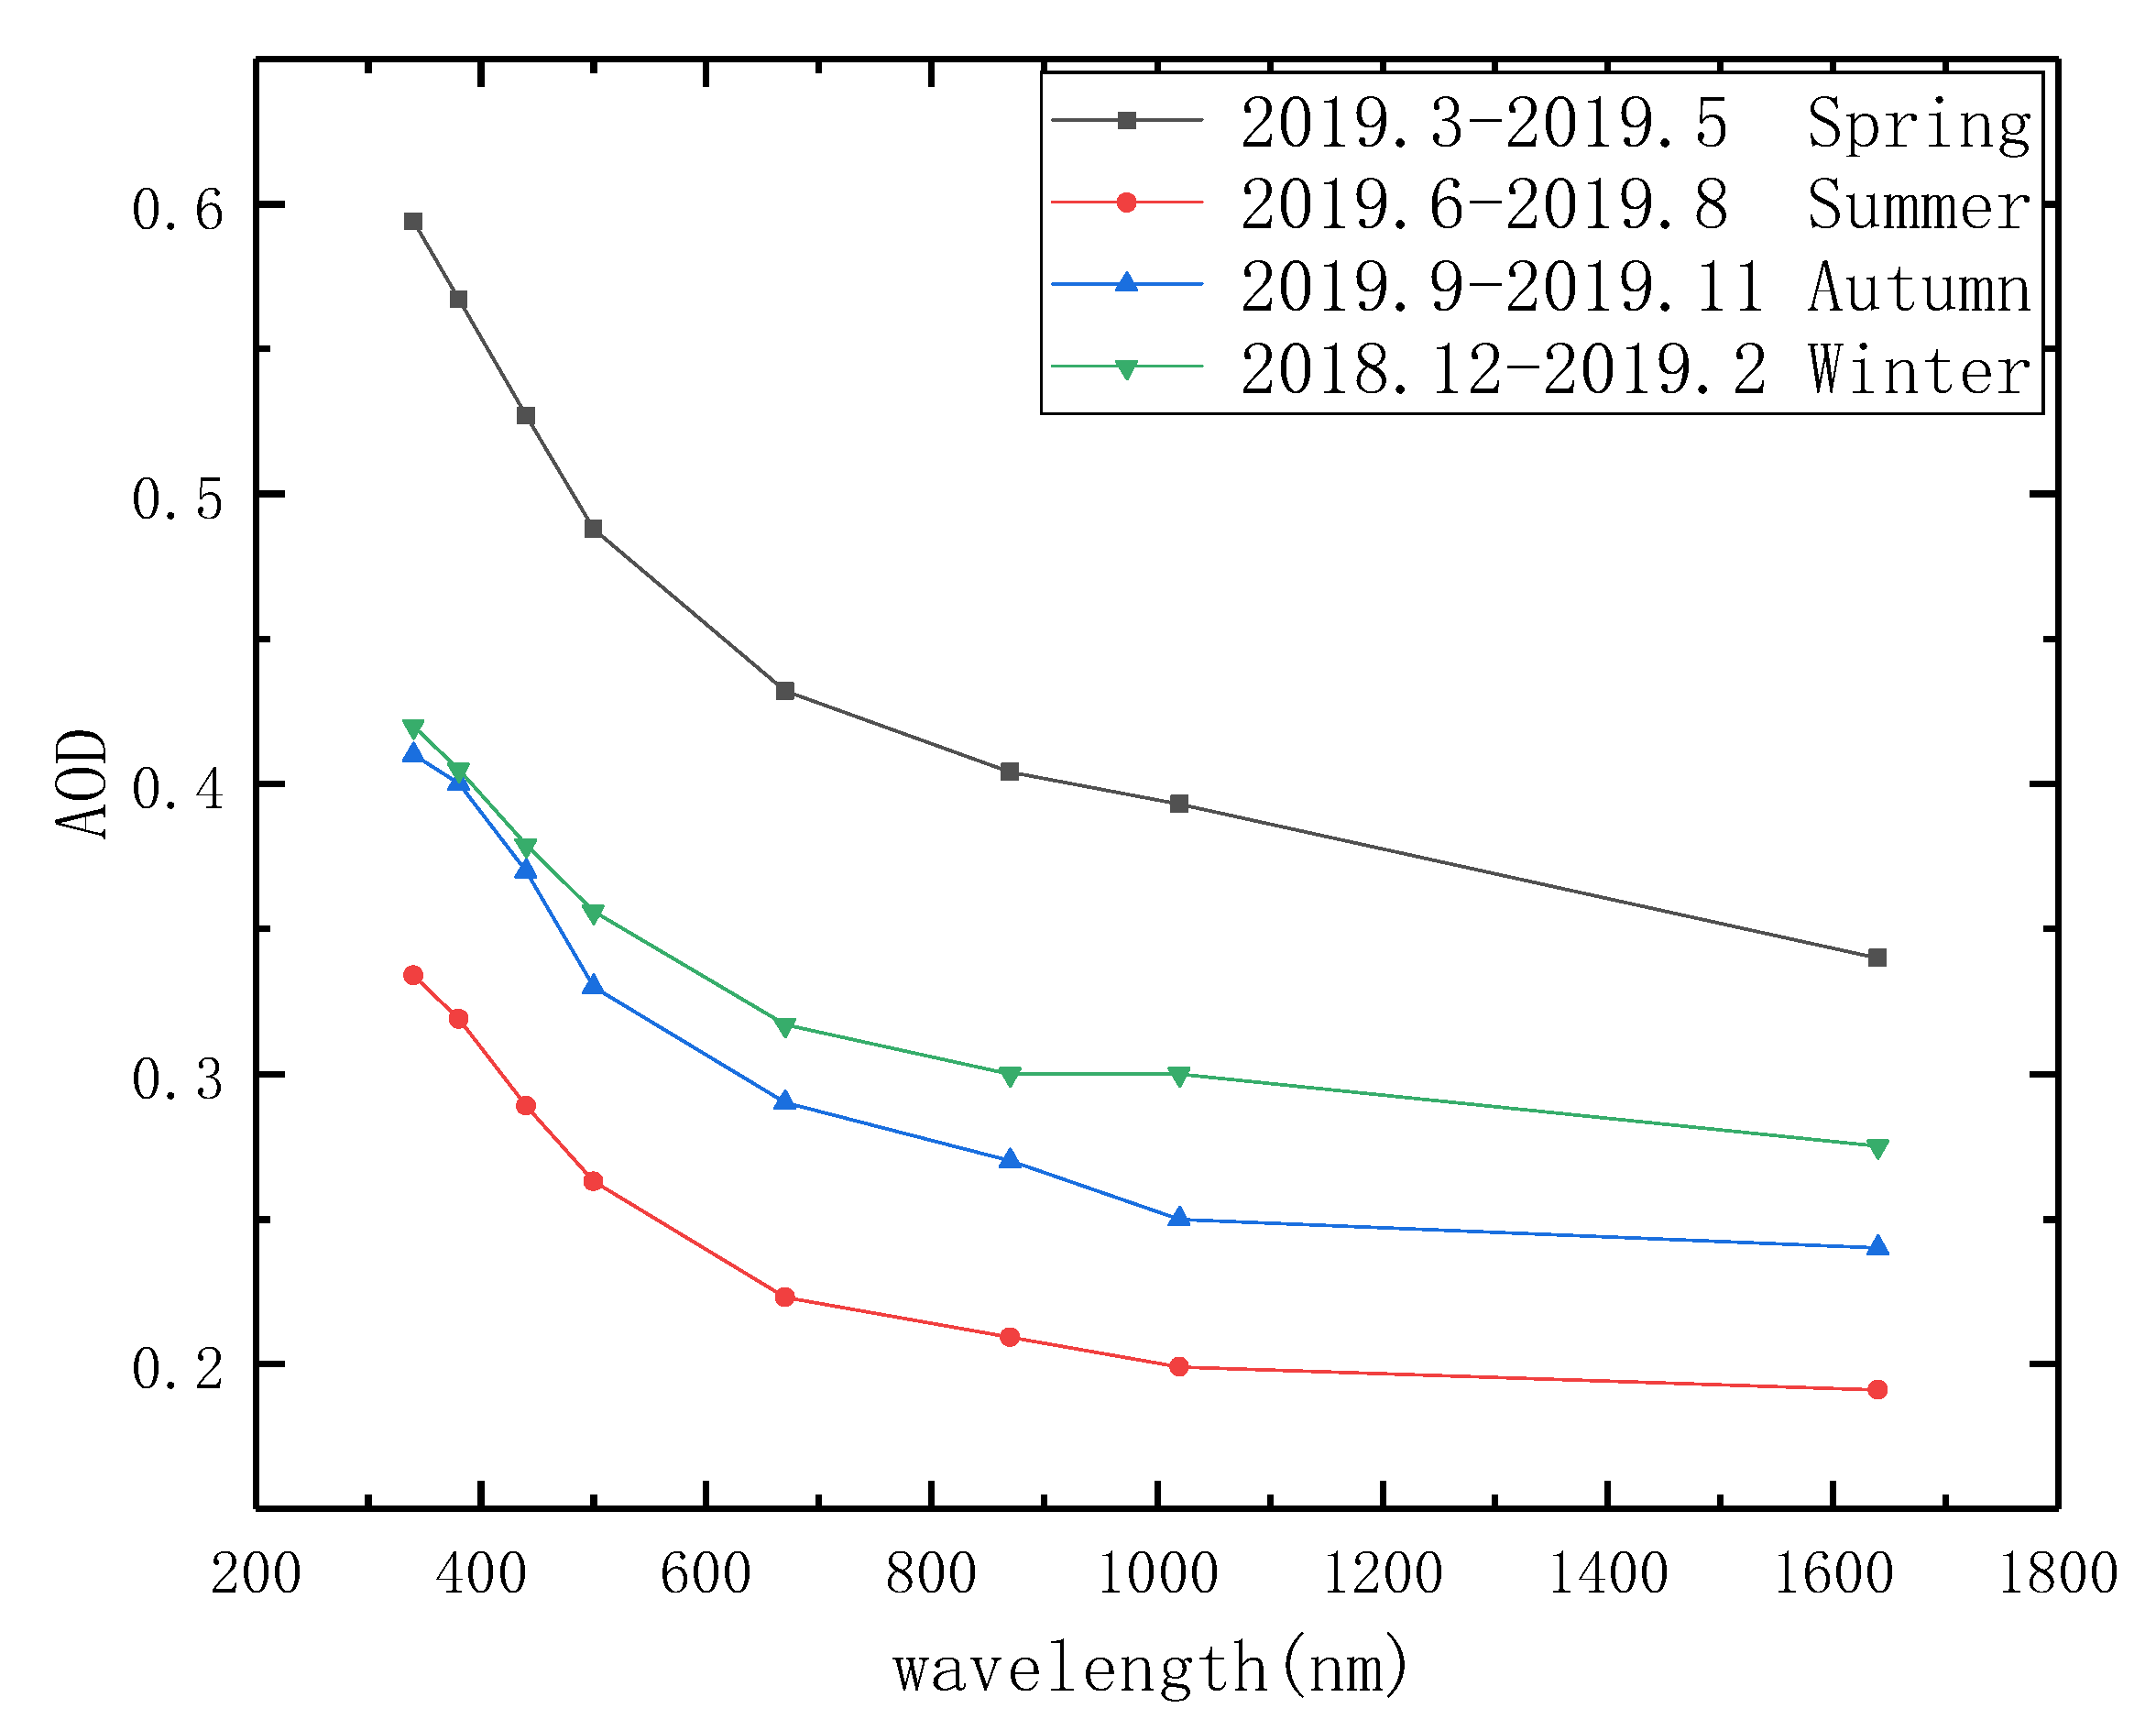
Figure 3 shows the AOD of the four seasons from 2018 to 2019 after excluding weather effects and large errors. It can be seen that the average AOD was higher than that of the other three seasons due to frequent dusty weather in spring. In summer and autumn, due to high precipitation and vegetation protection, the average AOD was relatively low. In winter, the temperature dropped sharply and the surface was frozen, and the atmosphere was relatively stable and the vertical movement of airflow was weak, so that the average AOD was only lower than that of spring.
In this paper, different weather conditions were selected to study the atmospheric aerosol properties of the Yinchuan area. Table 1 lists the weather conditions, floating dusty days, blowing dusty days, hazy days and sunny days, and Figure 4 shows the corresponding AODs. In Figure 4, the four sets of data all used the AODs at a similar time in the afternoon. Because the AOD can be influenced by human activity at this time of day to the maximum, and the sun photometer CE-318 is less influenced by variables such as visibility at this time of day, these time points were chosen for our inversion.
In this paper, the sunny day on 26 July 2019 was selected as the background weather. From Table 1, along with the northwest wind, the floating dusty day and blowing dusty day, which appeared on 20 March 2019 and 25 May 2018, respectively, had poor AQIs. The AODs on the two dusty days were relatively higher than on sunny days. On 9 January 2020, hazy weather occurred and the AOD was highest. Moreover, it is clear that with the increase of wavelengths, the AODs decreased.

3.2. Inversion of Aerosol PSD in Different Seasons and Different Weathers

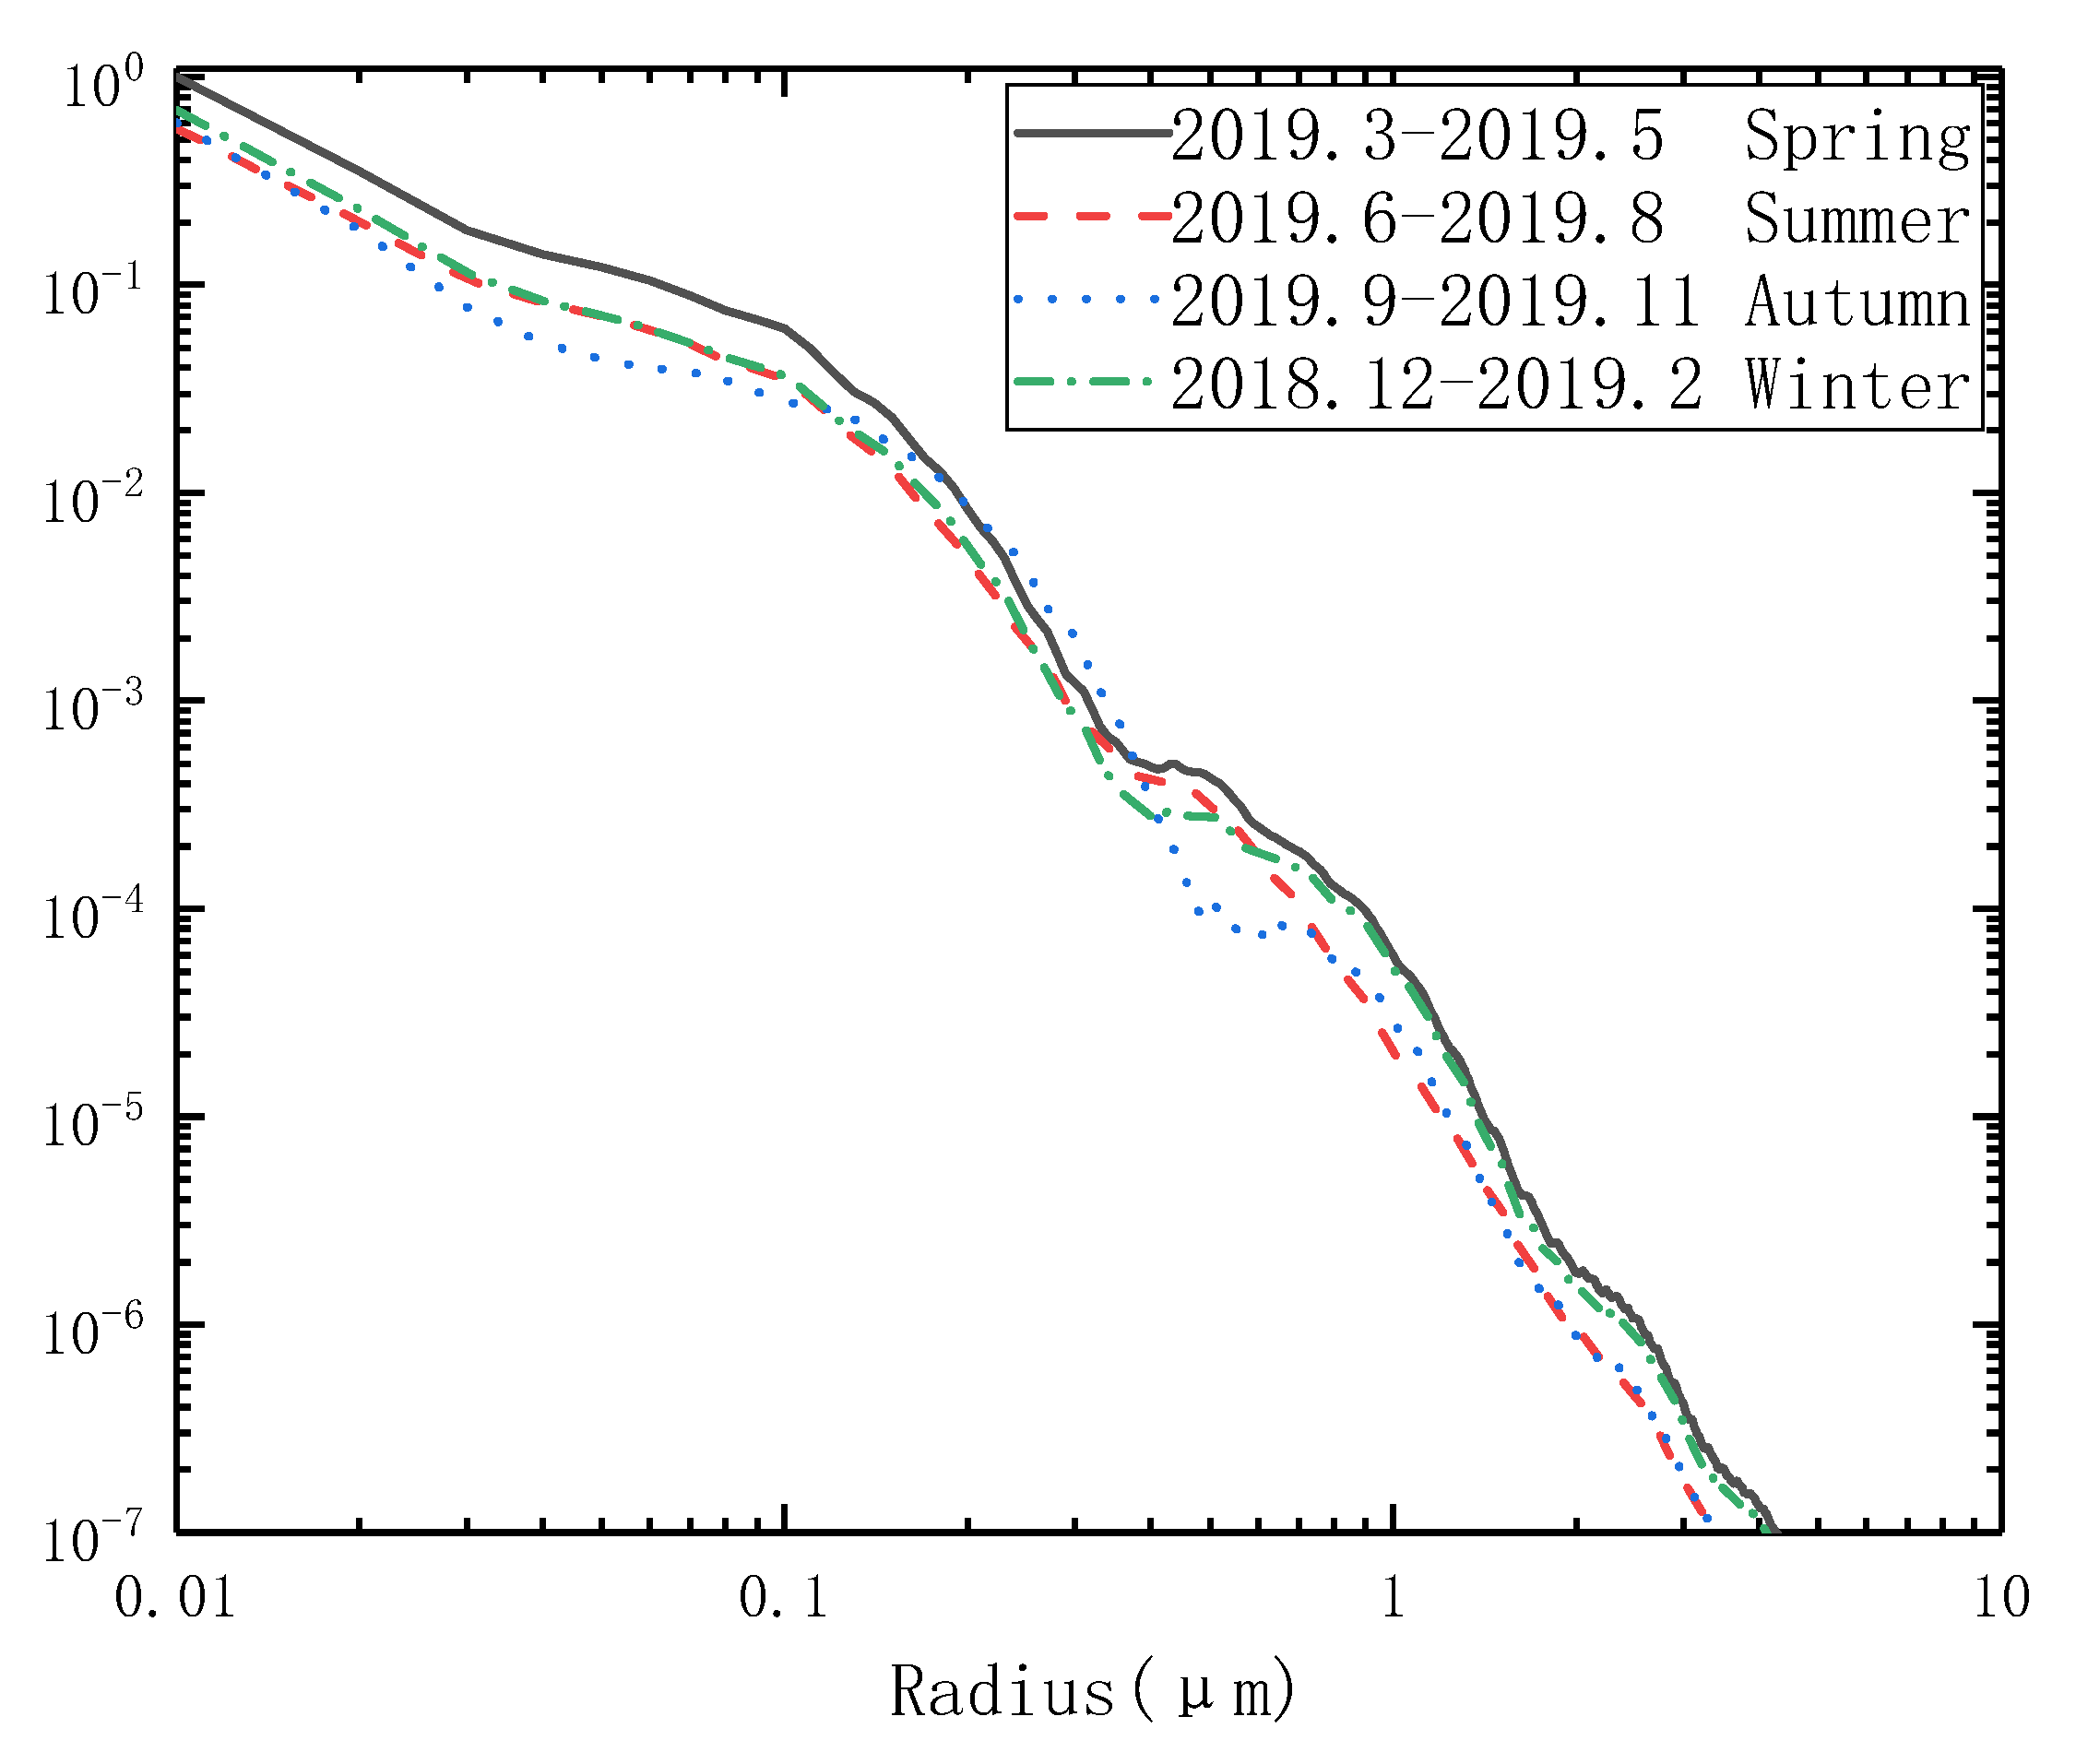
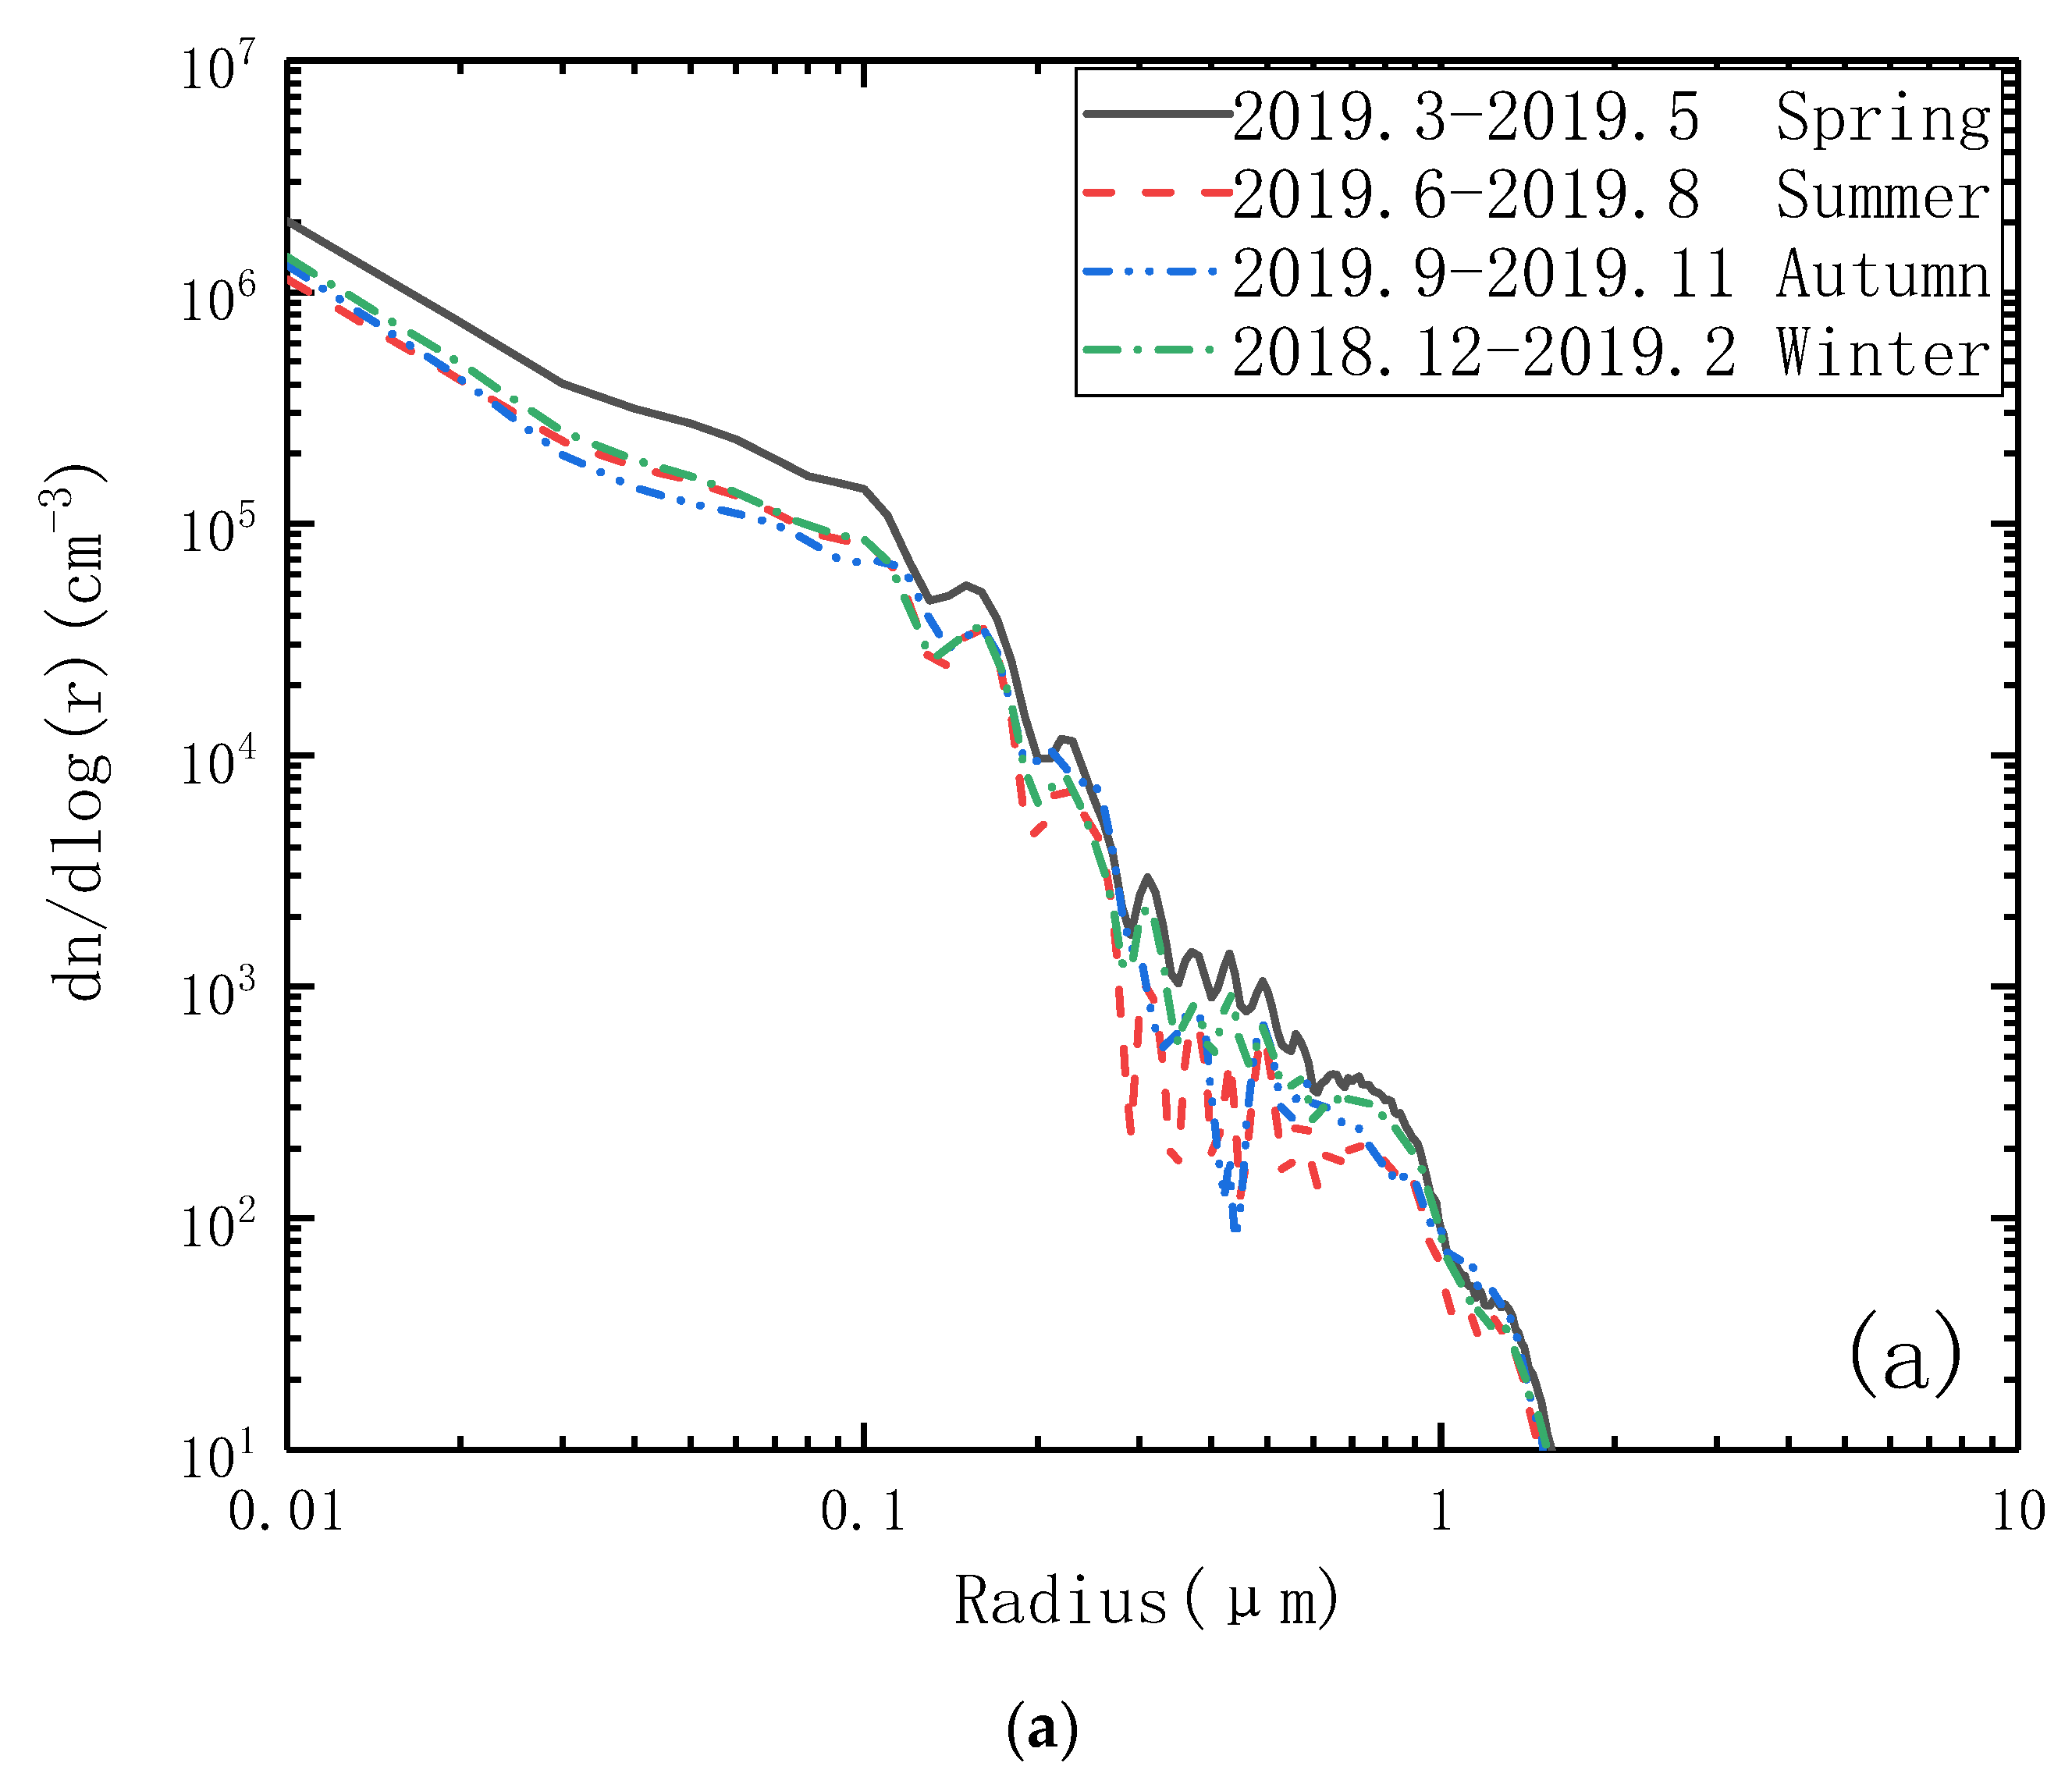
Figure 5 shows the aerosol PSDs of all seasons in the Yinchuan area from the AODs shown in Figure 3 inverted by TSVD regularization algorithm. From Figure 5, the PSDs of four seasons in Yinchuan area were mainly Junger size distribution; there were basically two peaks, and the peaks of the four seasons were located at different radii.
It can be seen that, in spring, whether for fine particles or coarse particles, the aerosol PSD was higher than the other three seasons, and there were two peaks at radii of 0.1 μm and 0.5 μm, respectively. In spring, the strong northwest wind brought dust particles from the several deserts to the Yinchuan area, which made the air filled with more dust particles; moreover, in spring, the rise in temperature accelerated the gas–particle conversion. These factors resulted in aerosol particle concentration in dusty weather to be higher than on sunny days. In fact, in spring and early summer, dust aerosol particles were dominant in air. This is consistent with the results of [13].
In winter, there were also two peaks at radii of 0.1 μm and 0.5 μm, respectively. The aerosol PSD with a radius less than 0.3 μm in winter was relatively higher than that in summer or autumn. This is because, in winter, there were a large amount of fine smoke particles from coal-burning for heating was produced in Yinchuan; meanwhile, the influence of cold air and high pressure on the East Asian continent made the atmospheric structure very stable and the wind relatively small; therefore, the fine smoke particles were not easy to spread and were dominant in air. Conversely, in summer, since there was no coal-burning for heating and the atmosphere was very unstable, the aerosol PSD with a radius less than 0.3 μm was lowest.
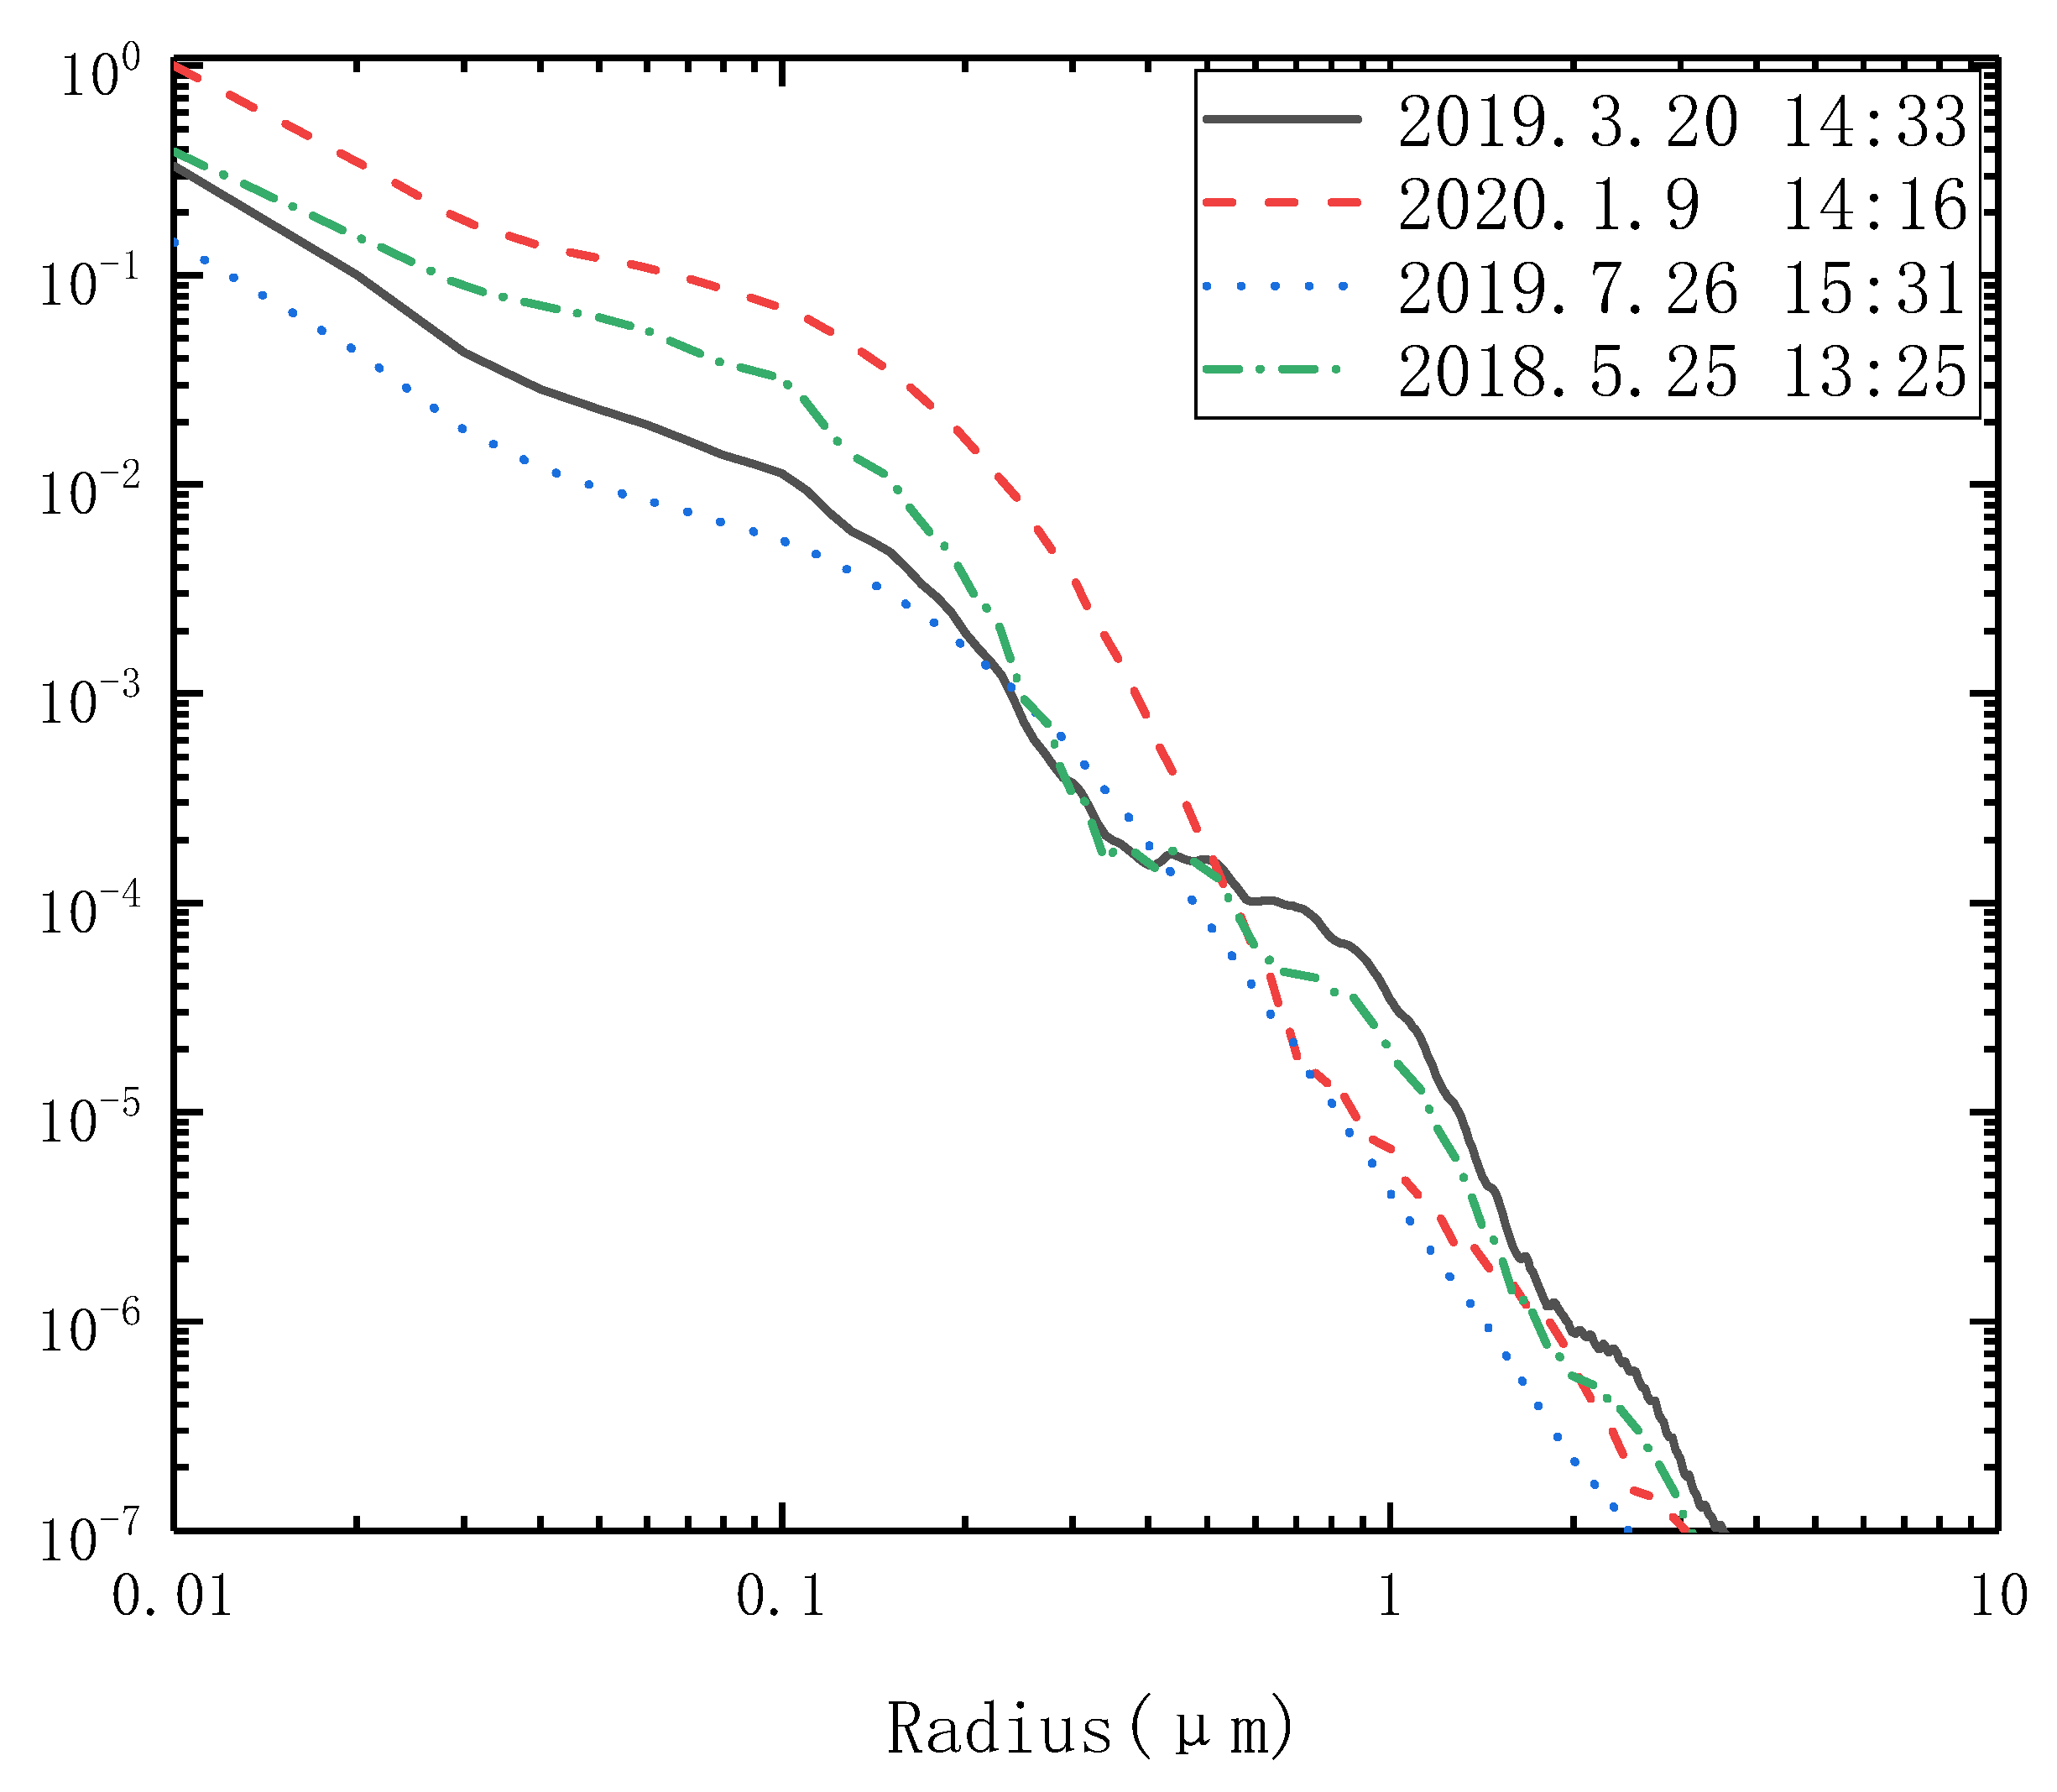
Figure 6 shows the aerosol PSDs on floating dusty days, blowing dusty days, hazy days and sunny days from the AODs shown in Figure 4, inverted by the TSVD regularization algorithm. The PSD of sunny days, on 26 July 2019, was selected as the background and was lower than that of other three days. However, the aerosol particles concentration on the hazy day was significantly higher than that of the other three weather conditions.
The floating and blowing dust days of the dust days, on 20 March 2019 and 25 May 2018, basically showed a double-peak structure, which appeared at a radius of 0.1 μm and 1 μm, respectively. In dusty days, the northwest wind carried a large number of dust particles to the Yinchuan area and incorporated with some fine particles to form coarse particles, resulting in an increase in coarse modal particles, and, simultaneously, the smaller diameter dust particles also increased the fine modal particle concentration. Comparing the two dusty days when the radius was less than 0.5 μm, the fine particles concentration on floating dusty days was lower than on blowing dusty days, but when the radius was more than 1 μm, the opposite was true: there was a significant increase for coarse particles on floating dusty days than that on blowing dusty days.
On hazy days, on 9 January 2020, the particle concentration was the highest, which was a significant increase compared with sunny days, especially for fine modal particles. Moreover, comparing two dusty days with one hazy day, when the particle radius was less than 1 μm, the particle number concentration on the hazy day was larger; when greater than 1μm, the particle number concentration on two dusty days was larger, which indicates that there were more fine particles on the hazy day and more coarse particles on two dusty days.
In the inversion process, the perturbation error and regularization error could be obtained through L curve. The errors of four seasons, as well as all kinds of weather, are listed in Table 2.
It can be seen that the perturbation error is much smaller than the regularization error, that the errors on hazy days are larger than those on other days, and the errors in summer are smaller than those in other three seasons. Error is inevitable in the calculation process, but it is also an acceptable state.
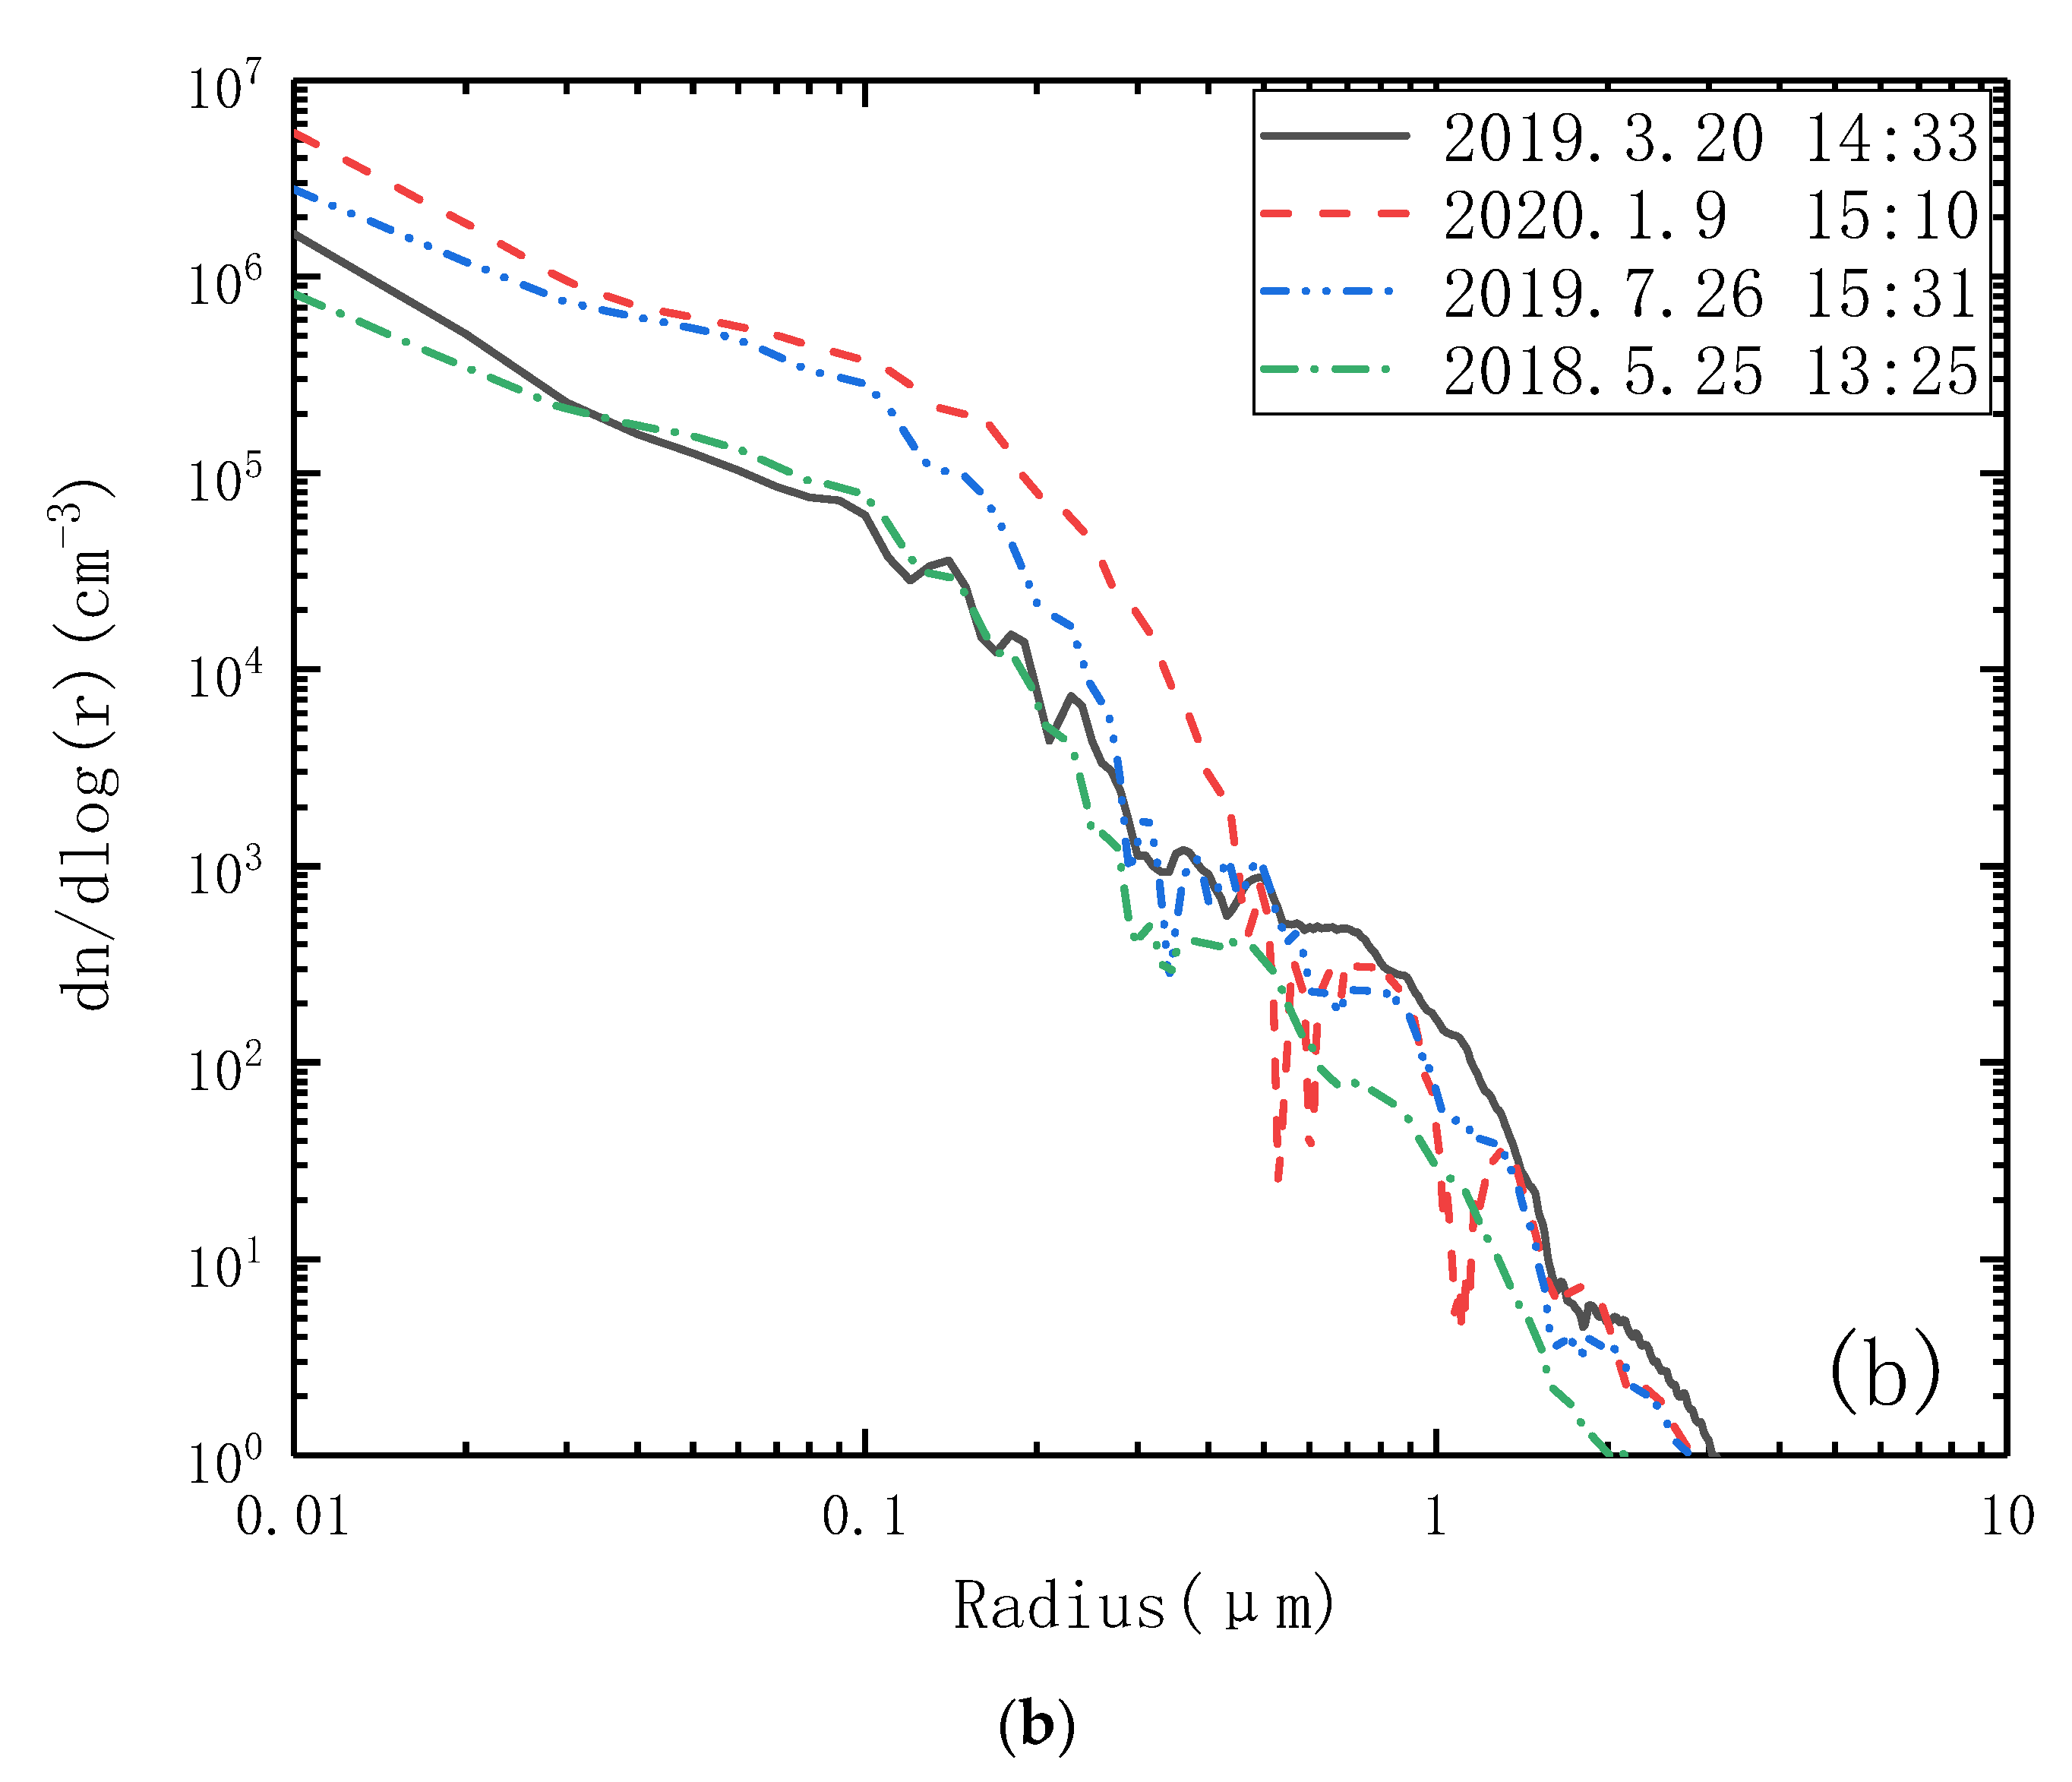
In order to prove the inversion effect of the TSVD regularization algorithm, the Tikhonov regularization algorithm was also adopted to retrieve the aerosol PSD, which used the same AOD as the TSVD regularization algorithm. The inverted PSDs in spring, summer, autumn and winter and four special days is shown in Figure 7.
It can be seen that, compared with the TSVD algorithm, the PSDs retrieved by the Tikhonov algorithm fluctuate greatly from 0.2 to 2 μm, and the regularization fitting effect is not very ideal. There is an order of magnitude difference in PSDs for TSVD and Tikhonov algorithm, which may be due to the fact that the Tikhonov regularization algorithm differs from the TSVD regularization algorithm. It discards some unreasonable values (i.e., solutions corresponding to the least singular value), resulting in it being too poorly constrained and even negative values when some AODs are chosen. Moreover, the regularization error and perturbation error of the Tikhonov regularization algorithm are calculated and listed in Table 3.
By comparing Table 2 and Table 3, it is clear that the perturbation error of the Tikhonov algorithm is smaller, but the regularization error is larger than that of the TSVD regularization algorithm. The results are determined by both errors, but if the regularization error is larger, the number concentration of the inverse performance fluctuates too much, the regularization effect is not very satisfactory, and the resulting results will be inaccurate, so the use of the TSVD regularization algorithm inversion is more reasonable than Tikhonov.
In order to verify whether the large regularization error is due to the selection of the average complex refractive index, the complex refractive index of the hazy days was selected for the TSVD regularization inversion. Figure 8 shows the corresponding inversion result, and Table 4 lists the corresponding errors. It is clear that the PSDs were very close to overlapping. Also the regularization error and the perturbation error of m = 1.51612 + 0.1178i were very similar with that of m = 1.55 + 0.01i.
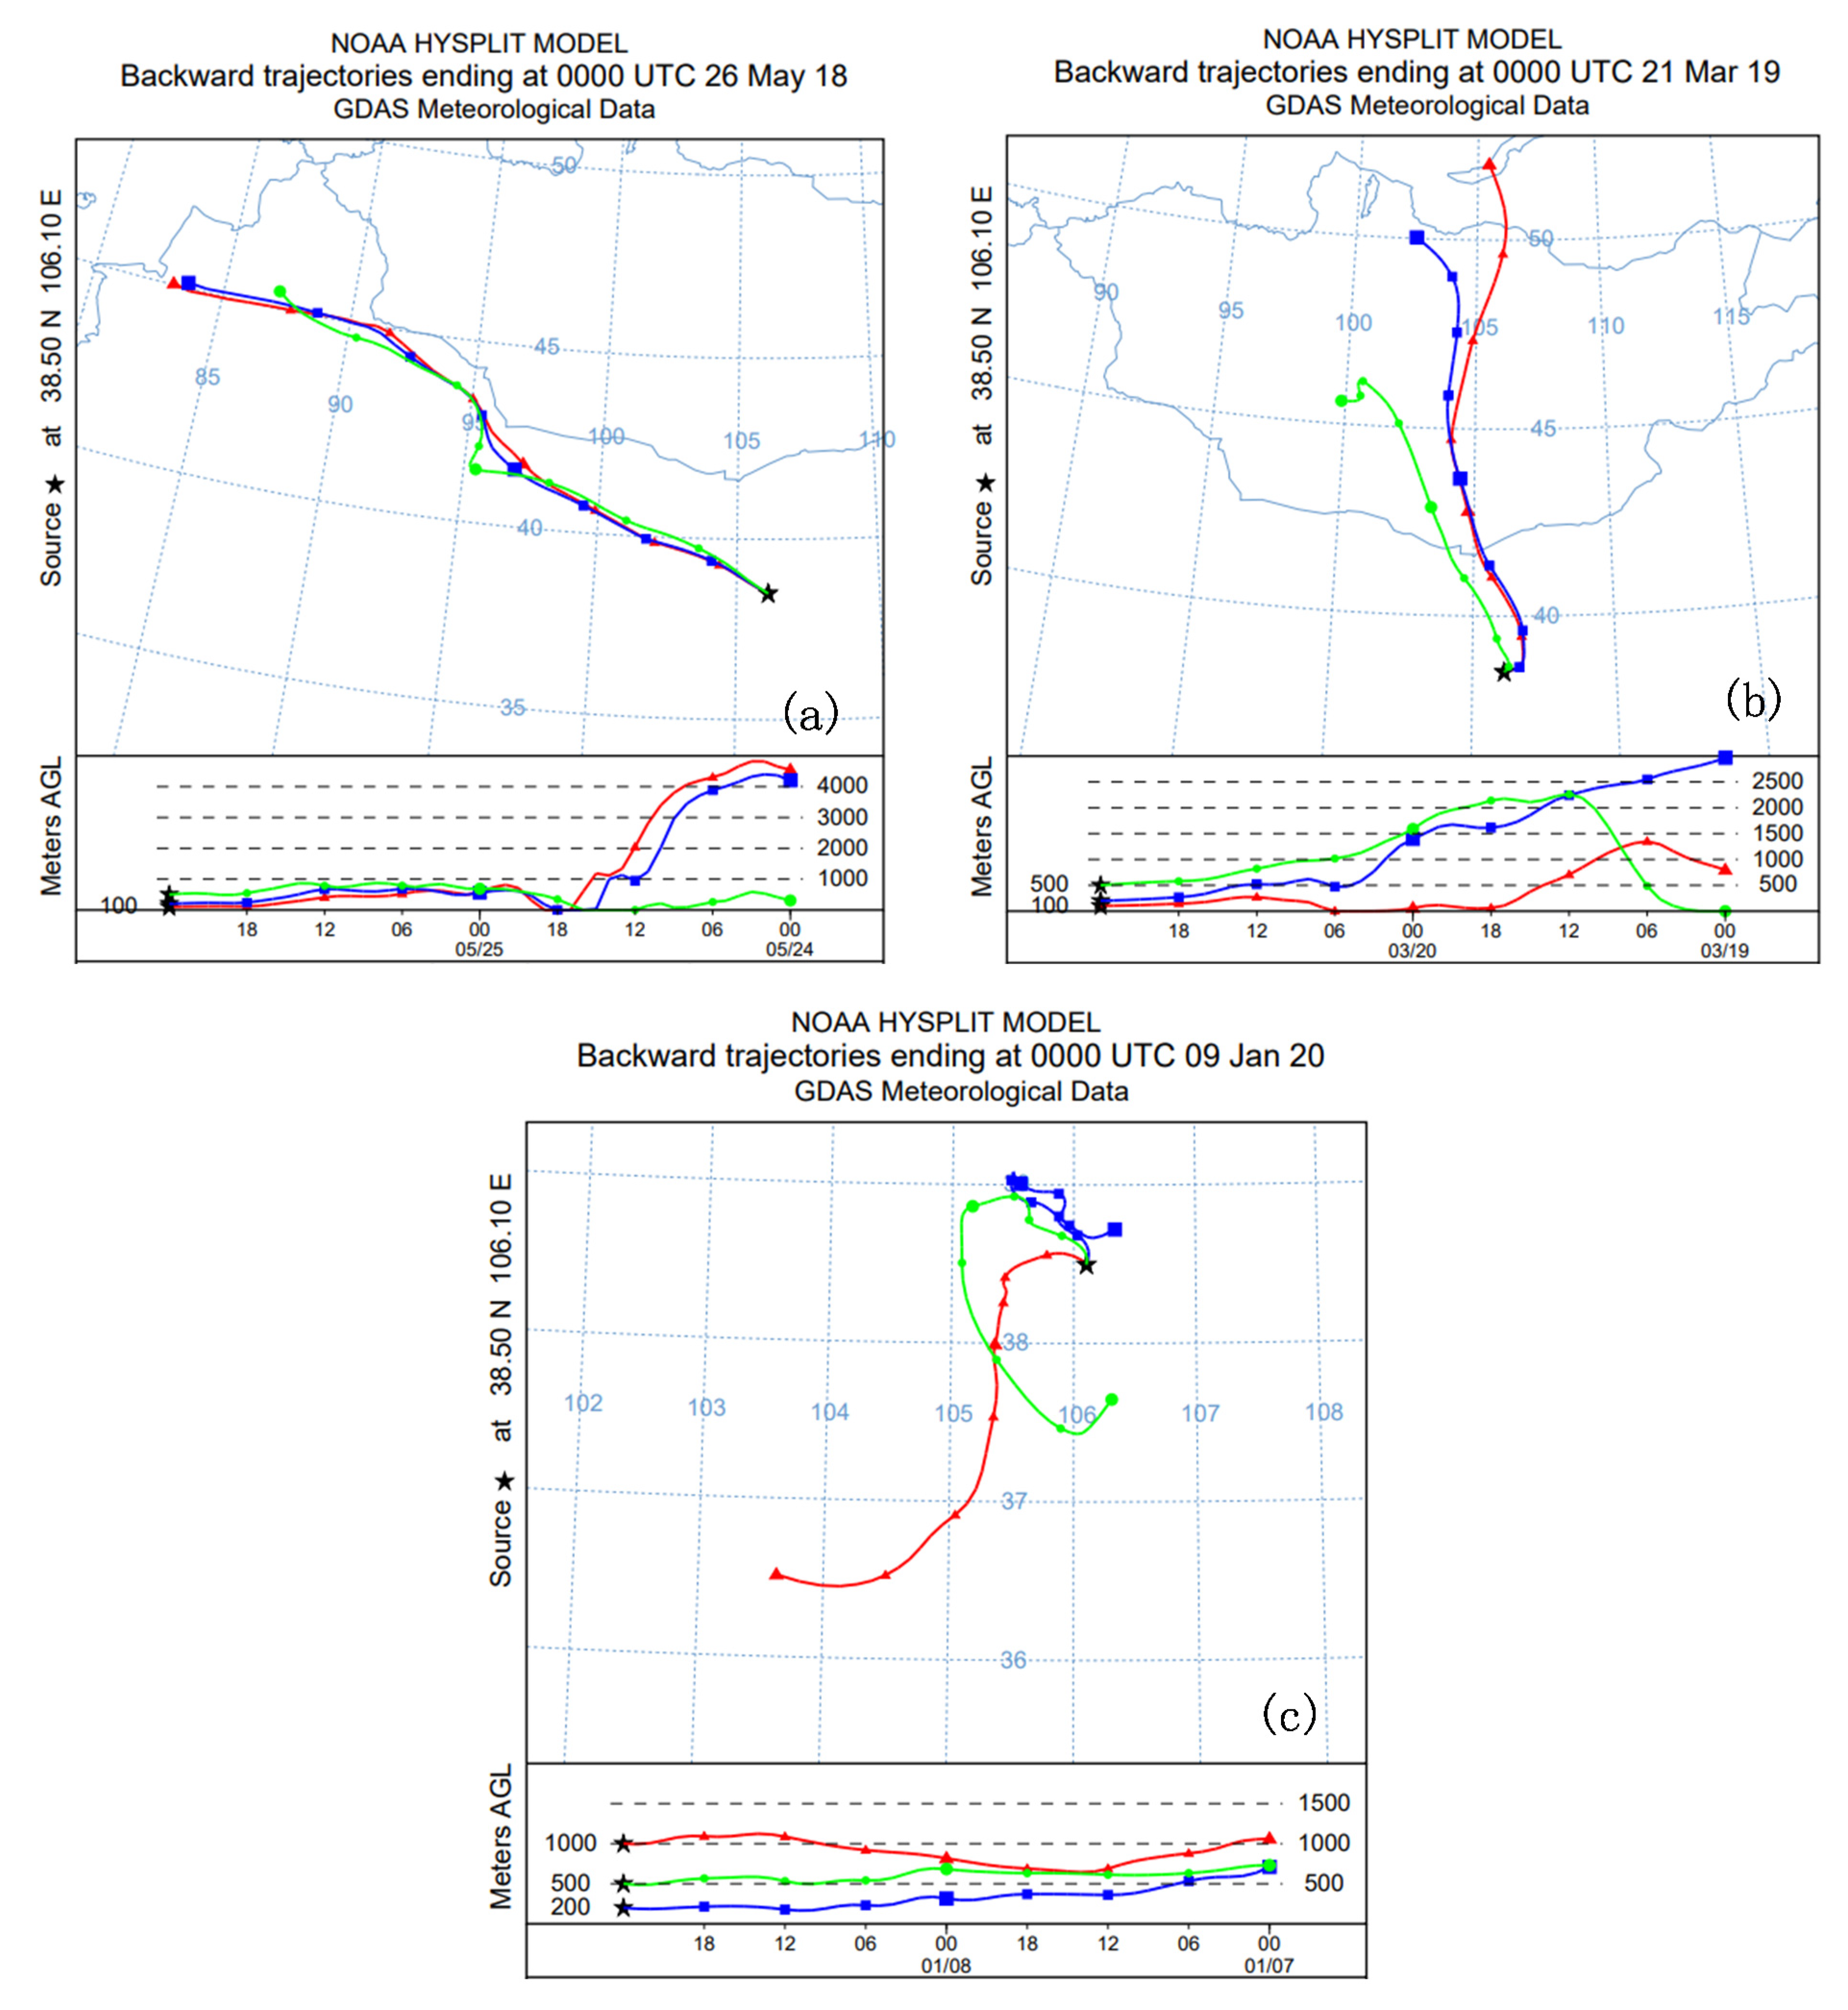
Figure 9 shows a 48 h backward trajectory tracking of the Yinchuan area by the Hybrid Single-Particle Lagrangian Integrated Trajectory Model (HYSPLIT) [35]. Three initial heights were selected, 100, 200 and 500 m, but for hazy days, the source distinction was not obvious, so 200, 500 and 1000 m were chosen. According to our lidar detection data in Yinchuan area, the height of fine particles was about 1–3 km when the polluted air mass was compounded with the boundary layer, and the height of coarse particles of sand and dust were higher, around 3 km. In Figure 9a, on 25 May 2018, the dust particles can be traced to the Taklimakan Desert in Xinjiang Region. After the northwest wind carried a large number of dust particles originating from Taklimakan Desert, through Gansu Province and Alxa area in Inner Mongolia, into Yinchuan Region, the dust weather broke out.
From Figure 9b, the dust particles at the height of 500 m in the floating dusty weather on 20 March 2019 mainly came from the Gobi Desert of Mongolia. From Figure 9c, on the hazy days, large amounts of particles at the height of 100 m mainly originated mainly from the Yinchuan area, which were caused by coal-heating and the background circulation of winter. Moreover, partial particles at the height of 200 m and 500 m that came from nearby Wuzhong City in Ningxia and distant Baiyin City in Gansu, respectively, passed through the Tengger Desert and increased the number of particles on hazy days in the Yinchuan area.

4. Conclusions

With the rapid development of the economy and urbanization, serious environmental pollution has been caused, such as the degradation of the ecosystem, the damage of the ozone layer and the change in atmospheric chemical composition. Human activities have a direct impact on changes in the environment, and also changes in the natural environment have a direct impact on human production and life. In fact, atmospheric aerosol is one of the most uncertain radiative forcing factors for the earth system, which has a long-term and far-reaching impact on the environment and plays an extremely important role in changing the energy balance of the earth. PSD is one of the important microphysical parameters to characterize aerosol microphysical properties. For non-AERONET sites, using the AOD data of sun photometer CE-318 for inversion of PSD, undoubtedly, has an important scientific significance and research value on researching the impact of the atmospheric radiation budget and climate change. In this paper, the AOD is used as the function of wavelength to study the aerosol PSD of the whole atmospheric column. The inversion equation of the PSD from the AOD belongs to the Fredholm integral equation of the first kind, which is usually ill-conditioned. In this paper, in order to solve the problems, firstly, the Fredholm integral equation of the first kind was discretized, and the L curve was used to determine regularization parameters. Then the TSVD and Tikhonov regularization method were used to invert the aerosol particles volume size distribution using the AODs taken by a sun photometer CE318. Finally, the particles number size distribution was converted by transformation. The aerosol PSDs of four seasons of the one year, as well as on floating dusty days, blowing dusty days, hazy days and sunny days, were obtained. The results show that the PSD was highest in spring; the concentration of fine particles on hazy days was highest, and the concentration of coarse particles in dusty weather was highest. By comparing the errors of the two regularizations, it was found that the TSVD regularization algorithm has a better retrieval effect. To understand the sources of dusty days and hazy days more intuitively, the sources using the back-trajectory model were analyzed. This paper has important guiding significance for air pollution control and climate change monitoring in the Yinchuan area.

Author Contributions

Data curation, Y.R.; Funding acquisition, J.M.; Investigation, J.M.; Methodology, J.M.; Project administration, J.M.; Supervision, J.M.; Validation, J.L. and Y.Z.; Writing—Original draft, Y.R.; Writing—Review & editing, Q.W. All authors have read and agreed to the published version of the manuscript.

Funding

This research was funded by the National Natural Science Foundation of China (Nos. 61765001 and 61565001), Natural Science Foundation of Ningxia Province (No. 2021AAC02021), Leading Talents of Scientific and Techno-logical Innovation of Ningxia Province, Plan for Leading Talents of the State Ethnic Affairs Commission of the People’s Republic of China, High level talent selection and training plan of North Minzu University, Innovation Team of Lidar Atmosphere Remote Sensing of Ningxia Province and Ningxia first-class discipline and scientific research projects (electronic science and technology) (No. NXYLXK2017A07).

Institutional Review Board Statement

Not applicable.

Informed Consent Statement

Not applicable.

Data Availability Statement

The aerosol PSD data used to support the findings of this study are available from the corresponding author upon request.

Conflicts of Interest

The authors declare that there are no conflict of interest regarding the publication of this article.

References

  1. Li, J.; Yin, Y.; Li, P.; Xu, F. Advances in research on mechanism and observation of impacts of aerosol on cloud and precipitation. J. Meteorol. Sci. 2014, 34, 581–590. [Google Scholar]
  2. Graham, E.L.; Zieger, P.; Mohr, C.; Wideqvist, U.; Hennig, T.; Ekman, A.M.L.; Krejci, R.; Ström, J.; Riipinen, I. Physical and chemical properties of aerosol particles and cloud residuals on Mt. Åreskutan in Central Sweden during summer 2014. Tellus B Chem. Phys. Meteorol. 2020, 72, 1–16. [Google Scholar]
  3. Hussein, T.; Puustinen, A.; Aalto, P.P.; Mäkelä, J.M.; Hämeri, K.; Kulmala, M. Urban aerosol number size distributions. Atmos. Chem. Phys. 2004, 28, 391–411. [Google Scholar] [CrossRef] [Green Version]
  4. Volckensa, J.; Peters, T.M. Counting and particle transmission efficiency of the aerodynamic particle sizer. J. Aerosol Sci. 2005, 36, 1400–1408. [Google Scholar] [CrossRef]
  5. Pfeifer, S.; Müller, T.; Weinhold, K.; Zikova, N.; Santos, S.M.D.; Marinoni, A.; Bischof, O.F.; Kykal, C.; Ries, L.; Meinhardt, F.; et al. Intercomparison of 15 aerodynamic particle size spectrometer (APS 3321): Uncertainties in particle sizing and number size distribution. Atmos. Meas. Tech. 2016, 9, 1545–1551. [Google Scholar] [CrossRef] [Green Version]
  6. Gu, Y.; Niu, S. Analysis and fitting of the instantaneous size distribution of sand dust aerosol particles in Helan Mountainous area. J. Nanjing Inst. Meteorol. 2006, 29, 500–506. [Google Scholar]
  7. Liu, Z.; Sun, Y.; Li, L.; Wang, Y. Particle mass concentrations and size distribution during and after the Beijing Olympic Games. Environ. Sci. 2011, 32, 913–923. [Google Scholar]
  8. Shang, Q.; Li, Z.; Yang, J.; Pu, M. Size distributions of aerosol particles and the impact on visibility in winter of Nanjing. Environ. Sci. 2011, 32, 256–266. [Google Scholar]
  9. Huang, A.; Deng, R.; Qin, Y.; Chen, Q.; Liang, Y. A Study on Remote-Sensing Inversion of Aerosol Particle Size Distributions over Yongxing Island. Acta Scientiarum Nat. Univ. Sunyatseni 2015, 54, 138–144. [Google Scholar]
  10. Goloub, P.; Li, Z.; Dubovik, O.; Blarel, L.; Podvin, T.; Jankowiak, I.; Lecoq, R.; Deroo, C.; Chatenet, B.; Morel, J.P.; et al. PHOTONS/AERONET sunphotometer network overview: Description, activities, results. In Atmospheric and Ocean Optics; SPIE: Bellingham, WA, USA, 2008. [Google Scholar] [CrossRef] [Green Version]
  11. Yue, G.K.; Deepak, A. Retrieval of stratospheric aerosol size distribution from atmospheric extinction of solar radiation at two wavelengths. Appl. Opt. 1983, 22, 1639. [Google Scholar] [CrossRef]
  12. Dubovik, O.; King, M.D. A flexible inversion algorithm for retrieval of aerosol optical properties from Sun and sky radiance measurements. J. Geophys. Res. Atmos. 2000, 105, 20673. [Google Scholar] [CrossRef] [Green Version]
  13. Veselovskii, I.; Kolgotin, A.; Griaznov, V.; Muller, D.; Wandinger, U.; Whiteman, D.N. Inversion with regularization for the retrieval of tropospheric aerosol parameters from multiwavelength lidar sounding. Appl. Opt. 2002, 41, 3685–3699. [Google Scholar] [CrossRef] [Green Version]
  14. Jagodnicka, A.K.; Stacewicz, T.; Posyniak, M.; Malinowski, S.; Gaussa, M. Lidar Investigation of aerosol particle size distribution in the vicinity of cloud. In Proceedings of the 15th International Conference on Clouds and Precipitation (ICCP), Cancun, Mexico, 7 July 2008. [Google Scholar]
  15. Granados-Muñoz, M.J.; Navas-Guzmán, F.; Bravo-Aranda, J.A.; Guerrero-Rascado, J.L.; Lyamani, H.; Valenzuela, A.; Titos, G.; Fernández-Gálvez, J.; Alados-Arboledas, L. Hygroscopic growth of atmospheric aerosol particles based on active remote sensing and radiosounding measurements: Selected cases in southeastern Spain. Atmos. Meas. Tech. 2015, 7, 10293–10326. [Google Scholar] [CrossRef] [Green Version]
  16. Chaikovsky, A.P.; Bril, A.I.; Fedarenka, A.S.; Peshcharankou, V.A.; Denisov, S.V.; Dick, V.P.; Asipenka, F.P.; Miatselskaya, N.S.; Balin, Y.S.; Kokhanenko, G.P.; et al. Synergy of Ground-Based and Satellite Optical Remote Measurements for Studying Atmospheric Aerosols. J. Appl. Spectrosc. 2020, 86, 1092–1099. [Google Scholar] [CrossRef]
  17. Gong, W.; Zhang, S.; Ma, Y. Aerosol Optical Properties and Determination of Aerosol Size Distribution in Wuhan, China. Atmosphere 2014, 5, 81–91. [Google Scholar] [CrossRef] [Green Version]
  18. Mao, J.; Sheng, H.; Zhao, H.; Zhou, C. Observation Study on the Size Distribution of Sand Dust Aerosol Particles over Yinchuan, China. Adv. Meteorol. 2014, 6, 1–7. [Google Scholar] [CrossRef]
  19. Yan, C. Optimization of Regulation Algorithm about Particle Size Distribution and Analysis of Error. Master’s Thesis, Xi’an University of Technology, Xi’an, China, 2017. [Google Scholar]
  20. Phillips, D.L. A technique for the numerical solution of certain integral equations of the first kind. J. ACM 1962, 9, 84–97. [Google Scholar] [CrossRef]
  21. Twomey, S. Comparison of constrained linear inversion and an iterative nonlinear algorithm applied to the indirect estimation of particle size distributions. J. Comput. Phys. 1975, 18, 188–200. [Google Scholar] [CrossRef]
  22. Shan, L.; Cao, L.X.L.; Hong, B.; Zhao, J.; Wang, D.; Kong, M. Inversion of particle size distribution based on iterative non-negative Philips-Twomey algorithm. Trans. Inst. Meas. Control 2019, 42, 014233121987373. [Google Scholar] [CrossRef]
  23. Dey, S.; Tripathi, S.; Singh, R.P.; Holben, B. Retrieval of black carbon and specific absorption over Kanpur city, northern India during 2001–2003 using AERONET data. Atmos. Environ. 2006, 40, 445–456. [Google Scholar] [CrossRef]
  24. Hess, M.; Koepke, P.; Schult, I. Optical properties of aerosols and clouds: The software package OPAC. Bull. Am. Meteorol. Soc. 1998, 79, 831–844. [Google Scholar] [CrossRef]
  25. Xie, Y.; Li, Z.; Zhang, Y.; Zhang, Y.; Li, D.; Li, K.; Xu, H.; Wang, Y.; Chen, X.; Schauer, J. Estimation of Atmospheric Aerosol Composition from Ground-Based Remote Sensing Measurements of Sun-Sky Radiometer. J. Geophys. Res. Atmos. 2017, 122, 498–518. [Google Scholar] [CrossRef]
  26. King, M.D.; Byrne, D.M.; Herman, B.M.; Reagan, J.A. Aerosol size distribution obtained by inversion of spectral optical depth measurement. J. Atmos. Sci. 1978, 35, 2153–2167. [Google Scholar] [CrossRef]
  27. Liu, J. The Normalization Method and Application of the Problem of An Unsuitable Problem; Science Press: Beijing, China, 2005; p. 9. [Google Scholar]
  28. Zhang, X. The Regularization for the First Kind of Fredholm Integral Equation. Master’s Thesis, University of Electronic Science and Technology of China, Chengdu, China, 2013. [Google Scholar]
  29. Liu, M. The error estimates of Fredholm integral equations of the first class are solved by direct discretization. J. Nat. Sci. Heilongjiang Univ. 2011, 28, 1. [Google Scholar]
  30. Mesgarani, H.; Azari, Y. Numerical investigation of Fredholm integral equation of the first kind with noisy data. Math. Sci. 2019, 13, 267–278. [Google Scholar] [CrossRef] [Green Version]
  31. Mao, H. The Tikhonov Regularization for Fredholm Equation of the First Kind with Applications. Master’s Thesis, Shanghai JiaoTong University, Shanghai, China, 2010. [Google Scholar]
  32. Wang, B. Study on Numerical Methods of Discrete Ill-Posed Problem in Inversion Problem. Master’s Thesis, Xi’an University of Technology, Xi’an, China, 2006. [Google Scholar]
  33. O’Leary, D.P. The Use of the L-Curve in the Regularization of Discrete Ill-Posed Problems. Soc. Ind. Appl. Math. 1993, 14, 1487–1503. [Google Scholar]
  34. Carfora, M.F.; Serio, C. Numerical Methods for Retrieving Aerosol Size Distributions from Optical Measurements of Solar Radiation. J. Aerosol Sci. 1998, 29, 1225–1236. [Google Scholar] [CrossRef]
  35. Bo, G.; Xu, C.; Li, A.; Wang, Y.; Chen, H.; Jiang, Y. Optical and hygroscopic properties of Asian dust particles based on a horizontal Mie lidar: Case study at Hefei, China. Chin. Opt. Lett. 2017, 15, 020102. [Google Scholar]
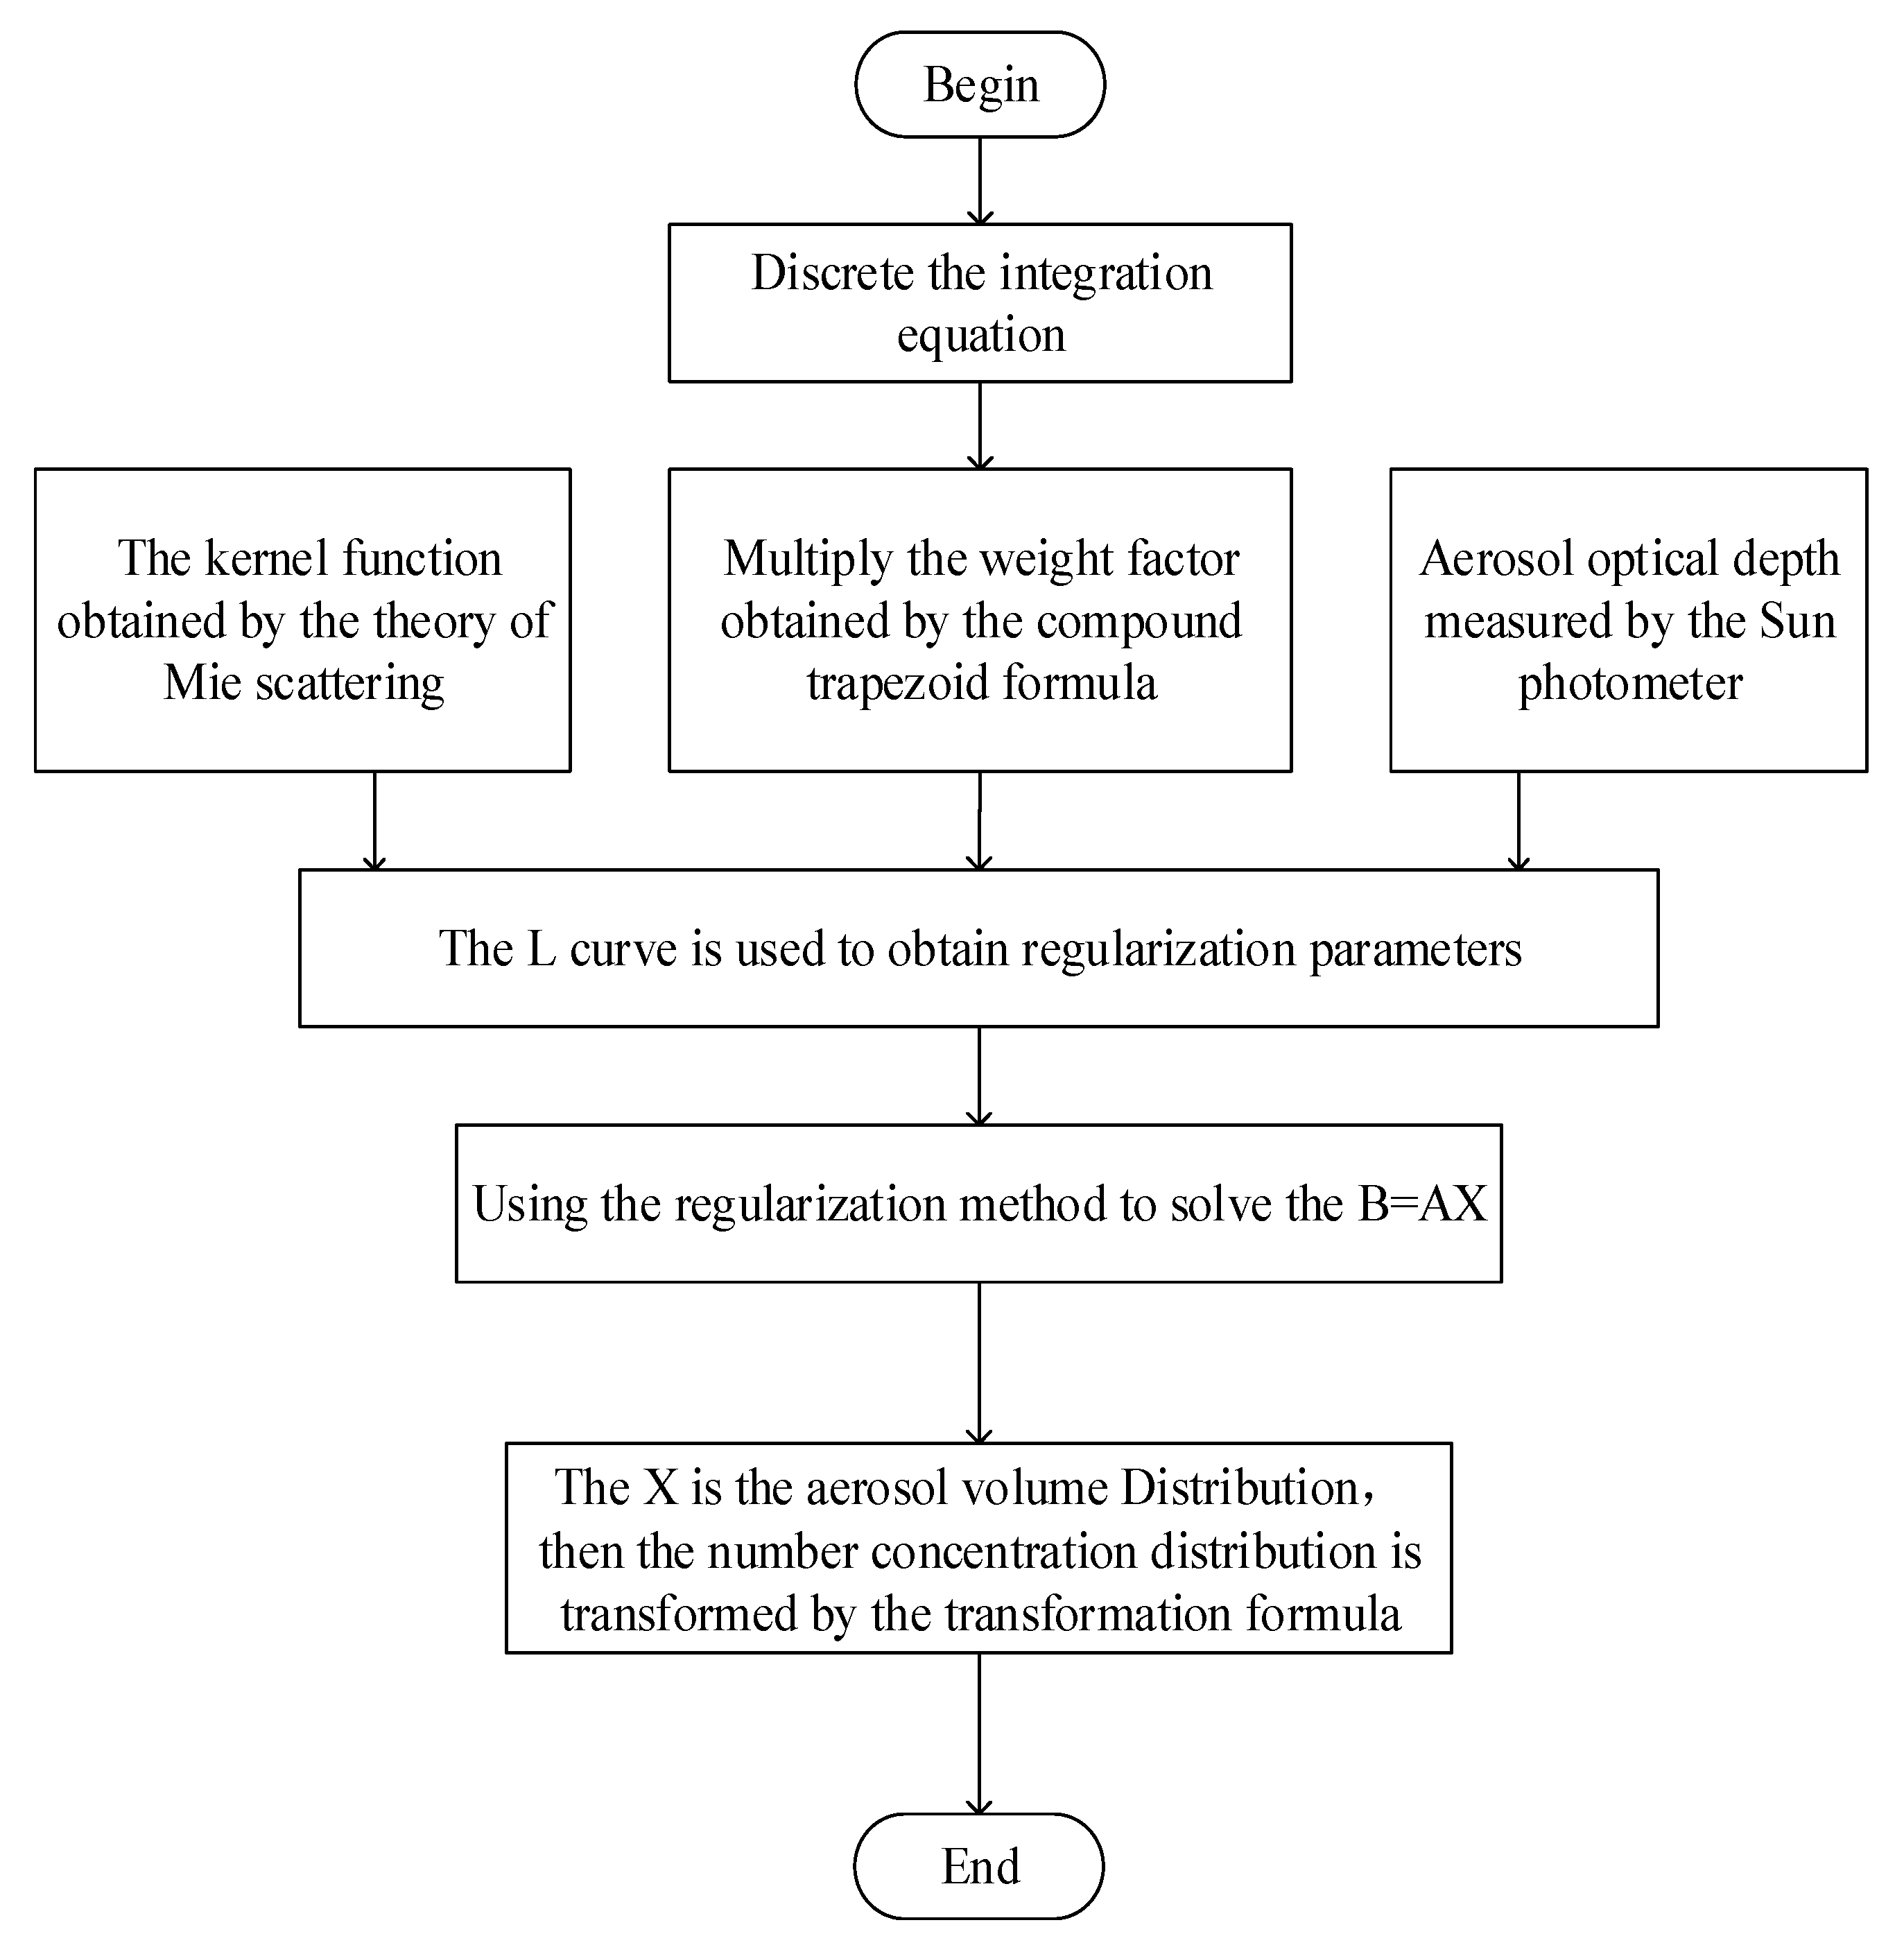
Figure 1. The inversion flow chart of aerosol PSD.
Atmosphere 12 00992 g001
Figure 2. The L curve for determination of regularization parameters.
Atmosphere 12 00992 g002
Figure 3. The average AODs of four seasons from 2018 to 2019 in Yinchuan area.
Atmosphere 12 00992 g003
Figure 4. The AODs on hazy days, dusty days and sunny days.
Atmosphere 12 00992 g004
Figure 5. The aerosol PSDs of all seasons in the Yinchuan area from the AODS shown in Figure 3 inverted by the TSVD regularization algorithm.
Atmosphere 12 00992 g005
Figure 6. The aerosol PSDs in floating dusty days, blowing dusty days, hazy days and sunny days from the AODs shown in Figure 4 inverted by TSVD regularization algorithm.
Atmosphere 12 00992 g006
Figure 7. The aerosol PSDs inverted by the Tikhonov regularization algorithm for (a) four seasons, (b) a floating dusty day, blowing dusty day, hazy day, and sunny day.
Atmosphere 12 00992 g007aAtmosphere 12 00992 g007b
Figure 8. The PSDs when the selection of a complex refractive index is different in hazy weather using TSVD regularization inversion.
Atmosphere 12 00992 g008
Figure 9. The backward trajectory in Yinchuan area on (a) blowing dusty days, (b) floating dusty days and (c) hazy days.
Atmosphere 12 00992 g009
Table 1. The weather conditions, floating dusty days, blowing dusty days, hazy days and sunny days in Yinchuan area.
DataWeatherWindMaximum/Minimum Temperature (°C)AQI
20 March 2019floating dusty dayNorthwest wind
level 2
10/−3181
Moderate
9 January 2020haze dayNortheast wind
level 1
−2/−9188
Moderate
25 May 2018blowing dusty dayNorthwest wind
level 4
31/25174
Moderate
26 July 2019sunny daySoutheast wind
level 3
36/2150
Good
Table 2. The perturbation error and regularization error of TSVD regularization algorithm inversion under different seasons and weather conditions.
SpringSummerAutumnWinterFloating Dusty DaysHaze DaysBlowing Dusty DaysSunny Days
Perturbation error0.01330.00540.010.01040.00490.13530.03320.0591
Regularization error5.64783.29874.06994.46906.622712.0626.15853.581
Table 3. The perturbation error and regularization error of Tikhonov regularization algorithm inversion under different seasons and weather conditions.
SpringSummerAutumnWinterFloating Dusty DaysHazy DaysBlowing Dusty DaysSunny Days
Perturbation error0.00560.00520.00560.00550.00560.08110.03240.00230
Regularization error5.72173.35674.11374.51416.679413.5585.89011.8076
Table 4. The corresponding errors when the selection of a complex refractive index is different in hazy weather using TSVD regularization inversion.
mPerturbation ErrorRegularization Error
1.55 + 0.01i0.135312.062
1.51612 + 0.1178i0.137512.5446
Publisher’s Note: MDPI stays neutral with regard to jurisdictional claims in published maps and institutional affiliations.