Article

Characteristics of Particulate Matter at Different Pollution Levels in Chengdu, Southwest of China

1
State Key Laboratory of Geohazard Prevention and Geoenvironment Protection, College of Ecology and Environment, Chengdu University of Technology, Chengdu 610059, China
2
Department of Geochemistry, Chengdu University of Technology, Chengdu 610059, China
3
Department of Geosciences, Idaho State University, Pocatello, ID 83209, USA
*
Author to whom correspondence should be addressed.
These authors contributed equally to this work and should be considered dual-first authors.
Atmosphere 2021, 12(8), 990; https://doi.org/10.3390/atmos12080990
Submission received: 27 June 2021 / Revised: 26 July 2021 / Accepted: 26 July 2021 / Published: 31 July 2021
(This article belongs to the Special Issue Assessing Atmospheric Pollution and Its Impacts on the Human Health)

Abstract

:
Air pollution is becoming increasingly serious along with social and economic development in the southwest of China. The distribution characteristics of particle matter (PM) were studied in Chengdu from 2016 to 2017, and the changes of PM bearing water-soluble ions and heavy metals and the distribution of secondary ions were analyzed during the haze episode. The results showed that at different pollution levels, heavy metals were more likely to be enriched in fine particles and may be used as a tracer of primary pollution sources. The water-soluble ions in PM2.5 were mainly Sulfate-Nitrate-Ammonium (SNA) accounting for 43.02%, 24.23%, 23.50%, respectively. SO42−, NO3, NH4+ in PM10 accounted for 34.56%, 27.43%, 19.18%, respectively. It was mainly SO42− in PM at Clean levels (PM2.5 = 0~75 μg/m3, PM10 = 0~150 μg/m3), and mainly NH4+ and NO3 at Light-Medium levels (PM2.5 = 75~150 μg/m3, PM10 = 150~350 μg/m3). At Heavy levels (PM2.5 = 150~250 μg/m3, PM10 = 350~420 μg/m3), it is mainly SO42− in PM2.5, and mainly NH4+ and NO3 in PM10. The contribution of mobile sources to the formation of haze in the study area was significant. SNA had significant contributions to the PM during the haze episode, and more attention should be paid to them in order to improve air quality.

1. Introduction

PM10 refers to particles with an aerodynamic equivalent diameter less than or equal to 10 μm in ambient air, and PM2.5 refers to particles with an aerodynamic equivalent diameter less than or equal to 2.5 μm in ambient air. The composition of atmospheric particles is complex, including heavy metals, water-soluble ions, carbonaceous components, and so on from multiple sources [1,2]. In addition, with small particle sizes and large surface area, atmospheric particulates have adverse effects on the atmospheric environment and public health. In recent years, there have been many haze pollution incidents occurring in a number of locations across China, which has caused more and more public concerns and attention paid to air pollution [3,4,5].
The Sichuan Basin is in southwestern China. The topography of hills and basins, coupled with the climate conditions of high humidity and low wind speed, leads to atmospheric pollution easily in this area [6,7]. It is the fourth highest haze area following the Beijing-Tianjin-Hebei area, Yangtze River Delta, and Pearl River Delta. Its pollution characteristics are of high particle concentration and low visibility [8,9,10]. The special terrain and the humid climate of Chengdu are not conducive to the diffusion of particulate matter and are prone to secondary pollutant (SNA) conversion and generation [6,10,11].
In recent years, although the implementation of pollution prevention and control measures has improved the air environment in Chengdu, the region still has a problem with air pollution [12]. The research topics in this region mainly include the analysis of particulate pollution characteristics [13,14], the impact of meteorological conditions on particulate pollution [15], the lag effect of particulate pollution on related diseases [16], and source apportionment [17]. It is reported that the heavy metals in the atmospheric particulate matter (PM) in Chengdu are mainly arsenic (As), lead (Pb), copper (Cu), nickel (Ni), zinc (Zn), iron (Fe), and manganese (Mn) [18,19]. Among them, arsenic (As) mainly comes from industrial smelters. Pb, Cu, Ni, and Zn mainly come from the exhaust of motor vehicles and the wear of tires and brake pads whereas Fe and Mn are mainly from dust generated during vehicle driving [20,21]. Sulfate-Nitrate-Ammonium (SNA) are water-soluble ions that greatly contribute to PM concentration [22,23]. Air pollution in Chengdu has obvious seasonal distribution characteristics, which are closely related to the meteorological factors of the city [24]. It is reported that the mass concentration of SNA is the highest in winter and the lowest in summer [25]. The high temperature in summer and autumn is conducive to the conversion of sulfur dioxide (SO2) to sulfate (SO42−) while adverse to the stable existence of ammonium nitrate (NH4NO3). Although the low temperature in winter inhibits the conversion of gaseous precursors, it is beneficial to the stable existence of NH4NO3 [26,27].
However, it is known from the previous studies that the concentration of particulate matter increases with the increase of pollution, but the mechanism of particle concentration and composition change is different under different pollution levels [28]. A recent study showed that the rapid increase of PM2.5 at light pollution level in Beijing was caused by regional transportation, while the rise from heavy to severe was mainly caused by an increase in the proportion of secondary inorganic components [29]. The air pollution in cities in southern China has been easily overlooked. Up to now, there is no detailed report on the various characteristics of atmospheric particulate matter at various pollution levels in Chengdu, southwest China according to our investigation.
The purpose of this study is to find out how heavy metals and water-soluble ions in PM in Chengdu, China during the haze periods are distributed and changed at different pollution levels. Therefore, we investigated PM2.5 and PM10 in Chengdu in southwest China. The changes in heavy metal elements and water-soluble ions corresponding to the pollution level and their contribution to particulate matter are discussed. The effects of SO42−, NO3, and NH4+ on the particulate matter were emphatically explored. The secondary production of sulfate and nitrate will be shown to be important in high pollution level scenarios, and the same with the heavy metal analysis.

2. Materials and Methods

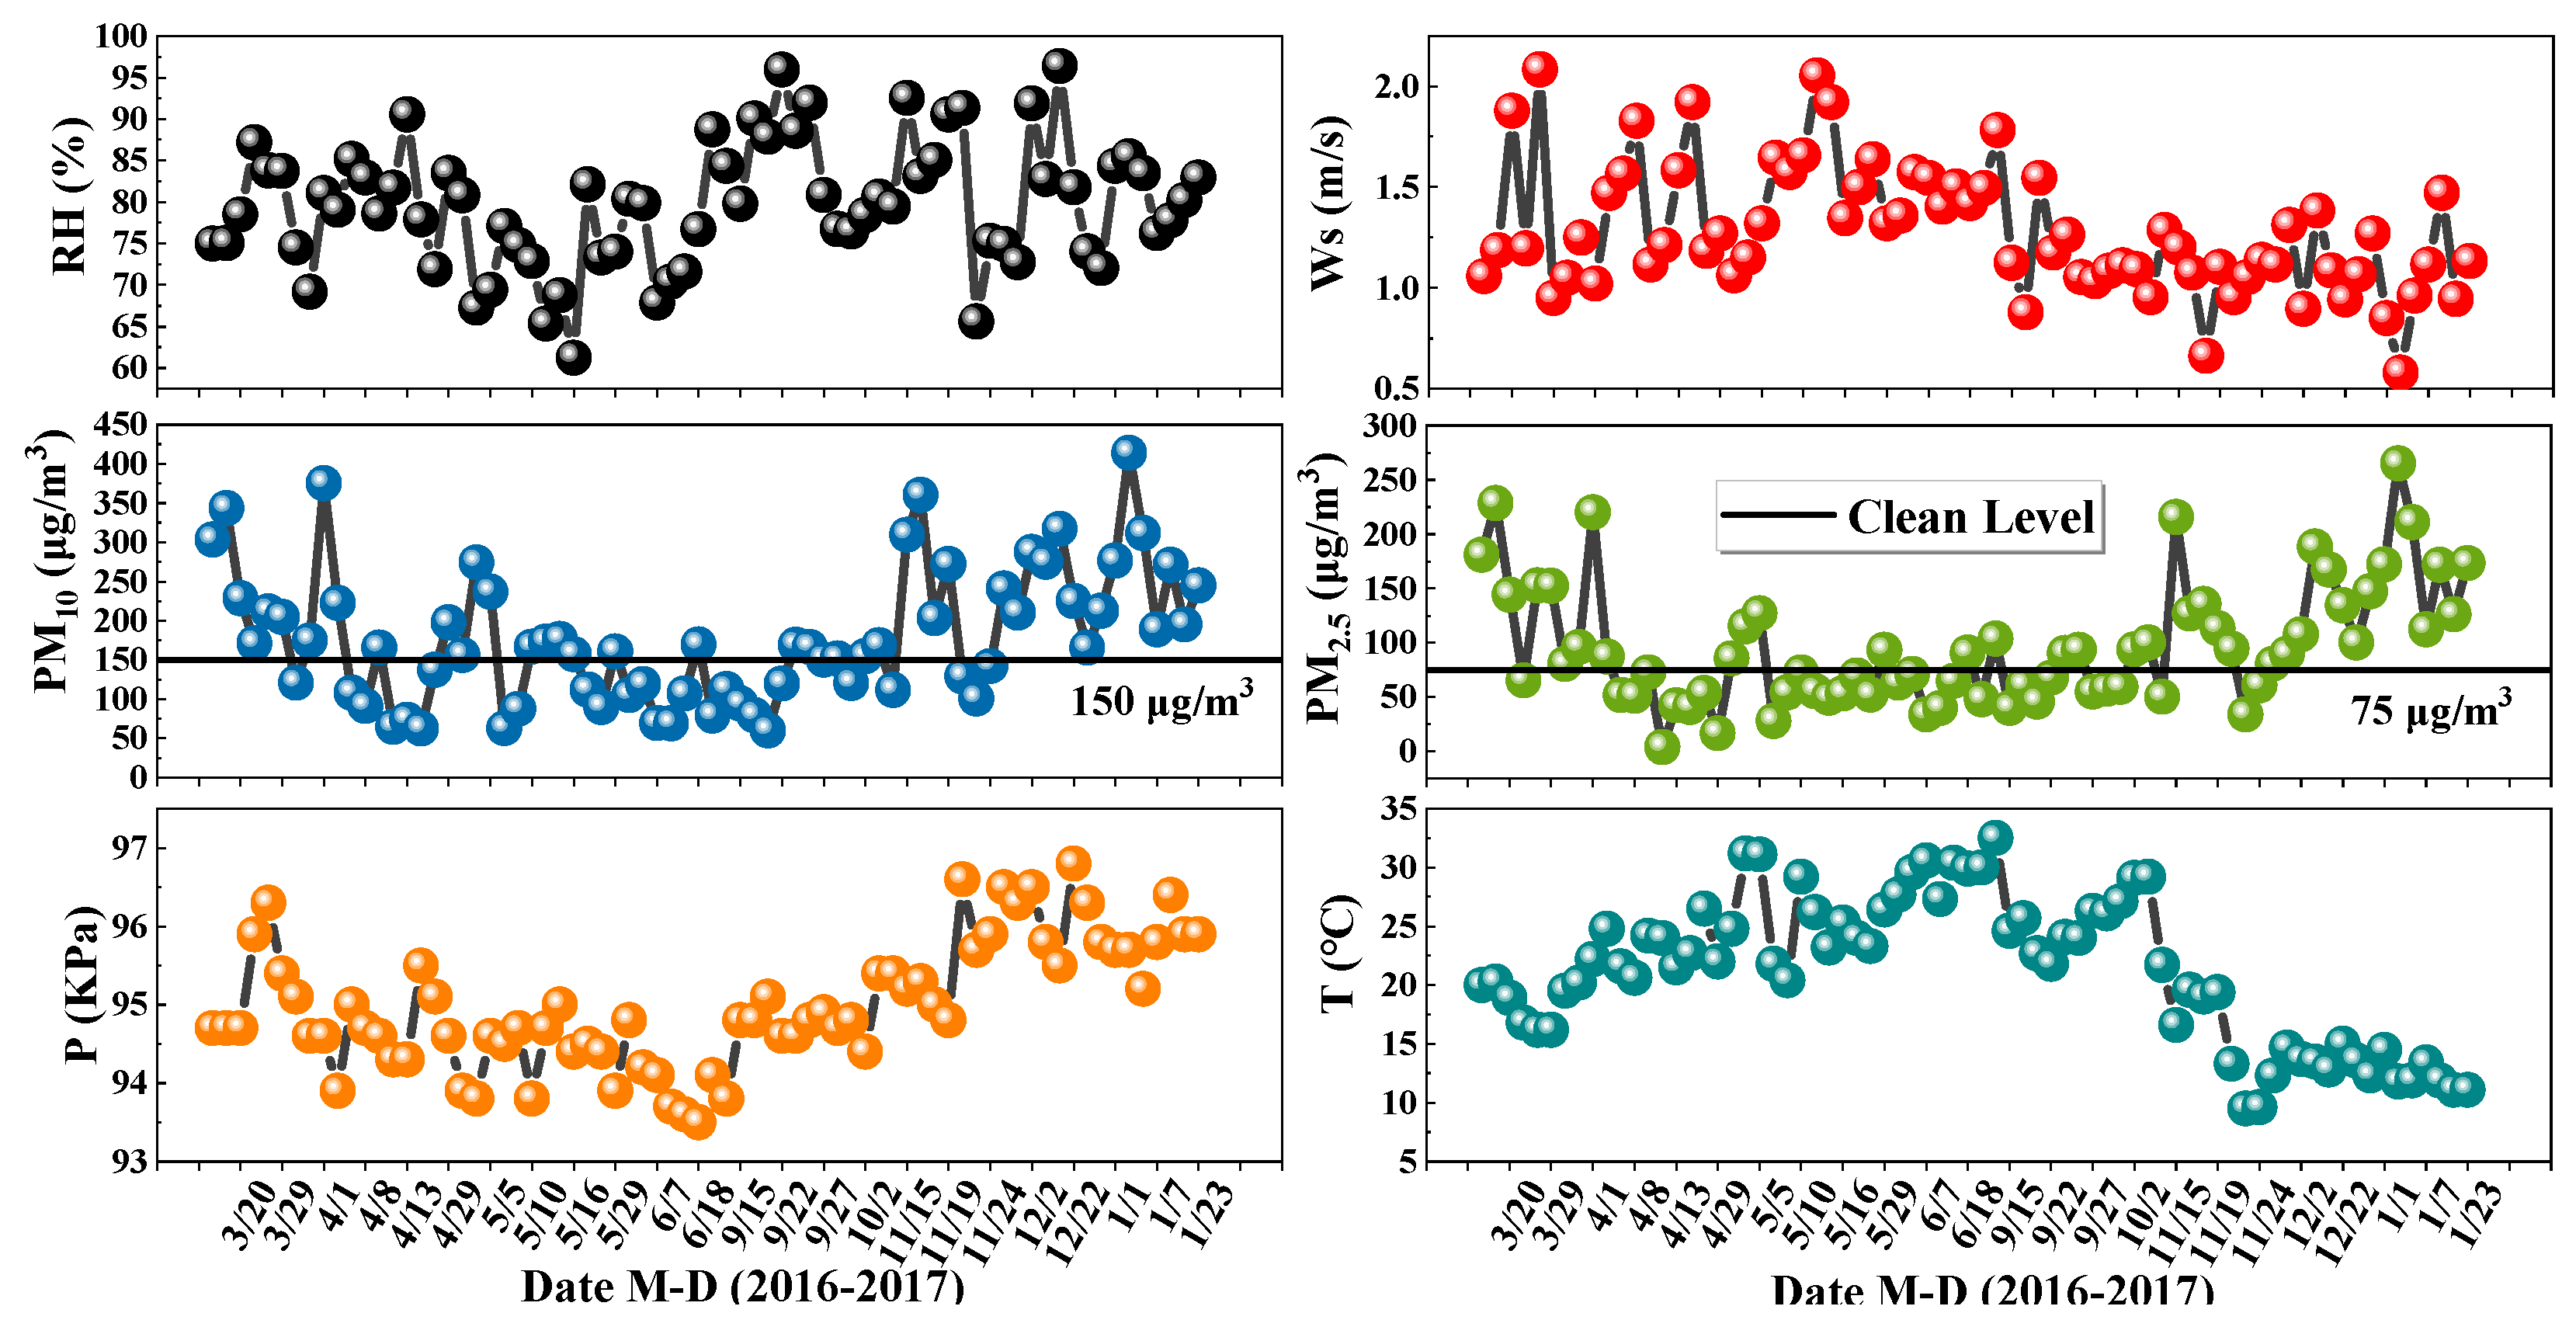
2.1. Study Site and Sample Collection

Chengdu is located in the western part of the Sichuan basin, surrounded by the western part of the Longquan Mountains and the eastern part of the Qionglai Mountains. The sampling site was located in Shilidian, Chenghua District, Chengdu (104°08′ E, 30°40′ N), the capital of Sichuan Province in the western part of the Sichuan Basin. Chengdu is densely populated, about 1000 people/km2 [30,31], with the annual temperature 15.2~16.6 °C, the annual precipitation 873 mm~1265 mm, the annual sunshine 23–30%, the average annual wind speed 1.3 m/s, and the average annual relative humidity 80% [32]. Shilidian is surrounded by major cities in Sichuan, including Deyang and Mianyang (Figure 1).
From March 2016 to January 2017, PM2.5 and PM10 were collected at the Chengdu University of Technology in the urban area of Chengdu with no chemical enterprises and tall buildings. The sampling period was 24 h and we collected 72 PM2.5 samples and 72 PM10 samples at the same time, with a total of 144 samples. The sampling instrument was a TH-150C medium flow atmospheric sampler (Wuhan Tianhong, Wuhan, China), with a calibrated flow rate of 100 L/min. Two kinds of filter membranes made of quartz and Teflon, respectively, (Whatman, Buckinghamshire, UK) were chosen. The Teflon filters are used for the heavy metal analysis because Teflon filters have low heavy metal background content, and the quartz filters are used for the water-soluble ion analysis. After the samples were collected, the sampling membranes were placed in clearly marked sample boxes immediately. At the same time, the meteorological data at the Shilidian meteorological monitoring station were recorded, including temperature, air pressure, wind speed, relative humidity, etc. Samples were collected under stable weather conditions, with weak wind at speeds less than 1.5 m/s, thus the contribution from pollutants transported long distances are likely small. The samples in this study mainly represent the local atmospheric conditions in Chengdu.

2.2. Mass Concentration Analysis

Before sampling, the Teflon filter membrane (Whatman, Φ90 mm, Buckinghamshire, UK) is equilibrated for at least 24 h at a temperature of 20 ± 5 °C and a relative humidity of 50 ± 5%. Quartz filter membranes (Whatman, Φ90 mm) were wrapped in aluminum foil, baked in a muffle furnace (SX-8-13, Beijing) at 500 °C for 4 h to remove the background organic matter, and then placed in the same environment as the Teflon filters for at least 24 h. After the filter membrane, use a one-hundred thousandth balance (Sartorius, Göttingen, Germany, CPA225D) was used to weigh each filter 3 times to ensure that the difference between any two weighing values did not exceed 0.04 mg. After the filter membranes were weighed, they were all wrapped in aluminum foil, and put in a sealed bag, and stored at −4 °C until analyzed. A pretreated blank filter membrane was used as a background. Before sample collection, the cutting head of the sampler filter membrane grid, sealing gasket, and other places that may be in contact with the filter membrane were wiped two to three times with high-grade pure absolute ethanol to prevent impurities from entering the filter membrane during the sampling process. Refer to “Ambient Air PM10 and PM2.5 Measurement-Gravimetric Method” (HJ618-2011) for details on the method used to calculate the mass concentrations of PM2.5 and PM10.

2.3. Heavy Metals Analysis

The concentrations of heavy metals of the samples were then analyzed. Before the experiment, all Teflon vials were thoroughly cleaned with 20% hot nitric acid solution (70 °C) and deionized water to avoid contamination. Subsequently, 1/2 of a Teflon filter was dissolved with 1 mL of nitric acid (HNO3) and 1 mL hydrofluoric acid (HF) in a closed-cap Teflon vial for 48 h at 180 °C. After that, the mixed solution was steamed to near dry, and then re-dissolved twice with 1 mL HNO3 (120 °C). After the last re-dissolution, HNO3 (1 mL), Rh solution (1 mL of 1000 ng/mL), and 5 mL deionized water were added and kept in Teflon vials for 6 h (100 °C). At this point, the sample pre-treatment was completed. The concentrations of the heavy metals were analyzed by inductively coupled plasma-mass spectrometry (ICP-MS, Perkin Elmer Corp., Norwalk, USA). The reference material GSS-4 was used to ensure the analytical accuracy with recovery between 94.3% and 103.6%. In addition, for 10% of the samples analysis was repeated and reagent blanks were also used to check the quality of the analysis. A total of eight metal elements were measured, including arsenic (As), cadmium (Cd), chromium (Cr), copper (Cu), nickel (Ni), lead (Pb), vanadium (V), and zinc (Zn). Their detection limits are: As (0.30 ng/m3), Cd (0.01 ng/m3), Cr (0.10 ng/m3), Cu (0.04 ng/m3), Ni (0.04 ng/m3), Pb (0.03 ng/m3), V (0.08 ng/m3), and Zn (0.10 ng/m3).

2.4. Water-Soluble Ions Determination

The main steps for the determination of water-soluble ions in the sample are as follows: putting 1/4 of the quartz filter into a 50 mL PET bottle with 20 mL of ultra-pure water and sonicated (25 °C, power 50%, Kunshan Ultrasound Instrument Co., Ltd., Kunshan, China, KQ-700DB) for 0.5 h. The bottle was transferred to a water bath shaker (Changzhou Putian Instrument Manufacturing Co., Ltd., Putian, China, SHA-CA) at room temperature and kept shaking for 30 min. The extract was then filtered through a 0.22 μm filter membrane. Anions of fluoride (F), chloride (Cl), nitrate (NO3), sulfate (SO42−), and cations of sodium (Na+), ammonium (NH4+), potassium (K+), calcium (Ca2+), and magnesium (Mg2+) were determined by ion chromatography (Metrohm 792). The anion column used was a Metrosep A Supp 5—150/4.0; the cation column used in ion chromatography is Metrosep C4-150. The flow rate was 0.7 mL/min. The sampling time for each run was 20 min. The anion eluent was sodium carbonate/sodium bicarbonate, fully dissolve the two in ultrapure water, and dilute them in a 100 mL volumetric flask, as a stock solution. The stock solution diluted 100 times is used as the eluent for anion determination. The cation eluent was 7.25 mM HNO3 and 0.02 M methanesulfonic acid. The ultrapure water, reagent solutions, and samples used in the test were filtered through a 0.45 μm filter membrane. Their detection limits are F (0.010 μg/m3), Cl (0.012 μg/m3), NO3 (0.027 μg/m3), SO42− (0.030 μg/m3) and Na+ (0.019 μg/m3), NH4+ (0.020 μg/m3), K+ (0.025 μg/m3), Ca2+ (0.037 μg/m3) and Mg2+ (0.020 μg/m3).

2.5. SOR and NOR Analysis

The concentrations of sulfate, nitrate, and ammonium are related to the concentration of gaseous precursors: sulfur dioxide (SO2), nitrogen oxides (NOx), and ammonia (NH3), and their conversion rates to particles generated in the atmosphere. Here SOR (sulfur oxidation rate) and NOR (nitrogen oxidation rate) are used to describe the formation of secondary aerosol species. The measured values of SO2 and NO2 come from the Chengdu Shilidian permanent monitoring site. Based on Ma et al. [29], the calculation formulas of SOR and NOR are:
SOR = nSO42/(nSO42 + nSO2)
NOR = nNO3/(nNO3 + nNO2)
where n is the molar concentration of the species. When SOR > 0.1, it indicates that there is a process of SO2 oxidation to SO42− in the particles. When NOR > 0.001, it is said that there is a process of oxidation of NO2 to NO3 in the particulate matter. The higher value of SOR or NOR, the higher the oxidation rate of the pollutant [33].

3. Results and Discussion

3.1. PM Mass Concentration

Thirty samples, eight samples, twenty-one samples, and thirteen samples were analyzed in spring, summer, autumn, and winter, respectively. The concentrations of PM2.5 and PM10 showed obvious seasonal distribution characteristics. The changes of PM2.5 concentration with seasons (spring to winter) were: 98.62 μg/m3, 66.75 μg/m3, 84.02 μg/m3, and 159.74 μg/m3. PM10 concentration changes with seasons (spring to winter) were: 169.87 μg/m3, 107.22 μg/m3, 167.16 μg/m3, and 260.30 μg/m3. The concentrations of PM2.5 and PM10 were the highest in winter and the lowest in summer. An inversion easily forms in winter, which prevents particles from diffusing. While the movement of atmospheric molecules and the atmospheric oxidation capacity is enhanced because of the high temperature in summer, which is conducive to the diffusion of atmospheric particles.
According to the “Ambient Air Quality Index (AQI) Technical Regulations (Trial)” (Ministry of Environmental Protection of China, 2012), the PM concentration is divided into four levels (Clean: PM2.5 = 0~75 μg/m3, PM10 = 0~150 μg/m3; Light-Medium: PM2.5 = 75~150 μg/m3, PM10 = 150~350 μg/m3; Heavy: PM2.5 = 150~250 μg/m3, PM10 = 350~420 μg/m3; Severe: PM2.5 > 250 μg/m3, PM10 > 420 μg/m3). The particulate matter concentration exceeding the clean level (PM2.5 = 0~75 μg/m3, PM10 = 0~150 μg/m3) is defined as a haze incident. Haze incidents during the sampling period mainly occurred from March to May 2016 and November 2016 to January 2017 (Figure 2), so PM in these periods was analyzed. Figure 3a showed that there were 32 samples at the clean levels, 55 samples at the Light-Medium levels, and 12 samples at the severe levels. It is worth noting that the pollution level based on PM2.5 did reach the Severe levels on 3 January 2017.
The concentrations of PM2.5 that increase with the change in pollution levels were on average 48.80 μg/m3, 109.84 μg/m3, and 186.21 μg/m3 for Clean, Light-medium, and Heavy levels, respectively. The concentrations of PM10 increase with the change in pollution levels were 98.49 μg/m3, 226.53 μg/m3, and 383.21 μg/m3 for Clean, Light-medium, and Heavy levels, respectively (Figure 3b). From the perspective of the increase in particle concentration, the growth rate of PM10 is faster than the growth rate of PM2.5, indicating that coarse particles (PM2.510) have a certain contribution to the growth of PM10. PM2.5/PM10 from Clean to Heavy pollution decreases first and then increases slightly, indicating PM2.5 contributed the most to PM10 at Clean levels and the least to PM10 at Severe levels.
There is a correlation between the concentration of PM and related climatic conditions (Table 1). The concentration of PM is significantly negatively correlated with wind speed, temperature, and ozone, and significantly positively correlated with relative humidity, atmospheric pressure, CO, NO2, and SO2. The correlation for PM2.5 and PM10 with temperature, CO, and NO2 are similar. PM2.5 has a stronger correlation with relative humidity, atmospheric pressure, ozone, and SO2, while PM10 has a stronger correlation with wind speed. This shows that the influence of meteorological conditions on fine particles is greater.

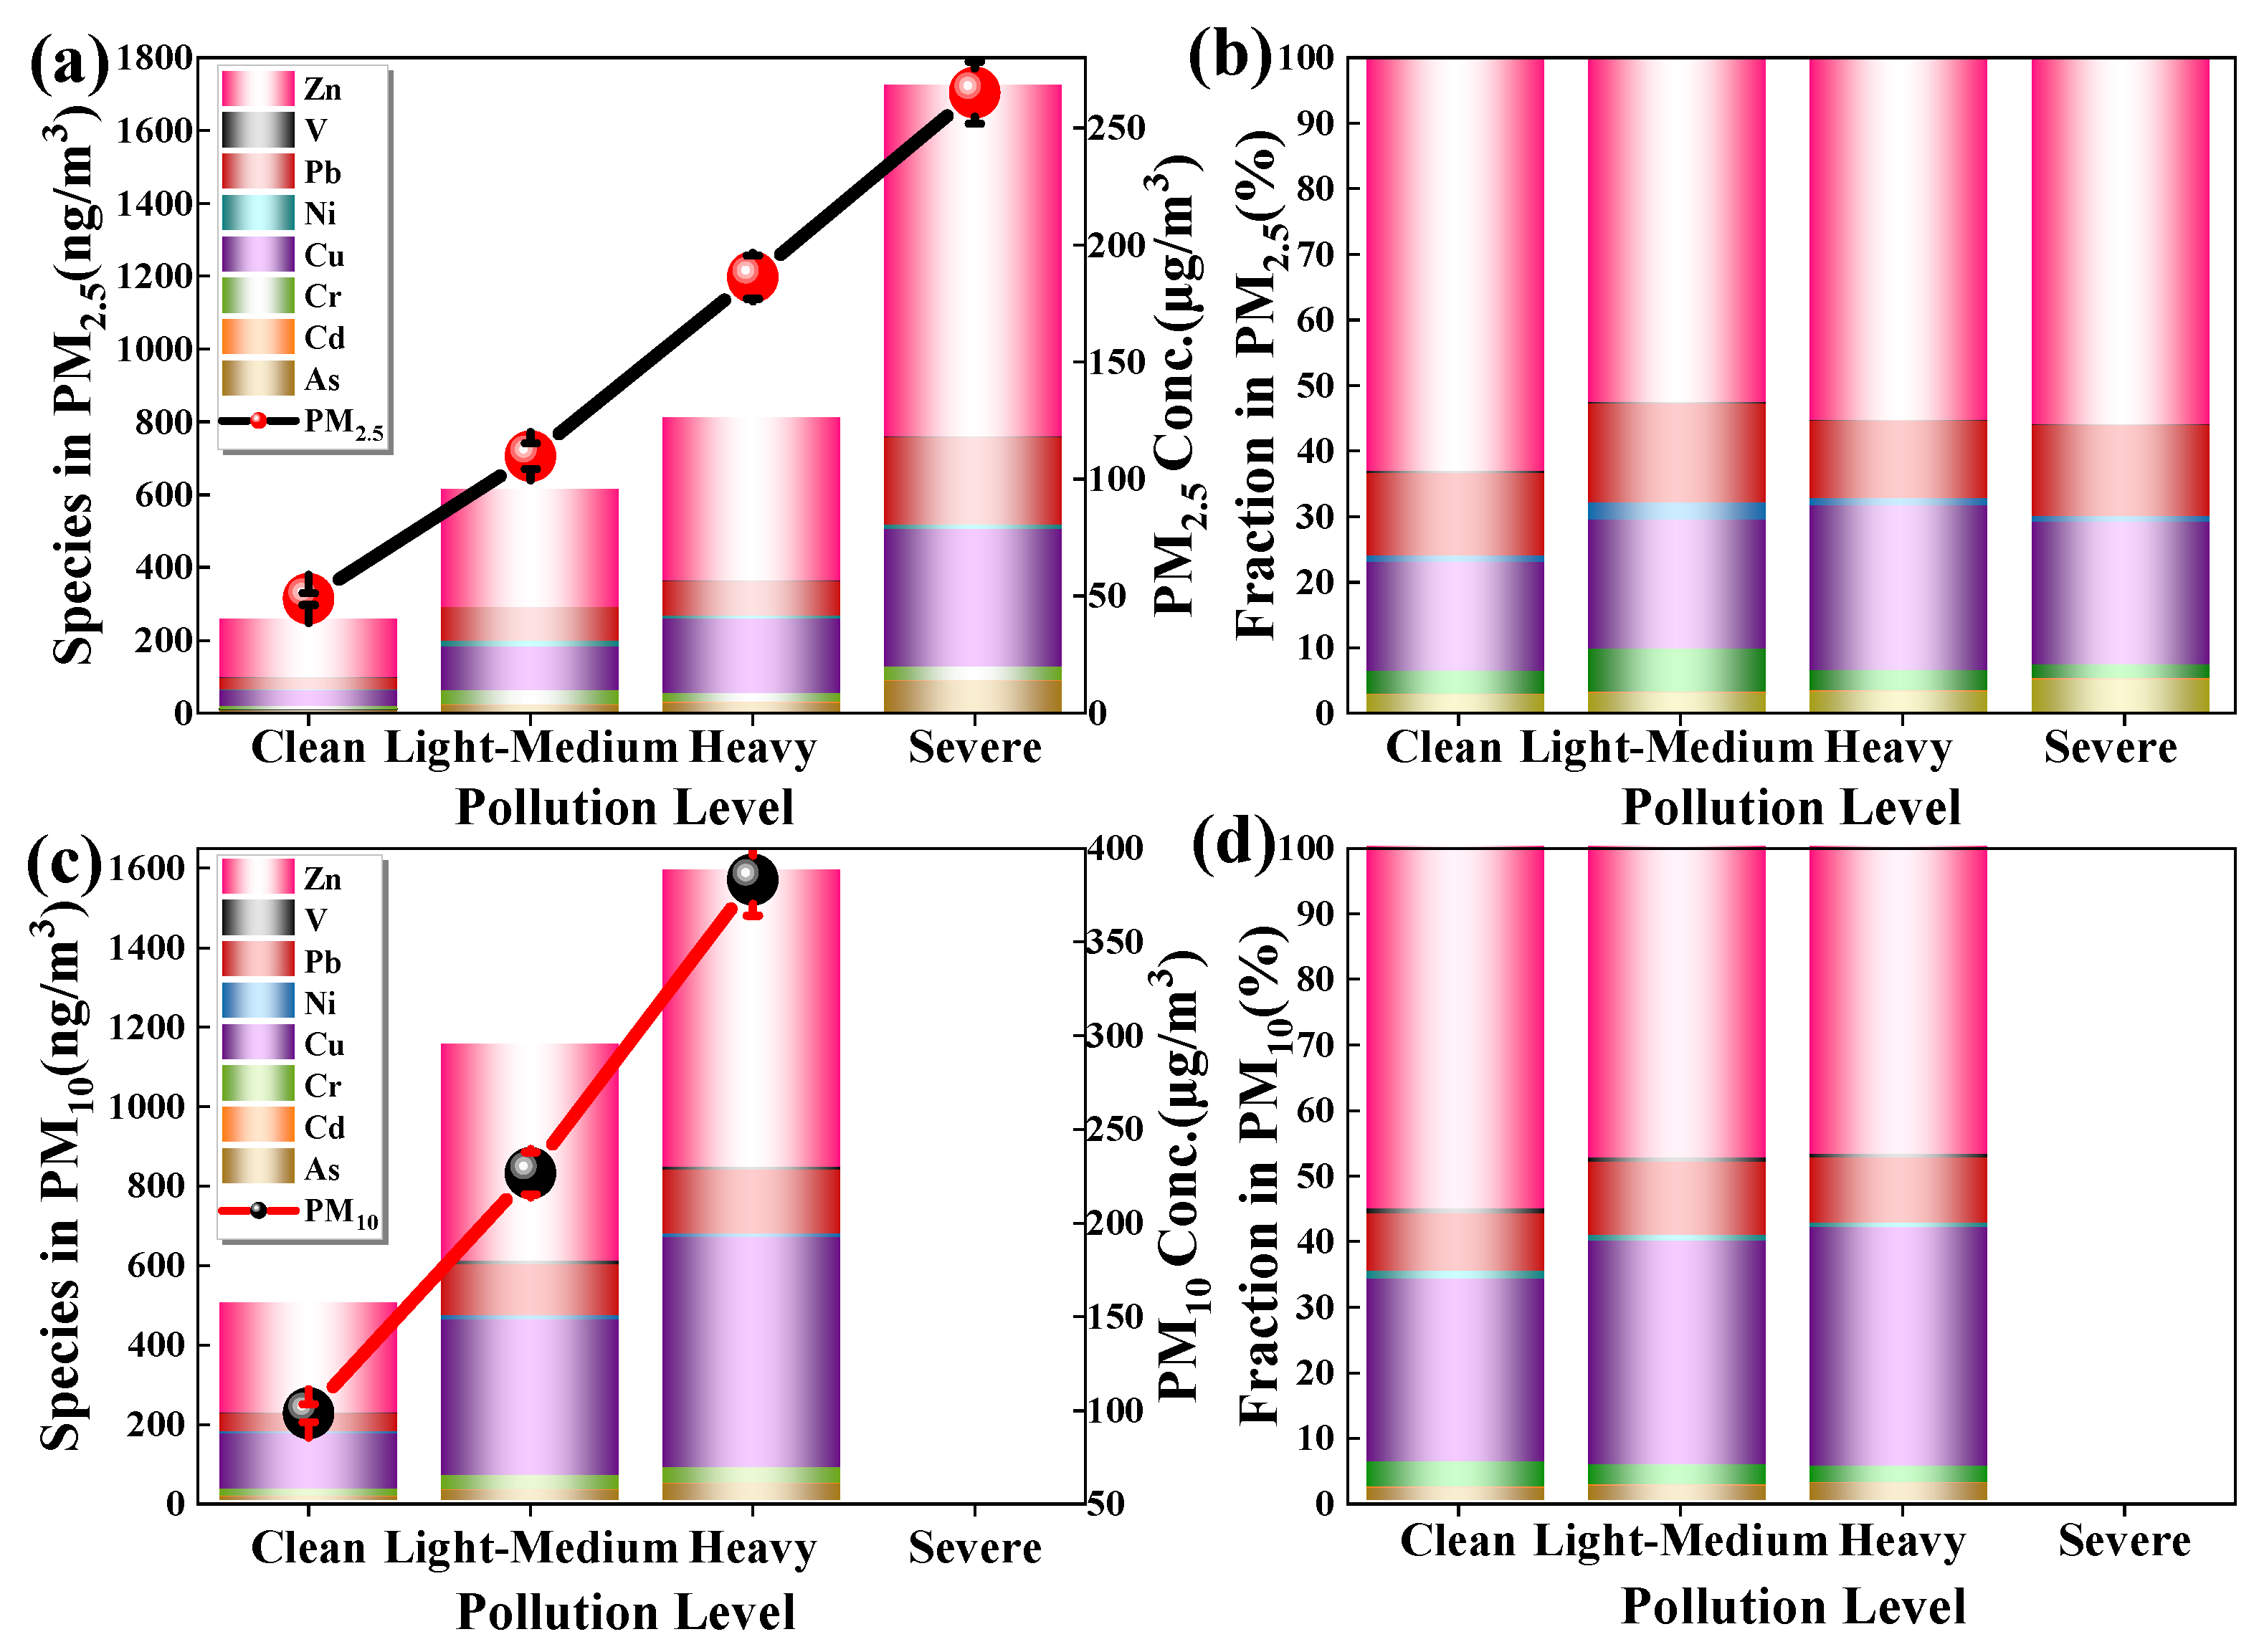
3.2. Heavy Metals Characteristics and the Potential Use

The content of heavy metals in PM at different pollution levels is shown in Figure 4. The content of heavy metals varies greatly at different levels of pollution (average values are shown in Tables S1 and S2). At each pollution level, the heavy metal content in PM10 was significantly higher than that of PM2.5. With the increase of pollution level, the total amount of heavy metals in the particles gradually increased, but the degree of increase gradually decreased. In PM2.5 and PM10, the order of heavy metal content at each pollution level was Zn > Cu> Pb > Cr > As > Ni > V > Cd. It is reported that Zn, Cu, Cr, Pb mainly come from exhaust emissions of motor vehicles or the wear of brake pads and tires [34,35,36], and Pb, As, Ni come from coal and petroleum combustion [13,37]. Cd is related to industrial processes [13,38], and V may come from mining or soil fertilizer use [39]. Lead, zinc, and copper account for a relatively high proportion, which is related to automobile exhaust. Urban traffic jams are becoming more and more serious, leading to frequent braking and start-up of vehicles, which aggravates the emission of heavy metals in the exhaust gas. Beijing is the city with the largest number of cars in China, and car exhaust has been studied in Beijing as a factor [40,41]. Chengdu is the second-largest city in the country for car ownership, so the contribution of car exhaust to Chengdu’s atmospheric particulate matter is also significant [42].
The relative percentage content of all heavy metals is almost constant at each pollution level. The content of heavy metals (HM) per particle at different pollution levels is shown in Figure S1 (Supplementary Information). It can be seen that the heavy metals per particle changes with the increase of particle concentration. The heavy metals content per particle in PM2.5 is always higher than that for PM10.
At the Light-Medium level, the ratio of heavy metals in PM2.5 to heavy metals in PM10 is the largest, indicating that heavy metals are mainly concentrated in fine particles at this pollution level. At the Heavy levels, the content of heavy metals in PM10 and PM2.5 is the smallest, and the contribution of heavy metals in PM2.5 to that in PM10 is the smallest, indicating that heavy metals enriched in coarser particles may be discharged into the atmosphere at this pollution level. At the severe level, the heavy metal content increased sharply. For example, on 3rd January 2017, it was found that the wind speed was the lowest during the study period (0.5 m/s). The wind speed on the previous day (2 January) was relatively higher (0.9 m/s) and from the northwest. It is speculated that the heavy metal content on January 3rd sharply increased due to the metal sources carried by the wind from the northwest of Chengdu.

3.3. Ions in PM

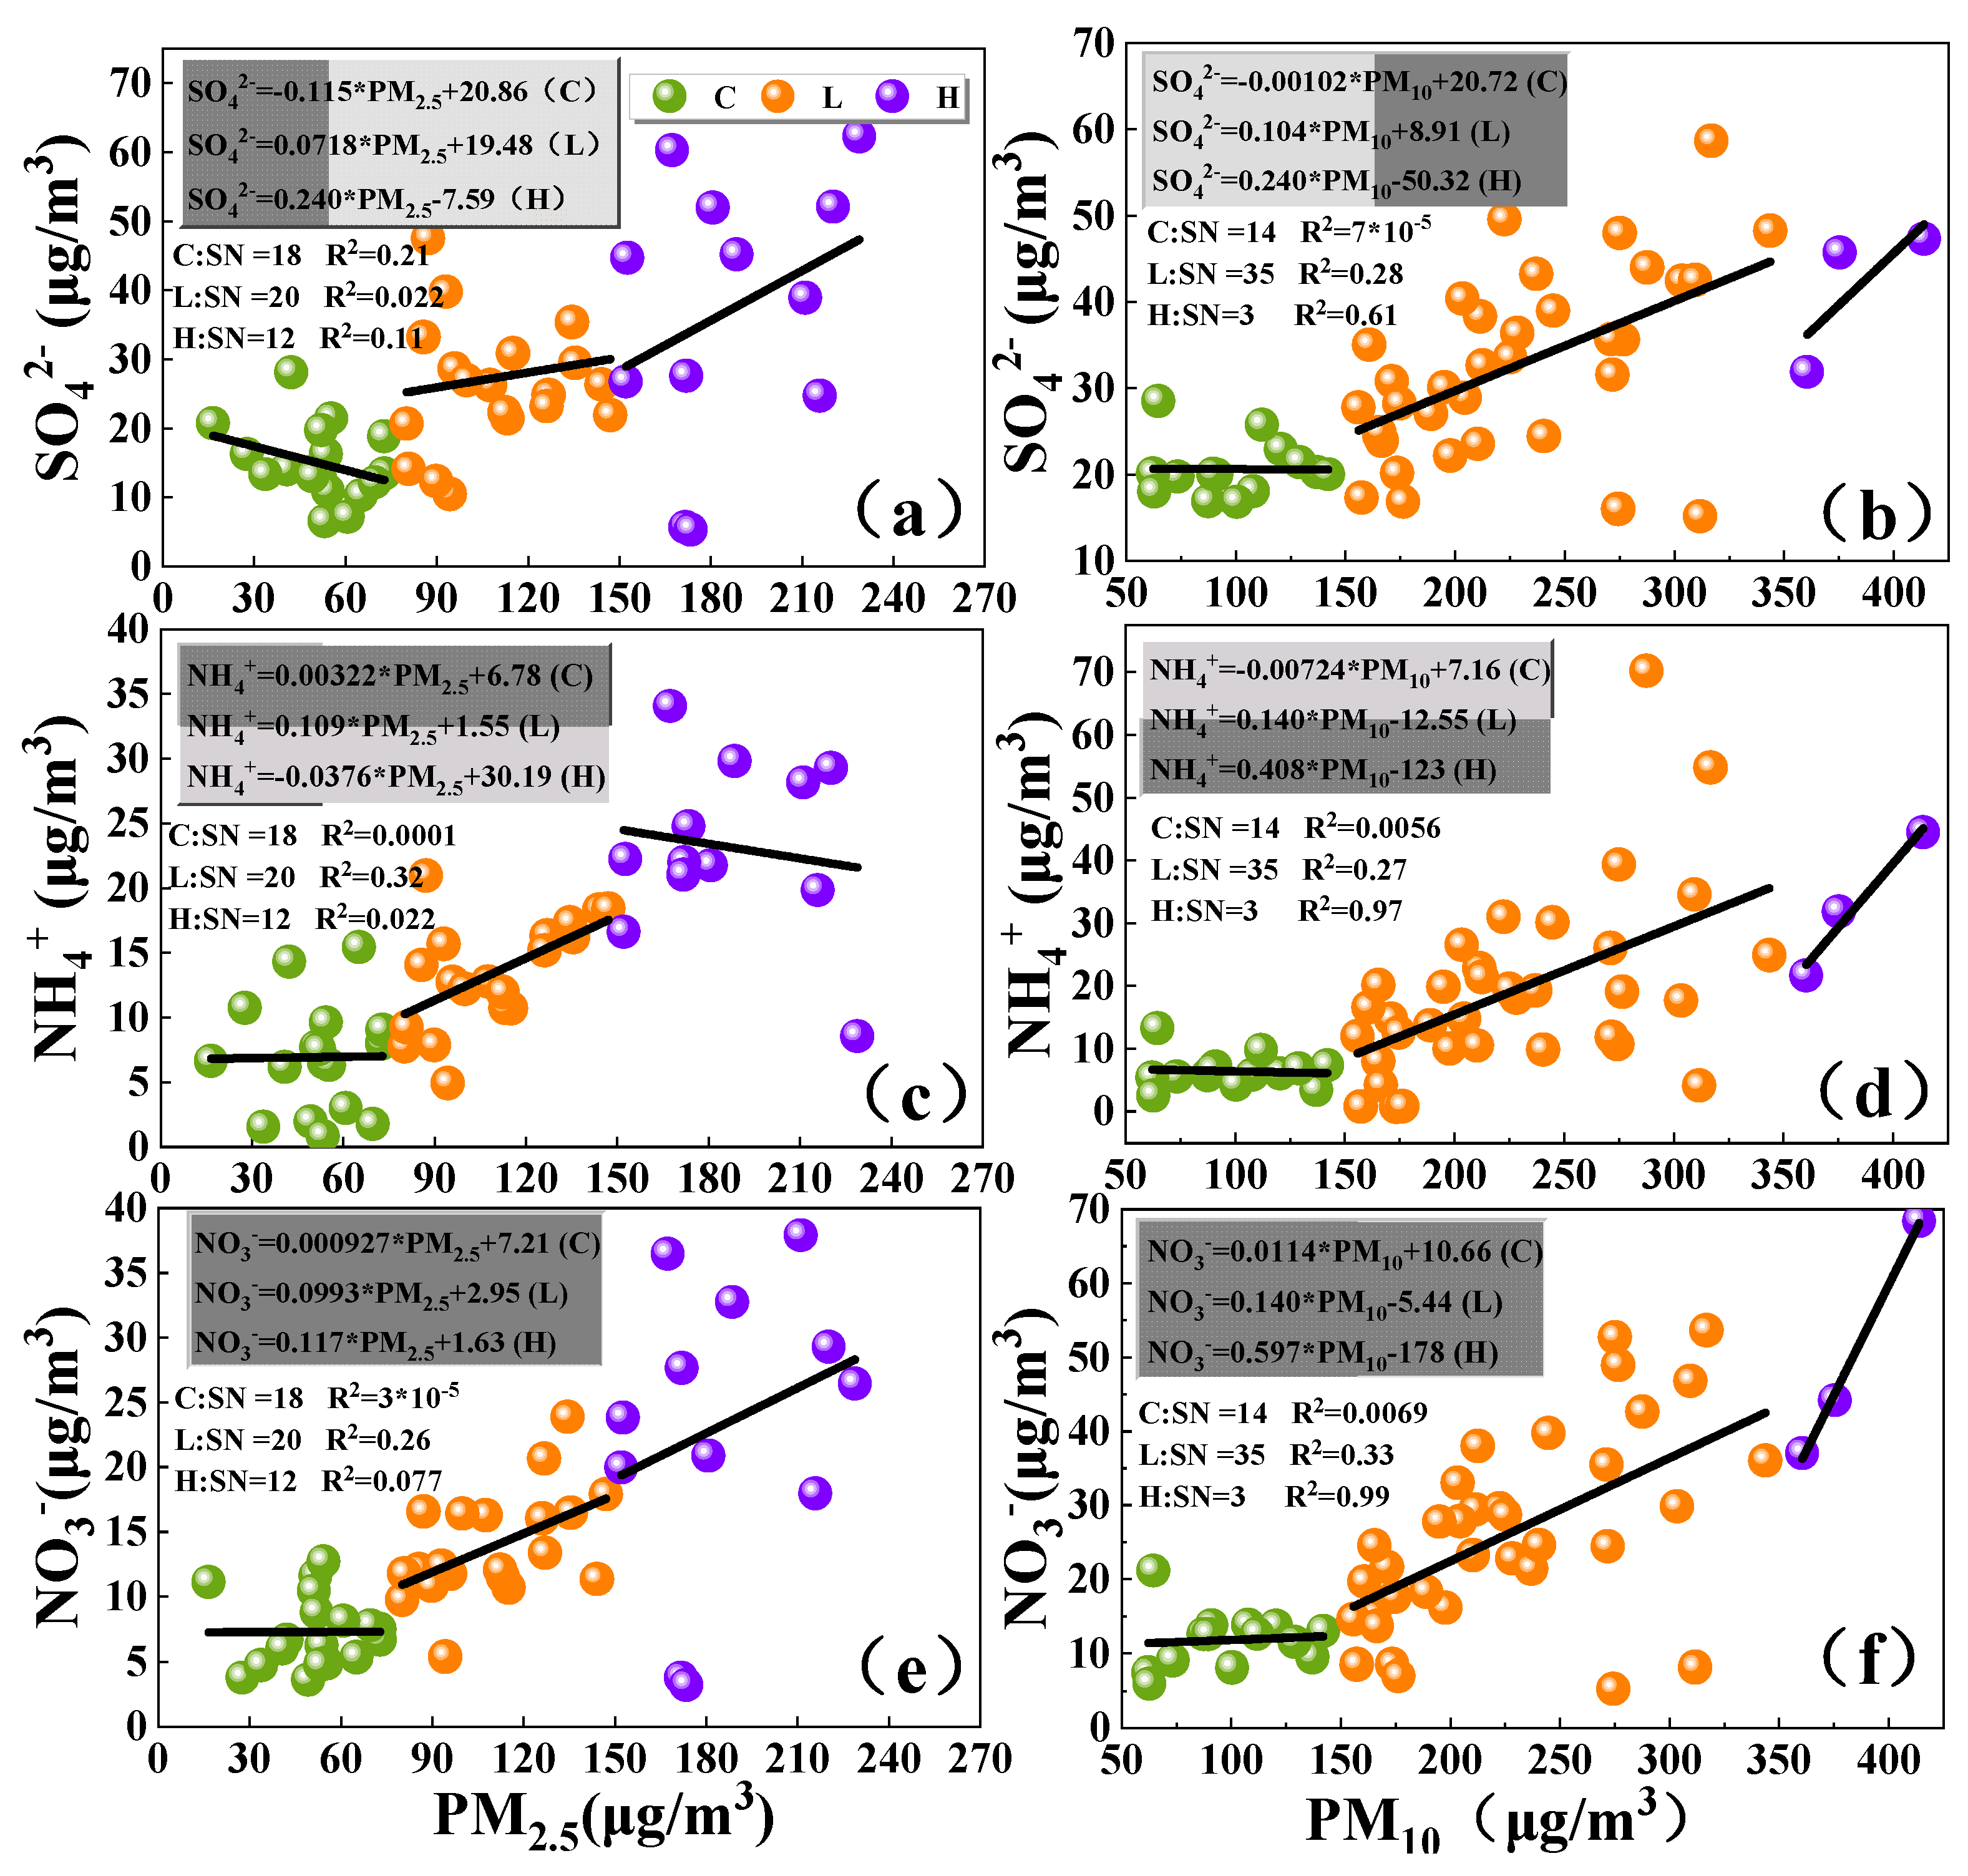
3.3.1. Ions Characteristics at Different Pollution Levels

The ions in PM have significant differences at different pollution levels (Figure 5). From Clean to the subsequent pollution levels, the ion content in the particles increased gradually (see Tables S3 and S4 for the average values). The order of ion content in PM2.5 was SO42− > NO3 > NH4+ > Cl > K+ > Na+ > Ca2+ > F > Mg2+. Among them, SO42−, NO3, and NH4+ accounted for 43.02%, 24.23% and 23.50% of the total ion content, respectively. The order of ion content, in PM10 was SO42− > NO3 > NH4+ > Ca2+ > K+ > Cl > Na+ > Mg2+ > F, while SO42−, NO3, NH4+ accounted for 34.56%, 27.43%, 19.18% of the total ion content, respectively. The results showed that the secondary ions (SO42−, NO3, NH4+) were the main ions in Chengdu atmospheric particles.
However, unlike the heavy metal percentage distribution, the relative percentage of each ion varies significantly at different pollution levels. In PM10, the percentage of Ca2+ was significantly higher than that of PM2.5, indicating that Ca2+ is more likely to be enriched in coarse particles. Coarse particles often are dust, and CaCO3 is a major component of dust, which is the same as previous studies in Chengdu [13,27]. From Clean to the subsequent pollution levels, the relative percentages of NO3, NH4+ gradually increased, but the relative percentages of Ca2+, K+, Na+, and SO42− gradually decreased, and the relative percentages of Mg2+, Cl, and F were basically stable. This result demonstrated atmospheric polluting processes in Chengdu were mainly caused by particles with ions such as NO3 and NH4+ during the research period.
It is reported that with the control of SO2 pollution in China, the sulfate content in PM has been significantly reduced [43,44]. At the same time, NO3 and SO42− will interact, and NOx will catalyze the conversion of SO2 to SO42− [45]. The oxidation of a large amount of SO2 will not only produce SO42− but also promote the formation of NO3 on water particles [46]. Therefore, SO2, as the precursor of sulfate, is oxidized, as NOx is converted to NO3, and the conversion of SO2 should be slow and reduced.
Figure S2 (Supplementary Information) shows the content of ions per particle at the different pollution levels. The content of ions in particles is obviously different at different pollution levels. From Clean to Heavy or Severe, the content of ions in PM2.5 and PM10 decreased gradually. The ion content per particle in PM2.5 is always greater than that for PM10 at each pollution level, but the ratio of ion content per particle in PM2.5 to PM10 decreases gradually from Clean to Heavy. The results indicate that ions may mainly enrich fine particles, but the proportion of ions in coarser particles gradually increases as the particle concentration increases.

3.3.2. Characteristics of Sulfate-Nitrate-Ammonium (SNA)

Figure 6 shows the changes of parameters related to SNA (SO42−, NO3, NH4+) at different pollution levels. From Clean to the subsequent pollution levels, SOR is always greater than NOR, but the degree the two increases with the pollution levels are different. NOR in PM2.5 increased from 0.11 (Clean) to 0.22 (Severe), and SOR increased from 0.43 (Clean) to 0.61 (Severe). NOR in PM10 increased from 0.16 (Clean) to 0.29 (Heavy), and the SOR increased from 0.52 (Clean) to 0.60 (Heavy). Early studies have shown that, when SOR is greater than 0.1, there is a photochemical reaction of SO2 in the atmosphere [47]. This result indicates that SO2 is more susceptible to secondary conversion than NO2. The sulfate and nitrate in this study were largely formed through secondary reactions.
The formation of SNA is closely related to meteorological conditions (relative humidity and temperature) [48,49,50]. When the relative humidity is low, the main reaction is a gas-phase reaction, and when the relative humidity is high, the main reaction is a heterogeneous reaction on particles [51,52]. According to Pandis and Seinfeld [53], the liquid-phase oxidation of SO2 may be an important way to generate SO42−, while NO3 is mainly generated by gas-phase oxidation of NOx. So, the effect of humidity on SO42− is more significant. With the increase in pollution levels, the relative humidity increased from 76% to 83%. As the air approached saturation, the particle concentration increased, and the temperature decreased (PM2.5: 21.7–11.8 °C; PM10: 19.8–17.8 °C). It can be seen that nitrate and sulfate in this study tended to form through heterogeneous reactions with the change of pollution level. Sulfate and nitrate are important hygroscopic ions, which can promote the hygroscopic growth of atmospheric particles and have a great impact on visibility and temperature [3,54,55]. The NO3/SO42 ratio has large differences at different pollution levels, which gradually increase with the increase of pollution levels, and the aerosol ions will be easier to absorb moisture [56]. NO3 represents mobile source, and SO42− represents fixed source. The NO3/SO42− ratio is often used to indicate whether particulate matter is dominated by mobile source or fixed source. The NO3/SO42 ratio increased from 0.52 (Clean) to 0.95 (Severe) in PM2.5, and increased from 0.57 (Clean) to 1.20 (Heavy) in PM10. The results show that the contribution of pollution caused by mobile sources to the increase of PM is gradually increasing. In the fine particles, it is a mainly fixed pollution source at different pollution levels. While in the coarse particles, it is a mainly fixed pollution source at Clean and Light-Medium levels, and mainly mobile sources at the Heavy.
Figure 7 shows the correlation between SNA and PM at different pollution levels. The relative contribution of SNA to the increase of PM2.5 and PM10 at each pollution level is different. At Clean levels, the contribution of SO42− to the increase of PM2.5 is 11.5%, which is much larger than the contribution of other ions, and the relative contribution of SNA to PM10 is very small. At Light-Medium levels, the contributions of SO42−, NH4+, NO3 to PM differ (PM2.5: 7.18%, 10.9%, 9.93%; PM10: 10.4%, 14.0%, 14.0%). Sulfates contributed more to PM2.5 at the Clean levels because of the trend to form ammonium sulfate during the formation of SNA in the inhomogeneous phase, which impeded the formation of ammonium nitrate. This result is reflected in more contribution of nitrate to PM at the Light-Medium levels, compared to the Clean levels. At Heavy levels, the contributions of SO42−, NH4+, NO3 to PM are significantly different (PM2.5: 24.0%, 3.76%, 11.7%; PM10: 24.0%, 40.8%, 59.7%). This result shows sulfate is more likely to be enriched in fine particles at each level. Nitrate and ammonium salts are easily concentrated in fine particles at Clean and Light-medium pollution levels, while they are easily concentrated in coarse particles at Heavy pollution levels (NO3: 59.7%; NH4+: 40.8%). The secondary conversion of SO2 is mainly liquid-phase reaction, which is closely related to relative humidity. The relative humidity of the Heavy level is the largest (83%), so the contribution of sulfate to particles is also the largest at this level. The secondary reaction of NO2 is a mainly gas-phase reaction. The atmospheric temperature is lower than other levels at Heavy levels, which is not conducive to the secondary generation of NO2. However, it has been reported that it is conducive to the stable existence of NH4NO3. Therefore, the contribution of NO3 to PM is relatively large at Heavy levels [57].

4. Conclusions

The present study analyzed the distribution and changes of heavy metals and water-soluble ions in PM2.5 and PM10 during the haze periods from March 2016 to January 2017 in Chengdu, China at different pollution levels. It revealed the concentration of PM was closely related to meteorological conditions and the effect on fine particles is more significant. Heavy metals were more easily enriched in fine particles at different pollution levels, and the relative percentage content was basically stable. However, the relative percentage of water-soluble ions varied with the pollution level, and the relative percentage of NO3 and NH4+ increased gradually. The water-soluble ions in the particles during the study were mainly SO42−, NO3 and NH4+ and mainly from secondary reactions. Furthermore, the contribution of SNA to the increase of PM was variable at different pollution levels. It was mainly SO42− in PM at Clean levels, and mainly NH4+ and NO3 at Light-Medium levels. At Heavy levels, it is mainly SO42− in PM2.5, and mainly NH4+ and NO3 in PM10. Mobile sources are contributing more to the occurrence of haze in Chengdu, which should have more attention paid to it. The results of this research not only enrich the air pollution research in Chengdu, China, but also provide a reference for the urban air pollution research with the same background. The deficiency lies in the lack amount of PM10 samples under Heavy and Severe pollution levels. The next step will be to study the source analysis of PM quantitatively.

Supplementary Materials

The following are available online at https://www.mdpi.com/article/10.3390/atmos12080990/s1, Figure S1: Changes of heavy metals per particle at different pollution levels, Figure S2. Change in ions per particle at different pollution levels, Table S1: Average mass concentrations of heavy metals in PM2.5 at different pollution levels (ng/m3), Table S2: Average mass concentrations of heavy metals in PM10 at different pollution levels (ng/m3), Table S3: Average mass concentration of ions in PM2.5 at different pollution levels (μg/m3), Table S4: Average mass concentration of ions in PM10 at different pollution levels (μg/m3).

Author Contributions

Y.H.: Conceptualization, Resources, Funding acquisition; L.W.: Data curation, Writing—Original draft preparation; X.C.: Methodology, Validation; J.W.: Methodology, Supervision; T.L. and M.H.: Investigation; H.S. and M.Z.: Visualization; S.S.H.: Writing—Reviewing and Editing; S.N.: Project administration. All authors have read and agreed to the published version of the manuscript.

Funding

This research was funded by the National Natural Science Foundation of China, grant number 41977289 and the Major Science and Technology Projects of Sichuan Province, grant number 21CXTD0015.

Institutional Review Board Statement

Not applicable.

Acknowledgments

This study was supported by the National Natural Scientific Foundation of China (41977289), and the Science and Technology Department of Sichuan Province (2021JDTD0013).

Conflicts of Interest

The authors declare that they have no known competing financial interests or personal relationships that could have appeared to influence the work reported in this paper.

References

  1. Begam, G.R.; Vachaspati, C.V.; Ahammed, Y.N.; Kumar, K.R.; Reddy, R.R.; Sharma, S.K.; Saxena, M.; Mandal, T.K. Seasonal characteristics of water-soluble inorganic ions and carbonaceous aerosols in total suspended particulate matter at a rural semi-arid site, Kadapa (India). Environ. Sci. Pollut. Res. 2017, 24, 1719–1734. [Google Scholar] [CrossRef] [PubMed]
  2. Wang, H.B.; Qiao, B.Q.; Zhang, L.M.; Yang, F.M.; Jiang, X. Characteristics and sources of trace elements in PM2.5 in two megacities in Sichuan Basin of southwest China. Environ. Pollut. 2018, 242, 1577–1586. [Google Scholar] [CrossRef] [PubMed]
  3. Bai, Z.P.; Ji, Y.; Pi, Y.Q.; Yang, K.X.; Wang, L.; Zhang, Y.Q.; Zhai, Y.D.; Yan, Z.G.; Han, X.D. Hygroscopic analysis of individual Beijing haze aerosol particles by environmental scanning electron microscopy. Atmos. Environ. 2018, 172, 149–156. [Google Scholar] [CrossRef]
  4. Chen, J.Y.; Jiang, X.Y.; Shi, C.L.; Liu, R.C.; Lu, R.; Zhang, L. Association between gaseous pollutants and emergency ambulance dispatches for asthma in Chengdu, China: A time-stratified case-crossover study. Environ. Health Prev. Med. 2019, 24, 20. [Google Scholar] [CrossRef]
  5. Zhu, X.J.; Qiu, H.; Wang, L.Y.; Duan, Z.Q.; Yu, H.Y.; Deng, R.; Zhang, Y.Y.; Zhou, L. Risks of hospital admissions from a spectrum of causes associated with particulate matter pollution. Sci. Total Environ. 2019, 656, 90–100. [Google Scholar] [CrossRef]
  6. Chen, Y.; Xie, S.D. Long-term trends and characteristics of visibility in two megacities in southwest China: Chengdu and Chongqing. J. Air Waste Manag. Assoc. 2013, 63, 1058–1069. [Google Scholar] [CrossRef]
  7. Ning, G.C.; Wang, S.G.; Ma, M.J.; Ni, C.J.; Shang, Z.W.; Wang, J.X.; Li, J.X. Characteristics of air pollution in different zones of Sichuan Basin, China. Sci. Total Environ. 2018, 612, 975–984. [Google Scholar] [CrossRef] [PubMed]
  8. Wang, J.; Zhou, M.; Liu, B.S.; Wu, J.H.; Peng, X.; Zhang, Y.F.; Han, S.Q.; Feng, Y.C.; Zhu, T. Characterization and source apportionment of size-segregated atmospheric particulate matter collected at ground level and from the urban canopy in Tianjin. Environ. Pollut. 2016, 219, 982–992. [Google Scholar] [CrossRef]
  9. Fu, X.X.; Wang, X.M.; Hu, Q.H.; Li, G.H.; Ding, X.; Zhang, Y.L.; He, Q.F.; Liu, T.Y.; Zhang, Z.; Yu, Q.Q.; et al. Changes in visibility with PM2.5 composition and relative humidity at a background site in the Pearl River Delta region. J. Environ. Sci. 2016, 40, 10–19. [Google Scholar] [CrossRef]
  10. Zhang, W.; Jiang, Y.; Luo, B. Characteristics of water-soluble ions in PM2.5 in winter in west Sichuan plain. Chin. J. Environ. Sci. Technol. 2018, 41, 111–116. [Google Scholar]
  11. Lin, Y.; Ye, Z.X.; Yang, H.J.; Zhang, J.; Zhu, Y.M. Analysis of pollution characteristics and sources of atmospheric PM1 in downtown Chengdu. China Environ. Sci. 2017, 37, 3220–3226. [Google Scholar]
  12. Li, J.Q.; Zhang, J.K.; Dong, G.M.; Deng, J.L.; Liu, Z.R.; Wang, Y.S. Characteristics of water-soluble inorganic ions in atmospheric PM2.5 in Chengdu in the later period of “Action Plan for Air Pollution Prevention and Control”. Environ. Sci. 2021, 1–10. (In Chinese) [Google Scholar] [CrossRef]
  13. Wang, Q.Y.; Cao, J.J.; Shen, Z.X.; Tao, J.; Xiao, S.; Luo, L.; He, Q.Y.; Tang, X.Y. Chemical characteristics of PM2.5 during dust storms and air pollution events in Chengdu, China. Particuology 2013, 11, 70–77. [Google Scholar] [CrossRef]
  14. Tao, J.; Zhang, L.M.; Engling, G.; Zhang, R.J.; Yang, Y.H.; Cao, J.J.; Zhu, C.S.; Wang, Q.Y.; Luo, L. Chemical composition of PM2.5 in an urban environment in Chengdu, China: Importance of springtime dust storms and biomass burning. Atmos. Res. 2013, 122, 270–283. [Google Scholar] [CrossRef]
  15. Xiao, K.; Wang, Y.K.; Wu, G.; Fu, B.; Zhu, Y.Y. Spatiotemporal Characteristics of Air Pollutants (PM10, PM2.5, SO2, NO2, O3, and CO) in the Inland Basin City of Chengdu, Southwest China. Atmosphere 2018, 9, 74. [Google Scholar] [CrossRef] [Green Version]
  16. Zeng, W.; Zhang, Y.C.; Wang, L.; Wei, Y.L.; Lu, R.; Xia, J.J.; Chai, B.; Liang, X. Ambient fine particulate pollution and daily morbidity of stroke in Chengdu, China. PLoS ONE 2018, 13, e0206836. [Google Scholar] [CrossRef]
  17. Wang, H.B.; Tian, M.; Chen, Y.; Shi, G.M. Seasonal characteristics, formation mechanisms and geographical origins of PM2.5 in two megacities in Sichuan Basin, China. Atmos. Chem. Phys. 2018, 18, 865–881. [Google Scholar] [CrossRef] [Green Version]
  18. Chen, Y.; Xie, S.D.; Luo, B. Analysis of composition and pollution characteristics of fine particulate matter in Chengdu, 2012–2013. Chin. J. Environ. Sci. 2016, 36, 1021–1031. [Google Scholar]
  19. Tao, J.; Gao, J.; Zhang, L.B.; Zhang, R.S.; Che, H.Z.; Zhang, Z.Z.; Lin, Z.J.; Jing, J.; Cao, J.J.; Hsu, S.C. PM2.5 pollution in a megacity of southwest China: Source apportionment and implication. Atmos. Chem. Phys. 2014, 14, 8679–8699. [Google Scholar] [CrossRef] [Green Version]
  20. Li, L.L.; Tan, Q.W.; Zhang, Y.H.; Feng, M.; Qu, Y.; An, J.L.; Liu, X.G. Characteristics and source apportionment of PM2.5 during persistent extreme haze events in Chengdu, southwest China. Environ. Pollut. 2017, 230, 718–729. [Google Scholar] [CrossRef] [PubMed]
  21. Shi, G.L.; Tian, Y.Z.; Ma, T.; Song, D.L.; Zhou, L.D.; Han, B.; Feng, Y.C.; Russell, A.G. Size distribution, directional source contributions and pollution status of PM from Chengdu, China during a long-term sampling campaign. J. Environ. Sci. 2017, 56, 1–11. [Google Scholar] [CrossRef]
  22. Zhou, J.B.; Xing, Z.Y.; Deng, J.J.; Du, K. Characterizing and sourcing ambient PM2.5 over key emission regions in China I: Water-soluble ions and carbonaceous fractions. Atmos. Environ. 2016, 135, 20–30. [Google Scholar] [CrossRef]
  23. Song, M.D.; Liu, X.G.; Tan, Q.W.; Feng, M.; Qu, Y.; An, J.L.; Zhang, Y.H. Characteristics and formation mechanism of persistent extreme haze pollution events in Chengdu, southwestern China. Environ. Pollut. 2019, 251, 1–12. [Google Scholar] [CrossRef]
  24. Zeng, S.L.; Zhang, Y. The Effect of Meteorological Elements on Continuing Heavy Air Pollution: A Case Study in the Chengdu Area during the 2014 Spring Festival. Atmosphere 2017, 8, 71. [Google Scholar] [CrossRef] [Green Version]
  25. Feng, Y.P.; Zhang, J.K.; Huang, X.J.; Liu, Q.; Zhang, W.; Zhang, J.Q. Pollution characteristics of water-soluble inorganic ions in chengdu in summer and winter. Huan Jing Ke Xue = Huanjing Kexue/[Bian Ji, Zhongguo Ke Xue Yuan Huan Jing Ke Xue Wei Yuan Hui “Huan Jing Ke Xue” Bian Ji Wei Yuan Hui.] 2020, 41, 3012–3020. [Google Scholar] [CrossRef]
  26. Jiang, Y.; He, G.Y.; Luo, B.; Chen, J.W.; Wang, B.; Du, Y.S.; Du, M. Characteristics of inorganic water-soluble ion pollution in atmospheric particulate matter in Chengdu plain. Chin. J. Environ. Sci. 2016, 37, 2863–2870. [Google Scholar]
  27. Tao, Y.L.; Li, Q.K.; Zhang, J.S.; Li, Q.; Li, X.D. Seasonal variation characteristics of particle size distribution and water-soluble ion composition in Chengdu. Chin. J. Environ. Sci. 2017, 38, 4034–4043. [Google Scholar]
  28. Song, X.Y.; Li, J.J.; Shao, L.Y.; Zheng, Q.M.; Zhang, D.Z. Inorganic ion chemistry of local particulate matter in a populated city of North China at light, medium, and severe pollution levels. Sci. Total Environ. 2019, 650, 566–574. [Google Scholar] [CrossRef]
  29. Ma, Q.X.; Wu, Y.F.; Zhang, D.Z.; Wang, X.J.; Xia, Y.J.; Liu, X.Y.; Tian, P.; Han, Z.W.; Xia, X.G.; Wang, Y.; et al. Roles of regional transport and heterogeneous reactions in the PM2.5 increase during winter haze episodes in Beijing. Sci. Total Environ. 2017, 599–600, 246–253. [Google Scholar] [CrossRef] [PubMed]
  30. Cui, Y.; Yin, F.; Deng, Y.; Volinn, E.; Chen, F.; Ji, K.; Zeng, J.; Zhao, X.; Li, X.S. Heat or Cold: Which One Exerts Greater Deleterious Effects on Health in a Basin Climate City? Impact of Ambient Temperature on Mortality in Chengdu, China. Int. J. Environ. Res. Public Health 2016, 13, 1225. [Google Scholar] [CrossRef] [PubMed] [Green Version]
  31. Chengdu Yearbook. Available online: http://www.chengduyearbook.com/ (accessed on 10 October 2017).
  32. Chengdu Bureau of Statistics. Available online: http://cdstats.chengdu.gov.cn/ (accessed on 10 October 2017).
  33. Kang, C.-M.; Lee, H.S.; Kang, B.-W.; Lee, S.-K.; Sunwoo, Y. Chemical characteristics of acidic gas pollutants and PM2.5 species during hazy episodes in Seoul, South Korea. Atmos. Environ. 2004, 38, 4749–4760. [Google Scholar] [CrossRef]
  34. Mukhtar, A.; Limbeck, A. Recent developments in assessment of bio-accessible trace metal fractions in airborne particulate matter: A review. Anal. Chim. Acta 2013, 774, 11–25. [Google Scholar] [CrossRef] [PubMed]
  35. Gao, P.; Lei, T.T.; Jia, L.M.; Song, Y.; Lin, N.; Du, Y.Q.; Feng, Y.J.; Zhang, Z.H.; Cui, F.Y. Exposure and health risk assessment of PM2.5-bound trace metals during winter in university campus in Northeast China. Sci. Total Environ. 2017, 576, 628–636. [Google Scholar] [CrossRef] [PubMed]
  36. Jin, Y.L.; O'Connor, D.; Ok, Y.S.; Tsang, D.C.W.; Liu, A.; Hou, D.Y. Assessment of sources of heavy metals in soil and dust at children’s playgrounds in Beijing using GIS and multivariate statistical analysis. Environ. Int. 2019, 124, 320–328. [Google Scholar] [CrossRef]
  37. Tian, H.Z.; Zhao, D.; He, M.C.; Wang, Y.; Cheng, K. Temporal and spatial variation characteristics of atmospheric emissions of Cd, Cr, and Pb from coal in China. Atmos. Environ. 2012, 50, 157–163. [Google Scholar] [CrossRef]
  38. Liu, G.; Li, J.H.; Wu, D.; Xu, H. Chemical composition and source apportionment of the ambient PM2.5 in Hangzhou, China. Particuology 2015, 18, 135–143. [Google Scholar] [CrossRef]
  39. Hu, R.; Zhou, X.L.; Wang, Y.N.; Fang, Y.M. Survey of atmospheric heavy metal deposition in Suqian using moss contamination. Hum. Ecol. Risk Assess. Int. J. 2019, 26, 1–15. [Google Scholar] [CrossRef]
  40. Yang, Y.R.; Liu, X.G.; Qu, Y.; Wang, J.L.; An, J.L.; Zhang, Y.H.G.; Zhang, F. Formation mechanism of continuous extreme haze episodes in the megacity Beijing, China, in January 2013. Atmos. Res. 2015, 155, 192–203. [Google Scholar] [CrossRef]
  41. Wang, Y.H.; Liu, Z.R.; Zhang, J.K.; Hu, B.; Ji, D.S.; Yu, Y.C.; Wang, Y.S. Aerosol physicochemical properties and implications for visibility during an intense haze episode during winter in Beijing. Atmos. Chem. Phys. 2015, 15, 3205–3215. [Google Scholar] [CrossRef] [Green Version]
  42. Wu, M.; Wu, D.; Xia, J.R.; Zhao, T.L.; Yang, Q.J. Analysis of pollution characteristics and sources of PM2.5 chemical components in winter in Chengdu. Chin. J. Environ. Sci. 2019, 40, 76–85. [Google Scholar]
  43. Yang, Y.R.; Liu, X.G.; Qu, Y.; An, J.L.; Jiang, R.; Zhang, Y.H.; Sun, Y.L.; Wu, Z.J.; Zhang, F. Characteristics and formation mechanism of continuous hazes in China: A case study during the autumn of 2014 in the North China Plain. Atmos. Chem. Phys. 2015, 15, 8165–8178. [Google Scholar] [CrossRef] [Green Version]
  44. Zhang, X.Y.; Wang, J.Z.; Wang, Y.Q.; Liu, H.L.; Sun, J.Y.; Zhang, Y.M. Changes in chemical components of aerosol particles in different haze regions in China from 2006 to 2013 and contribution of meteorological factors. Atmos. Chem. Phys. 2015, 15, 12935–12952. [Google Scholar] [CrossRef] [Green Version]
  45. He, H.; Wang, Y.S.; Ma, Q.X.; Ma, J.Z.; Chu, B.W.; Ji, D.S.; Tang, G.Q.; Liu, C.; Zhang, H.X.; Hao, J.M. Mineral dust and NOx promote the conversion of SO2 to sulfate in heavy pollution days. Sci. Rep. 2014, 4, 4172. [Google Scholar] [CrossRef]
  46. Wang, Q.Z.; Zhuang, G.S.; Huang, K.; Liu, T.N.; Lin, Y.F.; Deng, C.R.; Fu, Q.Y.; Fu, J.S.; Chen, J.K.; Zhang, W.J.; et al. Evolution of particulate sulfate and nitrate along the Asian dust pathway: Secondary transformation and primary pollutants via long-range transport. Atmos. Res. 2016, 169, 86–95. [Google Scholar] [CrossRef]
  47. Ohta, S.; Okita, T. A chemical characterization of atmospheric aerosol in Sapporo. Atmos. Environ. Part A Gen. Top. 1990, 24, 815–822. [Google Scholar] [CrossRef]
  48. Li, X.D.; Yang, Z.; Fu, P.Q.; Yu, J.; Lang, Y.C.; Liu, D.; Ono, K.; Kawamura, K. High abundances of dicarboxylic acids, oxocarboxylic acids, and α-dicarbonyls in fine aerosols (PM2.5) in Chengdu, China during wintertime haze pollution. Environ. Sci. Pollut. Res. 2015, 22, 12902. [Google Scholar] [CrossRef] [Green Version]
  49. Wang, G.H.; Zhang, R.Y.; Gomez, M.E.; Yang, L.X.; Zamora, M.L.; Hu, M.; Lin, Y.; Peng, J.F.; Guo, S.; Meng, J.J.; et al. Persistent sulfate formation from London Fog to Chinese haze. Proc. Natl. Acad. Sci. USA 2016, 113, 13630–13635. [Google Scholar] [CrossRef] [PubMed] [Green Version]
  50. Li, Y.J.; Sun, Y.L.; Zhang, Q.; Li, X.; Li, M.; Zhou, Z.; Chan, C.K. Real-time chemical characterization of atmospheric particulate matter in China: A review. Atmos. Environ. 2017, 158, 270–304. [Google Scholar] [CrossRef]
  51. He, K.B.; Yang, F.M.; Duan, F.K. Atmospheric Particulate Matter and Regional Combined Pollution; Science Press: Beijing, China, 2011; 450p. [Google Scholar]
  52. Sun, Y.L.; Wang, Z.F.; Fu, P.Q.; Jiang, Q.; Yang, T.; Li, J.; Ge, X.L. The impact of relative humidity on aerosol composition and evolution processes during wintertime in Beijing, China. Atmos. Environ. 2013, 77, 927–934. [Google Scholar] [CrossRef]
  53. Pandis, S.N.; Seinfeld, J.H. Sensitivity analysis of a chemical mechanism for aqueous-phase atmospheric chemistry. J. Geophys. Res. Atmos. 1989, 94, 1105–1126. [Google Scholar] [CrossRef]
  54. Wu, Y.X.; Yin, Y.; Gu, X.S.; Tan, H.B.; Wang, Y. Observation on moisture absorption of atmospheric aerosols in northern suburbs of Nanjing. Chin. J. Environ. Sci. 2014, 34, 1938–1949. [Google Scholar]
  55. Denjean, C.; Caquineau, S.; Desboeufs, K.; Laurent, K.; Maille, M.; Rosado, M.Q.; Vallejo, P.; Mayol-Bracero, O.L.; Formenti, P. Long-range transport across the Atlantic in summertime does not enhance the hygroscopicity of African mineral dust. Geophys. Res. Lett. 2015, 42, 7835–7843. [Google Scholar] [CrossRef]
  56. Sun, J.X.; Liu, L.; Xu, L.; Wang, Y.Y.; Wu, Z.J.; Hu, M.; Shi, Z.B.; Li, Y.J.; Zhang, X.Y.; Chen, J.M.; et al. Key Role of Nitrate in Phase Transitions of Urban Particles: Implications of Important Reactive Surfaces for Secondary Aerosol Formation. J. Geophys. Res. Atmos. 2018, 123, 1234–1243. [Google Scholar] [CrossRef]
  57. Guo, S.; Hu, M.; Wang, Z.B.; Slanina, J.; Zhao, Y.L. Size-resolved aerosol water-soluble ionic compositions in the summer of Beijing: Implication of regional secondary formation. Atmos. Chem. Phys. Discuss. 2009, 9, 23955–23986. [Google Scholar]
Figure 1. Sichuan region of China and sampling site in Chengdu.
Atmosphere 12 00990 g001
Figure 2. Time series of changes in PM mass concentration and related meteorological conditions.
Atmosphere 12 00990 g002
Figure 3. The number of samples that PM2.5 and PM10 were at different pollution levels (a); the concentrations of PM2.5 and PM10 at different pollution levels (b).
Atmosphere 12 00990 g003
Figure 4. (a,b) are the content and percentage of heavy metals in PM2.5 at different pollution levels; (c,d) are the content and percentage of heavy metals in PM10 at different pollution levels.
Atmosphere 12 00990 g004
Figure 5. (a,b) are the content and percentage of water-soluble ions in PM2.5 at different pollution levels, respectively; (c,d) are the content and percentage of water-soluble ions in PM10 at different pollution levels.
Atmosphere 12 00990 g005
Figure 6. Changes of (a) RH, T, PM2.5; (b)SOR, NOR, NO3/SO42, and PM2.5; (c) RH, T, PM10; (d) SOR, NOR, NO3/SO42 and PM10 at different pollution levels (RH: relative humidity; SOR/NOR: sulfur/nitrogen oxidation rate; T: temperature).
Atmosphere 12 00990 g006
Figure 7. Linear regression of SO42− with (a) PM2.5 and (b) PM10, NH4+ with (c) PM2.5 and (d) PM10, NO3 with (e) PM2.5 and (f) PM10 at different pollution levels (p < 0.05; C: Clean; L: Light-Medium; H: Heavy; SN means sample number).
Atmosphere 12 00990 g007
Table 1. Correlation coefficient of PM with meteorological parameters and gas-phase species.
Ws (m/s)RH (%)P (kPa)T (℃)CO (μg·m−3)NO2 (μg·m3)O3 (μg·m3)SO2 (μg·m3)
PM2.5−0.750.980.93−0.990.990.98−0.990.96
PM10−0.980.870.77−0.990.970.98−0.910.93
Publisher’s Note: MDPI stays neutral with regard to jurisdictional claims in published maps and institutional affiliations.

