Article

Enhanced Transcriptomic Resilience following Increased Alternative Splicing and Differential Isoform Production between Air Pollution Conurbations

1
Institute of Zoology, Chinese Academy of Sciences, Beijing 100101, China
2
Department of Respiratory and Critical Care Medicine, Beijing Institute of Respiratory Medicine, Beijing Chao Yang Hospital, Capital Medical University, Beijing 100020, China
3
School of Biosciences, Cardiff University, Cardiff CF10 3US, UK
4
Cardiff School of Health Sciences, Cardiff Metropolitan University, Cardiff CF5 2YB, UK
5
School of Earth and Environmental Sciences, Cardiff University, Park Place, Cardiff CF10 3YE, UK
*
Authors to whom correspondence should be addressed.
These authors contributed equally to the manuscript.
Atmosphere 2021, 12(8), 959; https://doi.org/10.3390/atmos12080959
Submission received: 23 June 2021 / Revised: 20 July 2021 / Accepted: 21 July 2021 / Published: 26 July 2021

Abstract

:
Adverse health outcomes caused by ambient particulate matter (PM) pollution occur in a progressive process, with neutrophils eliciting inflammation or pathogenesis. We investigated the toxico-transcriptomic mechanisms of PM in real-life settings by comparing healthy residents living in Beijing and Chengde, the opposing ends of a well-recognised air pollution (AP) corridor in China. Beijing recruits (BRs) uniquely expressed ~12,000 alternative splicing (AS)-derived transcripts, largely elevating the proportion of transcripts significantly correlated with PM concentration. BRs expressed PM-associated isoforms (PMAIs) of PFKFB3 and LDHA, encoding enzymes responsible for stimulating and maintaining glycolysis. PMAIs of PFKFB3 featured different COOH-terminals, targeting PFKFB3 to different sub-cellular functional compartments and stimulating glycolysis. PMAIs of LDHA have longer 3′UTRs relative to those expressed in Chengde recruits (CRs), allowing glycolysis maintenance by enhancing LDHA mRNA stability and translational efficiency. PMAIs were directly regulated by different HIF-1A and HIF-1B isoforms. BRs expressed more non-functional Fas isoforms, and a resultant reduction of intact Fas proportion is expected to inhibit the transmission of apoptotic signals and prolong neutrophil lifespan. BRs expressed both membrane-bound and soluble IL-6R isoforms instead of only one in CRs. The presence of both IL-6R isoforms suggested a higher migration capacity of neutrophils in BRs. PMAIs of HIF-1A and PFKFB3 were downregulated in Chronic Obstructive Pulmonary Disease patients compared with BRs, implying HIF-1 mediated defective glycolysis may mediate neutrophil dysfunction. PMAIs could explain large variances of different phenotypes, highlighting their potential application as biomarkers and therapeutic targets in PM-induced diseases, which remain poorly elucidated.

1. Introduction

Ambient airborne particulate matter (PM) pollution (i.e., particles with a 50% cut-off aerodynamic diameter of 10 microns; PM10) refers to the miasma of detritus from anthropogenic (e.g., diesel exhaust (DE), coal fly ash (FA) and carbon black (CB) particulates) and natural (e.g., volcanic ash, pollen grains and mineral dusts) sources, and is now considered to be the largest environmental risk factor to human health in the 21st century [1]. It is causally linked by epidemiology to cardio-pulmonary morbidity and mortality [2] and increases risks for multiple chronic diseases (e.g., chronic obstructive pulmonary disease (COPD) [3], cancer [4] and diabetic syndromes [5]) leading to 7 million [6] (i.e., ~4 million deaths attributed to ambient and ~3 million to household air pollution (AP)) recorded deaths annually. Notably, these adverse health effects are reached in a progressive (i.e., chronic) exposure process, rather than intermittent toxic challenges. Inhaled PM can deposit in the alveoli of the lungs and trigger local inflammation, which in turn can lead to systemic inflammation [7]. Inhalation exposure to ambient PM emissions derived from anthropogenic [8,9,10,11], biogenic [12], geogenic [13,14,15] and technogenic [16,17] sources have been shown to elicit systemic inflammatory responses that establish a primary line of defence against inhaled exogenous environmental particulates. However, long-term exposure may impair this defence line, thus promoting the progression of pathogenesis [18]. As a result, we need to understand how the immune system properly reacts to PM and how this reaction shifts to deleterious responses that comprise the mechanisms underlying how PM puts human health at risk.
Neutrophils account for ~40%–60% of the white blood cell (WBC) population, representing the body’s primary line of defence when exposed to PM [19]. Recently, it has been recognized that neutrophils play the role of a double-edged sword. When appropriately activated, neutrophils secrete multiple pro-inflammatory cytokines to activate other lymphocytes (e.g., T-cells), along with expressing MHC Class II molecules to present antigen to T-cells [20] and regulate other cell types (e.g., red blood cells; RBC) [21,22]. Otherwise, they would release large numbers of tissue-damaging molecules, causing inflammation and consequent pathogenesis progression [20]. In this respect, neutrophils serve as a critical checkpoint in responding to PM. There have been human studies of global changes in gene expression using RNA-seq following controlled exposures or using in vivo [23] and in vitro models [24,25,26] that have provided some insights. Yet there is a paucity of rigorously assessed investigations regarding the impact of PM on the gene expression of neutrophils in “real-life” settings. Therefore, there is still no concrete biological plausibility to explain the mechanisms underlying how neutrophils protect against PM and/or promote pathogenesis.
In our pilot study, based on a hierarchical design of comparative toxico-transcriptomes and physiological responses, we first characterized the neutrophil gene expression responses produced by alternative splicing (AS) in two groups of healthy city dwellers living at the opposing ends of a well-recognized AP corridor beginning in Beijing (source) and ending in Chengde (sink) [27]. We integrated these data with micro-environmental measures of occupational exposure to three pollutants: (1) Chinese Air Quality Index (AQI), (2) PM2.5 (particular matter with diameter ≤ 2.5 μm) and (3) PM10. Moreover, we measured specific soluble inflammatory mediators using enzyme-linked immunosorbent assay (ELISA) to help identify the genes and gene networks differentially activated in response to these exposures. In addition, we investigated the associations between AS-derived isoforms of interest and physiological responses. We believe that AS provides a means of regulating environmental fitness to impart “resilience” in the face of continuous inhalation exposure challenges to poor air quality. We further compared the AS-derived transcripts between healthy recruits and COPD patients collected in Beijing, providing insight into mechanisms underlying how neutrophil immune function becomes impaired and promotes pathogenesis.

2. Materials and Methods

2.1. Study Design

All procedures followed were in accordance with the ethical standards of the responsible committee on human experimentation (institutional and national) and with the Helsinki Declaration of 1975, as revised in 2000 (5). In order to reduce confounding factors, healthy (i.e., non-smokers with no pre-existing cardio-pulmonary disease) recruits were selected, ranging from ages 23 to 39.
Beijing was chosen as the primary, highly polluted urban location since it is one of the most intensely researched cities in the world. Chengde was selected as a comparison site because it is at the end of a recognized geographical AP transportation route, and as such, their PM compositions would be similar. Therefore, we characterized and compared the air quality between the two cities, along with the transcriptomic responses among Beijing recruits (BRs), Chengde recruits (CRs) and COPD patients from Beijing, aiming to determine how transcriptomes respond to air pollution.

2.2. PM Monitoring and Characterization

The daily air quality data of Beijing and Chengde was derived from the Chinese Government AQI website (https://www.aqistudy.cn/, accessed on 2 November 2017). Our previous research [28,29,30,31,32,33,34,35] on the physiochemical characteristics of Beijing AP along with other sources of current literature were utilized for PM characterization.

2.3. AP Transportation Time Assessment

An indication of the AP transport time can be derived using the data available from Beijing airports (https://www.aqistudy.cn/, accessed on 2 November 2017) which show that wind speeds are usually in the range of 6–8 mph, therefore the 110 miles transport to Chengde will take less than one day. The conclusion that Chengde AP has a one-day lag-time from Beijing pollution is reinforced by the AQI data for Beijing and Chengde [27]. The Chinese Government AQI is a national algorithm and cannot be meaningfully compared to other international AQIs [36].

2.4. Human Whole Blood Collection

Whole blood (10 mL) was collected using standard phlebotomy methods (WHO, 2010) and with ethical permission granted by Beijing Chao-Yang Hospital REC. Blood was drawn from the cephalic vein into a 10 mL CPT tube (Becton Dickinson, Franklin Lakes, NJ), an evacuated blood collection tube system containing sodium citrate anti-coagulant and blood separation media composed of a thixotropic polyester gel and a FICOLL™ Hypaque™ solution. Peripheral venous blood was obtained from healthy volunteers after obtaining signed, informed consent. Peripheral venous blood of 10 COPD residents in Beijing was also obtained in Beijing Chao-Yang Hospital.

2.5. Routine Blood Examination

Blood samples were collected from elbow veins of each participant in tubes containing Ethylene Diamine Tetraacetic Acid (EDTA) to measure the blood parameters (e.g., haematocrit, haemoglobin concentration, white blood cells and heterophils) and stored at −80 °C until use.

2.6. Lung Function Test

The lung function tests were performed with a Jaeger MasterScreen pulmonary function instrument (pneumotachograph; VIASIS, Würzburg, Germany) in strict accordance with the American Thoracic Society/European Society of Respiratory Diseases guidelines [37]. Each subject completed at least 3 qualified lung function measurements, and the best results were selected based on the performance of the subject and shape of the curve [38]. The subjects were sequentially examined using an Impulse oscillation system (IOS) spirometric flow-volume loop measurement. Parameters of the traditional PFT recorded were as follows: forced expiratory volume in 1 s/forced vital capacity (FEV1/FVC), FEV1 1% predicted (FEV1%pred), peak expiratory flow predicted (PEFpred) and maximal mid-expiratory flow predicted rates (MEF75%pred, MEF50%pred, MEF25%pred and MEF25/MEF75). The IOS parameters recorded included total respiratory impedance [Z5%pred] and resistance [R5%pred, R20%pred and R35%pred] parameters.

2.7. Correlation of Haematological Indices and AQI, PM10, PM2.5

To determine which haematological index responds to either AQI, PM10 or PM2.5, we calculated the correlation of each haematological index and concentration of AQI, PM10 or PM2.5 using the cor function in R 3.3.3. AQI, PM10 and PM2.5 data were retrieved from the website of China Air Quality Online Monitoring and Analysis Platform (https://www.aqistudy.cn/, accessed on 2 November 2017).

2.8. Isolation of Neutrophils and RNA Extraction

8 mL of blood was used for neutrophil isolation using the MACSxpress Neutrophil Isolation kit (Miltenyi, Auburn, CA, USA) following the manufacturer’s protocol. RNA was extracted from the isolated neutrophils using the TRIzol™ Reagent kit (Invitrogen, Loughborough, UK) as per manufacturer’s guideline and then stored at −80 °C until further use.

2.9. RNA Sequencing

The RNA was purified using Dynal Oilgo (dT) beads (Invitrogen) and then fragmented into 350 bp fragments using RNA Fragmentation Reagents (Ambion, Austin, TX, USA), followed by cDNA synthesis using random primers (Invitrogen), Superscript II (Invitrogen), RNase H and DNA polymerase I, and further end-repair with Klenow polymerase, T4 DNA polymerase and T4 polynucleotide kinase (for blunt-ends of DNA fragments; Invitrogen). cDNA libraries were constructed following the manufacturer’s protocol (Illumina, Los Angeles, CA, USA) and subjected to sequencing on a HiSeq2500 platform (Illumina, Los Angeles, CA, USA) at Novogene. Raw data were filtered by removing adaptors and reads with unknown nucleotides more frequent than 10% as well as those with low quality (where PHRED values were less than 10 for more than 50% of the bases).

2.10. Transcript Quantification

Approximately 5 Gb cleaned data across 30 samples were aligned to the human reference genome (GRCh38), combined with the known gene annotation (Ensembl87), using improved version HISAT2 v.2.0.1 with parameters -N 0, -I 100, -X 600, -fr, -tmo [39]. Stringtie v.1.2.0 [40] was used with default parameters to reconstruct transcript annotations across the genome merged with reference gene model. The expression of each transcript was quantified as TMP (Transcripts Per Million) using RSEM v1.3.3 [41] and required TPM ≥ 1 to be considered.

2.11. Correlation between Transcript Expression and PM2.5, PM10, AQI

For each expressed transcript, the correlations between its expression level and either PM2.5, PM10 or AQI concentration were calculated using the cor function implemented in R 3.3.3. PM2.5, PM10 and AQI were retrieved from the website of China Air Quality Online Monitoring and Analysis Platform (https://www.aqistudy.cn/, accessed on 2 November 2017).

2.12. ESE Identification

We first classified the AS-derived transcripts into three datasets: (1) expressed in all BRs but none in CRs, referred to as BR specific transcripts; (2) expressed in all CRs but none in BRs (CR specific transcripts); (3) expressed in all recruits (BR–CR shared transcripts). For each dataset, we randomly chose 100 transcripts for ESE (exonic splicing enhancers) identification using ESEfinder 3.0, a web-based software [42], followed by calculating the frequency of each ESE. It is noted that CR specific transcripts were excluded for ESE identification because only seven transcripts were identified.

2.13. DET (Differentially Expressed Transcript) Identification

We used four methods to identify DETs between the Beijing and Chengde populations due to the large amount of biological variation between the individuals sampled. In this respect, to obtain a DET set with high reliability, we applied multiple tests to highlight only the most supported DETs [43]: edgeR-robust version 3.14.0 [44] and DESeq 2 [45] based on exact tests, a non-parametric test in SAMseq version 3.0 [46] and an empirical Bayesian analysis using Limma version 3.13 [47]. A total of 5397 robust DETs were supported by all four methods and were used in downstream analysis. KEGG enrichments for down-regulated DETs were conducted using a hypergeometric test.

2.14. Variance Analysis of Physiological Phenotypes

To identify the isoform of which the expression was significantly correlated with a physiological phenotype of interest, we conducted Analysis of Variance (ANOVA) with each haematological index as the dependent variable and expression of isoforms as the independent variables, using the ano function implemented in R3.3.3.

2.15. Cytokine ELISA

The relative concentration of plasma cytokine expression was measured by ELISA using the Human ICAM-1/CD54, IL-8/CXCL8, MIF, IL-6 and C-Reactive Protein/CRP via the Quantikine ELISA Human kits (R&D Systems, Minneapolis, MN, USA). Kits were used according to manufacturer’s instructions. Briefly, plates were coated with monoclonal anti-human cytokine capture antibody and blocked with 1% bovine serum albumin. Plasma samples, in triplicate, were incubated for two hours at room temperature together with recombinant human cytokine standards. Bound cytokine was detected with anti-human cytokine horseradish peroxidase secondary antibody and tetramethylbenzidine substrate. The concentration of cytokine per sample was calculated using a four-parameter logistic curve fit of the standard concentrations. All data were expressed as mean ± S.D. and for comparisons of the means, the student t-test was used. p values less than 0.05 were considered statistically significant.

2.16. Cytokine Array

The relative concentration of plasma cytokine protein was determined by cytokine array and was assessed using the Proteome Profiler Human Cytokine Array (Panel A Kit, R&D Systems, Minneapolis, MN, USA). Arrays were used according to manufacturer’s instructions. Briefly, plasma was incubated with nitrocellulose membrane coated with 36 different capture antibodies. Bound cytokines were detected with a cocktail of secondary biotinylated antibodies and streptavidin-HRP. Membranes were imaged using ChemiDocTMXRS + System (Bio-Rad, Hercules, CA, USA). ImageJ software (Version 1.5.1, 2018) was used to determine the average pixel density of the duplicate spots.

3. Results

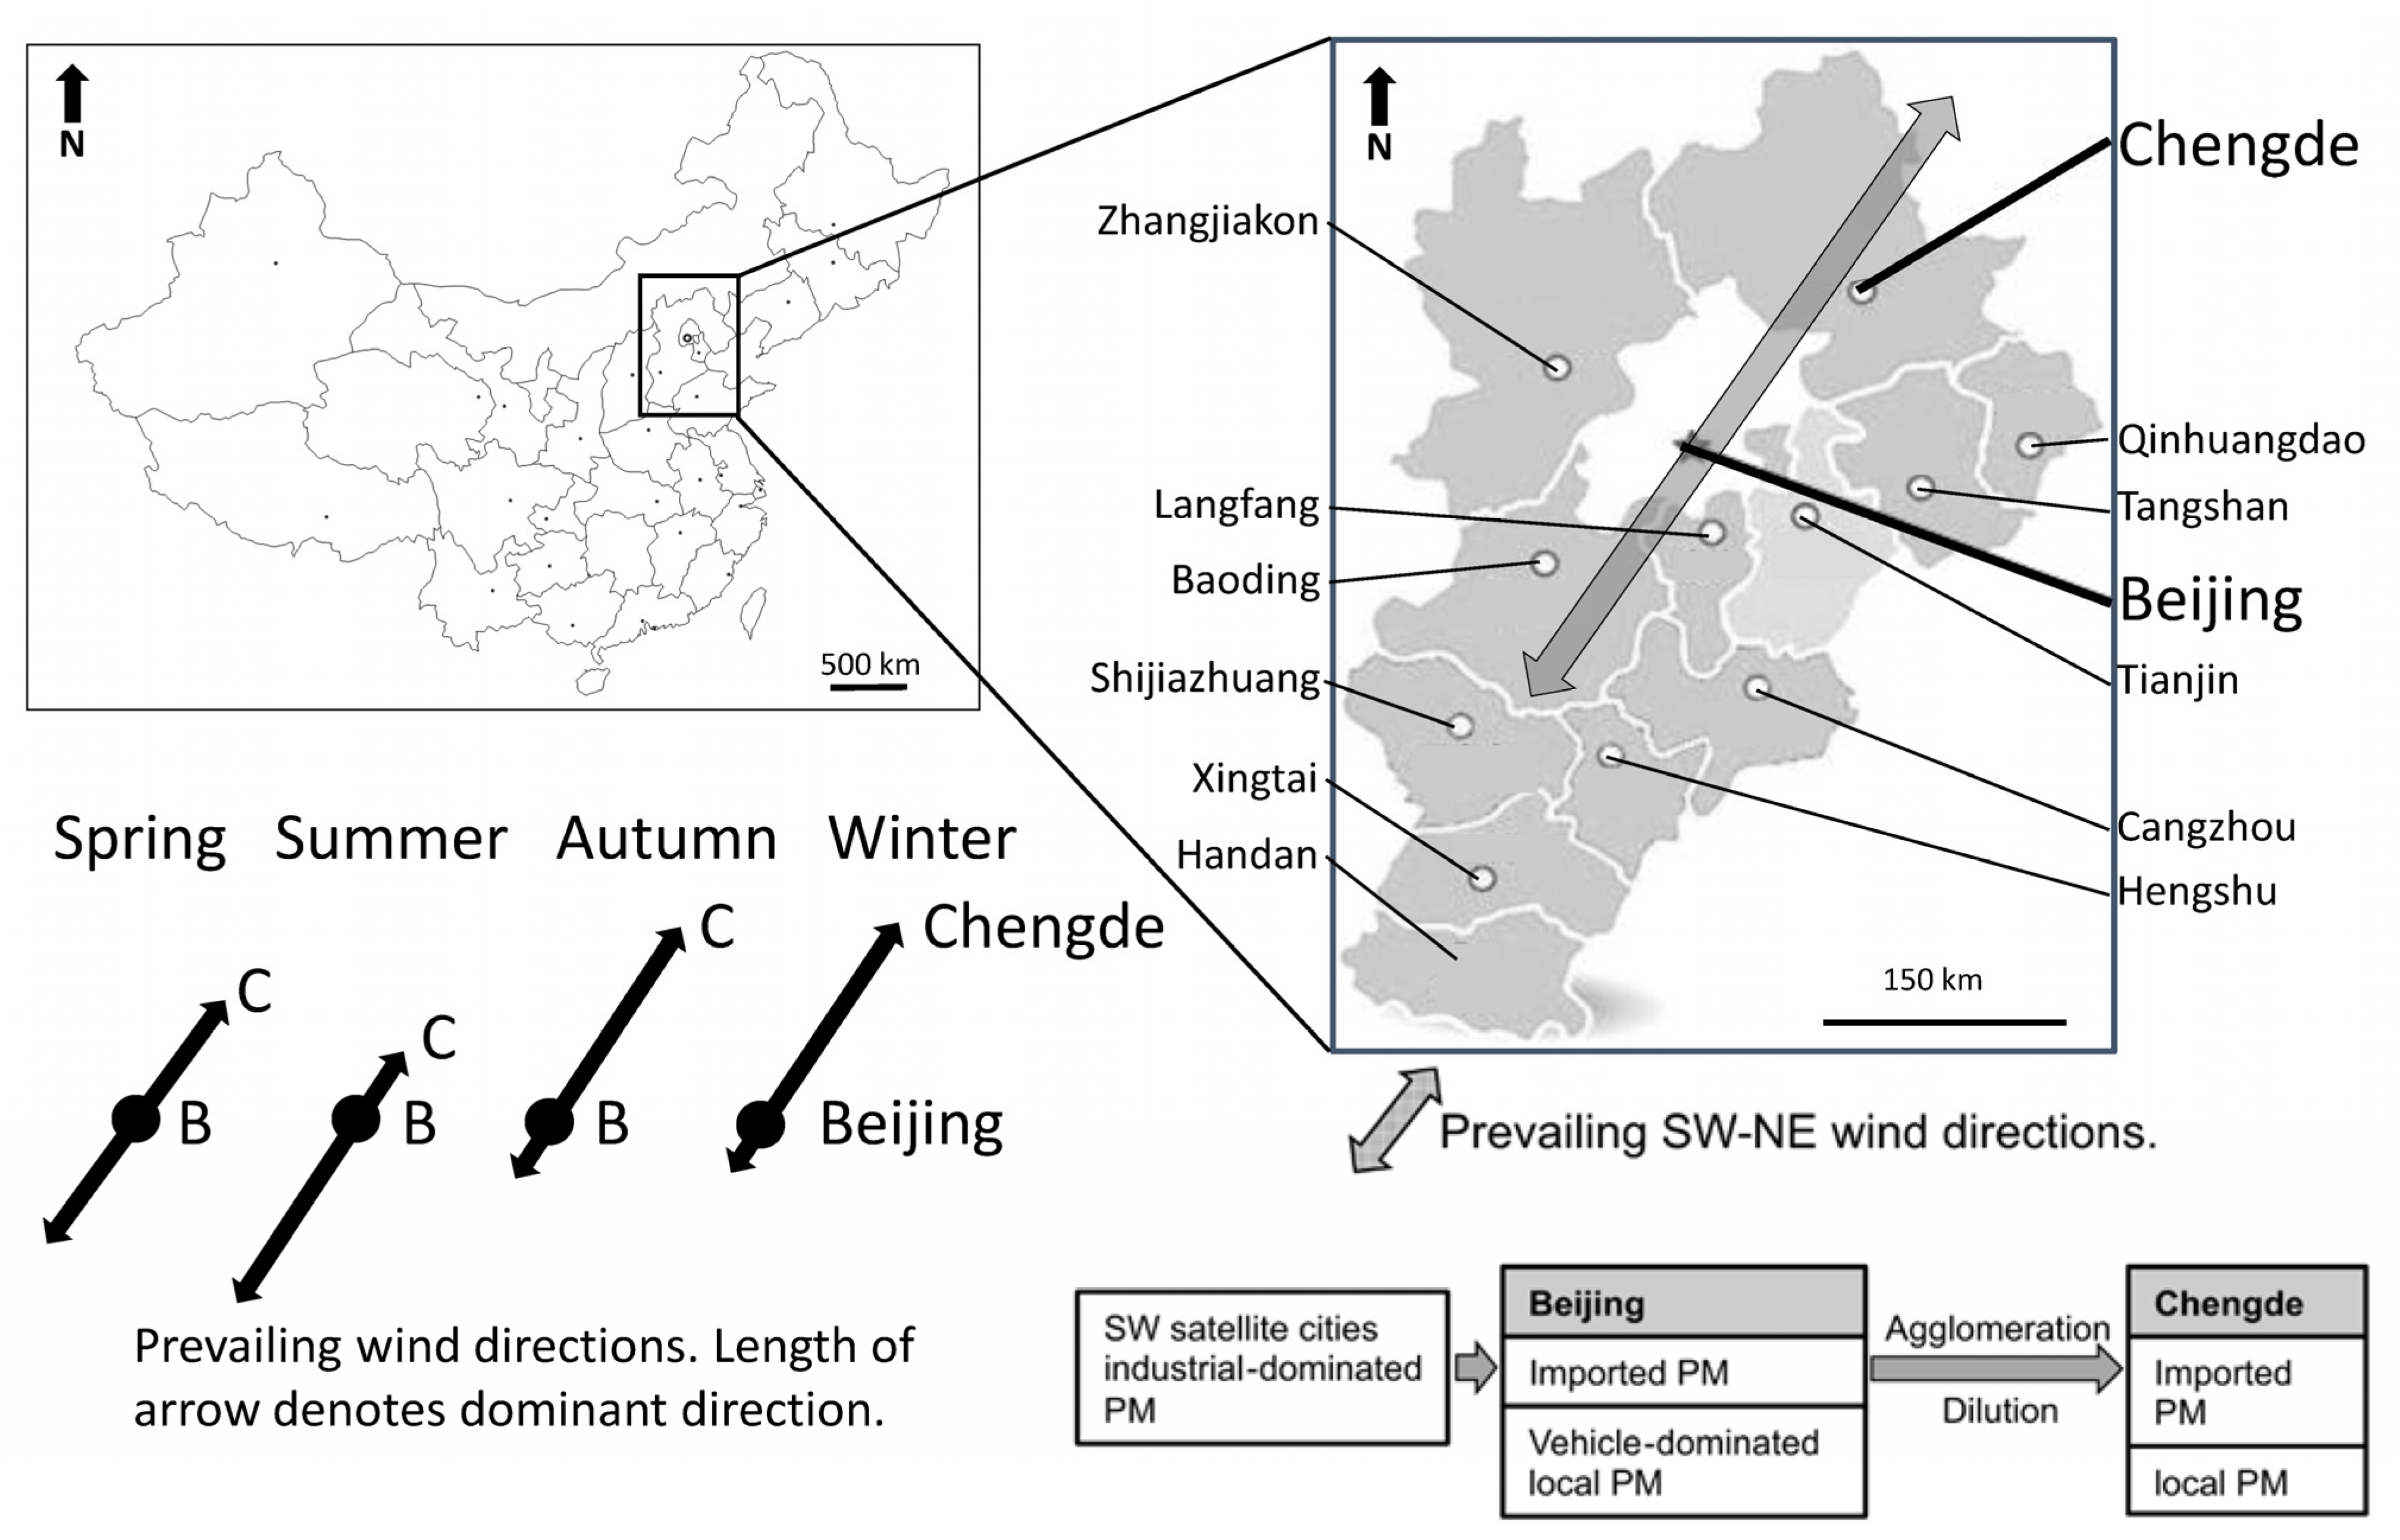
3.1. Selecting Beijing and Chengde as Investigation Sites

An ideal comparative study is to investigate a location with well-recognized AP problems, and a comparison site with AP of similar provenance and composition, but at significantly lower levels. The megacity of Beijing was selected given that the city suffers from some of the worst AP worldwide. Beijing’s widespread AP can be attributed to anthropogenic, technogenic and geogenic factors including a surge in the number of motorized vehicles, population growth output from manufacturing and contributions from natural PM sources, such as the city’s surrounding topography and seasonal weather. Our previous research [28,29,30,31,32,33,34,35] on the physiochemical characteristics of Beijing AP, specifically the PM component, confirmed via electron microscopy the presence of combustion-derived PM dominated by DE from vehicles, CB from cooking and FA from heating activities. In addition, there were plenty minerals originating from the local geology of Beijing due to its proximity to the Gobi desert, as well as fugitive dust from its satellite cities.
Monitoring of Beijing’s wind directions illustrated a clear annual pattern along a northeast–southwest (NE–SW) transept (Figure 1). Located to the south of Beijing are several industrialized satellite cities generating AP with clear coal-burning and steel manufacturing characteristics (e.g., FA and smelter particles) (Table S1). Therefore, these cities are unsuitable for comparison with Beijing. Chengde, located 110 miles NE of Beijing, on the contrary, is a small city that is not as industrialized as the satellite cities to the south and it is along the recognized “NE–SW AP transport corridor” (Figure 1). Therefore, it is expected that the lower degree of industrialization, along with the NE–SW wind direction transept renders Chengde with a PM provenance and composition like Beijing, but at significantly lower levels.
Indeed, considering the role of particle physiochemistry and toxicological effects, the daily air quality data of Beijing and Chengde, derived from the Chinese Government AQI website (https://www.aqistudy.cn/, accessed on 2 November 2017) revealed that: (1) Beijing has a consistently higher AQI compared to Chengde, (2) Beijing has a consistently higher PM2.5 component than Chengde, (3) the mass concentration of PM10 in Beijing is consistently higher than Chengde and the chemical composition of their respective airborne pollutants is not dissimilar due to a shared source apportionment (i.e., traffic emissions, steel production and fugitive mineral dusts) via the seasonal wind transepts and (4) Chengde has relatively higher SO2, but the actual levels are low. The relatively higher SO2 in Chengde may represent its local industry or other sources (Table S2).
To determine how long Beijing AP would take to arrive at Chengde, we conducted linear regression analyses on both data. The linear regression line for X (Beijing)-Y (Chengde) for the same day has an R2 = 0.0958. A one-day lag into the data X (Beijing + one day)-Y (Chengde), on the assumption that a pollution peak in Beijing should reach Chengde the next day, achieved an improved R2 = 0.1172. A two-day lag provided a lower R2 = 0.00763 and a three-day lag resulted in an even lower R2 = 0.00556. These results suggested that Chengde AP had a one-day lag-time from Beijing pollution; consistent with a recent report [27]. These conclusions enabled us to qualify Chengde as an ideal comparison site with Beijing in our study.

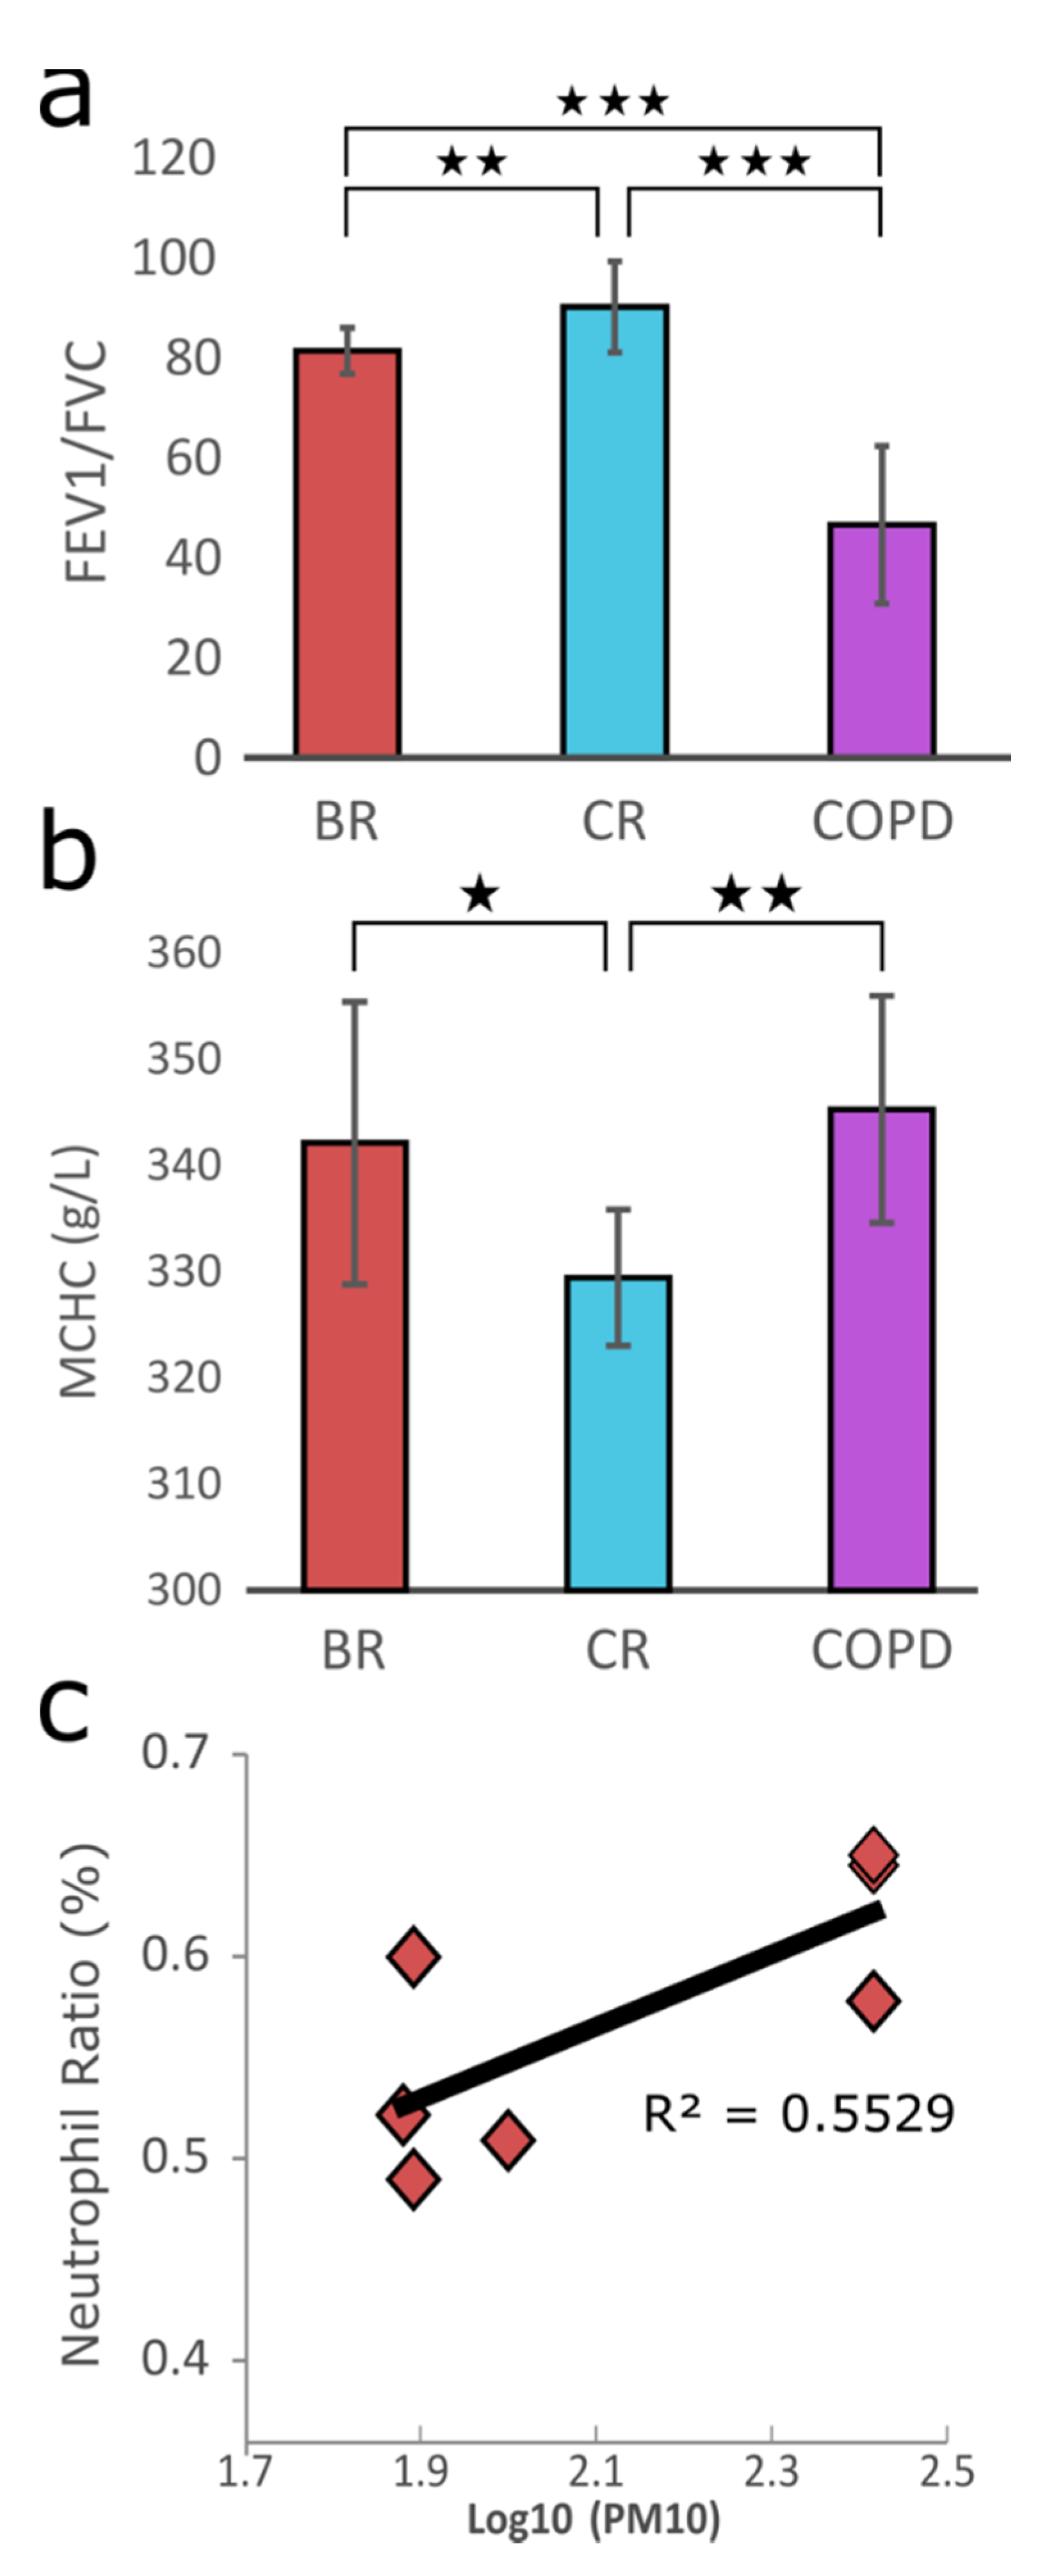
3.2. Physiological Responses upon PM Exposure and Data Generation

In order to reduce confounding factors, 10 healthy (i.e., non-smokers with no pre-existing cardio-pulmonary disease) recruits with ages ranging from 23 to 39 from each city (Table 1) were selected. Peripheral venous blood for routine blood examination was obtained from each volunteer followed by lung function tests. In addition, 10 COPD patients from Beijing were recruited (Table 2) and routine blood examinations and lung function tests were conducted. Finally, specific soluble inflammatory mediators were measured using ELISA to help identify the genes and gene networks differentially activated in response to these exposures.
A comparison of lung function tests (FEV1/FVC; Figure 2a) between BRs (81 ± 5) and CRs (90 ± 9) as well as COPD (47 ± 16) patients demonstrated there was a statistically significant decrease of lung function (p < 0.01, t-test) in the BRs compared with CRs, but not severe since non-significance for FEV1pred% (93 ± 12 in BRs vs. 93 ± 11 in CRs; p = 0.97, t-test). Lung function was further decreased and exacerbated in COPD recruits (FEV1pred%:40 ± 20; p < 0.001 for both FEV1/FVC and FEV1pred%, t-test), suggesting that inflammation responses were induced in both BRs and COPD groups.
Among a total of 16 haematological indices that were examined in the routine blood examinations, MCHC (mean corpuscular haemoglobin concentration) revealed a significant difference among the three groups, with higher MCHC (Figure 2b; 342 ± 13 in BRs vs. 329 ± 4 in CRs, p = 4.38 × 10⁻⁶, t-test) in BRs and even higher MCHC in COPD volunteers (348 ± 8), collectively indicative of hypoxia induction in both BRs and COPD participants. Notably, the lack of statistically significant difference in other indices (e.g., neutrophils, RBCs, haemoglobin, monocyte and macrophage, etc.) between CRs and BRs (but not between CRs or BRs and the COPD group; Figure S1) suggests that stress induced by PM exposure has been well handled in BRs.
To determine which haematological indicator played the most important role in reacting to PM among these examined indices, we carried out correlation analyses for each index against PM10 concentration, respectively, and found that neutrophil ratio had the largest correlation coefficient (R2 = 0.55, Figure 2c and Figure S2). Hence, we first sequenced the transcriptomes of neutrophils in both BRs and CRs and conducted comparative transcriptomic analysis to provide insight into the mechanisms underlying how PM-induced stress has been so well addressed.

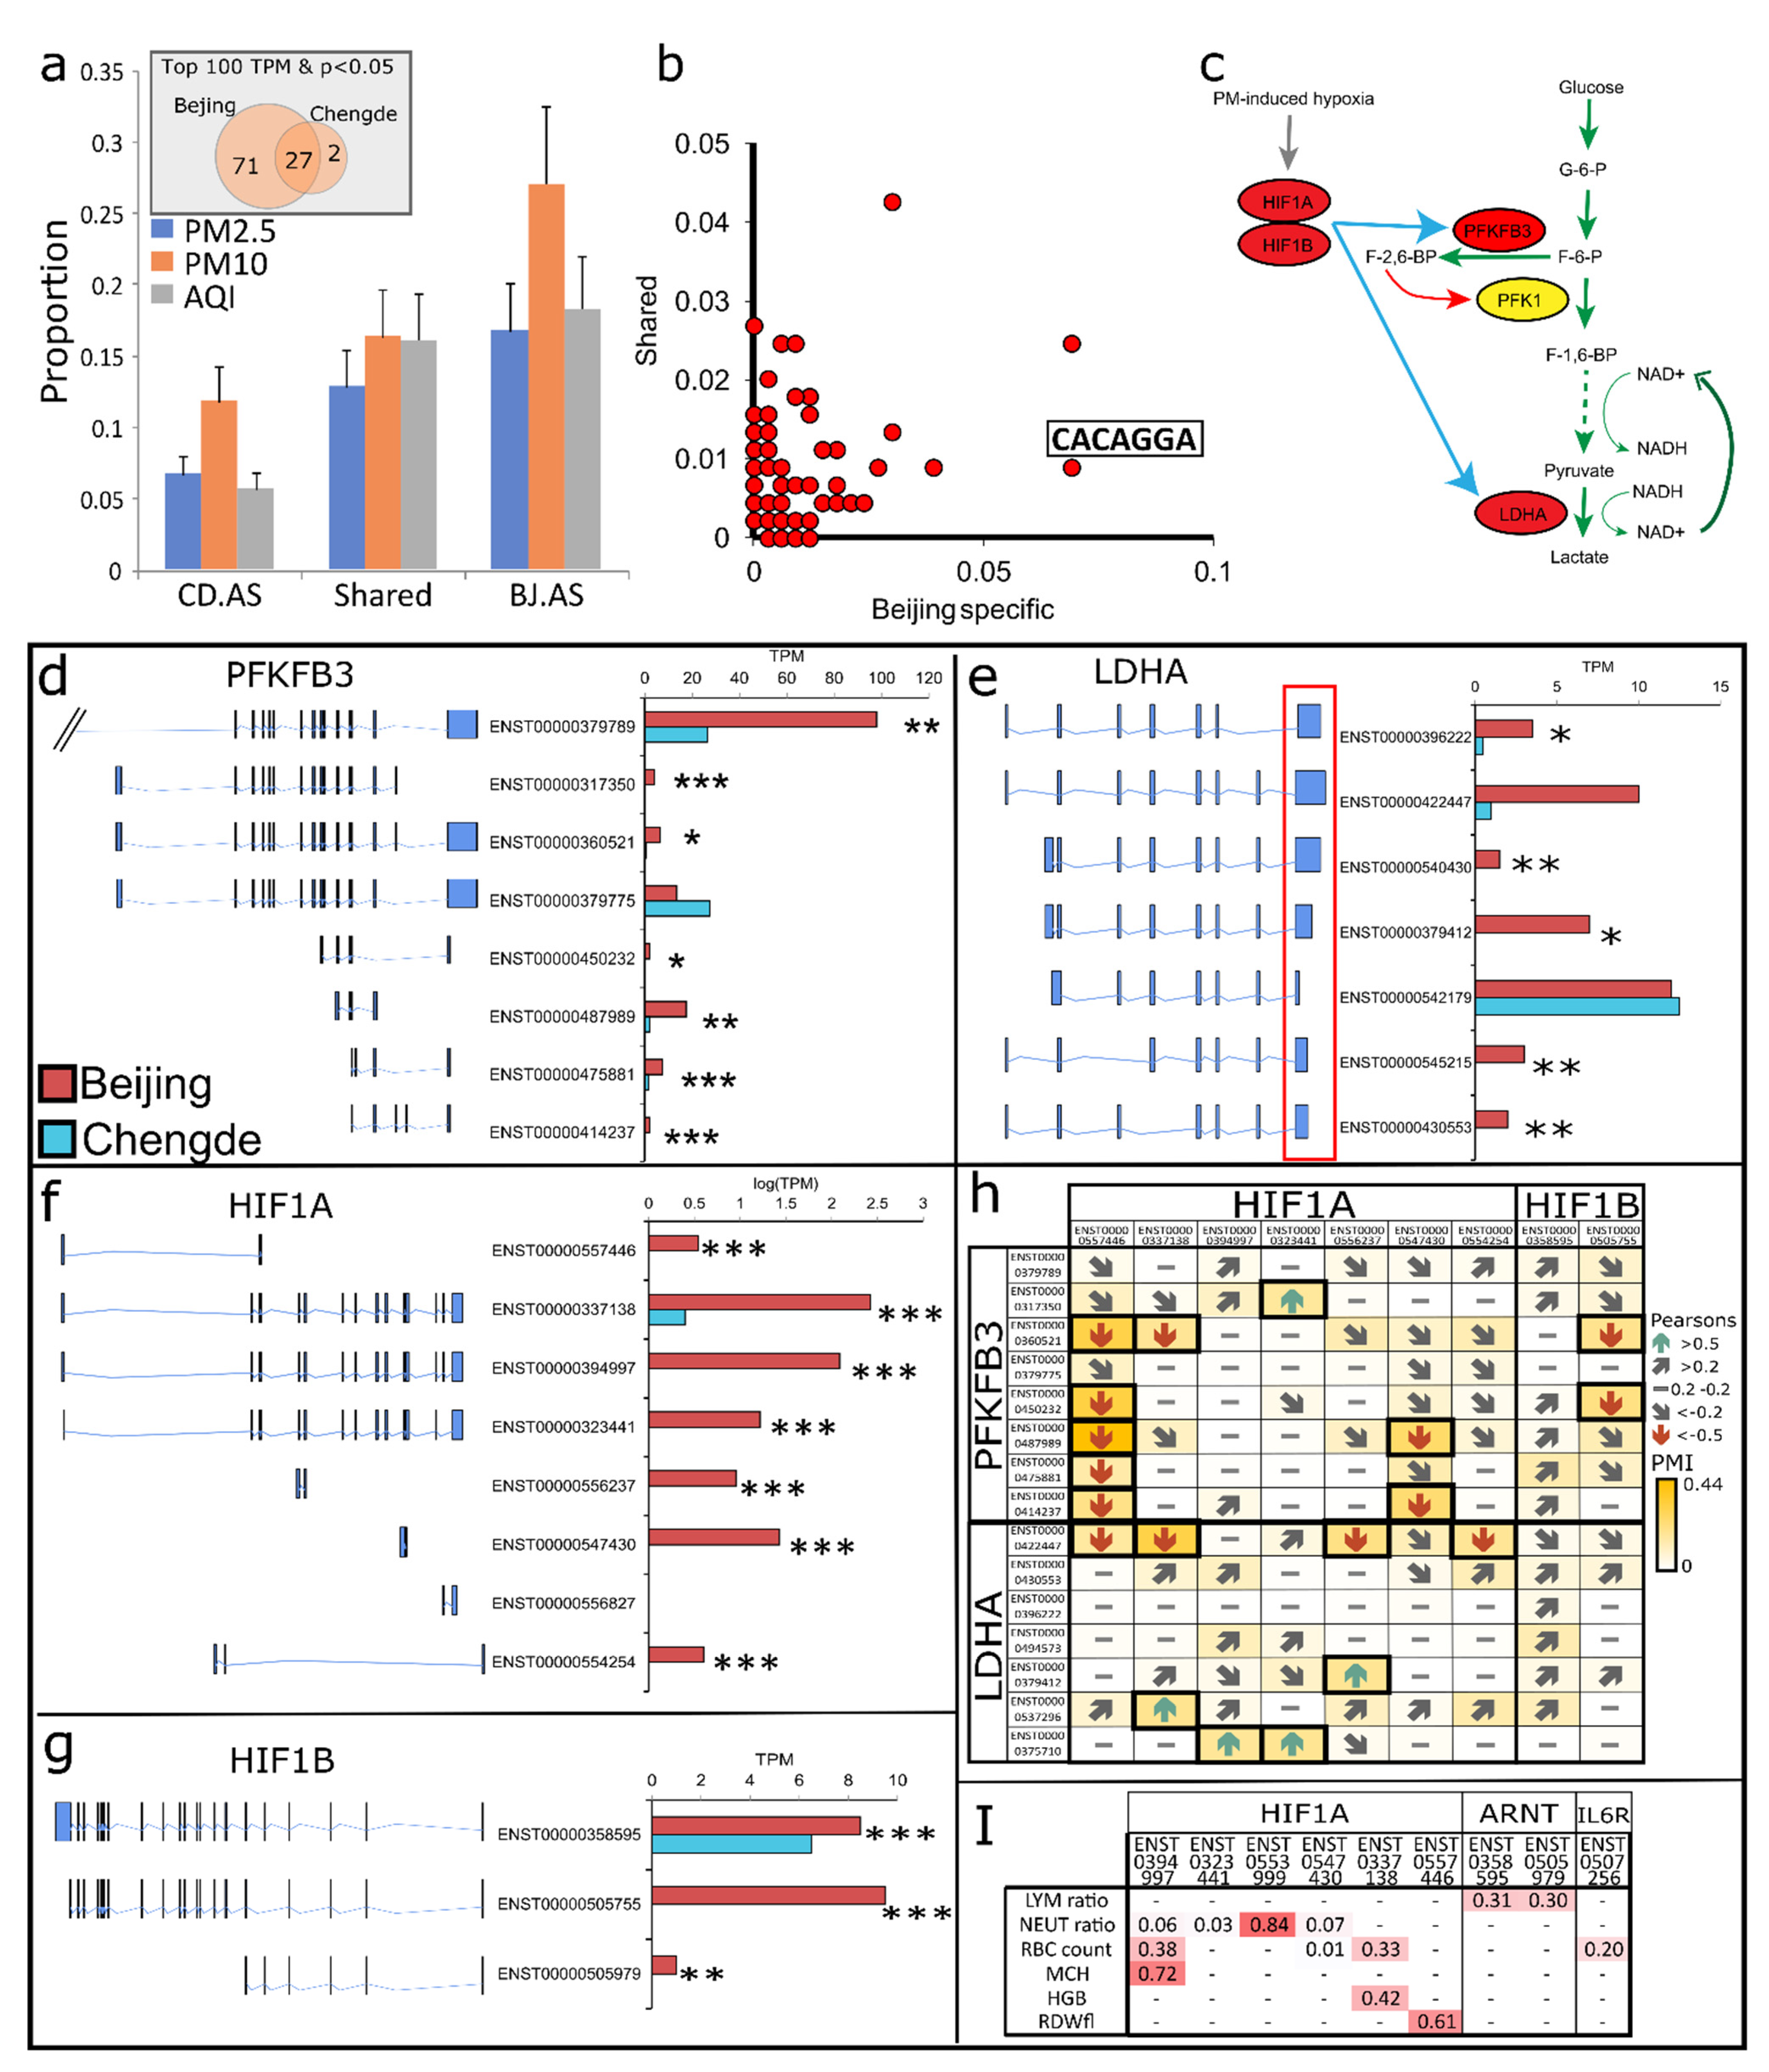
3.3. Alternative Splicing in BRs and CRs

RNA extracted from neutrophils of each volunteer (n = 10 for each city) was subjected to sequencing on an Illumina X-Ten sequencer, yielding about 5 gigabases (Gb) of clean RNA-seq data for each sample. Cleaned reads for each sample were aligned to the GRCh38 human reference genome using HISAT [39]. The expression of each transcript was quantified as TPM using RSEM [41]. On average, BRs expressed over 36,000 (36,274 ± 1389) transcripts, significantly higher than Chengde (24,160 ± 1919) (Figure 3a, p < 0.001, t-test). Two possible factors may lead to this scenario: (1) more gene loci were expressed in BRs and (2) AS occurred more frequently in BRs. Our analyses revealed that BRs expressed, on average, 1000 gene loci more than CRs, yielding ~2000 transcripts, contributing only 18% of the increased transcript number (~12,000) in BR. Strikingly, we found that 6760 of the gene loci expressed in both groups generated significantly more isoforms in BRs compared with CRs (Figure 3b, p < 0.05 for each gene locus, t-test), resulting in an increment of approximately 10,000 transcripts. This accounted for 80% of the 12,000 transcripts uniquely expressed in BRs, suggesting that “alternative splicing” serves as a major source in generating such a large abundance of transcripts, thus setting the scene for the development of biological “resilience”.
We next carried out functional enrichment analysis on the 6760 genes. Interestingly, the results showed that the most significant enriched item referred to RNA splicing (Table S3). Therefore, we focused on the AS patterns in the RNA splicing major pathway. Our analysis revealed that AS events occurred dominantly in gene families encoding hnRNP (heterogeneous ribonucleoproteins) and serine/arginine (SR)-rich proteins; the master regulators in alternative splicing (Figure 3c) [49,50,51]. The occurrence of RNA splicing relies on the concerted roles of both SR and hnRNP with the former mainly binding to the ESE element and the latter to ESS (exonic splicing silencer) in exons to recruit the splicing complex to the targeted splicing site (Figure 3d) [49,50,51]. Given that different SR and hnRNP isoforms bind to different ESEs and ESSs [52], the AS of the SR and hnRNP gene families may constitute a “molecular basis” of the unexpected large number of isoforms in Beijing participants because abundant SR and hnRNP isoforms generated will enlarge the reservoir of ESEs and ESSs that could be bound.
To determine whether these AS-derived transcripts have any protective roles against PM exposure, we first calculated the correlation between the expression of each AS-derived transcript and AQI, PM2.5 or PM10 concentration, then classified these AS-derived transcripts as BR-specific, CR-specific and BR–CR shared transcripts and finally estimated the proportion of transcripts whose expression was significantly correlated with either of these indices. We found that 30% of BR specific transcripts were significantly correlated with either PM2.5, PM10 or AQI, much higher than either CR specific (18%) or shared transcripts (7%; Figure 4a). Of the 100 AS-derived transcripts showing the most significant correlation with AQI, PM2.5 or PM10, over 70% belong to BR specific transcripts (Figure 4a).
We further compared the utilization frequency of each ESE element between BR-specific and shared transcripts and showed that the utilization frequencies of several ESEs significantly differ between the two groups, exemplified by one ESE element (i.e., CACAGGA) exhibiting six times higher frequency in the former (7%) than that in the latter (1%) (Figure 4b). Transcripts containing CACAGGA are significantly enriched in C2H2 type zinc finger gene families, which have been implicated in regulating immune responses through mediating IL and INF pathways, and oxidative responses to biotic and abiotic factors (i.e., ambient particulate matter) [53,54]. Overall, our results imply that AS indeed potentially has protective roles in abrogating exposures to poor air quality. We next sought to know which roles of AS act in addressing PM exposure.

3.4. AS Reshapes Glycolysis Landscape

The higher MCHC observed in BRs (Figure 2b) in our study suggested that hypoxia, a hallmark of long-term exposure to poor air quality [55], had been induced. Upon hypoxia, neutrophils would be activated and utilize ATP mainly generated through glycolysis [56,57], and it has been documented that glycolysis was enhanced when exposed to PM [58,59]. However, there is a paucity of information about how this enhancement is achieved. To address this issue, we investigated the AS patterns of all genes (n = 12) that encoded essential enzymes in the glycolysis pathway and found that two distinct AS patterns were exhibited between CRs and BRs (i.e., PFKFB3 (6-Phosphofructo-2-Kinase/Fructose-2,6-Biphosphatase 3) and LDH (Lactate dehydrogenase)).
PFKFB3 encodes an enzyme that has been reported to have the highest kinase activity in shunting glucose toward glycolysis [60]. It converts fructose-6-phosphate to fructose-2,6-bisP (F-2,6-bisP), which allosterically activates PFK-1 (6-phosphofructokinase-1), the rate-limiting enzyme in glycolysis [48]. The activated PFK-1 acts as a key player in stimulating glycolysis under hypoxia (Figure 4c) [48]. We found that BRs expressed eight PFKFB3 isoforms, compared with only three in CRs (Figure 4d). Expression levels of four isoforms were significantly correlated with PM concentration (Figure S3). Further analyses showed that these four isoforms resulted from the AS of exons encoding the COOH-terminal, leading to different COOH-terminal regulatory domains. Since different COOH-terminals result in differential localization of PFKFB3 protein to different sub-cellular compartments (e.g., cytoplasm, peroxisome, nucleus) [60], we suggest that AS of PFKFB3 may play an important role in stimulating glycolysis upon PM exposure. Additionally, among these isoforms exclusively expressed in BRs, one isoform (ENST00000360521, UBI2K4), possessing a COOH-terminal with higher kinase activity than other isoforms [61], has been suggested to be induced by hypoxia [61,62]. The induced expression of this isoform may be expected to enhance glycolysis.
LDHA encodes lactate dehydrogenase A, catalysing the conversion of pyruvate and NADH to lactate and NAD+, with NAD+ being a pre-requisite driver for glycolysis [63]. We found that seven LDHA isoforms were expressed in BRs, in contrast with only three in CRs (Figure 4e), leading to a total of LDHA expression in BRs being six times higher than that in CRs (TPM = 603 in BRs vs. 93 in CRs). The expression levels of two isoforms (LDHA-005: ENST00000379412 and LDHA-001: ENST00000422447) exhibited significant correlation with PM concentration (Figure S4). Interestingly, these two isoforms share exactly the same open reading frame (ORF) with the one dominantly expressed in CRs (LDHA-020: ENST00000542179), with the major difference being that both isoforms (LDHA-005 and LDHA-001) feature much longer 3′UTR lengths (i.e., 566 and 1144bp longer than LDHA-020). Since longer 3′UTR can enhance both mRNA stability and translational efficiency [64], it is expected that BRs may generate more LDHA proteins, which may in turn promote the formation of NAD+, allowing the enhancement and maintenance of glycolysis.
Pyruvate could be converted either to lactate for NAD+ generation or to acetyl-CoA, which could finally enter the electron transport chain (i.e., oxidative phosphorylation; OP) for ATP generation. Since LDHA was over-expressed in BRs, it is expected that a large proportion of pyruvate would be catalysed to lactate rather than acetyl-CoA. Given that glucose serves as a major energy source in neutrophils [19], we expected that OP would be downregulated in BRs. Consistently, functional enrichment analyses on transcripts significantly downregulated in BRs showed that the most significantly enriched KEGG pathway was OP (Figure S5). OP is a process by which electrons are transferred to O2 molecules through respiratory complexes to generate ATP. Once there are insufficient O2 molecules to accept electrons, electrons leak out of the electron transfer chain to generate toxic reactive oxygen species (ROS) [65], which induces cell and macromolecule (i.e., DNA, RNA and proteins) damages [66]. Therefore, OP reductions in BRs would act to minimize the generation of toxic ROS under hypoxic conditions.
Next, we were interested to know how the two genes were regulated upon polluted air exposure. A survey on published literature identified one common transcription factor, hypoxia-inducible factor 1 (HIF-1) [67,68]. HIF-1, a master regulator of oxygen homeostasis, consists of two sub-units: an inducibly expressed HIF-1A and a constitutively expressed HIF-1B [69]. We therefore investigated the AS patterns of these two genes. In our study, CRs expressed only one HIF-1A and one HIF-1B isoform, in sharp contrast with seven and three isoforms in BRs (Figure 4f,g). A co-expression analysis showed that different isoforms of HIF-1A and/or HIF-1B were significantly co-expressed with different isoforms of PFKFB3 and LDHA (Figure 4h). To investigate whether these observed associations were direct, we applied a recently developed algorithm based on information theory, which was reported to accurately quantify direct relations between measured variables with higher statistical power by silencing indirect effects [70]. The results showed that different HIF-1A and/or HIF-1B isoforms can directly regulate the transcription of distinct PFKFB3 and LDHA isoforms (Figure 4h).
Taken together, we concluded that chronic exposure of PM air pollution imposes hypoxic stress, promoting AS of HIF-1A and HIF-1B, which further induces the AS of PFKFB3 and LDHA. The resultant AS of PFKFB3 and LDHA, collectively, may modulate glycolysis in neutrophils in that: (1) AS of PFKFB3 led to PM-associated isoforms (PMAI) with different COOH-terminal regulatory domains, which may target different sub-cellular locations, and consequently, stimulate glycolysis and (2) AS of LDHA gave rise to two PMAIs with longer 3′UTRs relative to the constitutively expressed one, possibly enhancing mRNA stability and translational efficiency, and thus, promoting LDHA generation and subsequently glycolysis enhancement and maintenance.
Given that HIF-1 is the key regulator of hypoxia response [69], the observation that a total of 10 HIF-1 isoforms (7 HIF-1A and 3 HIF-1B; Figure 4f,g) were expressed in BRs raised one essential question: Do these isoforms play the same or diverse roles in PM-induced hypoxic conditions? To address this issue, we estimated the associations between the expression of these isoforms and different hypoxia-associated physiological responses (e.g., RBC count, MCHC, haemoglobin count, RBC volume distribution width (RDW), neutrophil count and neutrophil ratio). Strikingly, our results revealed that different isoforms show significant correlation with varied physiological indices (Figure 4i and Table S4). For instance, expression of HIF1A-003 (ENST00000394997), HIF1A-005 (ENST00000553999), HIF1A-001 (ENST00000337138) and HIF1A-008 (ENST00000557446) could explain 72%, 84%, 42% and 61% variances of MCHC, neutrophil ratio (i.e., the ratio of neutrophils among whole blood cells), haemoglobin count and RDW (red cell distribution width) (Figure 4i and Table S4; all p < 0.05). These findings highlighted that different isoforms may have diverse physiological functions.

3.5. AS Prolongs Neutrophil Lifespan and Enhances Migration in BRs

It has been recognized that upon immune response, neutrophils can extend their lifespan from 6–12 to 24–72 h primarily by mitigating apoptosis [71]. During this process, two distinct signalling pathways (i.e., intrinsic and extrinsic) have been proposed with the intrinsic pathway mediated by anti-apoptotic protein Mcl-1 and the extrinsic pathway mediated by death receptors such as Fas (a cell surface death receptor), TNF-related apoptosis-inducing ligand receptors and TNF receptors [72]. AS analyses of these genes showed that only Fas underwent AS, leading to nine isoforms with either exon 6 or 9 truncated and seven that were exclusively expressed in BRs, accounting for ~70% of the expression in this locus that sharply reduced the expression ratio of intact Fas to 30%, which is, however, significantly lower than that in CRs (90%; Figure S6).
Fas is a transmembrane protein, encoded by a nine-exon gene, with the sixth exon encoding a transmembrane domain and the ninth encoding a death domain (DD), both of which are critical for the transmission of an apoptotic signal [65]. Generally, three Fas proteins form a trimer on the membrane. Only a trimer composed of three intact Fas proteins can successfully transmit the apoptotic signals when binding with its ligand (Fas-L) [73]. In our case, we found that BRs increased the expression of truncated Fas isoforms lacking either transmembrane or DD domains, leading to a sharp reduction of the expression ratio of intact Fas (30% versus 90%; Figure S6). It is expected that the increase of these truncated isoforms will compete with intact Fas to form non-functional trimers, thereby inhibiting apoptosis. Consistently, the expression of these truncated Fas isoforms could respectively interpret 81%, 86%, 77% and 67% variances of the counts of WBC, neutrophils and lymphocytes as well as lymphocyte ratio in the Beijing population of recruits (Figure S7 and Table S5). Altogether, we proposed that the induction of these AS-derived truncated Fas isoforms serves as a means to effectively inhibit apoptotic signal transmission in neutrophils, thus prolonging their lifespan when exposed to poor air quality.
Previous studies suggested that neutrophils would enhance their migration capacity because of immune responses [74]. Expectedly, MIF, a marker indicating cell migration capacity [75,76,77,78], was upregulated in BRs determined by ELISA, indicative of enhanced migration ability (Figure S8). To obtain insight into the molecular basis of neutrophil migration capacity enhancement in BRs, we determined the levels of an array of cytokines that could promote neutrophil migration in both BRs and CRs. IL-6, one cytokine that has been well established in promoting neutrophil migration [79], was over-expressed in BRs. IL-6 can bind either to the membrane-bound IL-6R mediating the classic signalling mode, or to the soluble IL-6R without the transmembrane domain, triggering a trans-signalling mode [80]. CRs were found to express only membrane-bound IL-6R isoform, which was significantly upregulated in BRs (Figure S9). Moreover, BRs expressed an extra of six isoforms without the transmembrane domain (Figure S9), the expression of which was significantly correlated with the neutrophil ratio (Figure S10), implying that BR neutrophils might adopt both IL-6 signalling modes for migration. Given that cells using both IL-6 signalling modes have higher migration capacity than the ones owning only one [81], we concluded that featuring two modes of IL-6 signalling along with the up-regulation of IL-6 enables BR neutrophils to enhance their migration ability. Altogether, AS of IL-6R provides a means to enhance the neutrophil migration for individuals exposed to polluted air.

3.6. HIF-1 Mediated Impaired Glycolysis Mediates Neutrophil Dysfunction

Dysfunction in activated neutrophils, when exposed to PM, have been implicated in promoting pathogenesis of a number of human diseases, such as COPD, due to their impaired immune functions (e.g., impaired phagocytosis [82], reducing capacity of pathogen killing [83] and clearance [84] and reduction of chemotactic accuracy [85]). However, knowledge of the molecular basis mediating these impaired immune functions in neutrophils remains largely unexplored. A comparison between the transcriptome profiles of BRs and COPD volunteers in Beijing may provide some clues to this question.
Our results showed that neutrophils isolated from COPD patients have a comparative number of expressed transcripts with that from BRs (34,233 ± 3459 in COPD vs. 36,274 ± 1389 in BRs, p = 0.13), and share similar AS patterns of both Fas and IL-6R. However, HIF1A and PFKFB3 exhibited distinct AS patterns between the two groups. For instance, only five HIF1A isoforms were expressed in COPD patients, in contrast with seven in BRs, giving rise to reduced expression of this gene loci (TPM = 132 in COPD patients vs. 413 in BRs). Consistently, isoform numbers of PFKFB3 have also been reduced in COPD patients relative to BRs (four in COPD and eight in BR). Unexpectedly, expression analyses showed that, when compared with CRs, there were no statistically significant expression differences for PFKFB3 (TPM = 83 ± 62 in COPD vs. 77 ± 55 in CRs, p > 0.05), implicating impaired glycolysis in neutrophils of COPD patients. Interestingly, when we plotted their expression or isoform numbers against the lung function (FEV1/FVC) of CR, BR and COPD patients (Figure S11), a reverse “U” (referred to as “∩” hereafter) pattern was observed for the two genes (i.e., HIF1A, PFKFB3). That is, the initial lung function reduction was accompanied with the up-regulation and increased isoform number of the focal genes (from CRs to BRs), followed by subsequent down-regulation and isoform number decrease upon further lung function reduction (from BRs to COPD patients; Figure S11).
Given that the immune functions (e.g., phagocytosis, degranulation, etc.) of neutrophils rely on ATP dominantly generated from glycolysis [19], impaired glycolysis may lead to dysfunctions of neutrophils [19]. In our case, we proposed that the reduction of HIF-1A expression and AS-derived isoform numbers mediates the impaired glycolysis through down-regulating the expression of the key enzyme encoding gene (i.e., PFKFB3), and reducing its AS. Therefore, HIF-1A and PFKFB3 may act as key players mediating the dysfunction of activated neutrophils and serve as an essential biomarker in monitoring neutrophil function.

4. Discussion

Our study and others [86,87] have implicated that neutrophils act as the key players in response to poor air quality. It has been further demonstrated that the dysfunction of neutrophils plays a critical role in pathogenesis progression during long-term exposure to polluted air [19,88]. To our knowledge, our study, based on a hierarchical design of comparative toxico-transcriptomes, represents the first attempt to characterize the molecular mechanisms underlying how neutrophils properly buffer the stresses imposed by long-term exposure to urban PM and how their immune functions become impaired in “real-life” settings.
In our investigation, we demonstrate that AS may promote the expression of different PFBFK3 isoforms targeting distinct sub-cellular locations, and thus, stimulate glycolysis regionally. Given that different sub-cellular compartments are responsible for distinct immune functions [89], and these functions mainly rely on ATP generated from glycolysis in neutrophils, the induction of these different PFBFK3 isoforms provides molecular evidence in understanding how neutrophils trigger different immune functions sub-cellularly upon exposure to poor air quality. AS also leads to the expression of LDHA isoforms with longer 3′UTRs, likely enhancing the mRNA stability and translation rate, which is expected to facilitate generation of NAD+, a pre-requisite driver for glycolysis, hence maintaining glycolysis. In addition, AS promotes the expression of non-functional Fas isoforms, resulting in the reduction of intact Fas proportion, which is expected to inhibit the transmission of apoptotic signals and prolong the neutrophil lifespan. Moreover, AS allows BRs to feature both membrane-bound and soluble IL-6R isoforms, which may enhance the migration capacity of neutrophils. These functional roles of AS, however, cannot be achieved through expression regulation (i.e., up-regulation or down-regulation). Therefore, we believe that AS in neutrophils provides an irreplaceable means of regulating “environmental fitness” or “resilience” in the face of continuous inhalation exposure challenges in poor air quality.
It has been suggested that the characterization of neutrophil metabolic shifts has become an emerging and active field that may provide essential knowledge on neutrophil physiology and pathology [19] regarding its role in inflammation response and pathogenesis progression. The link between metabolic shift and neutrophil inflammation response and pathogenesis progression has been outlined in many studies [90,91,92]. However, the molecular basis underlying metabolic shift has not yet been explored. Given that hypoxia is a key factor mediating metabolic shifts during the inflammatory response and neutrophil dysfunction, the characterization of “∩” patterns of expression and isoform diversity of HIF-1A, a key modulator of hypoxic stress, may represent a common feature of neutrophils underpinning the transition of metabolism occurring from the beginning of neutrophil activation to normal immune function response, and further to neutrophil dysfunction and the subsequent disease progression. These “∩” patterns may also provide some hints for understanding the molecular mechanism underlying impaired glycolysis in other organs (e.g., liver [93]) upon PM exposure.
During air pollution exposure, neutrophils act as a key player mediating crosstalk among other cell types to promote inflammatory responses [20,21,22]. The consequences of such crosstalk could be reflected as physiological phenotypes measured by different haematological indices (e.g., RBC and WBC counts, MCHC, etc.) and protein. However, the molecular evidence linking air pollution exposure and these physiological phenotypes in neutrophils are still largely unknown. In our study, the observation of association between different isoforms of HIF-1A and distinct physiological phenotypes may therefore fill this gap. Importantly, our findings highlight that therapeutic targets in PM-induced diseases should be targeted at a specific isoform dependent on physiological phenotypes rather than a whole gene.

5. Conclusions

We found that BRs exclusively expressed the PM-associated isoforms (PMAIs) of PFKFB3 and LDHA, encoding two key enzymes responsible for stimulating and maintaining glycolysis, respectively. PMAIs of PFKFB3 were expected to stimulate glycolysis in different sub-cellular functional compartments to trigger different immune functions sub-cellularly. PMAIs of LDHA have longer 3′UTRs relative to the one expressed in CRs, which enhance LDHA mRNA stability and translational efficiency, thus allowing glycolysis maintenance. The regulation of alternative splicing of both genes was directly regulated by different HIF-1A and HIF-1B isoforms. Importantly, these different isoforms could explain large variances of different physiological phenotypes, providing molecular evidence linking air pollution exposure and physiological phenotypes. Remarkably, AS of HIF-1A and PFKFB3 were significantly suppressed and expression of both genes was downregulated in COPD patients compared with BRs, suggesting that HIF-1 mediated defective glycolysis mediates neutrophil dysfunction, leading to subsequent progression of PM-induced diseases.

Supplementary Materials

The following are available online at https://www.mdpi.com/article/10.3390/atmos12080959/s1.

Author Contributions

Conceptualization, X.Z. and K.A.B.; Methodology, X.Z., K.A.B., S.P., X.F., R.A.A., T.P.J., Y.W., Z.L., C.J.; Data Analysis, S.P., D.P., K.A.B., R.A.A., T.P.J., X.D.; Writing (original draft), K.A.B., S.P.; Writing (review and editing), all co-authors; Funding Acquisition, K.A.B. and X.Z. All authors have read and agreed to the published version of the manuscript.

Funding

This study was supported by, Newton Advanced Fellowship to X.Z., and Youth Innovation Promotion Association of Chinese Academy of Sciences (2020086), the National Key Research and Development Program (2016YFD0500300, 2016YFC1304603).

Institutional Review Board Statement

All procedures followed were in accordance with the ethical standards of the responsible committee on human experimentation (institutional and national) and with the Helsinki Declaration of 1975, as revised in 2000 (5). The study is approved by the Ethic Committee of Beijing Chao-Yang Hospital with the protocol code NO.2019-5-1 and issued date 1 May 2019.

Informed Consent Statement

Informed consent was obtained from all patients included in the study.

Data Availability Statement

The raw sequencing data have been deposited in http://bigd.big.ac.cn/, accessed on 22 July 2021.

Conflicts of Interest

The authors declare no competing interest.

References

  1. World Health Organization. Ambient Air Pollution: A Global Assessment of Exposure and Burden of Disease. 2016. Available online: https://apps.who.int/iris/handle/10665/250141-eng.pdf (accessed on 1 June 2020).
  2. Brook, R.D.; Rajagopalan, S.; Pope, C.A., 3rd; Brook, J.R.; Bhatnagar, A.; Diez-Roux, A.V.; Holguin, F.; Hong, Y.; Luepker, R.V.; Mittleman, M.A.; et al. Particulate matter air pollution and cardiovascular disease: An update to the scientific statement from the American Heart Association. Circulation 2010, 121, 2331–7238. [Google Scholar] [CrossRef] [Green Version]
  3. Zhao, J.; Li, M.; Wang, Z.; Chen, J.; Zhao, J.; Xu, Y.; Wei, X.; Wang, J.; Xie, J. Role of PM2.5 in the development and progression of COPD and its mechanisms. Respir. Res. 2019, 20, 120. [Google Scholar] [CrossRef] [Green Version]
  4. Feng, X.; Shao, L.; Xi, C.; Jones, T.; Zhang, D.; Bérubé, K. Particle-induced oxidative damage by indoor size-segregated particulate matter from coal-burning homes in the Xuanwei lung cancer epidemic area, Yunnan Province, China. Chemosphere 2020, 256, 127058. [Google Scholar] [CrossRef]
  5. Yan, Y.-H.; Chou, C.C.-K.; Wang, J.-S.; Tung, C.-L.; Li, Y.-R.; Lo, K.; Cheng, T.-J. Subchronic effects of inhaled ambient particulate matter on glucose homeostasis and target organ damage in a type 1 diabetic rat model. Toxicol. Appl. Pharmacol. 2014, 281, 211–220. [Google Scholar] [CrossRef]
  6. World Health Organization. Global Urban Ambient Air Pollution Database (Update 2016). Available online: http://www.who.int/phe/health_topics/outdoorair/databases/cities/en/ (accessed on 1 June 2019).
  7. Li, T.; Hu, R.; Chen, Z.; Li, Q.; Huang, S.; Zhu, Z.; Zhou, L.-F. Fine particulate matter (PM2.5): The culprit for chronic lung diseases in China. Chronic Dis. Transl. Med. 2018, 4, 176–186. [Google Scholar] [CrossRef]
  8. Price, H.D.; Jones, T.P.; Bérubé, K.A. Resolution of the mediators of in vitro oxidative reactivity in size-segregated fractions that may be masked in the urban PM10 cocktail. Sci. Total Environ. 2014, 485-486, 588–595. [Google Scholar] [CrossRef] [Green Version]
  9. Adams, R.C. Training Response Inhibition to Reduce Food Consumption. Ph.D. Thesis, Cardiff University, Cardiff, UK, February 2014. [Google Scholar]
  10. Chuang, H.-C.; Jones, T.; Chen, T.-T.; Bérubé, K. Cytotoxic effects of incense particles in relation to oxidative stress, the cell cycle and F-actin assembly. Toxicol. Lett. 2013, 220, 229–237. [Google Scholar] [CrossRef] [PubMed]
  11. Chuang, H.-C.; Be, K.B.; Lung, S.-C.C.; Bai, K.-J.; Jones, T. Investigation into the oxidative potential generated by the formation of particulate matter from incense combustion. J. Hazard. Mater. 2013, 244–245, 142–150. [Google Scholar] [CrossRef]
  12. Huttunen, K.; Wlodarczyk, A.J.; Tirkkonen, J.; Mikkonen, S.; Täubel, M.; Krop, E.; Jacobs, J.; Pekkanen, J.; Heederik, D.; Zock, J.P.; et al. Oxidative capacity and haemolytic activity of settled dust from moisture-damaged schools. Indoor Air 2019, 29, 299–307. [Google Scholar] [CrossRef]
  13. Shao, L.; Hou, C.; Geng, C.; Liu, J.; Hu, Y.; Wang, J.; Jones, T.; Zhao, C.; Bérubé, K. The oxidative potential of PM 10 from coal, briquettes and wood charcoal burnt in an experimental domestic stove. Atmos. Environ. 2016, 127, 372–381. [Google Scholar] [CrossRef]
  14. Shao, L.; Hu, Y.; Shen, R.; Schäfer, K.G.; Wang, J.; Wang, J.; Schnelle-Kreis, J.; Zimmermann, R.; Bérubé, K.; Suppan, P. Seasonal variation of particle-induced oxidative potential of airborne particulate matter in Beijing. Sci. Total Environ. 2017, 579, 1152–1160. [Google Scholar] [CrossRef] [Green Version]
  15. Jones, T.; Be, K.B. The bioreactivity of the sub-10μm component of volcanic ash: Soufrière Hills volcano, Montserrat. J. Hazard. Mater. 2011, 194, 128–134. [Google Scholar] [CrossRef] [Green Version]
  16. Chen, T.-T.; Chuang, K.-J.; Chiang, L.-L.; Chen, C.-C.; Yeh, C.-T.; Wang, L.-S.; Gregory, C.; Jones, T.; Bérubé, K.; Lee, C.-N.; et al. Characterization of the interactions between protein and carbon black. J. Hazard. Mater. 2014, 264, 127–135. [Google Scholar] [CrossRef]
  17. Moreno, T.; Martins, V.; Querol, X.; Jones, T.; Bérubé, K.; Minguillón, M.C.; Amato, F.; Capdevila, M.; de Miguel, E.; Centelles, S.; et al. A new look at inhalable metalliferous airborne particles on rail subway platforms. Sci. Total Environ. 2015, 505, 367–375. [Google Scholar] [CrossRef] [Green Version]
  18. Pope, C.A., 3rd; Burnett, R.T.; Thurston, G.D.; Thun, M.J.; Calle, E.E.; Krewski, D.; Godleski, J.J. Cardiovascular mortality and long-term exposure to particulate air pollution-epidemiological evidence of general pathophysiological pathways of disease. Circulation 2004, 109, 71–77. [Google Scholar] [CrossRef] [Green Version]
  19. Injarabian, L.; Devin, A.; Ransac, S.; Marteyn, B.S. Neutrophil metabolic shift during their lifecycle: Impact on their survival and activation. Int. J. Mol. Sci. 2020, 21, 287. [Google Scholar] [CrossRef] [Green Version]
  20. Wright, H.; Moots, R.J.; Bucknall, R.C.; Edwards, S.W. Neutrophil function in inflammation and inflammatory diseases. Rheumatology 2010, 49, 1618–1631. [Google Scholar] [CrossRef] [Green Version]
  21. Weiss, D.J.; Klausner, J.S. Neutrophil-induced Erythrocyte Injury: A potential cause of erythrocyte destruction in the anemia associated with inflammatory disease. Vet. Pathol. 1988, 25, 450–455. [Google Scholar] [CrossRef] [Green Version]
  22. Meinderts, S.M.; Oldenborg, P.A.; Beuger, B.M.; Klei, T.; Johansson, J.; Kuijpers, T.W.; Matozaki, T.; Huisman, E.J.; de Haas, M.; van den Berg, T.K.; et al. Human and murine splenic neutrophils are potent phagocytes of IgG-opsonized red blood cells. Blood Adv. 2017, 1, 875–886. [Google Scholar] [CrossRef] [Green Version]
  23. Peretz, A.; Peck, E.C.; Bammler, T.K.; Beyer, R.P.; Sullivan, J.H.; Trenga, C.A.; Srinouanprachnah, S.; Farin, F.M.; Kaufman, J.D. Diesel exhaust inhalation and assessment of peripheral blood mononuclear cell gene transcription effects: An exploratory study of healthy human volunteers. Inhal. Toxicol. 2007, 19, 1107–1119. [Google Scholar] [CrossRef]
  24. Zhou, Z.; Liu, Y.; Duan, F.; Qin, M.; Wu, F.; Sheng, W.; Yang, L.; Liu, J.; He, K. Transcriptomic analyses of the biological effects of airborne PM2.5 exposure on human bronchial epithelial cells. PLoS ONE 2015, 10, e0138267. [Google Scholar] [CrossRef] [Green Version]
  25. Líbalová, H.; Uhlířová, K.; Kléma, J.; Machala, M.; Šrám, R.J.; Ciganek, M.; Topinka, J. Global gene expression changes in human embryonic lung fibroblasts induced by organic extracts from respirable air particles. Part. Fibre Toxicol. 2012, 9, 1. [Google Scholar] [CrossRef] [Green Version]
  26. Watterson, T.L.; Sorensen, J.; Martin, R.; Coulombe, R.A. Effects of PM2.5 collected from cache valley utah on genes associated with the inflammatory response in human lung cells. J. Toxicol. Environ. Health Part A 2007, 70, 1731–1744. [Google Scholar] [CrossRef]
  27. Zhang, H.; Yuan, H.; Liu, X.; Yu, J.; Jiao, Y. Impact of synoptic weather patterns on 24 h-average PM2.5 concentrations in the North China Plain during 2013–2017. Sci. Total Environ. 2018, 627, 200–210. [Google Scholar] [CrossRef] [PubMed]
  28. Shao, L.; Shi, Z.; Jones, T.; Li, J.; Whittaker, A.; Bérubé, K. Bioreactivity of particulate matter in Beijing air: Results from plasmid DNA assay. Sci. Total Environ. 2006, 367, 261–272. [Google Scholar] [CrossRef]
  29. Shi, Z.; Shao, L.; Jones, T.; Whittaker, A.; Lu, S.; BeruBe, K.; He, T.; Richards, R. Characterization of airborne individual particles collected in an urban area, a satellite city and a clean air area in Beijing, 2001. Atmos. Environ. 2003, 37, 4097–4108. [Google Scholar] [CrossRef]
  30. Lu, S.; Shao, L.; Wu, M.; Jones, T.P.; Merolla, L.; Richard, R.J. Correlation between plasmid DNA damage induced by PM10 and trace metals in inhalable particulate matters in Beijing air. Sci. China Ser. D Earth Sci. 2006, 49, 1323–1331. [Google Scholar] [CrossRef]
  31. Shao, L.; Li, J.; Zhao, H.; Yang, S.; Li, H.; Li, W.; Jones, T.; Sexton, K.; Be, K.B. Associations between particle physicochemical characteristics and oxidative capacity: An indoor PM10 study in Beijing, China. Atmos. Environ. 2007, 41, 5316–5326. [Google Scholar] [CrossRef]
  32. Jones, T.; Wlodarczyk, A.; Koshy, L.; Brown, P.; Longyi, S.; Be, K.B. The geochemistry and bioreactivity of fly-ash from coal-burning power stations. Biomarkers 2009, 14, 45–48. [Google Scholar] [CrossRef]
  33. Shi, Z.; Shao, L.; Li, H.; Whittaker, A.G.; Jones, T.P.; BeruBe, K.; Richards, R.J. Physicochemical characterization of the PM10 in ambient air of northwestern Beijing urban area during heating-period. Huan Jing Ke Xue 2002, 23, 30–34. [Google Scholar]
  34. Shi, Z.; Shao, L.; Jones, T.P.; Lu, S. Microscopy and mineralogy of airborne particles collected during severe dust storm episodes in Beijing, China. J. Geophys. Res. Atmos. 2005, 110, 1–10. [Google Scholar] [CrossRef] [Green Version]
  35. Whittaker, A.G.; Jones, T.P.; Shao, L.; Shi, Z.; BérubéK, A.; Richards, R.J. Mineral dust in urban air: Beijing, China. Miner. Mag. 2003, 67, 173–182. [Google Scholar] [CrossRef]
  36. Yuan, G.; Yang, W. Evaluating China’s air pollution control policy with extended AQI indicator system: Example of the Beijing-Tianjin-Hebei region. Sustainability 2019, 11, 939. [Google Scholar] [CrossRef] [Green Version]
  37. Miller, M.R.; Crapo, R.; Hankinson, J.; Brusasco, V.; Burgos, F.; Casaburi, R.; Coates, A.; Enright, P.; Van Der Grinten, C.P.M.; Gustafsson, P.; et al. General considerations for lung function testing. Eur. Respir. J. 2005, 26, 153–161. [Google Scholar] [CrossRef] [Green Version]
  38. Piorunek, T.; Kostrzewska, M.; Cofta, S.; Batura-Gabryel, H.; Andrzejczak, P.; Bogdanski, P.; Wysocka, E. Impulse oscillometry in the diagnosis of airway resistance in Chronic Obstructive Pulmonary Disease. Adv. Exp. Med. Biol. 2015, 838, 47–52. [Google Scholar] [CrossRef]
  39. Kim, D.; Langmead, B.; Salzberg, S.L. HISAT: A fast spliced aligner with low memory requirements. Nat. Methods 2015, 12, 357–360. [Google Scholar] [CrossRef] [Green Version]
  40. Pertea, M.; Pertea, G.M.; Antonescu, C.M.; Chang, T.-C.; Mendell, J.T.; Salzberg, S.L. StringTie enables improved reconstruction of a transcriptome from RNA-seq reads. Nat. Biotechnol. 2015, 33, 290–295. [Google Scholar] [CrossRef] [PubMed] [Green Version]
  41. Li, B.; Dewey, C.N. RSEM: Accurate transcript quantification from RNA-seq data with or without a reference genome. BMC Bioinform. 2011, 12, 323. [Google Scholar] [CrossRef] [PubMed] [Green Version]
  42. Cartegni, L.; Wang, J.; Zhu, Z.; Zhang, M.Q.; Krainer, A.R. ESEfinder: A web resource to identify exonic splicing enhancers. Nucleic Acids Res. 2003, 31, 3568–3571. [Google Scholar] [CrossRef] [PubMed] [Green Version]
  43. Pan, S.; Zhang, T.; Rong, Z.; Hu, L.; Gu, Z.; Wu, Q.; Dong, S.; Liu, Q.; Lin, Z.; Deutschova, L.; et al. Population transcriptomes reveal synergistic responses of DNA polymorphism and RNA expression to extreme environments on the Qinghai-Tibetan Plateau in a predatory bird. Mol. Ecol. 2017, 26, 2993–3010. [Google Scholar] [CrossRef]
  44. Zhou, X.; Lindsay, H.; Robinson, M.D. Robustly detecting differential expression in RNA sequencing data using observation weights. Nucleic Acids Res. 2014, 42, e91. [Google Scholar] [CrossRef]
  45. Anders, S.; Huber, W. Differential expression analysis for sequence count data. Genome Biol. 2010, 11, R106. [Google Scholar] [CrossRef] [Green Version]
  46. Li, J.; Tibshirani, R. Finding consistent patterns: A nonparametric approach for identifying differential expression in RNA-seq data. Stat. Methods Med. Res. 2013, 22, 519–536. [Google Scholar] [CrossRef] [Green Version]
  47. Smyth, G.K. Linear models and empirical Bayes methods for assessing differential expression in microarray experiments. Stat. Appl. Genet. Mol. Biol. 2004, 3, 1–25. [Google Scholar] [CrossRef]
  48. Mor, I.; Cheung, E.C.; Vousden, K.H. Control of glycolysis through regulation of PFK1: Old friends and recent additions. Cold Spring Harb. Symp. Quant. Biol. 2011, 76, 211–216. [Google Scholar] [CrossRef]
  49. Martinez-Contreras, R.; Cloutier, P.; Shkreta, L.; Fisette, J.-F.; Revil, T.; Chabot, B. hnRNP Proteins and splicing control. Adv. Exp. Med. Biol. 2007, 623, 123–147. [Google Scholar] [CrossRef]
  50. Zhou, Z.; Fu, X.-D. Regulation of splicing by SR proteins and SR protein-specific kinases. Chromosoma 2013, 122, 191–207. [Google Scholar] [CrossRef]
  51. Jian, X.; Boerwinkle, E.; Liu, X. In silico tools for splicing defect prediction: A survey from the viewpoint of end users. Genet. Med. 2014, 16, 497–503. [Google Scholar] [CrossRef] [Green Version]
  52. Chen, C.D.; Kobayashi, R.; Helfman, D.M. Binding of hnRNP H to an exonic splicing silencer is involved in the regulation of alternative splicing of the rat beta -tropomyosin gene. Genes Dev. 1999, 13, 593–606. [Google Scholar] [CrossRef] [Green Version]
  53. Han, G.; Lu, C.; Guo, J.; Qiao, Z.; Sui, N.; Qiu, N.; Wang, B. C2H2 Zinc finger proteins: Master regulators of abiotic stress responses in plants. Front. Plant Sci. 2020, 11, 115. [Google Scholar] [CrossRef] [Green Version]
  54. Cassandri, M.; Smirnov, A.; Novelli, F.; Pitolli, C.; Agostini, M.; Malewicz, M.; Melino, G.; Raschellà, G. Zinc-finger proteins in health and disease. Cell Death Discov. 2017, 3, 17071. [Google Scholar] [CrossRef] [Green Version]
  55. Dai, J.; Sun, C.; Yao, Z.; Chen, W.; Yu, L.; Long, M. Exposure to concentrated ambient fine particulate matter disrupts vascular endothelial cell barrier function via the IL-6/HIF-1α signaling pathway. FEBS Open Biol. 2016, 6, 720–728. [Google Scholar] [CrossRef] [PubMed] [Green Version]
  56. Cramer, T.; Yamanishi, Y.; Clausen, B.E.; Förster, I.; Pawlinski, R.; Mackman, N.; Haase, V.H.; Jaenisch, R.; Corr, M.; Nizet, V.; et al. HIF-1α Is Essential for Myeloid Cell-Mediated Inflammation. Cell 2003, 112, 645–657. [Google Scholar] [CrossRef] [Green Version]
  57. Egners, A.; Erdem, M.; Cramer, T. The response of macrophages and neutrophils to hypoxia in the context of cancer and other inflammatory diseases. Mediat. Inflamm. 2016, 2016, 2053646. [Google Scholar] [CrossRef] [Green Version]
  58. Sun, L.; Fu, J.; Lin, S.H.; Sun, J.L.; Xia, L.; Lin, C.H.; Liu, L.; Zhang, C.; Yang, L.; Xue, P.; et al. Particulate matter of 2.5 μm or less in diameter disturbs the balance of TH17/regulatory T cells by targeting glutamate oxaloacetate transaminase 1 and hypoxia-inducible factor 1α in an asthma model. J. Allergy Clin. Immunol. 2020, 145, 402–414. [Google Scholar] [CrossRef] [Green Version]
  59. Li, H.; Cai, J.; Chen, R.; Zhao, Z.; Ying, Z.; Wang, L.; Chen, J.; Hao, K.; Kinney, P.L.; Chen, H.; et al. Particulate matter exposure and stress hormone levels: A randomized, double-blind, crossover trial of air purification. Circulation 2017, 136, 618–627. [Google Scholar] [CrossRef]
  60. Yi, M.; Ban, Y.; Tan, Y.; Xiong, W.; Li, G.; Xiang, B. 6-Phosphofructo-2-kinase/fructose-2,6-biphosphatase 3 and 4: A pair of valves for fine-tuning of glucose metabolism in human cancer. Mol. Metab. 2019, 20, 1–13. [Google Scholar] [CrossRef]
  61. Kim, S.-G.; Manes, N.; El-Maghrabi, M.R.; Lee, Y.-H. Crystal structure of the hypoxia-inducible form of 6-phosphofructo-2-kinase/fructose-2,6-bisphosphatase (PFKFB3): A possible new target for cancer therapy. J. Biol. Chem. 2006, 281, 2939–2944. [Google Scholar] [CrossRef] [PubMed] [Green Version]
  62. Minchenko, O.H.; Ogura, T.; Opentanova, I.L.; Minchenko, D.O.; Esumi, H. Splice isoform of 6-phosphofructo-2-kinase/fructose-2,6-bisphosphatase-4: Expression and hypoxic regulation. Mol. Cell. Biochem. 2005, 280, 227–234. [Google Scholar] [CrossRef]
  63. Semenza, G.L.; Jiang, B.-H.; Leung, S.W.; Passantino, R.; Concordet, J.-P.; Maire, P.; Giallongo, A. Hypoxia response elements in the Aldolase A, Enolase 1, and Lactate Dehydrogenase A gene promoters contain essential binding sites for hypoxia-inducible factor 1. J. Biol. Chem. 1996, 271, 32529–32537. [Google Scholar] [CrossRef] [Green Version]
  64. Tanguay, R.L.; Gallie, D.R. Translational efficiency is regulated by the length of the 3′ untranslated region. Mol. Cell. Biol. 1996, 16, 146–156. [Google Scholar] [CrossRef] [Green Version]
  65. Zhao, R.Z.; Jiang, S.; Zhang, L.; Yu, Z.B. Mitochondrial electron transport chain, ROS generation and uncoupling (Review). Int. J. Mol. Med. 2019, 44, 3–15. [Google Scholar] [CrossRef] [Green Version]
  66. Sanders, L.H.; Greenamyre, T.J. Oxidative damage to macromolecules in human Parkinson disease and the rotenone model. Free Radic. Biol. Med. 2013, 62, 111–120. [Google Scholar] [CrossRef] [Green Version]
  67. Minchenko, O.; Leshchinsky, I.; Opentanova, I.; Sang, N.; Srinivas, V.; Armstead, V.; Caro, J. Hypoxia-inducible factor-1-mediated expression of the 6-Phosphofructo-2-kinase/fructose-2,6-bisphosphatase-3 (PFKFB3) gene. Its possible role in the Warburg effect. J. Biol. Chem. 2002, 277, 6183–6187. [Google Scholar] [CrossRef] [Green Version]
  68. Cui, X.G.; Han, Z.T.; He, S.H.; Wu, X.D.; Chen, T.R.; Shao, C.H.; Chen, D.L.; Su, N.; Chen, Y.M.; Wang, T.; et al. HIF1/2α mediates hypoxia-induced LDHA expression in human pancreatic cancer cells. Oncotarget 2017, 8, 24840–24852. [Google Scholar] [CrossRef]
  69. Greijer, A.E.; van der Wall, E. The role of hypoxia inducible factor 1 (HIF-1) in hypoxia induced apoptosis. J. Clin. Pathol. 2004, 57, 1009–1014. [Google Scholar] [CrossRef]
  70. Zhao, J.; Zhou, Y.; Zhang, X.; Chen, L. Part mutual information for quantifying direct associations in networks. Proc. Natl. Acad. Sci. USA 2016, 113, 5130–5135. [Google Scholar] [CrossRef] [Green Version]
  71. Anderson, J.M.; Rodriguez, A.; Chang, D.T. Foreign body reaction to biomaterials. Semin. Immunol. 2008, 20, 86–100. [Google Scholar] [CrossRef] [Green Version]
  72. McCracken, J.M.; Allen, L.-A.H. Regulation of human neutrophil apoptosis and lifespan in health and disease. J. Cell Death 2014, 7, 15–23. [Google Scholar] [CrossRef] [Green Version]
  73. Volpe, E.; Sambucci, M.; Battistini, L.; Borsellino, G. Fas–Fas ligand: Checkpoint of T cell functions in multiple sclerosis. Front. Immunol. 2016, 7, 382. [Google Scholar] [CrossRef] [PubMed] [Green Version]
  74. Selders, G.S.; Fetz, A.E.; Radic, M.; Bowlin, G.L. An overview of the role of neutrophils in innate immunity, inflammation and host-biomaterial integration. Regen. Biomater. 2017, 4, 55–68. [Google Scholar] [CrossRef]
  75. Hou, G.; Valujskikh, A.; Bayer, J.; Stavitsky, A.B.; Metz, C.; Heeger, P.S. In vivo blockade of macrophage migration inhibitory factor prevents skin graft destruction after indirect allorecognition1. Transplantation 2001, 72, 1890–1897. [Google Scholar] [CrossRef] [Green Version]
  76. Demir, Y.; Chen, Y.; Metz, C.; Renz, H.; Heeger, P.S. Cardiac allograft rejection in the absence of macrophage migration inhibitory factor. Transplantation 2003, 76, 244–247. [Google Scholar] [CrossRef]
  77. Huang, X.R.; Hui, C.W.C.; Chen, Y.-X.; Chun, B.; Wong, B.; Fung, P.C.; Metz, C.; Cho, C.H.; Hui, W.M.; Bucala, R.; et al. Macrophage migration inhibitory factor is an important mediator in the pathogenesis of gastric inflammation in rats. Gastroenterology 2001, 121, 619–630. [Google Scholar] [CrossRef]
  78. Ferro, E.A.V.; Mineo, J.R.; Ietta, F.; Bechi, N.; Romagnoli, R.; Silva, D.A.O.; Sorda, G.; Bevilacqua, E.; Paulesu, L.R. Macrophage migration inhibitory factor is up-regulated in human first-trimester placenta stimulated by soluble antigen of Toxoplasma gondii, resulting in increased monocyte adhesion on villous explants. Am. J. Pathol. 2008, 172, 50–58. [Google Scholar] [CrossRef] [Green Version]
  79. Jovanović, M.; Vićovac, L. Interleukin-6 stimulates cell migration, invasion and integrin expression in HTR-8/SVneo cell line. Placenta 2009, 30, 320–328. [Google Scholar] [CrossRef]
  80. Lei, C.-T.; Su, H.; Ye, C.; Tang, H.; Gao, P.; Wan, C.; He, F.-F.; Wang, Y.-M.; Zhang, C. The classic signalling and trans-signalling of interleukin-6 are both injurious in podocyte under high glucose exposure. J. Cell. Mol. Med. 2018, 22, 251–260. [Google Scholar] [CrossRef]
  81. Maston, L.D.; Jones, D.T.; Giermakowska, W.; Resta, T.C.; Ramiro-Diaz, J.M.; Howard, T.A.; Jernigan, N.L.; Herbert, L.; Maurice, A.A.; Bosc, L.V.G. Interleukin-6 trans-signaling contributes to chronic hypoxia-induced pulmonary hypertension. Pulm. Circ. 2018, 8, 2045894018780734. [Google Scholar] [CrossRef] [Green Version]
  82. Stringer, K.A.; Tobias, M.; O’Neill, H.C.; Franklin, C.C. Cigarette smoke extract-induced suppression of caspase-3-like activity impairs human neutrophil phagocytosis. Am. J. Physiol. Lung Cell. Mol. Physiol. 2007, 292, L1572–L1579. [Google Scholar] [CrossRef] [PubMed]
  83. McGovern, N.N.; Cowburn, A.S.; Porter, L.; Walmsley, S.R.; Summers, C.; Thompson, A.; Anwar, S.; Willcocks, L.C.; Whyte, M.; Condliffe, A.M.; et al. Hypoxia selectively inhibits respiratory burst activity and killing of Staphylococcus aureus in human neutrophils. J. Immunol. 2011, 186, 453–463. [Google Scholar] [CrossRef] [Green Version]
  84. Drannik, A.G.; Pouladi, M.; Robbins, C.; Goncharova, S.I.; Kianpour, S.; Stampfli, M. Impact of cigarette smoke on clearance and inflammation after Pseudomonas aeruginosa infection. Am. J. Respir. Crit. Care Med. 2004, 170, 1164–1171. [Google Scholar] [CrossRef] [Green Version]
  85. Sapey, E.; Stockley, J.A.; Greenwood, H.; Ahmad, A.; Bayley, D.; Lord, J.; Insall, R.; Stockley, R.A. Behavioral and structural differences in migrating peripheral neutrophils from patients with Chronic Obstructive Pulmonary Disease. Am. J. Respir. Crit. Care Med. 2011, 183, 1176–1186. [Google Scholar] [CrossRef] [PubMed]
  86. Jeong, S.; A Park, S.; Park, I.; Kim, P.; Cho, N.H.; Hyun, J.W.; Hyun, Y.-M. PM2.5 Exposure in the respiratory system induces distinct inflammatory signaling in the lung and the liver of mice. J. Immunol. Res. 2019, 2019, 1–11. [Google Scholar] [CrossRef]
  87. Sun, Q.; Jiang, S.; Xu, X. Particulate air pollution on systemic inflammatory response: Roles of monocytes and neutrophils. Eur. Respir. J. 2012, 40, 4783. [Google Scholar] [CrossRef] [Green Version]
  88. Hoenderdos, K.; Condliffe, A. The neutrophil in Chronic Obstructive Pulmonary Disease. Too little, too late or too much, too soon? Am. J. Respir. Cell Mol. Biol. 2013, 48, 531–539. [Google Scholar] [CrossRef]
  89. Alberts, N.; Johnson, A.; Lewis, J.; Raff, M.; Roberts, K.; Walter, P. Molecular Biology of the Cell, 4th ed.; Garland Science: New York, NY, USA, 2002. [Google Scholar]
  90. Wang, A.; Huen, S.C.; Luan, H.H.; Yu, S.; Zhang, C.; Gallezot, J.-D.; Booth, C.J.; Medzhitov, R. Opposing effects of fasting Metabolism on tissue tolerance in bacterial and viral inflammation. Cell 2016, 166, 1512–1525.e12. [Google Scholar] [CrossRef] [Green Version]
  91. Bowden, S.D.; Rowley, G.; Hinton, J.C.D.; Thompson, A. Glucose and glycolysis are required for the successful infection of macrophages and mice by Salmonella enterica serovar typhimurium. Infect. Immun. 2009, 77, 3117–3126. [Google Scholar] [CrossRef] [PubMed] [Green Version]
  92. Xavier, M.N.; Winter, M.G.; Spees, A.M.; den Hartigh, A.B.; Nguyen, K.; Roux, C.M.; Silva, T.M.; Atluri, V.L.; Kerrinnes, T.; Keestra, A.M.; et al. PPARγ-mediated increase in glucose availability sustains chronic Brucella abortus infection in alternatively activated macrophages. Cell Host Microbe 2013, 14, 159–170. [Google Scholar] [CrossRef] [PubMed] [Green Version]
  93. Reyes-Caballero, H.; Rao, X.; Sun, Q.; Warmoes, M.O.; Lin, P.; Sussan, T.E.; Park, B.; Fan, T.W.-M.; Maiseyeu, A.; Rajagopalan, S.; et al. Air pollution-derived particulate matter dysregulates hepatic Krebs cycle, glucose and lipid metabolism in mice. Sci. Rep. 2019, 9, 1–10. [Google Scholar] [CrossRef] [PubMed] [Green Version]
Figure 1. Geographical locations of Beijing and the satellite cities, featuring Chengde and the NE–SW AP transport corridor. In spring, the wind blows equally to the NE and SW, in summer it is mostly winds to the SW. However, in the autumn and winter, which is the most heavily polluted time of the year, the predominate wind direction is from Beijing to Chengde [27].
Atmosphere 12 00959 g001
Figure 2. Physiological responses upon AP exposure. (a) Comparison of lung function indexed by FEV1/FVC between BRs, CRs and COPD patients. (b) Comparison of mean corpuscular haemoglobin concentration between BRs, CRs and COPD patients. (c) Correlation between PM10 and ratio of neutrophil. Error bars indicate standard error of mean (S.E.M). ★ p < 0.05, ★★ p < 0.01, ★★★ p < 0.001, t-test.
Atmosphere 12 00959 g002
Figure 3. Alternative splicing is the major factor generating large abundance of transcripts during AP exposure. (a) The number of expressed transcripts in BRs and CRs. Error bars indicate S.E.M. *** p < 0.001, t-test. (b) The number of expressed AS-derived transcripts for each of the 6760 genes in BRs (x-axis) plotted against that in CRs (y-axis). (c) Genes generating more AS-transcripts in BRs in the major mRNA splicing pathway were denoted as orange. Red box indicated hnRNP and SR protein families. The pathway is modified from http://www.reactome.org/content/detail/R-HSA-72163, accessed on 2 November 2017. (d) A schematic graph showing how hnRNP and SR proteins cooperate during pre-mRNA splicing. This model is modified from a previous study [48].
Atmosphere 12 00959 g003
Figure 4. Roles of alternative splicing in responding to AP exposure. (a) Proportions of AS-derived transcripts whose expression is significantly correlated with either AQI, PM10 and PM2.5, for BR-specific, CR-specific and BR–CR shared AS-derived transcripts. CD.AS: CR-specific AS-derived transcripts; Shared: BR–CR shared AS-derived transcripts; BJ.AS: BR-specific AS-derived transcripts. The sub-figure on the top left shows the classification (BR-specific, Shared and CR-specific) of the top 100 AS-derived transcripts showing the most significant correlation with either AQI, PM2.5 and PM10. (b) Utilization frequency of each ESE element between BR-specific and shared transcripts with one element CACAGGA being highlighted. X-axis represents the observed frequency for BR-specific AS-derived transcripts and y-axis is the frequency for shared AS-derived transcripts. (c) A pathway showing the roles of HIF1A, HIF1B, PFKFB3, PFK1 and LDHA in glycolysis. (dg) Alternative splicing patterns of PFKFB3, LDHA, HIF1A and HIF1B with expression of each isoform in BR and CR shown in the right. * p < 0.05, ** p < 0.01, *** p < 0.001, t-test. (h) Pearson correlation and PMI between expression of each PFKFB3, LDHA isoform and that of each HIF1A, HIF1B isoform. (i) Variance explanation of each isoform of HIF1A, HIF1B (also referred as ARNT) and IL6R for each physiological index. Redder colour denotes greater variance.
Atmosphere 12 00959 g004
Table 1. Information for healthy recruits from Beijing and Chengde.
CitySample IDSexSample TypeAge (yr)Height (cm)Weight (kg)
Chengde201705CD0001FemaleRNA + plasma2316352
201705CD0002FemaleRNA + plasma2916952
201705CD0003FemaleRNA + plasma2616848
201705CD0004FemaleRNA + plasma2516050
201705CD0005FemaleRNA + plasma2515955
201705CD0006MaleRNA + plasma2617053
201705CD0007MaleRNA + plasma2817590
201705CD0008MaleRNA + plasma26178100
201705CD0009MaleRNA + plasma3117381
201705CD0010MaleRNA + plasma3018380
Beijing201705IOZ0001FemaleRNA + plasma2617365
201705IOZ0002FemaleRNA + plasma2416760
201603IOZ0014MaleRNA + plasma2217882
201603IOZ0011MaleRNA + plasma2916763
201603IOZ0002FemaleRNA + plasma2516050
201603IOZ0009MaleRNA + plasma3316058
201603IOZ0012MaleRNA + plasma2717680
201603IOZ0006MaleRNA + plasma3816967
201703IOZ0013MaleRNA + plasma2718065
201711IOZ0012MaleRNA + plasma3917878
Table 2. Information for 10 COPD participants from Beijing.
CitySample IDSexSample TypeAge (yr)Height (cm)Weight (kg)
Beijing201612cy0001MaleRNA + plasma5816878
201612cy0002MaleRNA + plasma5816546
201612cy0003MaleRNA + plasma7016057
201612cy0004MaleRNA + plasma6016561
201703cy0006MaleRNA + plasma5616058
201703cy0007MaleRNA + plasma5616161
201703cy0008MaleRNA + plasma8216361
201703cy0009MaleRNA + plasma6415750
201711cy0010MaleRNA + plasma6717288
201711cy0011MaleRNA + plasma7716548
Publisher’s Note: MDPI stays neutral with regard to jurisdictional claims in published maps and institutional affiliations.

