
Three-Year Variations in Criteria Atmospheric Pollutants and Their Relationship with Rainwater Chemistry in Karst Urban Region, Southwest China


Abstract
:1. Introduction
2. Methodology
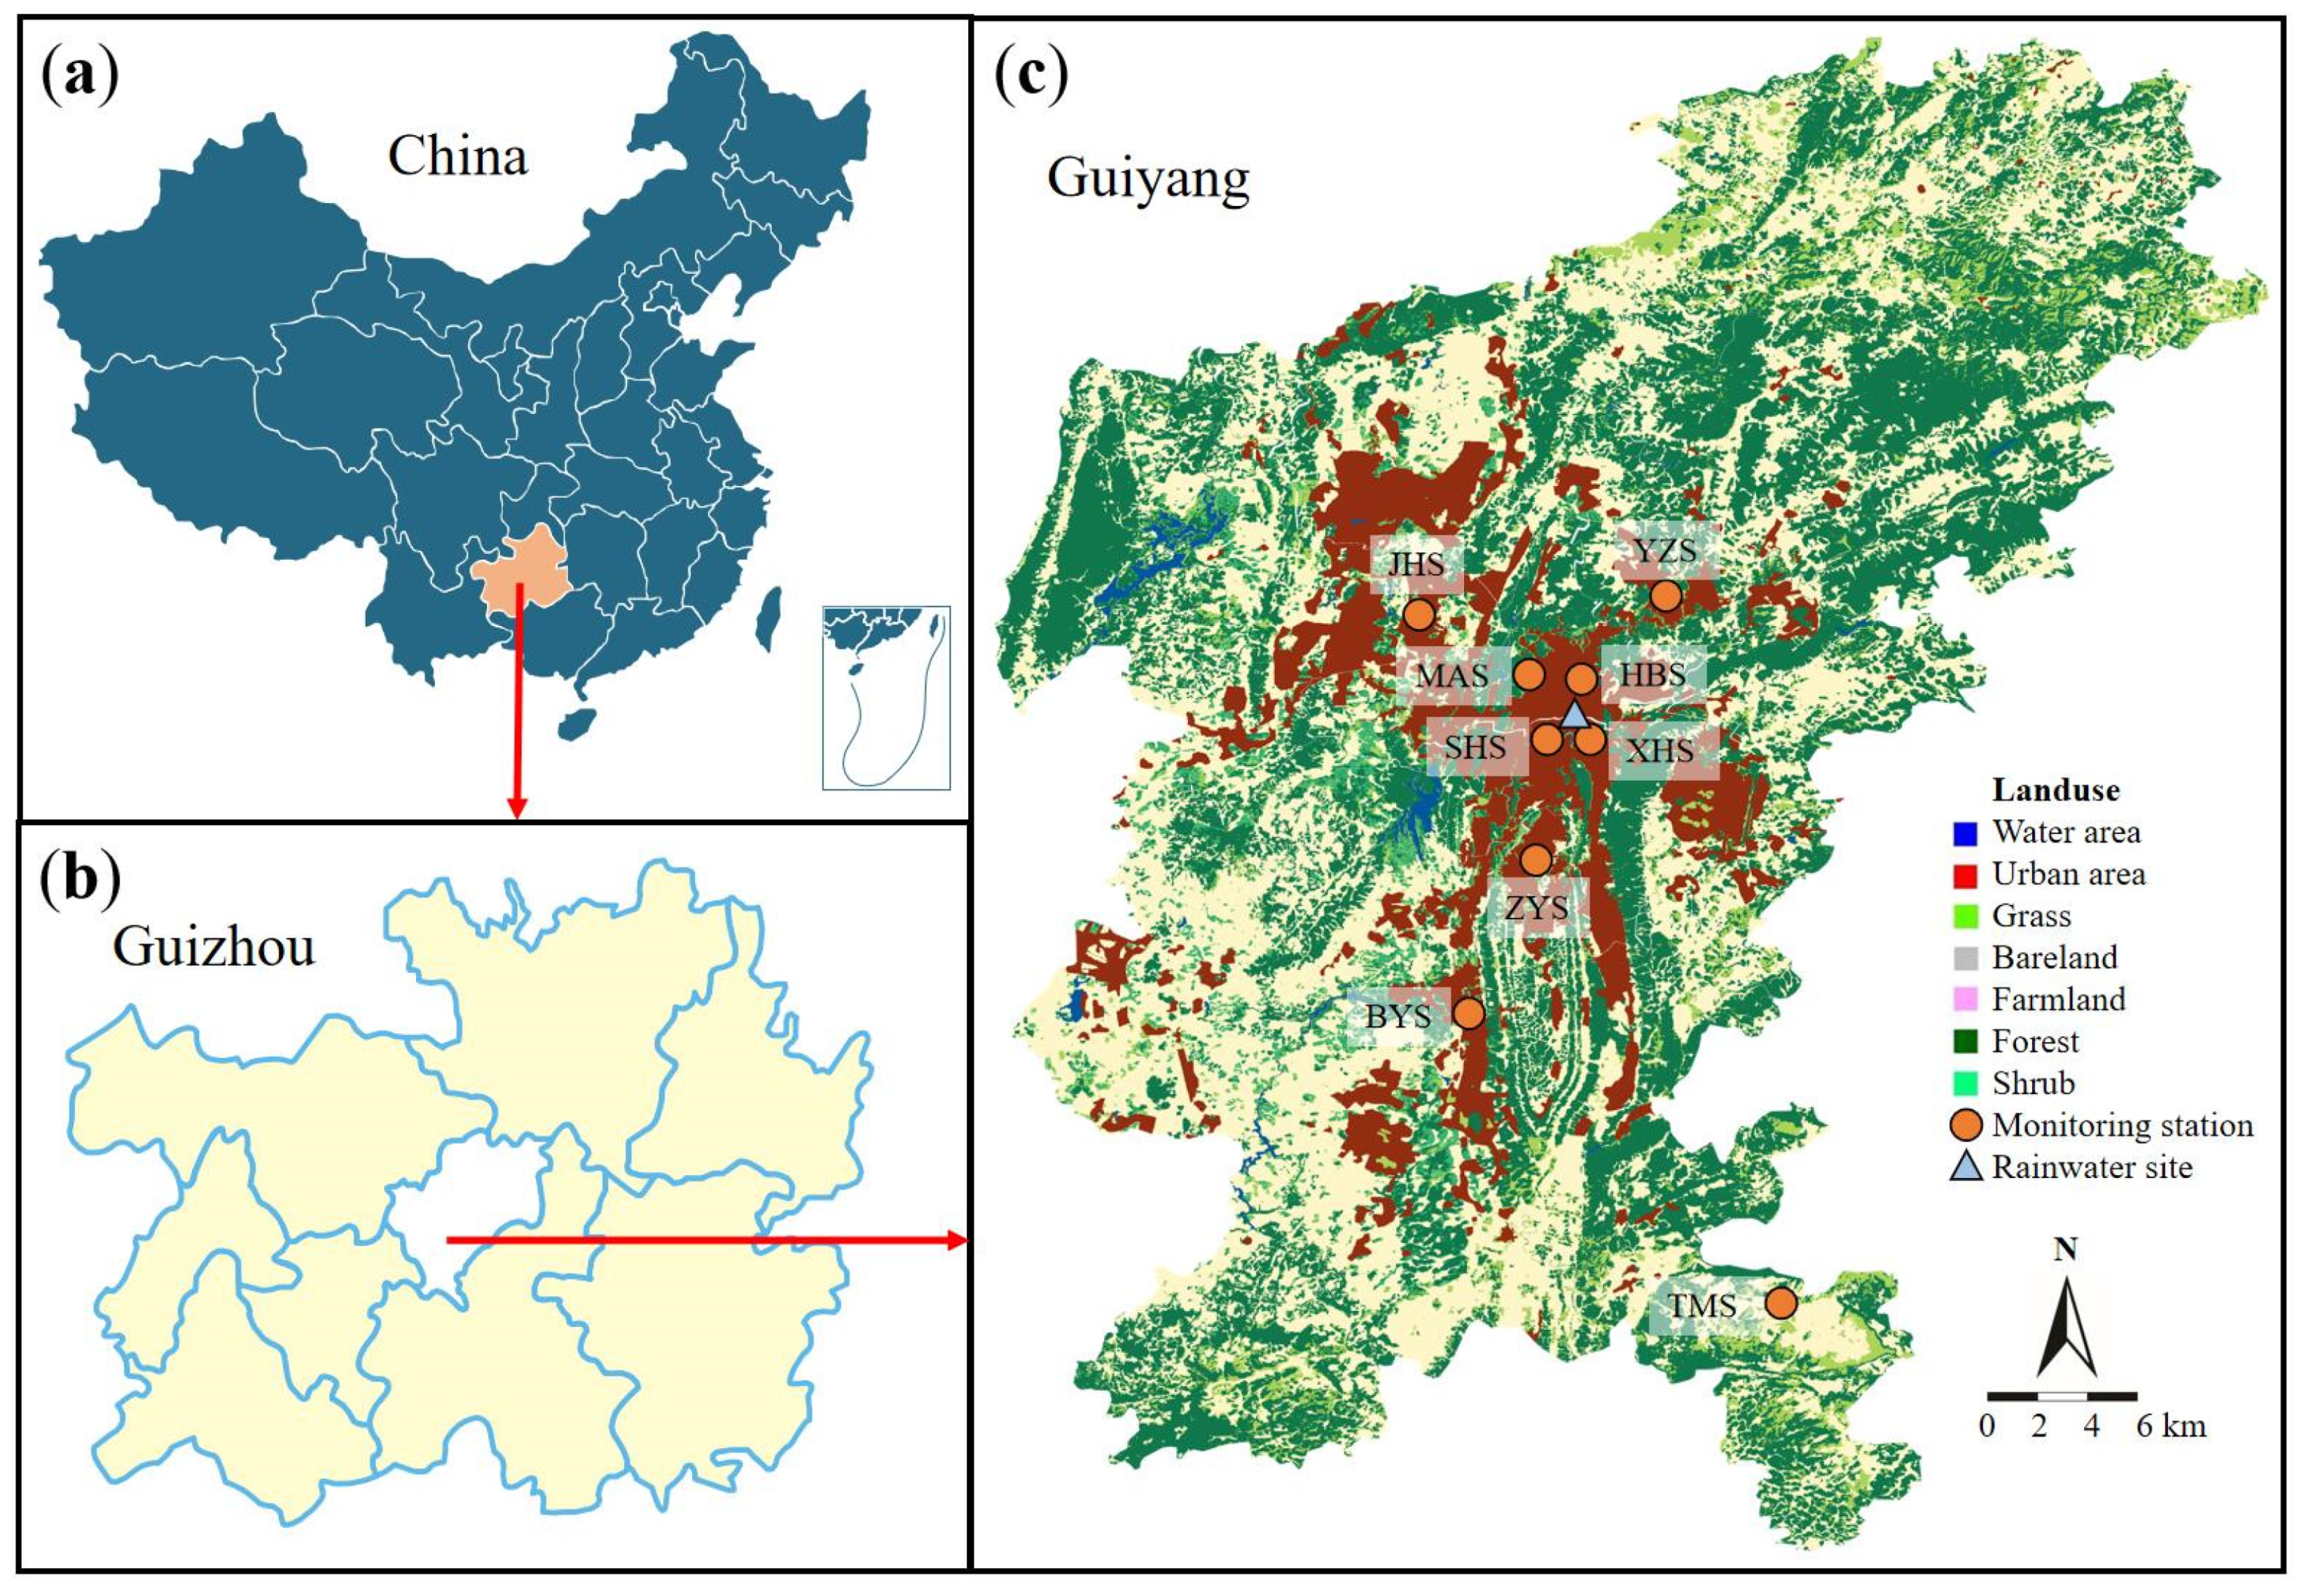
2.1. Study Area
2.2. Atmospheric Pollutants Data Collection
2.3. Rainwater Collection and Measurement
3. Results and Discussion
3.1. Overview of Air Pollutant Concentrations
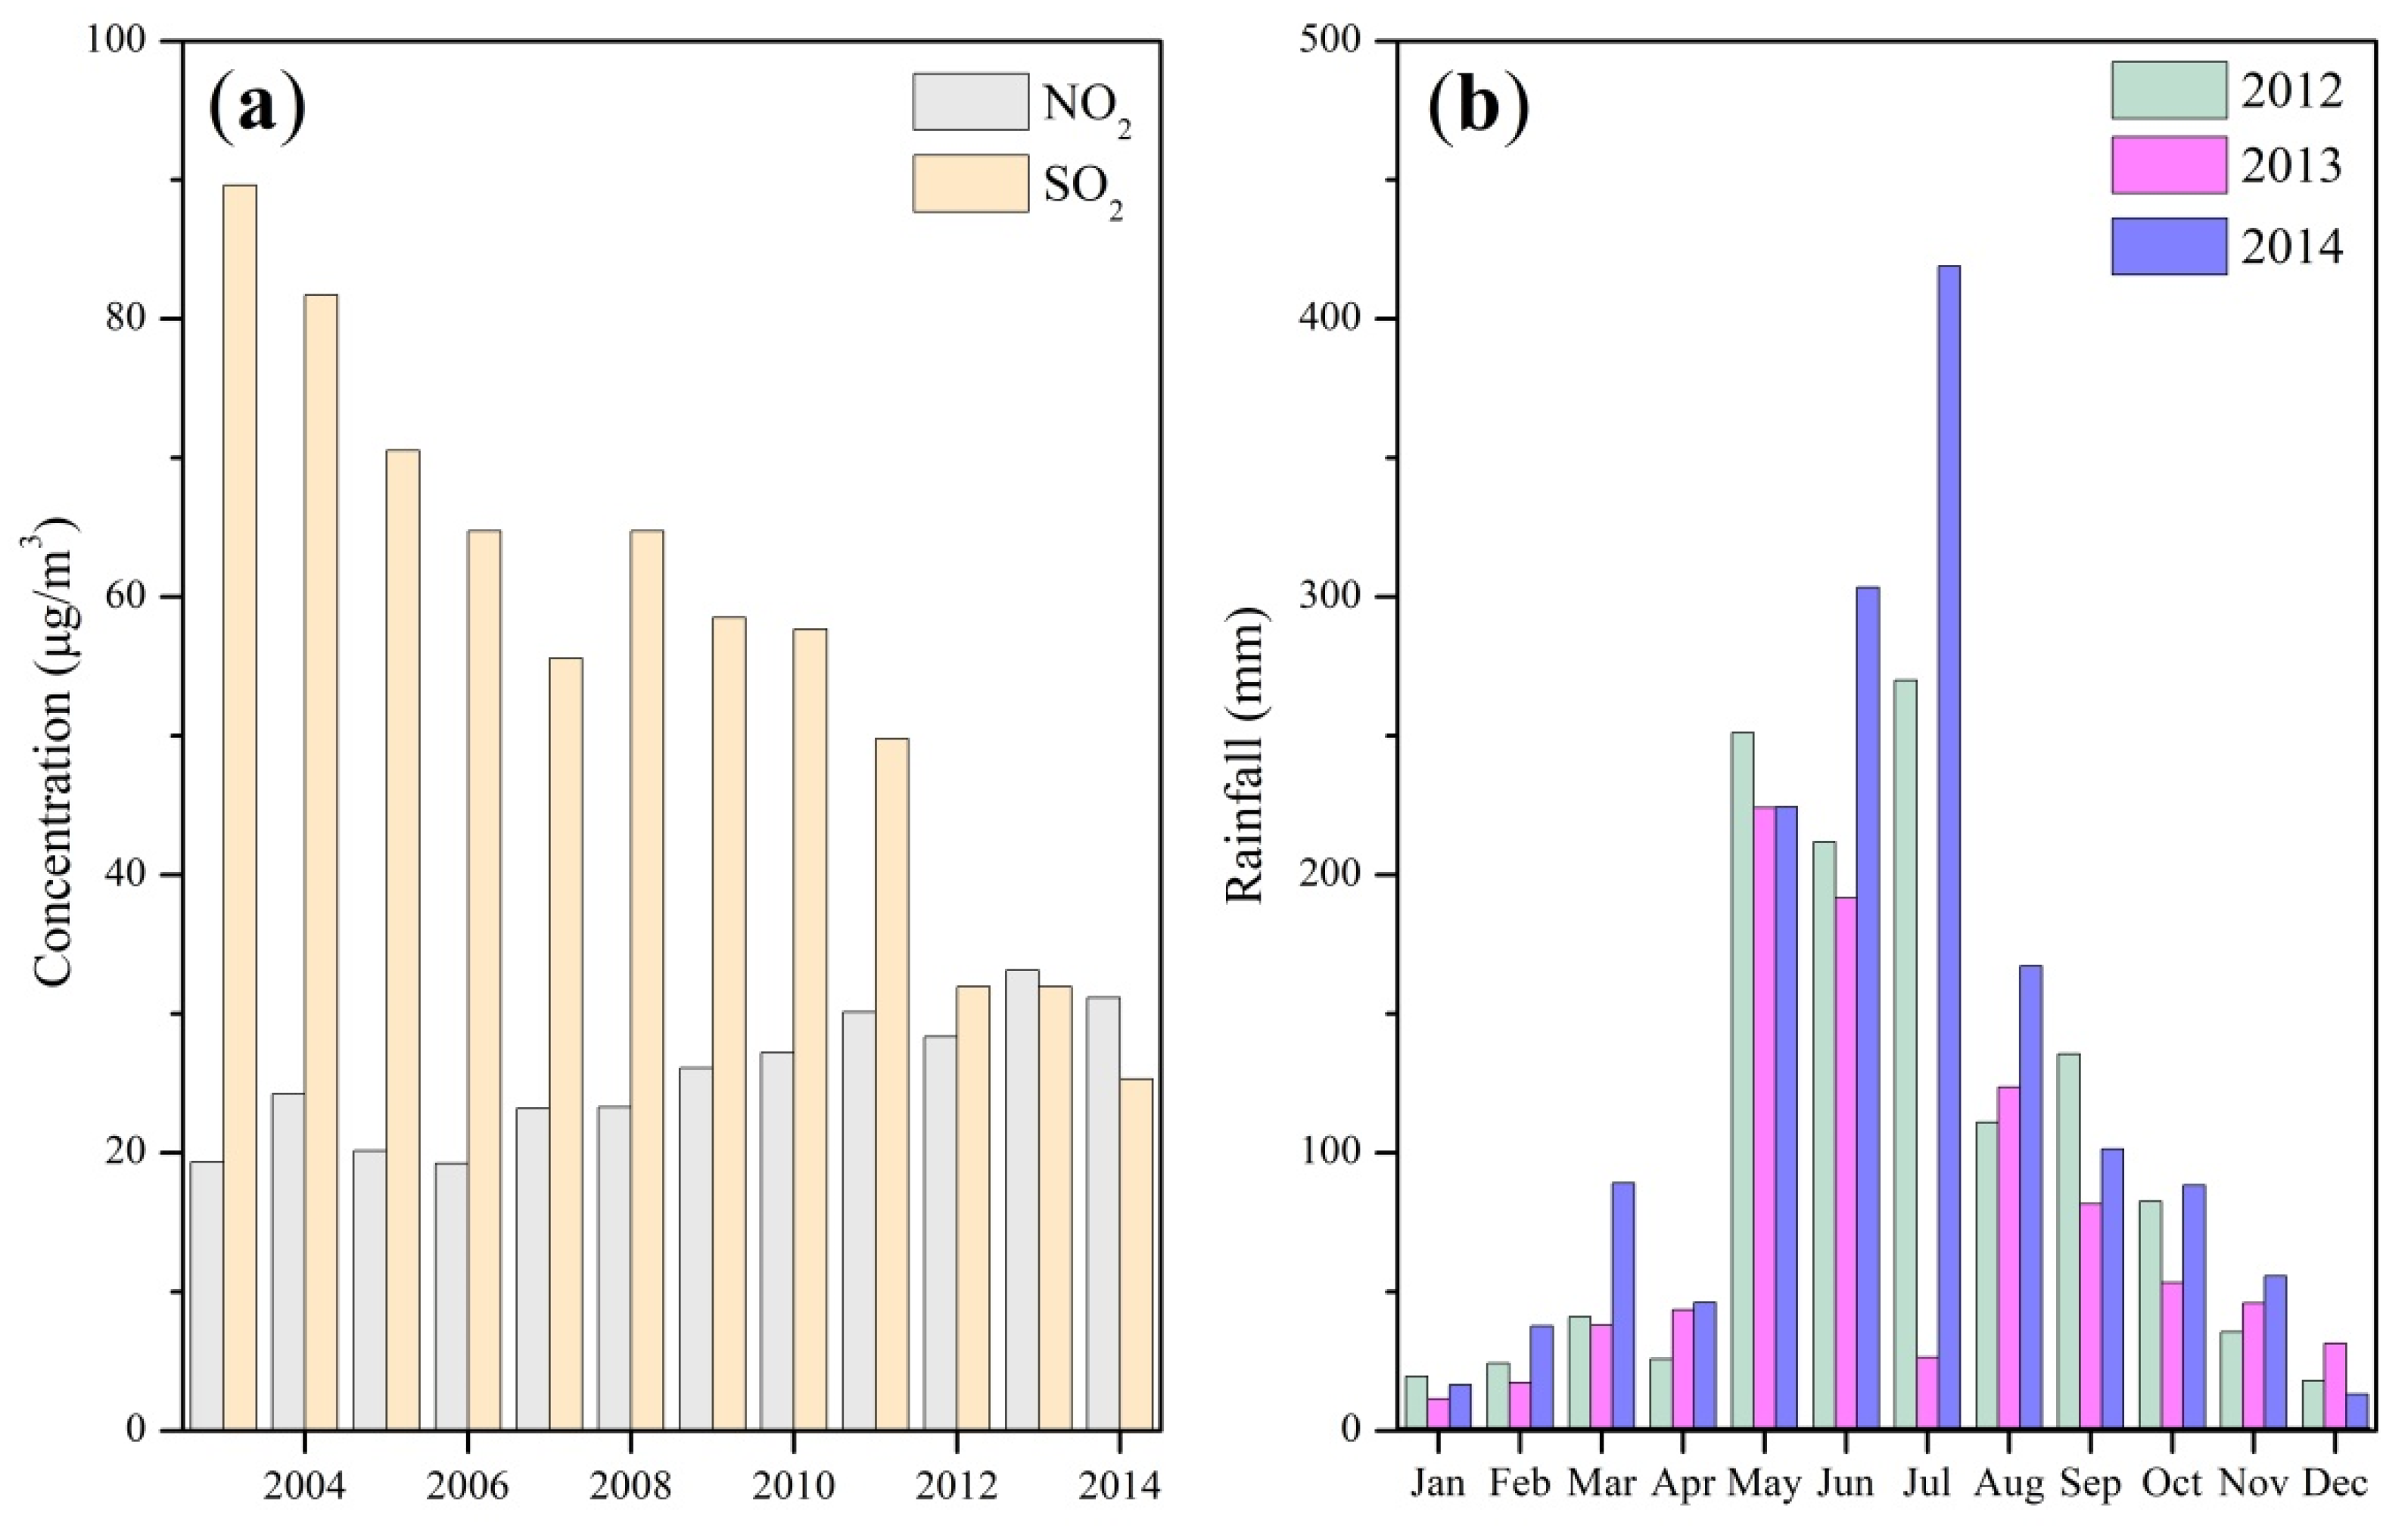
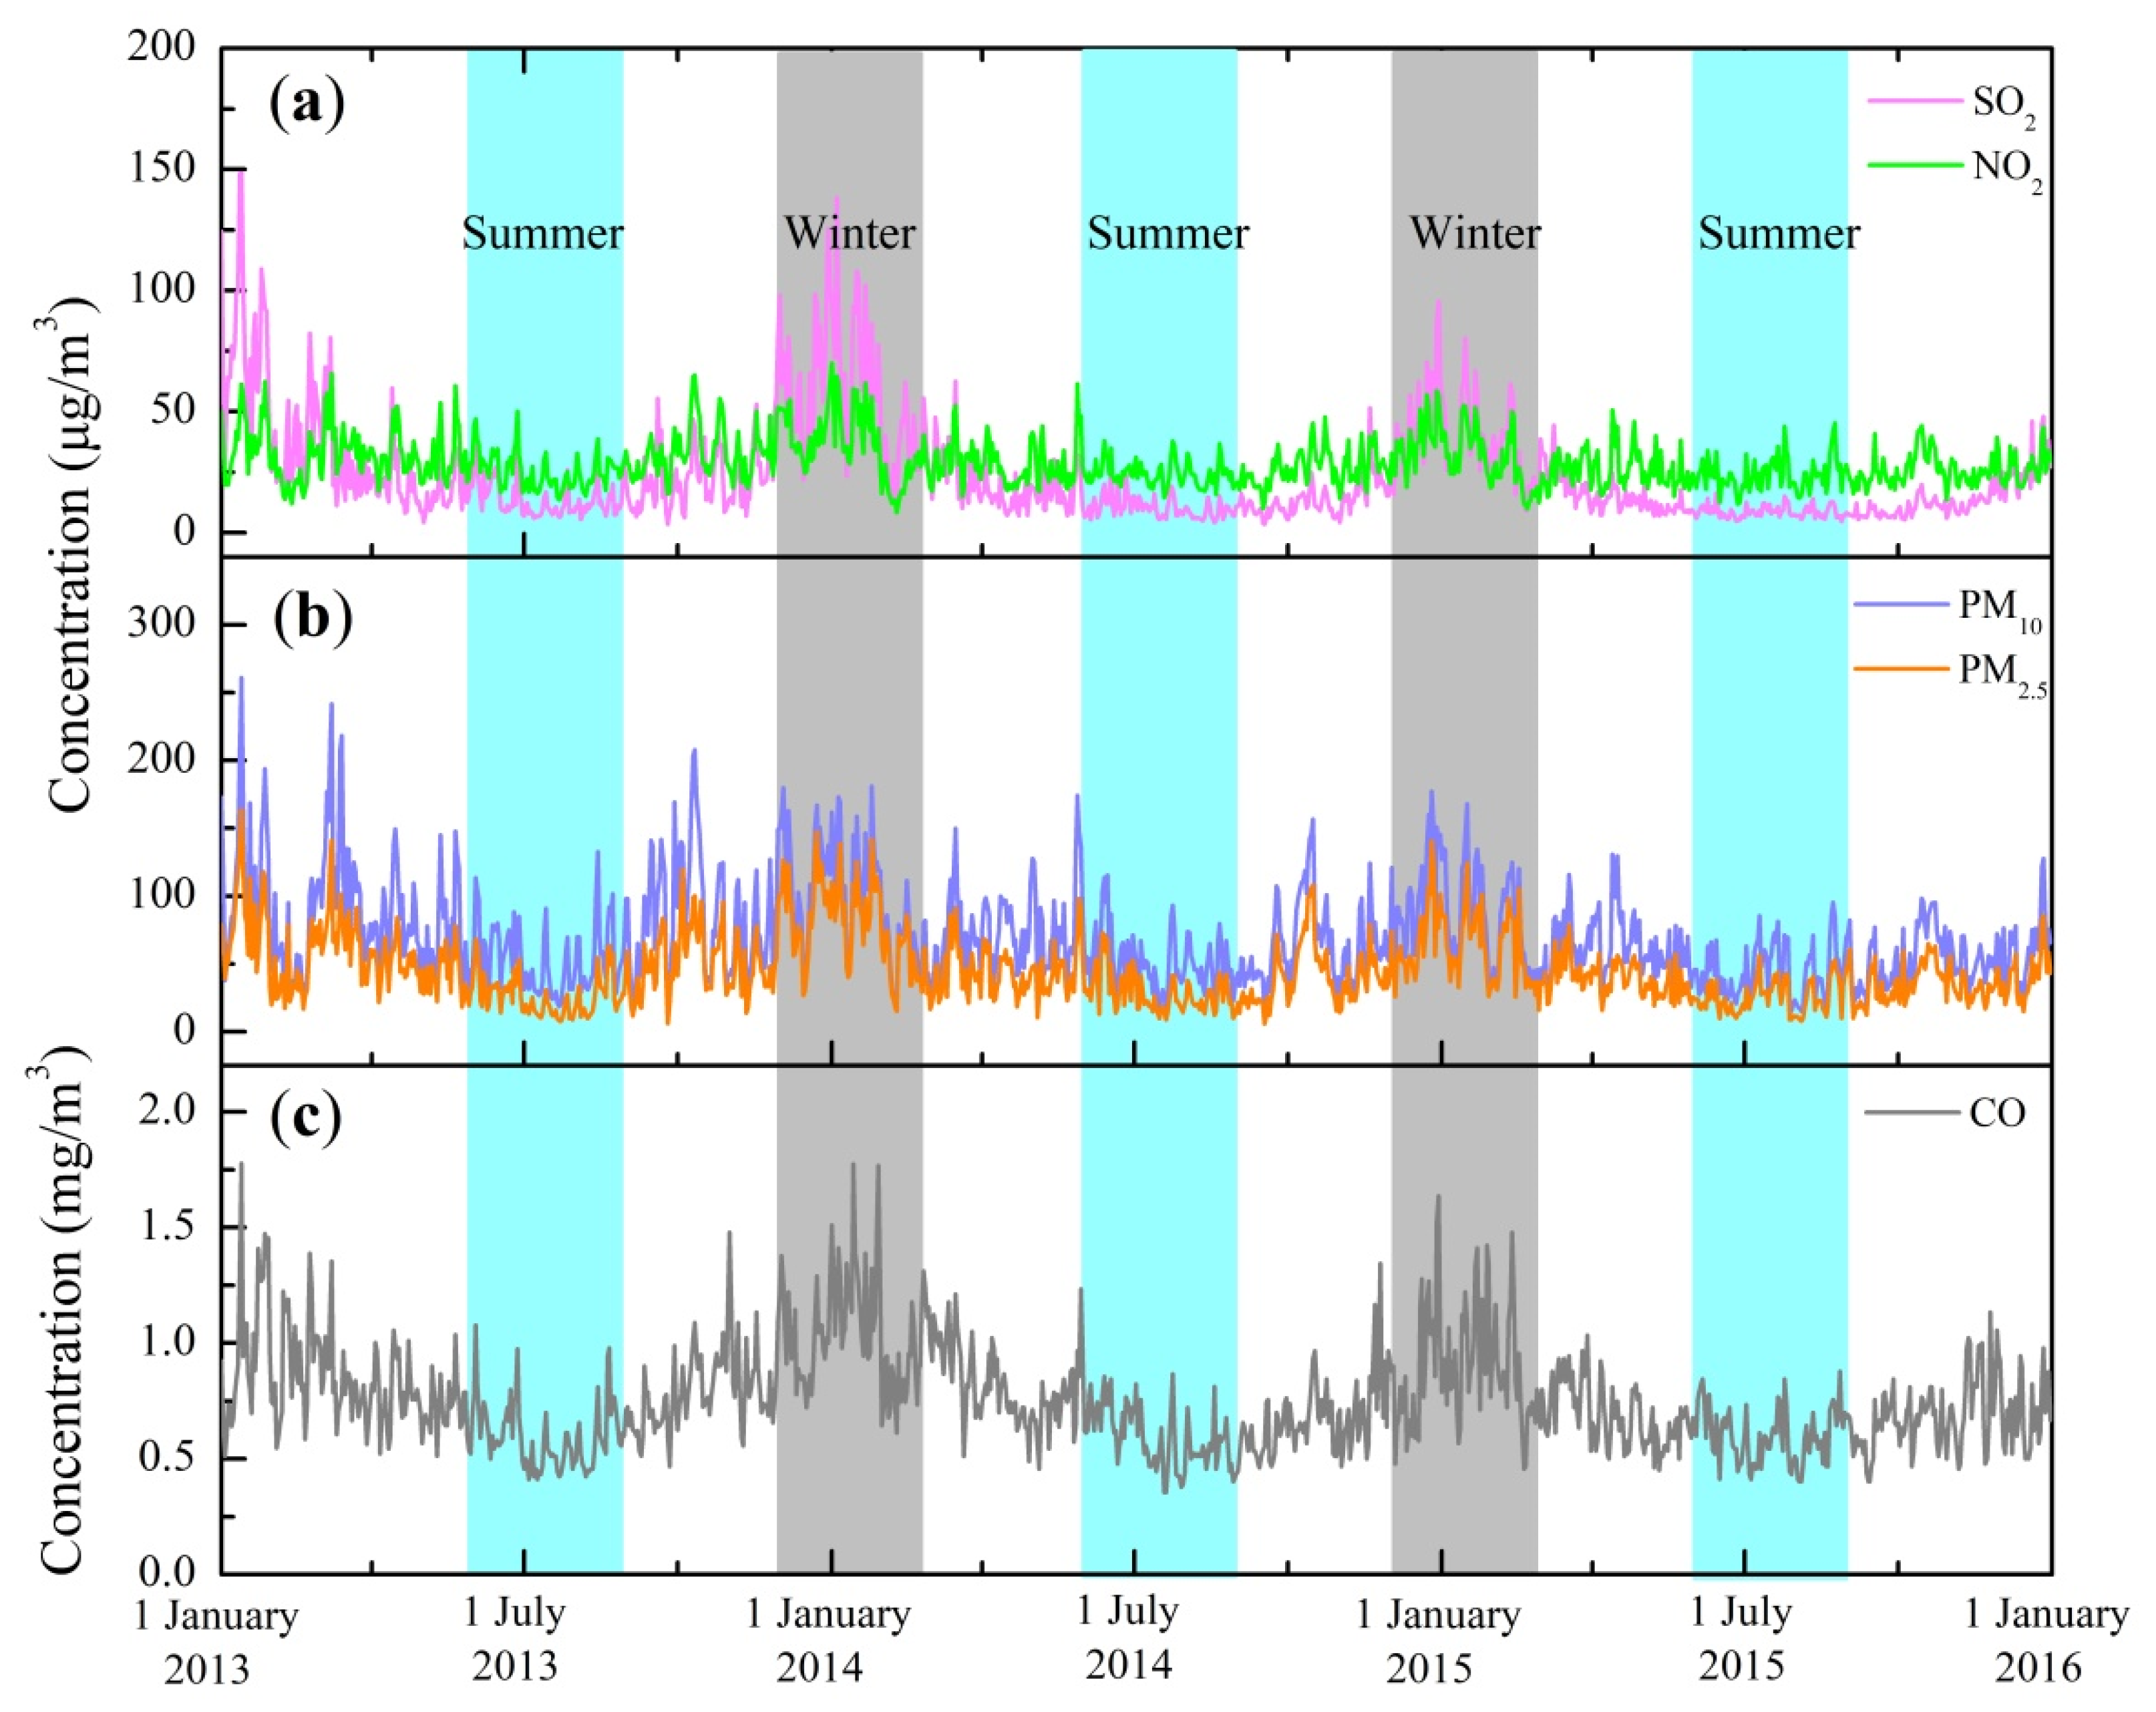
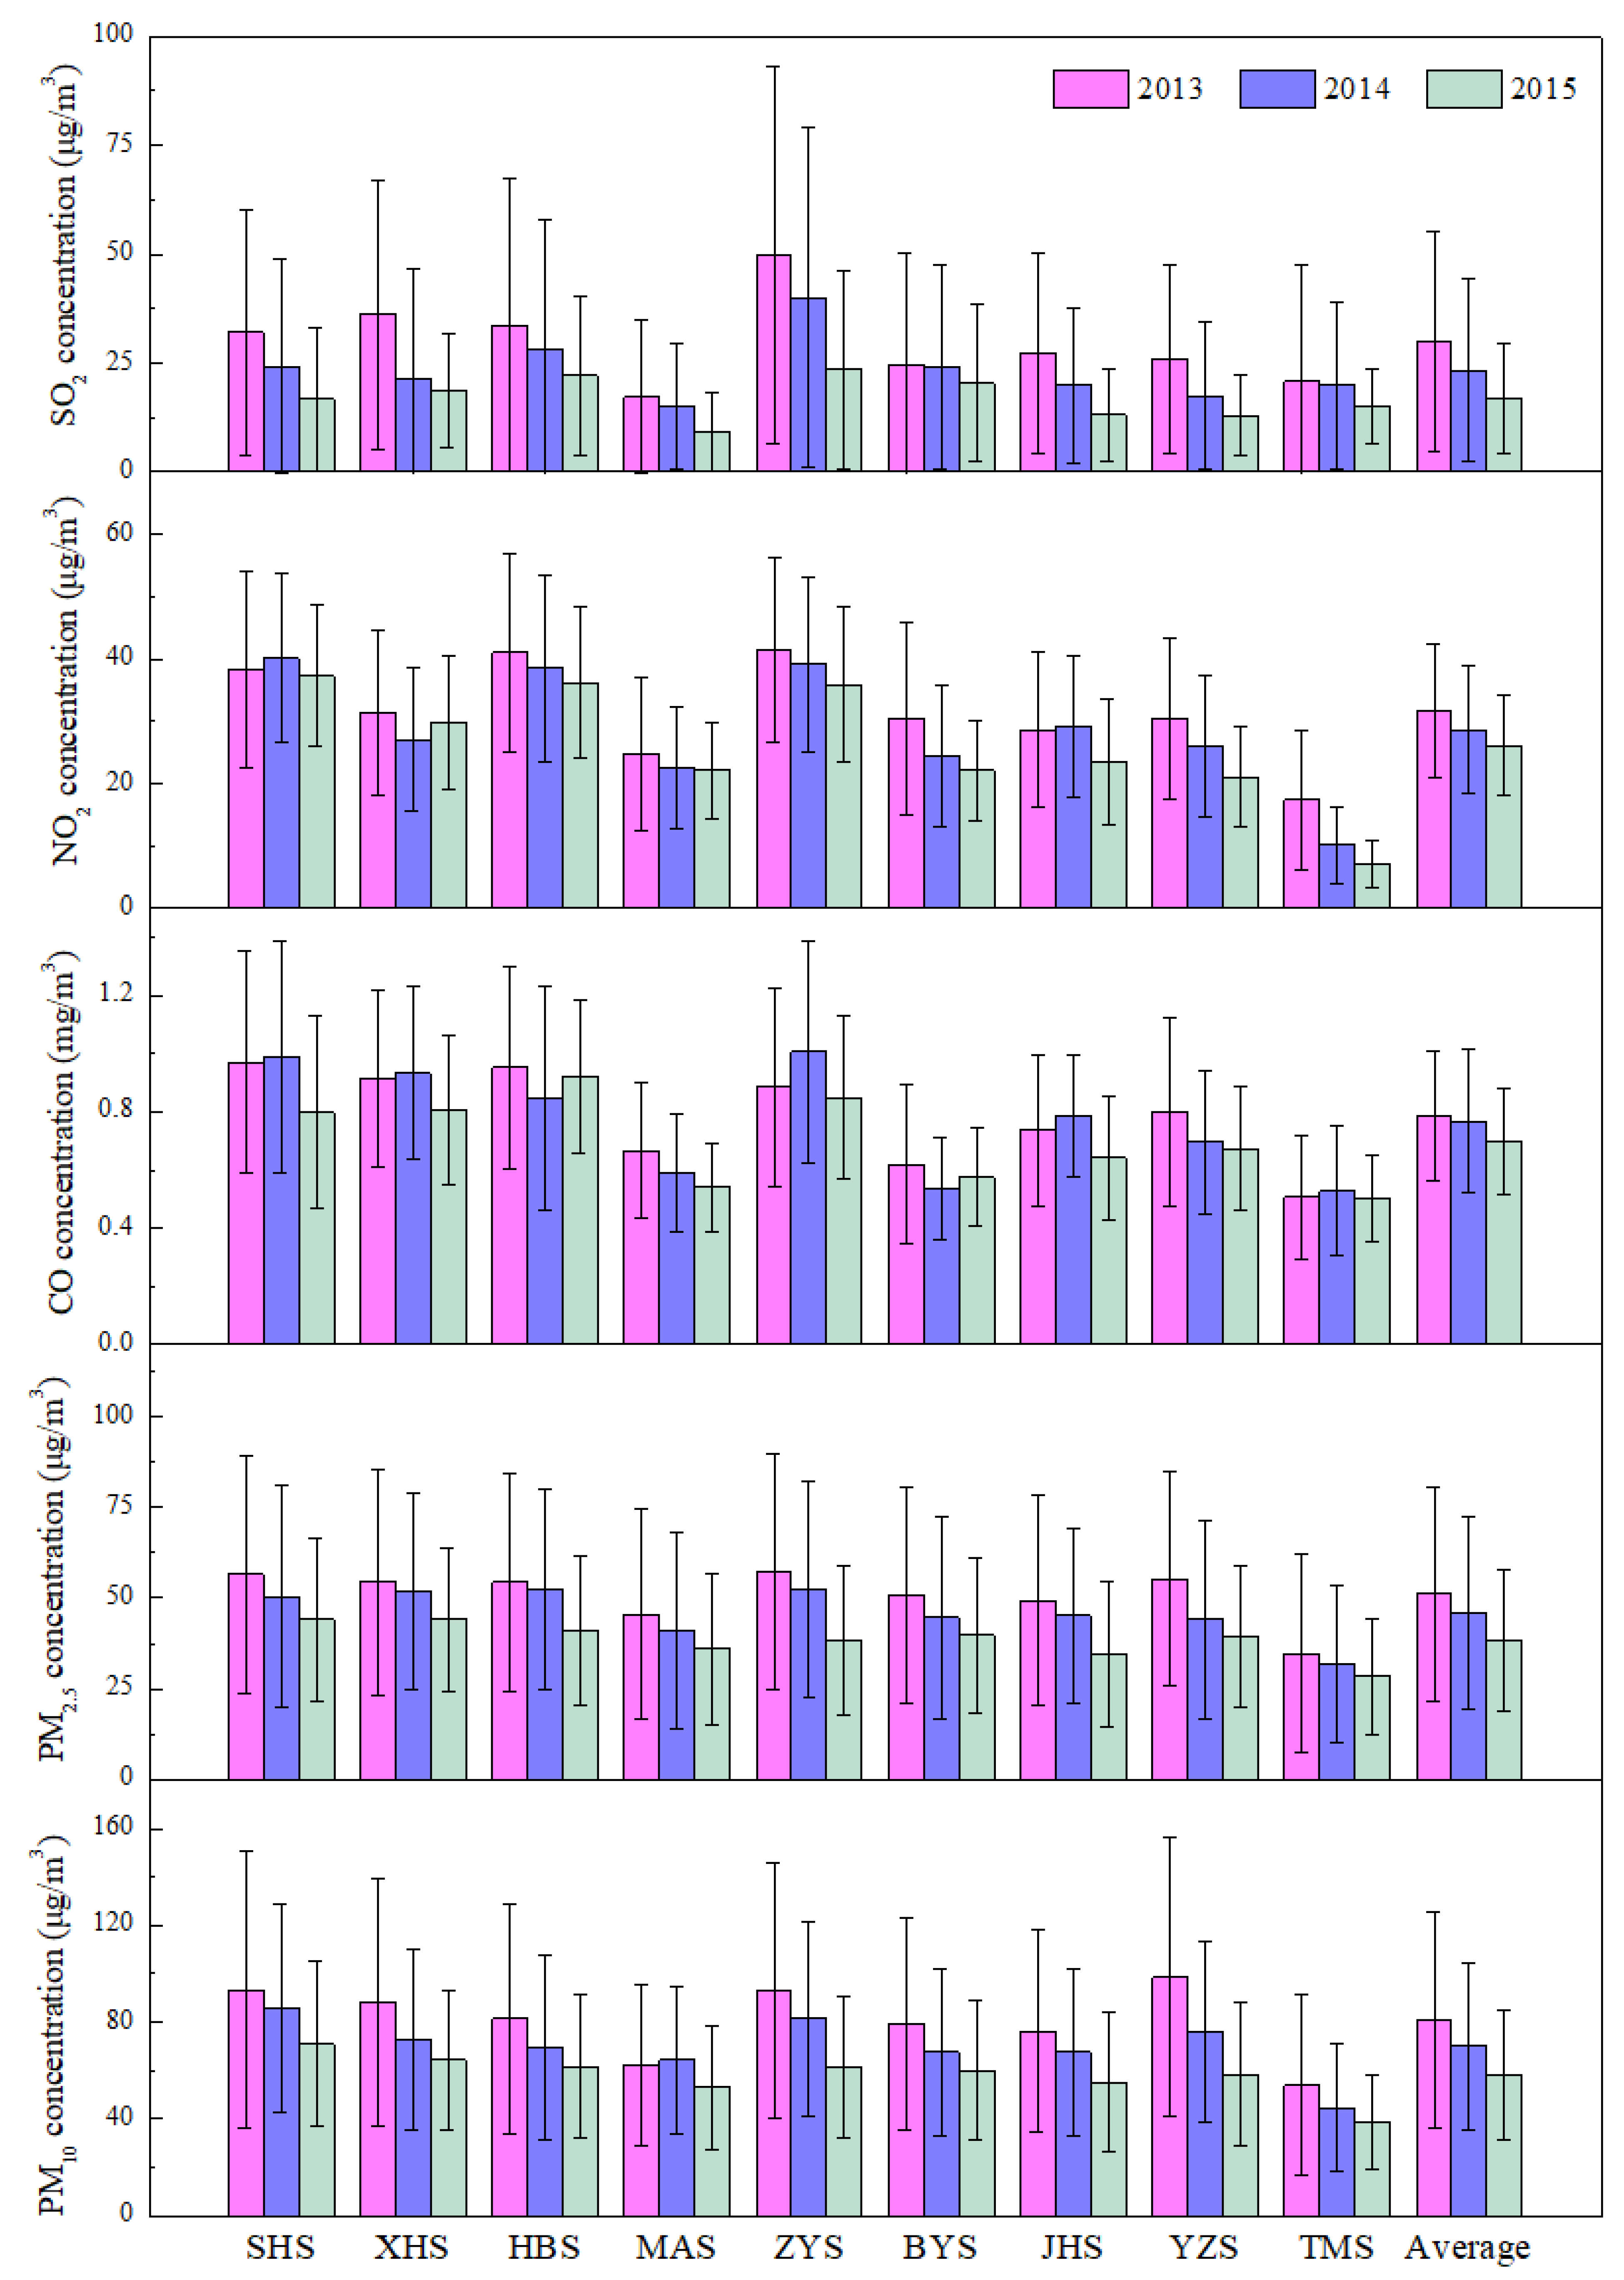
3.1.1. Spatial-Temporal Variations
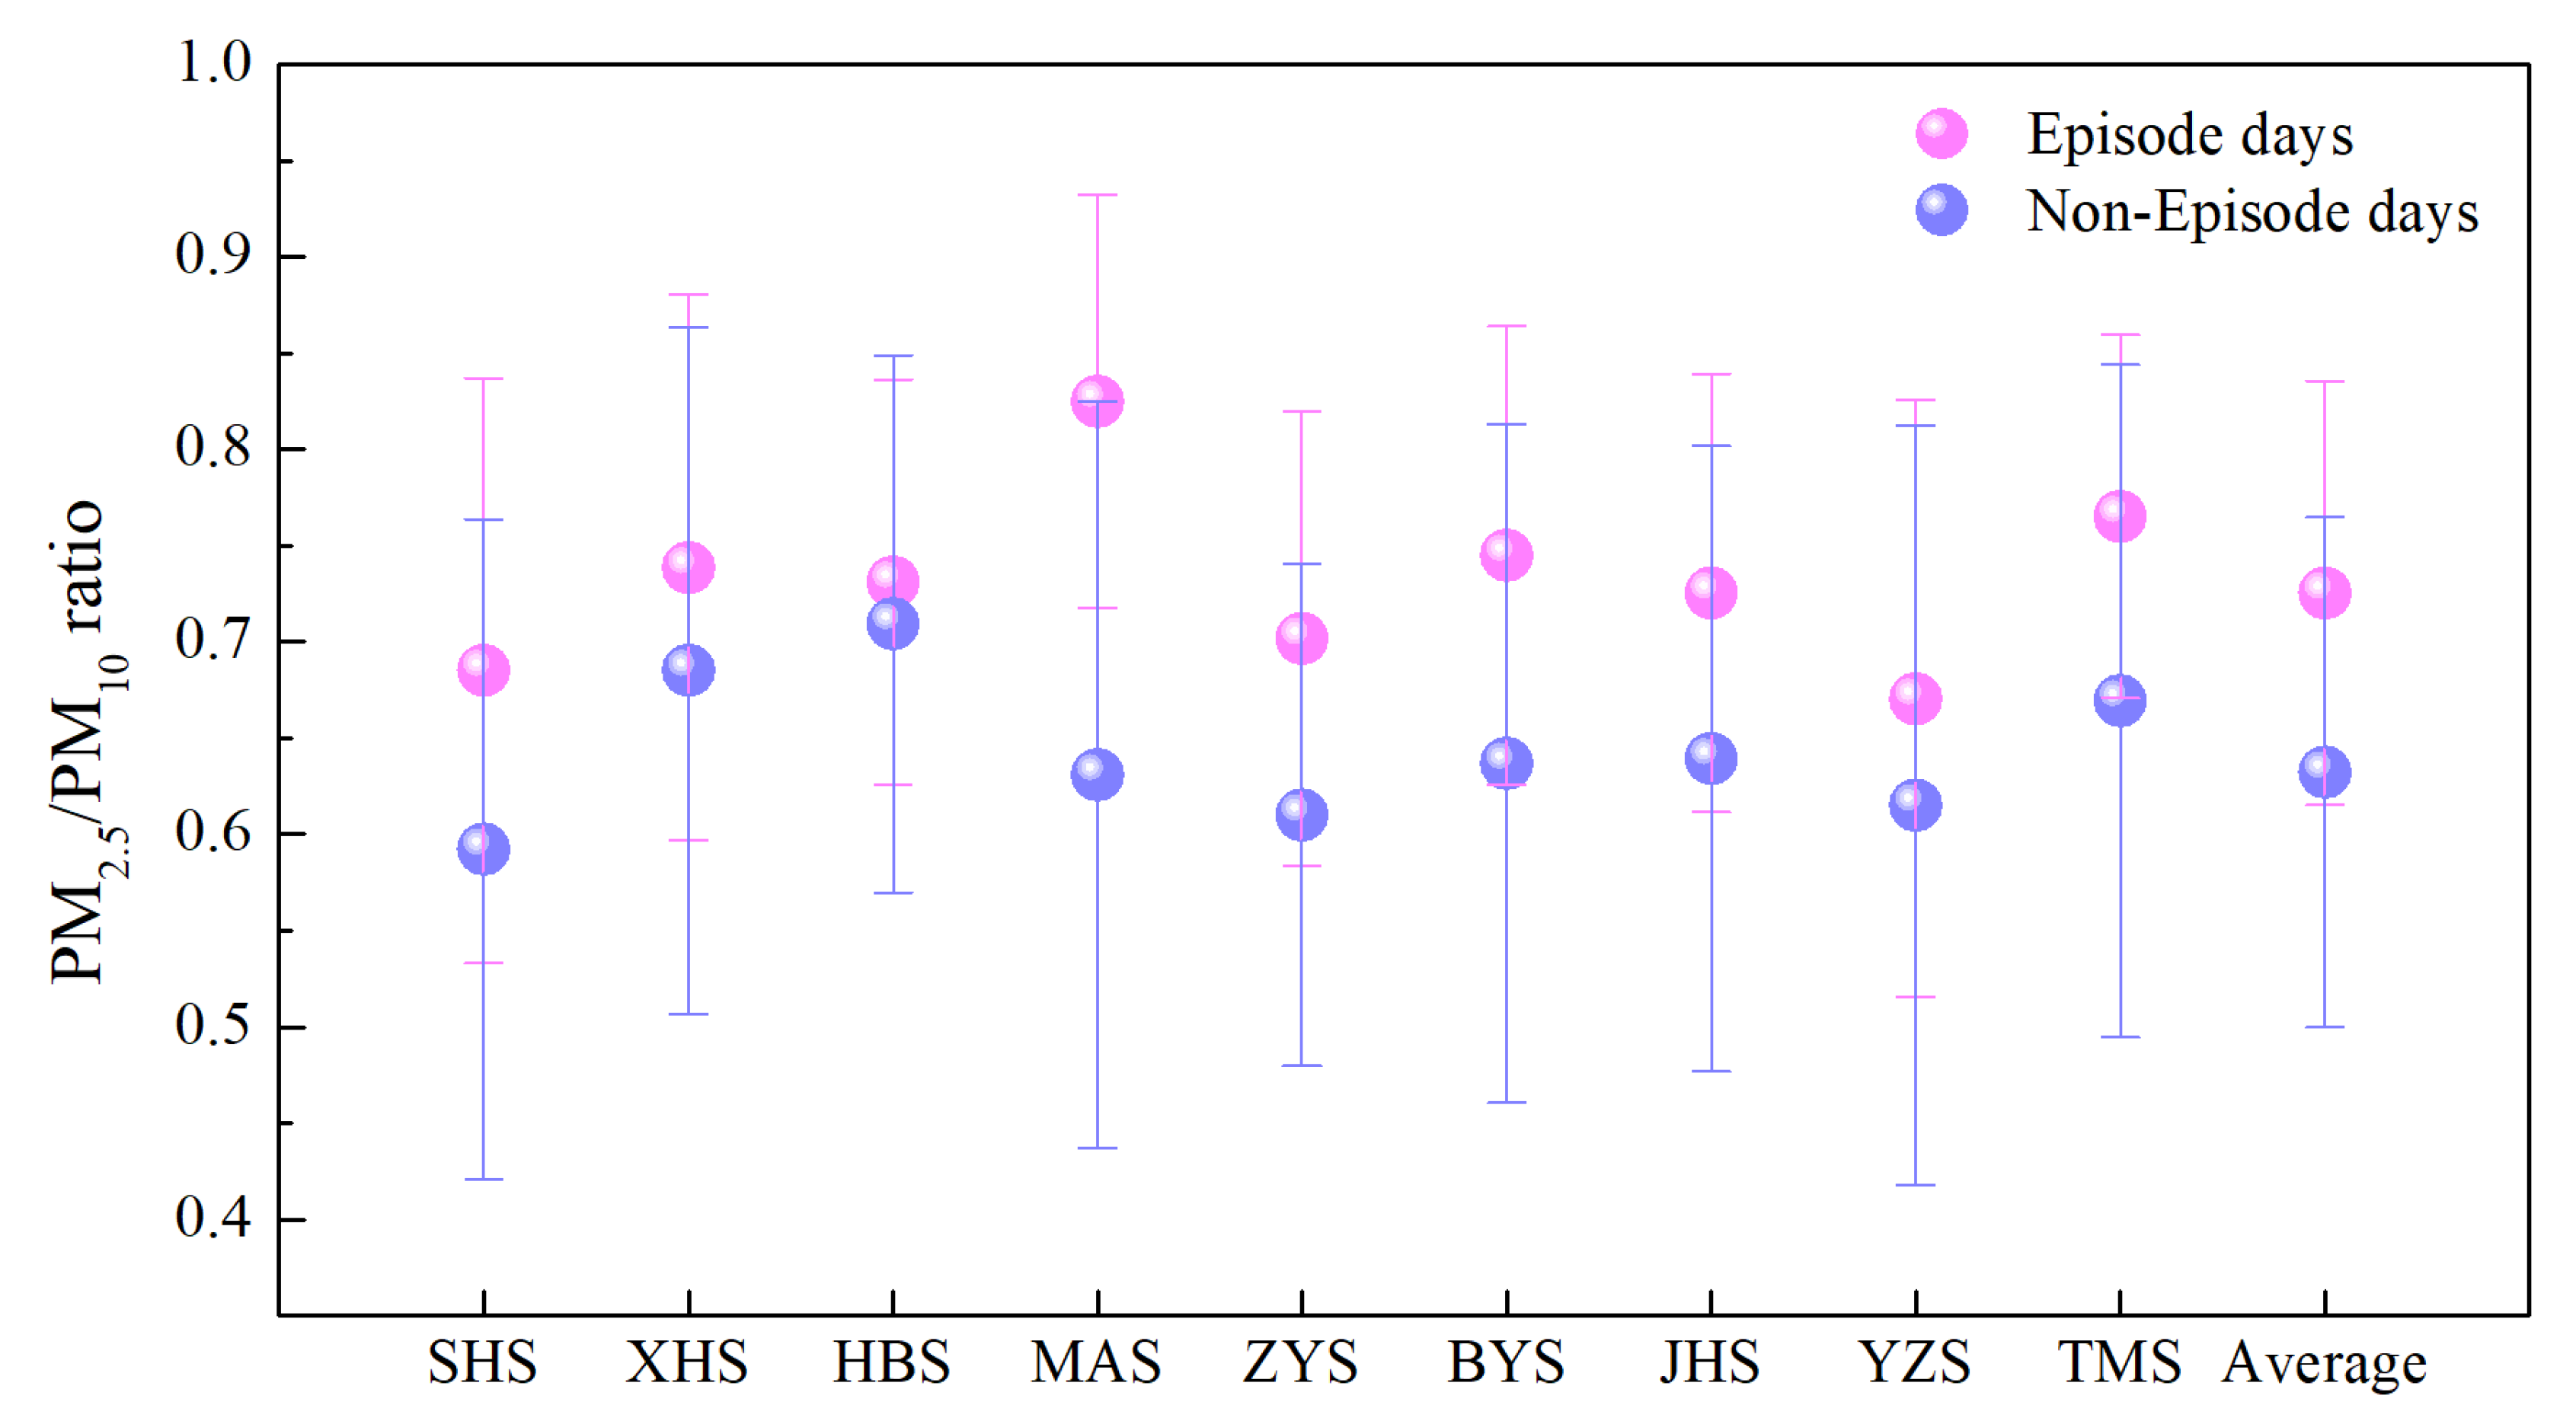
3.1.2. PM2.5/PM10 Ratios in Non- and Episode Days
3.1.3. Correlation among Air Pollutants and Other Meteorological Parameters
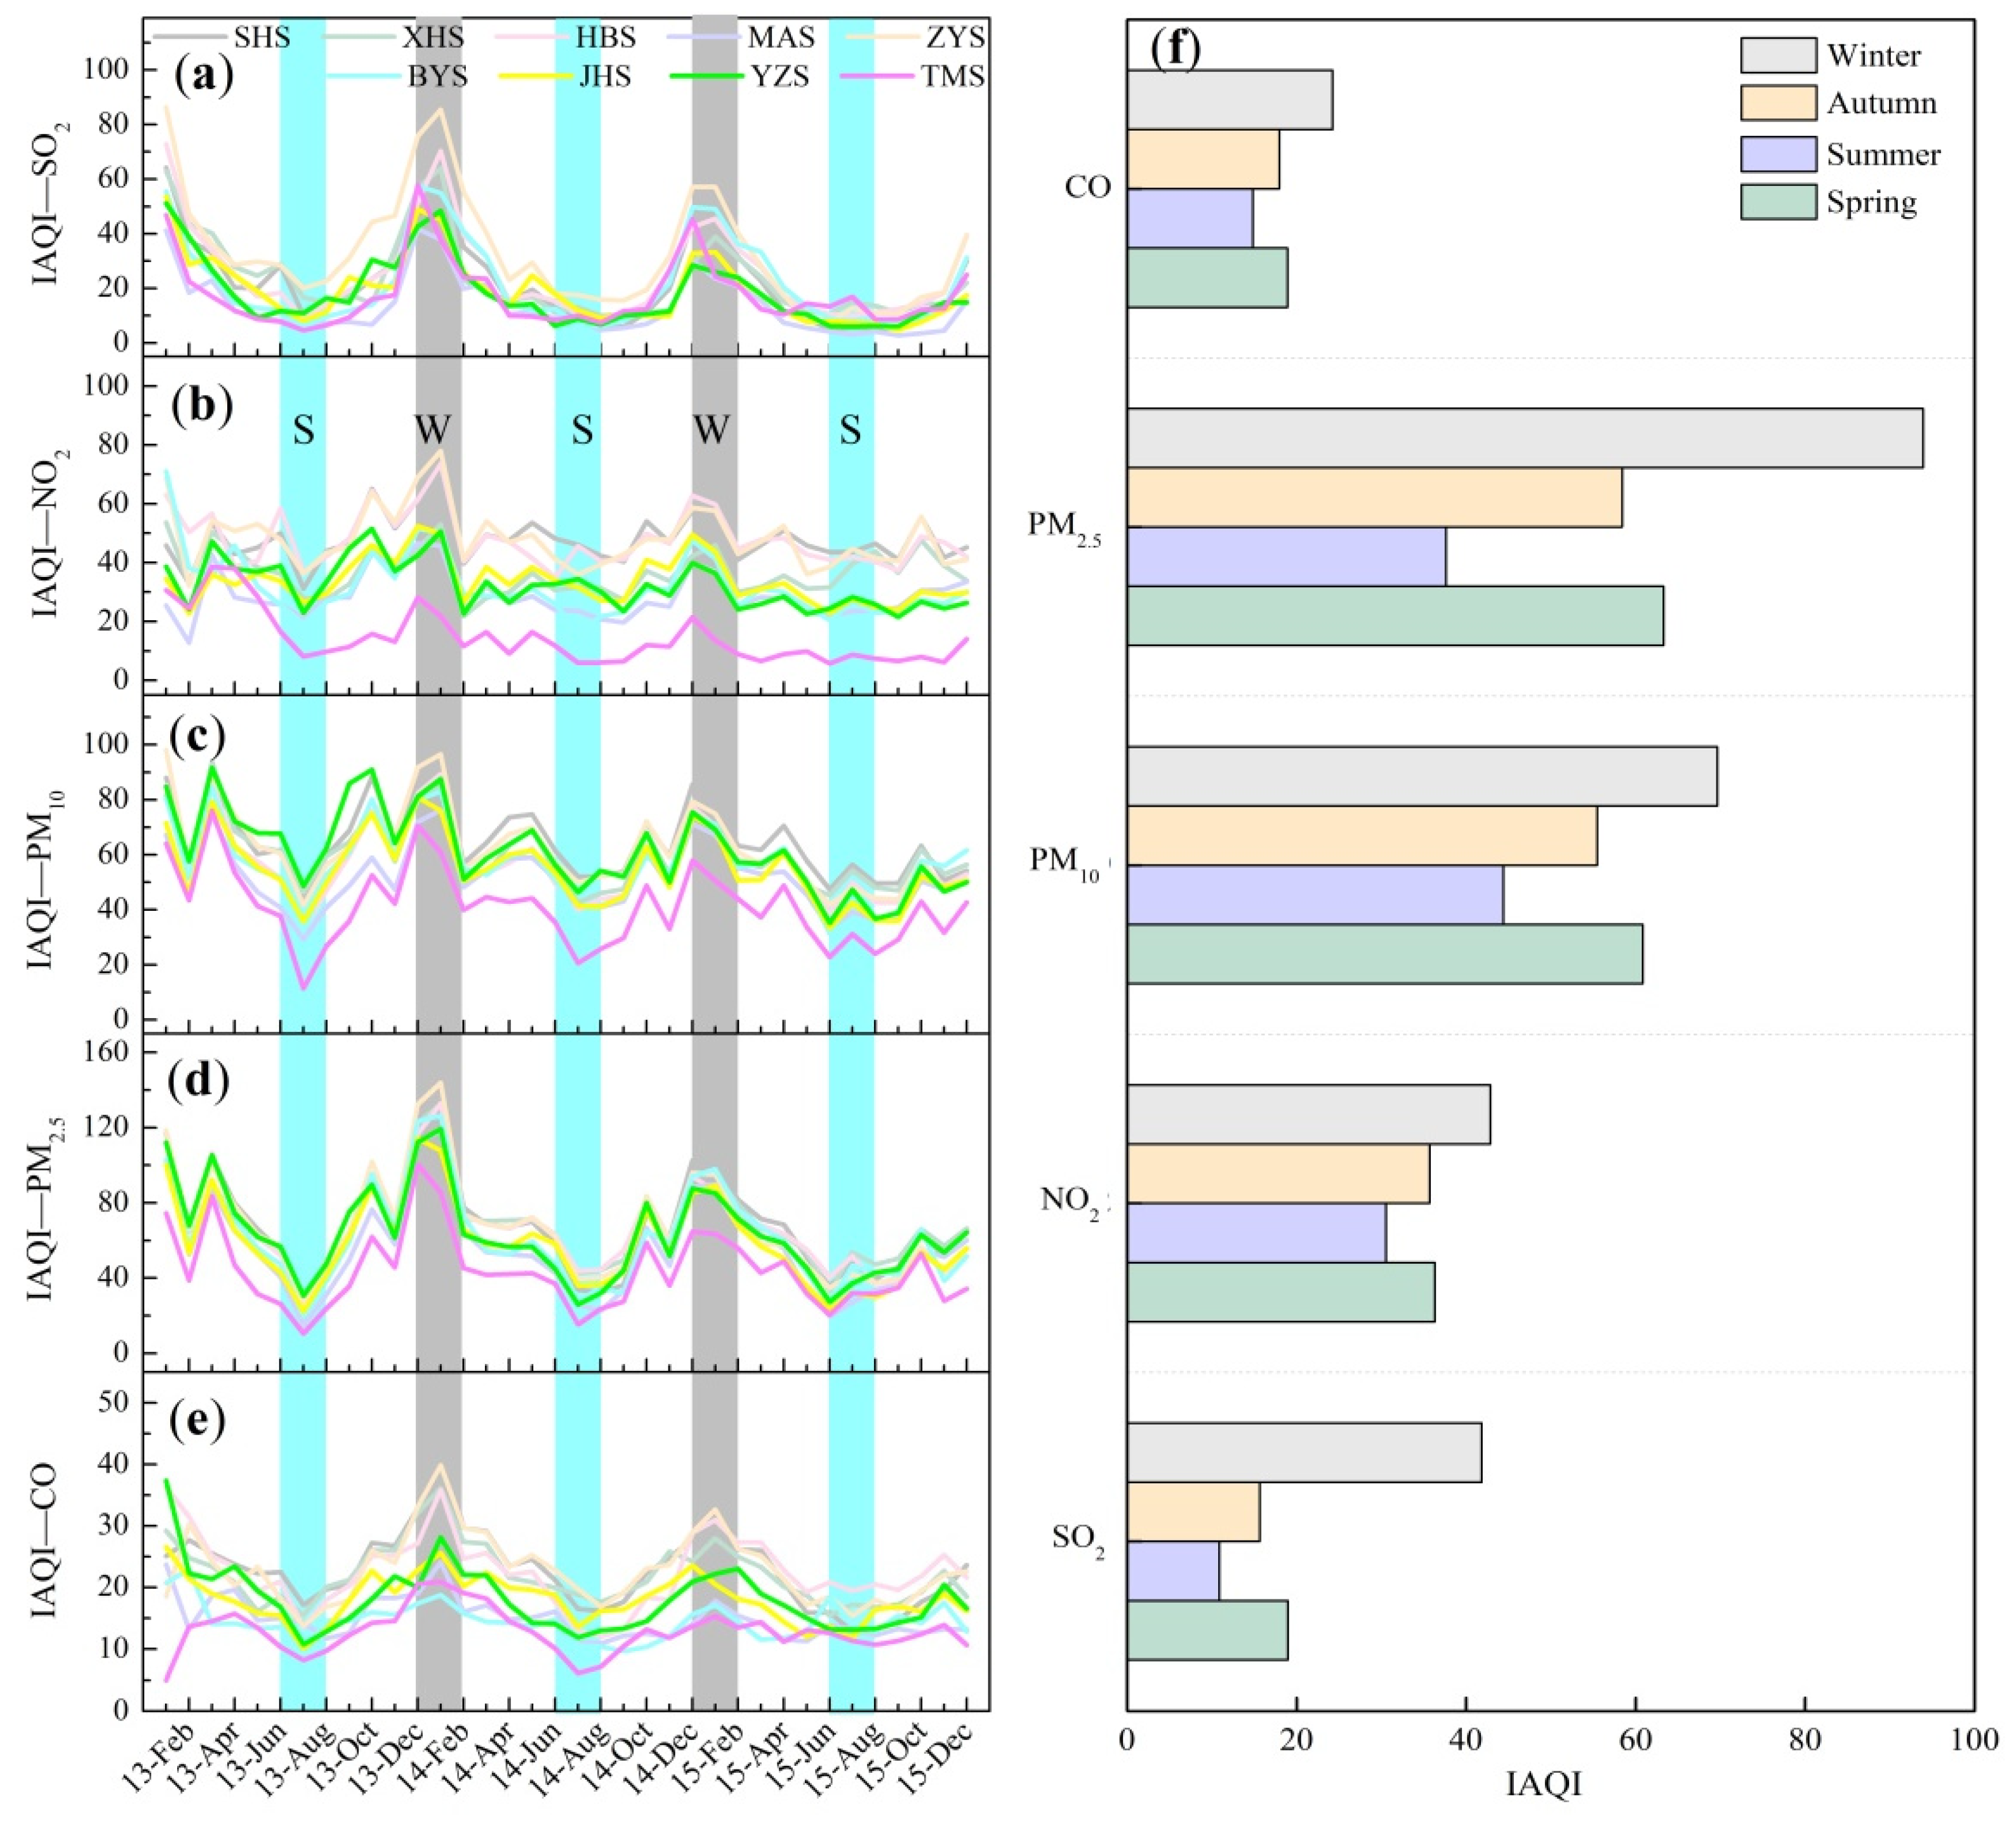
3.2. IAQI-Based Variations of Air Pollutants
3.2.1. Temporal Variations in IAQI
3.2.2. Unique IAQI Variations during the Spring Festival
3.3. Linkage of Air Pollutants and Rainwater Chemistry
3.3.1. Concentration Characteristic of Air Pollutants on Rainy and Non-Rainy Days
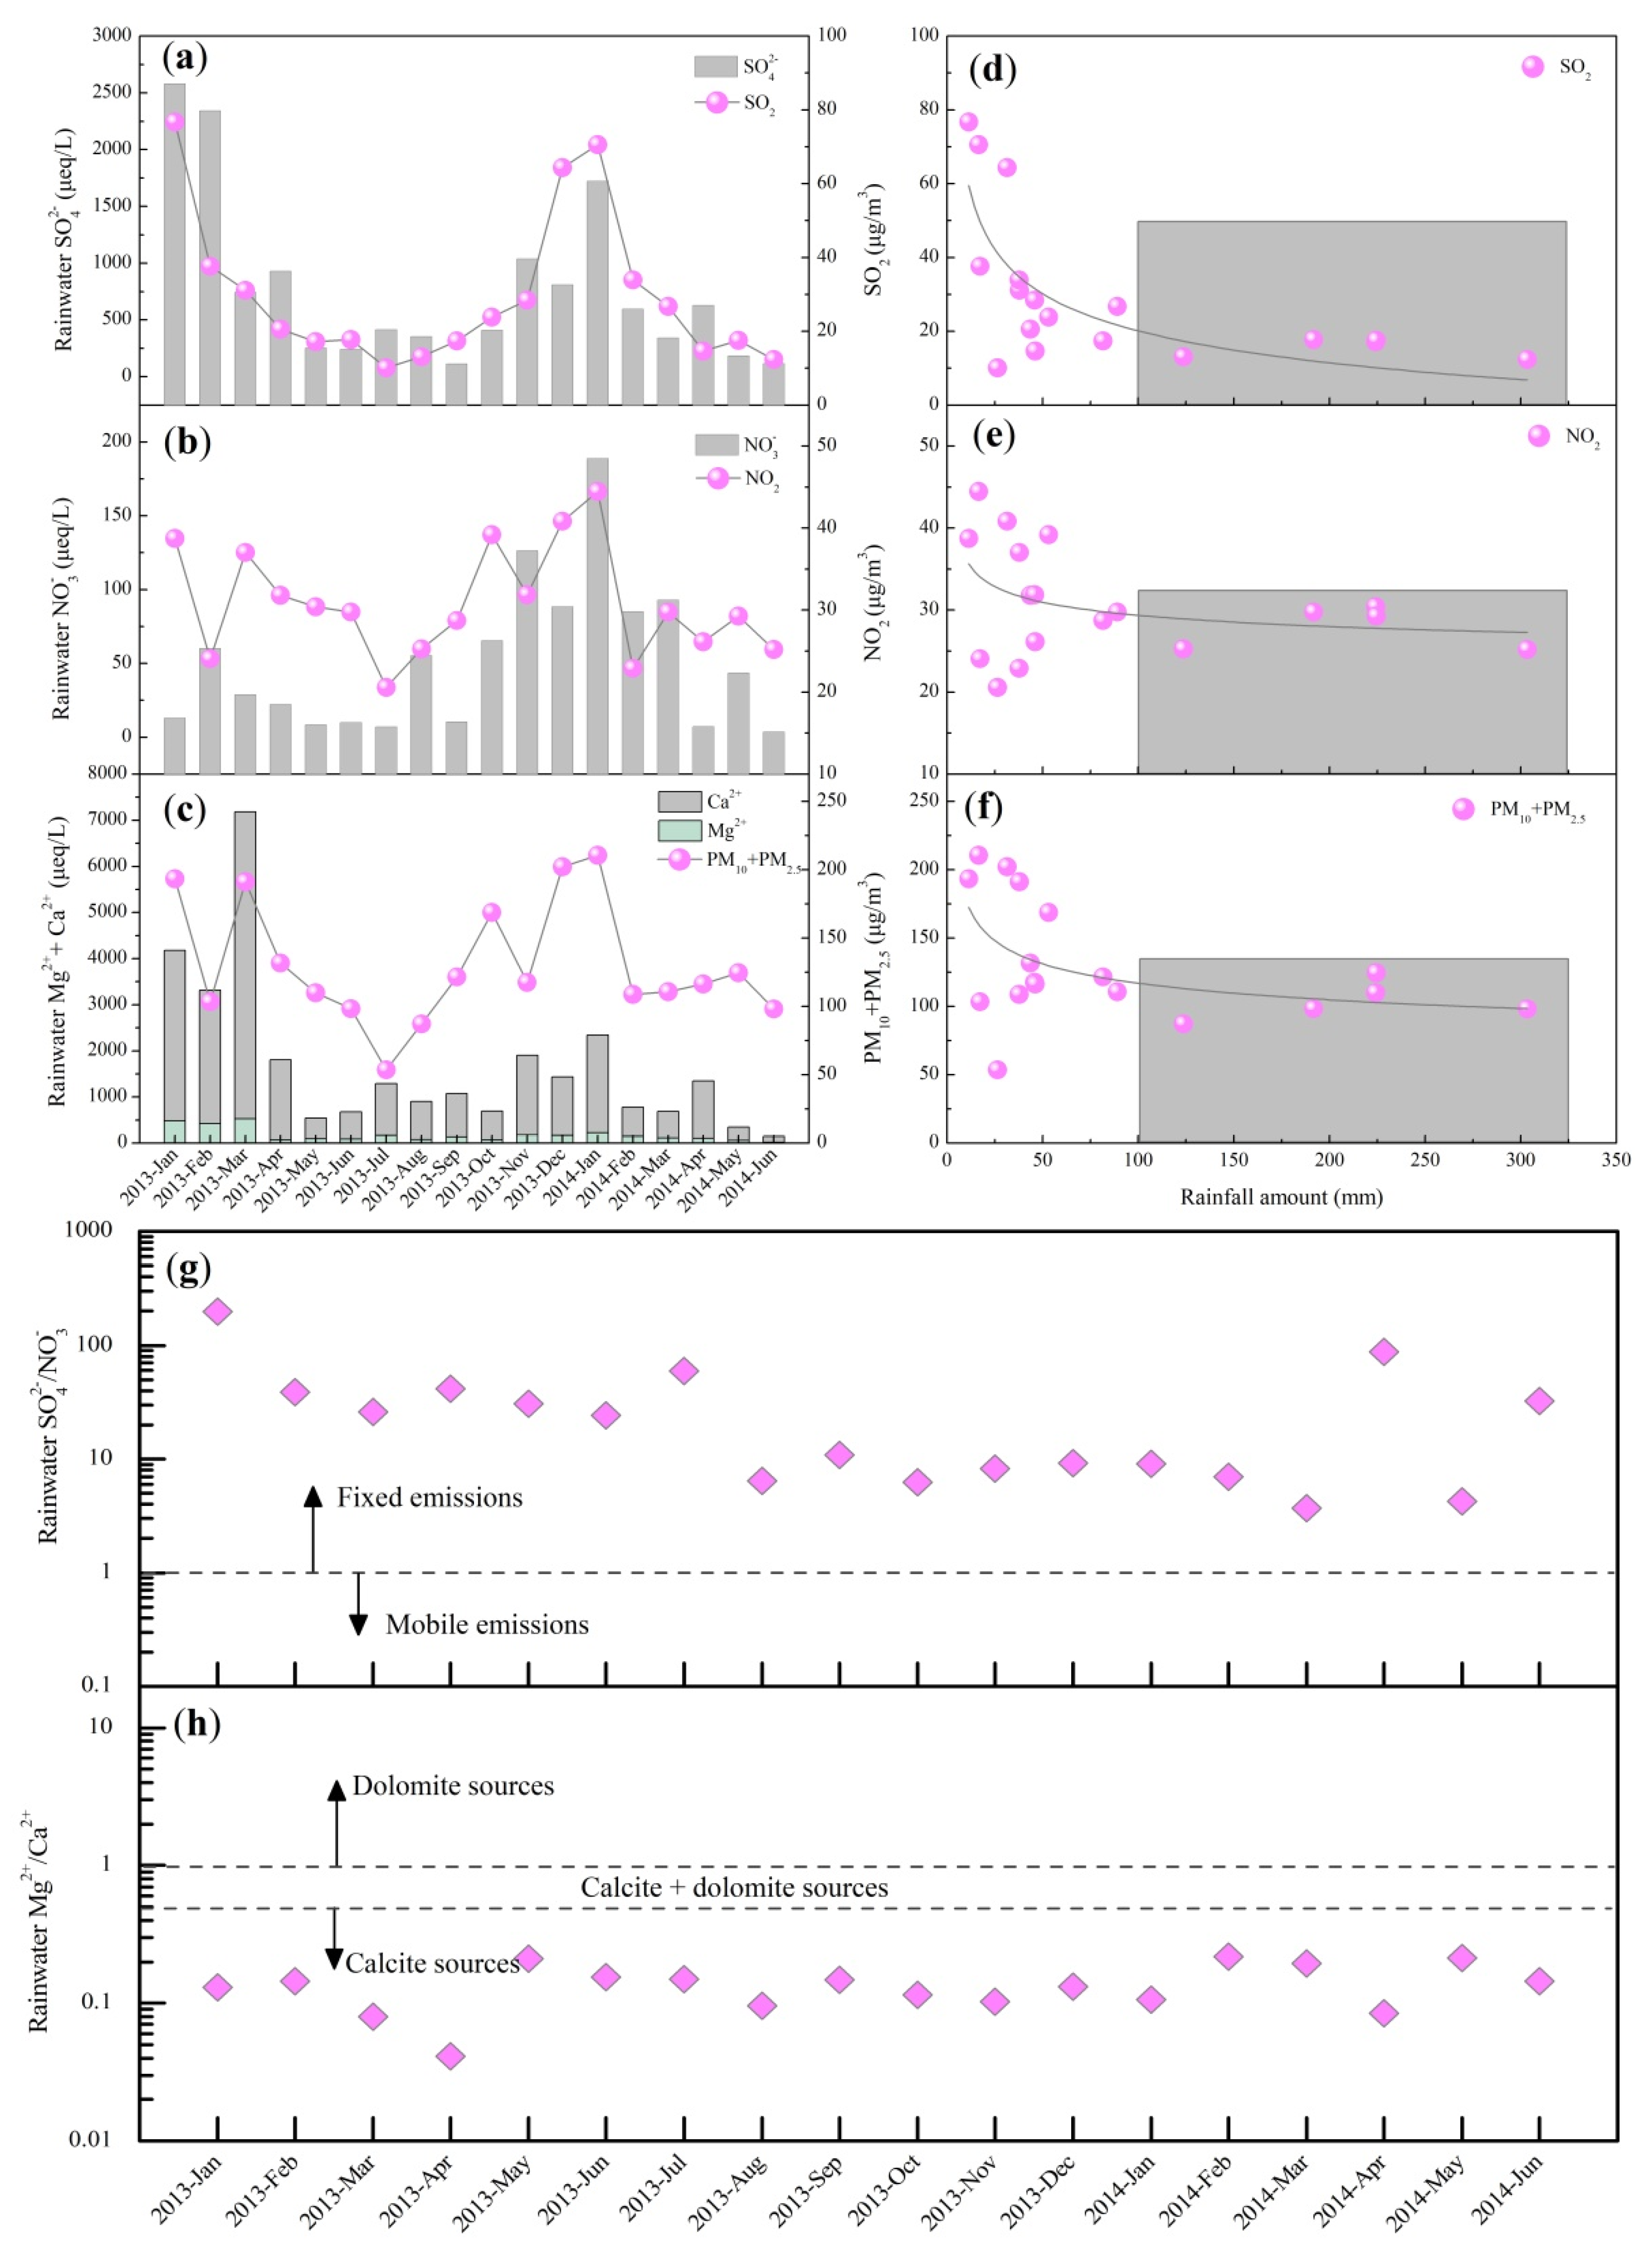
3.3.2. Relationship between Air Pollutants and Rainwater Ions
4. Conclusions
Supplementary Materials
Author Contributions
Funding
Institutional Review Board Statement
Informed Consent Statement
Data Availability Statement
Conflicts of Interest
References
- Wei, J.; Li, Z.; Guo, J.; Sun, L.; Huang, W.; Xue, W.; Fan, T.; Cribb, M. Satellite-Derived 1-km-Resolution PM1 Concentrations from 2014 to 2018 across China. Environ. Sci. Technol. 2019, 53, 13265–13274. [Google Scholar] [CrossRef]
- Chen, Z.; Wang, J.N.; Ma, G.X.; Zhang, Y.S. China tackles the health effects of air pollution. Lancet 2013, 382, 1959–1960. [Google Scholar] [CrossRef]
- Wang, Y.; Ying, Q.; Hu, J.; Zhang, H. Spatial and temporal variations of six criteria air pollutants in 31 provincial capital cities in China during 2013–2014. Environ. Int. 2014, 73, 413–422. [Google Scholar] [CrossRef] [PubMed]
- Hu, J.; Ying, Q.; Wang, Y.; Zhang, H. Characterizing multi-pollutant air pollution in China: Comparison of three air quality indices. Environ. Int. 2015, 84, 17–25. [Google Scholar] [CrossRef] [PubMed]
- Galloway, J.N. Acid deposition: Perspectives in time and space. Water Air Soil Pollut. 1995, 85, 15–24. [Google Scholar] [CrossRef]
- Zeng, J.; Yue, F.-J.; Li, S.-L.; Wang, Z.-J.; Wu, Q.; Qin, C.-Q.; Yan, Z.-L. Determining rainwater chemistry to reveal alkaline rain trend in Southwest China: Evidence from a frequent-rainy karst area with extensive agricultural production. Environ. Pollut. 2020, 266, 115166. [Google Scholar] [CrossRef]
- Han, G.; Song, Z.; Tang, Y.; Wu, Q.; Wang, Z. Ca and Sr isotope compositions of rainwater from Guiyang city, Southwest China: Implication for the sources of atmospheric aerosols and their seasonal variations. Atmos. Environ. 2019, 214, 116854. [Google Scholar] [CrossRef]
- Wu, Q.; Han, G.; Tao, F.; Tang, Y. Chemical composition of rainwater in a karstic agricultural area, Southwest China: The impact of urbanization. Atmos. Res. 2012, 111, 71–78. [Google Scholar] [CrossRef]
- Gurjar, B.R.; Butler, T.M.; Lawrence, M.G.; Lelieveld, J. Evaluation of emissions and air quality in megacities. Atmos. Environ. 2008, 42, 1593–1606. [Google Scholar] [CrossRef]
- Xu, Y.; Ying, Q.; Hu, J.; Gao, Y.; Yang, Y.; Wang, D.; Zhang, H. Spatial and temporal variations in criteria air pollutants in three typical terrain regions in Shaanxi, China, during 2015. Air Qual. Atmos. Health 2018, 11, 95–109. [Google Scholar] [CrossRef]
- Wen, Z.; Xu, W.; Li, Q.; Han, M.; Tang, A.; Zhang, Y.; Luo, X.; Shen, J.; Wang, W.; Li, K.; et al. Changes of nitrogen deposition in China from 1980 to 2018. Environ. Int. 2020, 144, 106022. [Google Scholar] [CrossRef]
- Yu, G.; Jia, Y.; He, N.; Zhu, J.; Chen, Z.; Wang, Q.; Piao, S.; Liu, X.; He, H.; Guo, X.; et al. Stabilization of atmospheric nitrogen deposition in China over the past decade. Nat. Geosci. 2019, 12, 424–429. [Google Scholar] [CrossRef]
- Wei, J.; Li, Z.; Cribb, M.; Huang, W.; Xue, W.; Sun, L.; Guo, J.; Peng, Y.; Li, J.; Lyapustin, A.; et al. Improved 1 km resolution PM2.5 estimates across China using enhanced space–time extremely randomized trees. Atmos. Chem. Phys. 2020, 20, 3273–3289. [Google Scholar] [CrossRef] [Green Version]
- Chai, F.; Gao, J.; Chen, Z.; Wang, S.; Zhang, Y.; Zhang, J.; Zhang, H.; Yun, Y.; Ren, C. Spatial and temporal variation of particulate matter and gaseous pollutants in 26 cities in China. J. Environ. Sci. 2014, 26, 75–82. [Google Scholar] [CrossRef]
- Hu, J.; Wang, Y.; Ying, Q.; Zhang, H. Spatial and temporal variability of PM2.5 and PM10 over the North China Plain and the Yangtze River Delta, China. Atmos. Environ. 2014, 95, 598–609. [Google Scholar] [CrossRef]
- Han, G.; Tang, Y.; Liu, M.; Van Zwieten, L.; Yang, X.; Yu, C.; Wang, H.; Song, Z. Carbon-nitrogen isotope coupling of soil organic matter in a karst region under land use change, Southwest China. Agric. Ecosyst. Environ. 2020, 301, 107027. [Google Scholar] [CrossRef]
- Liu, M.; Han, G.; Zhang, Q. Effects of agricultural abandonment on soil aggregation, soil organic carbon storage and stabilization: Results from observation in a small karst catchment, Southwest China. Agric. Ecosyst. Environ. 2020, 288, 106719. [Google Scholar] [CrossRef]
- Baker, K.; Scheff, P. Photochemical model performance for PM2.5 sulfate, nitrate, ammonium, and precursor species SO2, HNO3, and NH3 at background monitor locations in the central and eastern United States. Atmos. Environ. 2007, 41, 6185–6195. [Google Scholar] [CrossRef]
- Szép, R.; Mateescu, E.; Niță, I.-A.; Birsan, M.-V.; Bodor, Z.; Keresztesi, Á. Effects of the Eastern Carpathians on atmospheric circulations and precipitation chemistry from 2006 to 2016 at four monitoring stations (Eastern Carpathians, Romania). Atmos. Res. 2018, 214, 311–328. [Google Scholar] [CrossRef]
- Keresztesi, Á.; Birsan, M.-V.; Nita, I.-A.; Bodor, Z.; Szép, R. Assessing the neutralisation, wet deposition and source contributions of the precipitation chemistry over Europe during 2000–2017. Environ. Sci. Eur. 2019, 31, 50. [Google Scholar] [CrossRef] [Green Version]
- Larssen, T.; Lydersen, E.; Tang, D.; He, Y.; Gao, J.; Liu, H.; Duan, L.; Seip, H.M.; Vogt, R.D.; Mulder, J.; et al. Acid Rain in China. Environ. Sci. Technol. 2006, 40, 418–425. [Google Scholar] [CrossRef] [Green Version]
- Zhou, X.; Xu, Z.; Liu, W.; Wu, Y.; Zhao, T.; Jiang, H.; Zhang, X.; Zhang, J.; Zhou, L.; Wang, Y. Chemical composition of precipitation in Shenzhen, a coastal mega-city in South China: Influence of urbanization and anthropogenic activities on acidity and ionic composition. Sci. Total Environ. 2019, 662, 218–226. [Google Scholar] [CrossRef] [PubMed]
- Han, G.; Tang, Y.; Wu, Q.; Tan, Q. Chemical and strontium isotope characterization of rainwater in karst virgin forest, Southwest China. Atmos. Environ. 2010, 44, 174–181. [Google Scholar] [CrossRef]
- Xu, Z.; Han, G. Chemical and strontium isotope characterization of rainwater in Beijing, China. Atmos. Environ. 2009, 43, 1954–1961. [Google Scholar] [CrossRef]
- Ahmady-Birgani, H.; Ravan, P.; Schlosser, J.S.; Cuevas-Robles, A.; AzadiAghdam, M.; Sorooshian, A. On the chemical nature of wet deposition over a major desiccated lake: Case study for Lake Urmia basin. Atmos. Res. 2020, 234, 104762. [Google Scholar] [CrossRef]
- Zeng, J.; Yue, F.-J.; Li, S.-L.; Wang, Z.-J.; Qin, C.-Q.; Wu, Q.-X.; Xu, S. Agriculture driven nitrogen wet deposition in a karst catchment in southwest China. Agric. Ecosyst. Environ. 2020, 294, 106883. [Google Scholar] [CrossRef]
- Zeng, J.; Han, G. Rainwater chemistry observation in a karst city: Variations, influence factors, sources and potential environmental effects. Peer J. 2021, 9, e11167. [Google Scholar] [CrossRef] [PubMed]
- Han, G.; Liu, C.-Q. Strontium isotope and major ion chemistry of the rainwaters from Guiyang, Guizhou Province, China. Sci. Total Environ. 2006, 364, 165–174. [Google Scholar] [CrossRef] [PubMed]
- Zeng, J.; Han, G. Preliminary copper isotope study on particulate matter in Zhujiang River, southwest China: Application for source identification. Ecotoxicol. Environ. Saf. 2020, 198, 110663. [Google Scholar] [CrossRef]
- Xiao, H.W.; Xiao, H.Y.; Long, A.M.; Wang, Y.L.; Liu, C.Q. Chemical composition and source apportionment of rainwater at Guiyang, SW China. J. Atmos. Chem. 2013, 70, 269–281. [Google Scholar] [CrossRef]
- Zhang, C.-H.; Ma, L.-D. Ambient air quality trends in Guiyang during 2003–2014. J. Environ. Health 2016, 33, 432–434. (In Chinese) [Google Scholar]
- Jia, G.; Chen, F. Monthly variations in nitrogen isotopes of ammonium and nitrate in wet deposition at Guangzhou, south China. Atmos. Environ. 2010, 44, 2309–2315. [Google Scholar] [CrossRef]
- Yao, X.; Lau, A.P.S.; Fang, M.; Chan, C.K.; Hu, M. Size distributions and formation of ionic species in atmospheric particulate pollutants in Beijing, China: 2—Dicarboxylic acids. Atmos. Environ. 2003, 37, 3001–3007. [Google Scholar] [CrossRef]
- Chan, C.K.; Yao, X. Air pollution in mega cities in China. Atmos. Environ. 2008, 42, 1–42. [Google Scholar] [CrossRef]
- Brook, J.R.; Wiebe, A.H.; Woodhouse, S.A.; Audette, C.V.; Dann, T.F.; Callaghan, S.; Piechowski, M.; Dabek-Zlotorzynska, E.; Dloughy, J.F. Temporal and spatial relationships in fine particle strong acidity, sulphate, PM1O, and PM2.5 across multiple canadian locations. Atmos. Environ. 1997, 31, 4223–4236. [Google Scholar] [CrossRef]
- Chow, J.C.; Watson, J.G.; Fujita, E.M.; Lu, Z.; Lawson, D.R.; Ashbaugh, L.L. Temporal and spatial variations of PM2.5 and PM10 aerosol in the Southern California air quality study. Atmos. Environ. 1994, 28, 2061–2080. [Google Scholar] [CrossRef]
- Gomišček, B.; Hauck, H.; Stopper, S.; Preining, O. Spatial and temporal variations of PM1, PM2.5, PM10 and particle number concentration during the AUPHEP—Project. Atmos. Environ. 2004, 38, 3917–3934. [Google Scholar] [CrossRef]
- Ho, K.F.; Lee, S.C.; Chan, C.K.; Yu, J.C.; Chow, J.C.; Yao, X.H. Characterization of chemical species in PM2.5 and PM10 aerosols in Hong Kong. Atmos. Environ. 2003, 37, 31–39. [Google Scholar] [CrossRef]
- Vet, R.; Artz, R.S.; Carou, S.; Shaw, M.; Ro, C.-U.; Aas, W.; Baker, A.; Bowersox, V.C.; Dentener, F.; Galy-Lacaux, C.; et al. A global assessment of precipitation chemistry and deposition of sulfur, nitrogen, sea salt, base cations, organic acids, acidity and pH, and phosphorus. Atmos. Environ. 2014, 93, 3–100. [Google Scholar] [CrossRef]
- Zeng, J.; Han, G. Rainwater Chemistry Reveals Air Pollution in a Karst Forest: Temporal Variations, Source Apportionment, and Implications for the Forest. Atmosphere 2020, 11, 1315. [Google Scholar] [CrossRef]
- Rashki, A.; Rautenbach, C.J.d.; Eriksson, P.G.; Kaskaoutis, D.G.; Gupta, P. Temporal changes of particulate concentration in the ambient air over the city of Zahedan, Iran. Air Qual. Atmos. Health 2013, 6, 123–135. [Google Scholar] [CrossRef]
- Ervens, B.; Turpin, B.J.; Weber, R.J. Secondary organic aerosol formation in cloud droplets and aqueous particles (aqSOA): A review of laboratory, field and model studies. Atmos. Chem. Phys. 2011, 11, 11069–11102. [Google Scholar] [CrossRef] [Green Version]
- Huang, R.-J.; Zhang, Y.; Bozzetti, C.; Ho, K.-F.; Cao, J.-J.; Han, Y.; Daellenbach, K.R.; Slowik, J.G.; Platt, S.M.; Canonaco, F.; et al. High secondary aerosol contribution to particulate pollution during haze events in China. Nature 2014, 514, 218–222. [Google Scholar] [CrossRef] [PubMed] [Green Version]
- Wu, Q.; Han, G. Sulfur isotope and chemical composition of the rainwater at the Three Gorges Reservoir. Atmos. Res. 2015, 155, 130–140. [Google Scholar] [CrossRef]
- Szwed, M.; Kozłowski, R.; Żukowski, W. Assessment of Air Quality in the South-Western Part of the Świętokrzyskie Mountains Based on Selected Indicators. Forests 2020, 11, 499. [Google Scholar] [CrossRef]
- Zhu, Y.; Zhang, J.; Wang, J.; Chen, W.; Han, Y.; Ye, C.; Li, Y.; Liu, J.; Zeng, L.; Wu, Y.; et al. Distribution and sources of air pollutants in the North China Plain based on on-road mobile measurements. Atmos. Chem. Phys. 2016, 16, 12551–12565. [Google Scholar] [CrossRef] [Green Version]
- Zu, T.L.; Zu, Q.; Wang, Y. Numerical-simulation of air pollutant transport and diffusion in a mountainous city. Atmos. Environ. Part Gen. Top. 1992, 26, 2689–2697. [Google Scholar]
- Fan, W.; Wu, J.; Li, X.; Yang, F.; Chen, B.; Guo, J. Influences of a Quasi-stationary Front on Particulate Matter in the Low-latitude Plateau Region in China. Aerosol Air Qual. Res. 2021, 21, 200125. [Google Scholar] [CrossRef]
- Zeng, J.; Han, G.; Wu, Q.; Tang, Y. Effects of agricultural alkaline substances on reducing the rainwater acidification: Insight from chemical compositions and calcium isotopes in a karst forests area. Agric. Ecosyst. Environ. 2020, 290, 106782. [Google Scholar] [CrossRef]
- Xu, P.; Hao, Q.-J.; Ji, D.-S.; Zhang, J.-K.; Liu, Z.-R.; Hu, B.; Wang, Y.-S.; Jiang, C.-S. Observation of Atmospheric Pollutants in the Urban Area of Beibei District, Chongqing. Environ. Sci. 2014, 35, 820–829. (In Chinese) [Google Scholar]
- Liang, L.; Wang, Z. Control Models and Spatiotemporal Characteristics of Air Pollution in the Rapidly Developing Urban Agglomerations. Int. J. Environ. Res. Public Health 2021, 18, 6177. [Google Scholar] [CrossRef] [PubMed]
- Tang, Y.; Zhang, X.; Xu, J.; Zhao, X.; Ma, Z.; Meng, W. Multi-temporal scale variations of atmospheric pollutants concentrations in rural and urban areas of Beijing. Acta Sci. Circumstantiae 2016, 36, 2783–2793. (In Chinese) [Google Scholar]
- Zeng, J.; Yue, F.-J.; Wang, Z.-J.; Wu, Q.; Qin, C.-Q.; Li, S.-L. Quantifying depression trapping effect on rainwater chemical composition during the rainy season in karst agricultural area, southwestern China. Atmos. Environ. 2019, 218, 116998. [Google Scholar] [CrossRef]
- Zeng, J.; Yue, F.-J.; Xiao, M.; Wang, Z.J.; Wu, Q.; Qin, C.-Q. Dissolved organic carbon in rainwater from a karst agricultural area of Southwest China: Variations, sources, and wet deposition fluxes. Atmos. Res. 2020, 245, 105140. [Google Scholar] [CrossRef]
- Wang, S.; Yu, R.; Shen, H.; Wang, S.; Hu, Q.; Cui, J.; Yan, Y.; Huang, H.; Hu, G. Chemical characteristics, sources, and formation mechanisms of PM2.5 before and during the Spring Festival in a coastal city in Southeast China. Environ. Pollut. 2019, 251, 442–452. [Google Scholar] [CrossRef]
- Zhang, M.; Zhang, S.; Bao, Q.; Yang, C.; Qin, Y.; Fu, J.; Chen, W. Temporal Variation and Source Analysis of Carbonaceous Aerosol in Industrial Cities of Northeast China during the Spring Festival: The Case of Changchun. Atmosphere 2020, 11, 991. [Google Scholar] [CrossRef]
- Wang, Z.; Zhang, D.; Li, Y.; Feng, P.; Dong, X.; Sun, R.; Pan, L. Analysis of air quality in Beijing City during Spring Festival period of 2014. Acta Sci. Circumstantiae 2015, 35, 371–378. (In Chinese) [Google Scholar]
- Yao, L.; Wang, D.; Fu, Q.; Qiao, L.; Wang, H.; Li, L.; Sun, W.; Li, Q.; Wang, L.; Yang, X.; et al. The effects of firework regulation on air quality and public health during the Chinese Spring Festival from 2013 to 2017 in a Chinese megacity. Environ. Int. 2019, 126, 96–106. [Google Scholar] [CrossRef]
- Xiao, H.-W.; Xiao, H.-Y.; Wang, Y.-L.; Tang, C.-G.; Liu, X.-Y. Chemical Characteristics of 9 d Continuous Precipitation in a Typical Polluted City: A Case Study of Guiyang, China. Environ. Sci. 2010, 31, 865–870. (In Chinese) [Google Scholar]
- Uchiyama, R.; Okochi, H.; Katsumi, N.; Ogata, H. The impact of air pollutants on rainwater chemistry during “urban-induced heavy rainfall” in downtown Tokyo, Japan. J. Geophys. Res. Atmos. 2017, 122, 6502–6519. [Google Scholar] [CrossRef]
- Rao, W.; Han, G.; Tan, H.; Jin, K.; Wang, S.; Chen, T. Chemical and Sr isotopic characteristics of rainwater on the Alxa Desert Plateau, North China: Implication for air quality and ion sources. Atmos. Res. 2017, 193, 163–172. [Google Scholar] [CrossRef]
- Wei, J.; Huang, W.; Li, Z.; Xue, W.; Peng, Y.; Sun, L.; Cribb, M. Estimating 1-km-resolution PM2.5 concentrations across China using the space-time random forest approach. Remote Sens. Environ. 2019, 231, 111221. [Google Scholar] [CrossRef]
- Ge, B.; Xu, D.; Wild, O.; Yao, X.; Wang, J.; Chen, X.; Tan, Q.; Pan, X.; Wang, Z. Inter-annual variations of wet deposition in Beijing from 2014–2017: Implications of below-cloud scavenging of inorganic aerosols. Atmos. Chem. Phys. 2021, 21, 9441–9454. [Google Scholar] [CrossRef]
- Ouyang, W.; Guo, B.; Cai, G.; Li, Q.; Han, S.; Liu, B.; Liu, X. The washing effect of precipitation on particulate matter and the pollution dynamics of rainwater in downtown Beijing. Sci. Total Environ. 2015, 505, 306–314. [Google Scholar] [CrossRef]
- McMullen, N.; Annesi-Maesano, I.; Renard, J.-B. Impact of Rain Precipitation on Urban Atmospheric Particle Matter Measured at Three Locations in France between 2013 and 2019. Atmosphere 2021, 12, 769. [Google Scholar] [CrossRef]
- Silva, M.P.R.; Gonçalves, F.L.T.; Freitas, S.R. Two case studies of sulfate scavenging processes in the Amazon region (Rondônia). Environ. Pollut. 2009, 157, 637–645. [Google Scholar] [CrossRef] [PubMed]
- Naimabadi, A.; Shirmardi, M.; Maleki, H.; Teymouri, P.; Goudarzi, G.; Shahsavani, A.; Sorooshian, A.; Babaei, A.A.; Mehrabi, N.; Baneshi, M.M.; et al. On the chemical nature of precipitation in a populated Middle Eastern Region (Ahvaz, Iran) with diverse sources. Ecotoxicol. Environ. Saf. 2018, 163, 558–566. [Google Scholar] [CrossRef]
- Arimoto, R.; Duce, R.A.; Savoie, D.L.; Prospero, J.M.; Talbot, R.; Cullen, J.D.; Tomza, U.; Lewis, N.F.; Ray, B.J. Relationships among aerosol constituents from Asia and the North Pacific during PEM-West A. J. Geophys. Res. Atmos. 1996, 101, 2011–2024. [Google Scholar] [CrossRef]
- Lü, P.; Han, G.; Wu, Q. Chemical characteristics of rainwater in karst rural areas, Guizhou Province, Southwest China. Acta Geochim. 2017, 36, 572–576. [Google Scholar] [CrossRef]
- Keresztesi, Á.; Nita, I.-A.; Birsan, M.-V.; Bodor, Z.; Pernyeszi, T.; Micheu, M.M.; Szép, R. Assessing the variations in the chemical composition of rainwater and air masses using the zonal and meridional index. Atmos. Res. 2020, 237, 104846. [Google Scholar] [CrossRef]


| SO2 | NO2 | PM10 | CO | PM2.5 | RA | AT | WS | RH | |
|---|---|---|---|---|---|---|---|---|---|
| SO2 | 1 | ||||||||
| NO2 | 0.67 ** | 1 | |||||||
| PM10 | 0.68 ** | 0.81 ** | 1 | ||||||
| CO | 0.70 ** | 0.65 ** | 0.58 ** | 1 | |||||
| PM2.5 | 0.76 ** | 0.74 ** | 0.92 ** | 0.68 ** | 1 | ||||
| RA | −0.16 ** | −0.10 ** | −0.23 ** | −0.07 * | −0.20 ** | 1 | |||
| AT | −0.63 ** | −0.28 ** | −0.25 ** | −0.55 ** | −0.47 ** | 0.11 ** | 1 | ||
| WS | −0.26 ** | −0.46 ** | −0.27 ** | −0.28 ** | −0.25 ** | −0.04 | 0.09 * | 1 | |
| RH | −0.20 ** | −0.28 ** | −0.31 ** | −0.004 | −0.17 ** | −0.16 ** | −0.14 ** | −0.07 | 1 |
| Year | IAQISFP/IAQIwinter | IAQISFP/IAQIyearly | ||||||
|---|---|---|---|---|---|---|---|---|
| SO2 | NO2 | PM10 | PM2.5 | SO2 | NO2 | PM10 | PM2.5 | |
| 2013 | 0.63 | 0.57 | 0.61 | 0.58 | 1.12 | 0.57 | 0.65 | 0.71 |
| 2014 | 0.65 | 0.59 | 0.80 | 0.81 | 1.45 | 0.75 | 1.01 | 1.33 |
| 2015 | 0.58 | 0.51 | 0.69 | 0.69 | 1.28 | 0.64 | 0.92 | 1.10 |
| SO2 | NO2 | PM10 | CO | PM2.5 | |
|---|---|---|---|---|---|
| μg m−3 | μg m−3 | μg m−3 | mg m−3 | μg m−3 | |
| Rainy days | 22.2 | 27.5 | 59.1 | 0.8 | 41.4 |
| Non-rainy days | 30.5 | 32.3 | 89.6 | 0.8 | 54.5 |
| Relative difference percentage | 38% | 17% | 52% | - | 32% |
Publisher’s Note: MDPI stays neutral with regard to jurisdictional claims in published maps and institutional affiliations. |
© 2021 by the authors. Licensee MDPI, Basel, Switzerland. This article is an open access article distributed under the terms and conditions of the Creative Commons Attribution (CC BY) license (https://creativecommons.org/licenses/by/4.0/).
Share and Cite
Zeng, J.; Ge, X.; Wu, Q.; Zhang, S. Three-Year Variations in Criteria Atmospheric Pollutants and Their Relationship with Rainwater Chemistry in Karst Urban Region, Southwest China. Atmosphere 2021, 12, 1073. https://doi.org/10.3390/atmos12081073
Zeng J, Ge X, Wu Q, Zhang S. Three-Year Variations in Criteria Atmospheric Pollutants and Their Relationship with Rainwater Chemistry in Karst Urban Region, Southwest China. Atmosphere. 2021; 12(8):1073. https://doi.org/10.3390/atmos12081073
Chicago/Turabian StyleZeng, Jie, Xin Ge, Qixin Wu, and Shitong Zhang. 2021. "Three-Year Variations in Criteria Atmospheric Pollutants and Their Relationship with Rainwater Chemistry in Karst Urban Region, Southwest China" Atmosphere 12, no. 8: 1073. https://doi.org/10.3390/atmos12081073
APA StyleZeng, J., Ge, X., Wu, Q., & Zhang, S. (2021). Three-Year Variations in Criteria Atmospheric Pollutants and Their Relationship with Rainwater Chemistry in Karst Urban Region, Southwest China. Atmosphere, 12(8), 1073. https://doi.org/10.3390/atmos12081073