Article

The Effects of Air Quality on Hospital Admissions for Chronic Respiratory Diseases in Petaling Jaya, Malaysia, 2013–2015

1
The European Centre for the Environment and Human Health, University of Exeter, Truro TR1 3HD, UK
2
Department of Pharmacology, Faculty of Medicine, Universiti Malaya, Kuala Lumpur 50603, Malaysia
3
Geography and Planning, University of Liverpool, Liverpool L7 8TX, UK
4
Centre for Drug Research, University Sains Malaysia, George Town 11800, Malaysia
5
Department of Musculoskeletal & Ageing Science, Institute of Life Course & Medical Sciences, University of Liverpool, Liverpool L7 8TX, UK
6
Department of Medicine, Faculty of Medicine, Universiti Malaya, Kuala Lumpur 50603, Malaysia
7
Department of Molecular and Clinical Cancer Medicine, Institute of Translational Medicine, University of Liverpool, Liverpool L3 9TA, UK
*
Author to whom correspondence should be addressed.
Professor Simon P. Frostick passed away on the 8th of February 2020. He led the project as UK PI and as senior author, approved the plan of this study, and reviewed the results and earlier versions of this manuscript. Approval to include him as an author was sought from and granted by his legal representative Dr M M Frostick.
Atmosphere 2021, 12(8), 1060; https://doi.org/10.3390/atmos12081060
Submission received: 21 July 2021 / Revised: 10 August 2021 / Accepted: 16 August 2021 / Published: 18 August 2021
(This article belongs to the Special Issue Air Pollution and Public Health Effects)

Abstract

:
This study assesses the impact of a decrease in air quality and the risk of hospital admissions to a public hospital for chronic respiratory diseases for residents of Petaling Jaya, a city in the Greater Kuala Lumpur area in Malaysia. Data on hospital admissions for asthma, bronchitis, emphysema and other chronic obstructive pulmonary disease, weather conditions and the Malaysian Air Pollution Index, a composite indicator of air quality, were collated. An unconstrained distributed lag model to obtain risk of hospitalization for a 10 μg/m3 increase in the API. The lag cumulative effect for a 10 μg/m3 increase in the API was calculated to test for harvesting in the short term. Findings indicate that after an initial decrease in admissions (days 3 and 4), admissions increased again at day 7 and 8 and this relationship was significant. We therefore conclude that a 10 μg/m3 increase has a greater effect on admissions for respiratory health in the short term than a harvesting effect alone would suggest. These results suggest that while air quality is improving in the Greater Kuala Lumpur area, no level of air pollution can be deemed safe.

1. Introduction

Acute short-term exposure to different pollutants, including both gaseous pollutants (i.e., nitrogen dioxide (NO2), sulfur dioxide (SO2) and ozone (O3)) and particulate matter (PM10 and PM2.5), have been found to exacerbate existing respiratory health conditions, leading to premature death and increased hospitalizations in low- and middle-income countries [1,2]. The WHO [3] estimates that almost 90% of air-pollution-related deaths occur in low-and middle-income countries, with nearly 2/3 occurring in Southeast Asia and Western Pacific regions. As such, decreasing air pollution is linked with many of the United Nations Sustainable Development Goals, including health and wellbeing targets. [4] With one of the fastest growing economies in the Southeast region, air pollution has become a major public health concern in Malaysia [5]. In response, policymakers have been actively trying to address air pollution in Malaysia since the mid-nineties [5,6]. Recent measures include, for example, the introduction of petrol with a lower sulphur content in 2015, and the Department of Environment Malaysia are actively encouraging the wider use of natural gas in industrial and vehicle combustion. Air pollution monitoring has indicated that there is a decrease in levels of some pollutants over time [7]; however, the impact of localized air pollution on health remains a major concern in urban Malaysia [2,5].
In response, an important evidence base has begun to emerge on the health impacts of air pollution on different populations and regions within Malaysia [5]. These studies have found an association between air pollution and various health outcomes, including life expectancy, fertility rate and infant mortality rates [8], respiratory health among urban workers [9], asthma rates among school children [10], and acute respiratory disease [11]. Further research has also focused on the negative health impacts of transboundary haze events [5,6,12,13,14,15]. However, the focus on specific pollution events such as the large scale haze events and specific demographic groups may not represent the true public health burden of air pollution in Malaysia. For example, recent research in the USA and France found evidence of a strong causal relationship between local air pollution and daily mortality rates even at concentrations below recommended air pollution standards [16,17,18]. Although based on research in the Global North, these results indicate that even low levels of air pollution cannot be deemed safe from a public health perspective. As such research is required to understand the health impact of everyday levels of pollution in Malaysia, as well as major pollution events such as transboundary pollution events.
Using an unconstrained distributed lag model (DLM), this study assesses the impact of a decrease in air quality on hospital admissions for chronic respiratory diseases to a public hospital for residents of Petaling Jaya (PJ) a city in the Greater Kuala Lumpur area. Focusing on admissions to a public hospital over a short time frame, results may be susceptible to a harvesting effect [19], whereby decreases in air quality only principally result in increases in mortality or admissions among the already frail population, and the initial increase in mortality rate is then followed by a period with a lower-than-expected mortality rate [20]. If air pollution–related deaths are displaced only by a few days, the public health impact measured in loss of life expectancy would not be as large as if deaths are brought forward by a much greater period [19,21]. To understand the true impact of decreases in air quality on public health it is important to identify potential harvesting effects [17,19].

2. Materials and Methods

2.1. Study Site

Although the overall prevalence of urban poverty in Malaysia is low compared with that of rural poverty, rapid urbanization has created various problems in urban areas, particularly with the provision of services, housing and infrastructure [22]. Combined with decreased air quality due to industrialization and the growth in private car ownership, the health impacts of air pollution is a significant concern for the urban poor in the Greater Kuala Lumpur area.
Data on air pollution, weather conditions and hospital admissions for respiratory conditions were linked for residents of Petaling Jaya (PJ). Developed initially as a satellite township for Kuala Lumpur, Malaysia’s capital, it is part of the Greater Kuala Lumpur area. Petaling Jaya was granted city status on 20 June 2006. It has an area of approximately 97.2 km2 (37.5 sq mi) and a population of 638,516 [23]. PJ has a tropical climate and is one of the wettest cities in Malaysia [24]. It is warm with an average maximum of 30 degrees Celsius and receives heavy rainfall all year round, with more than 3300 mm (130 in) of average rainfall annually. The city has no true dry season, but June and July are the driest months [24].

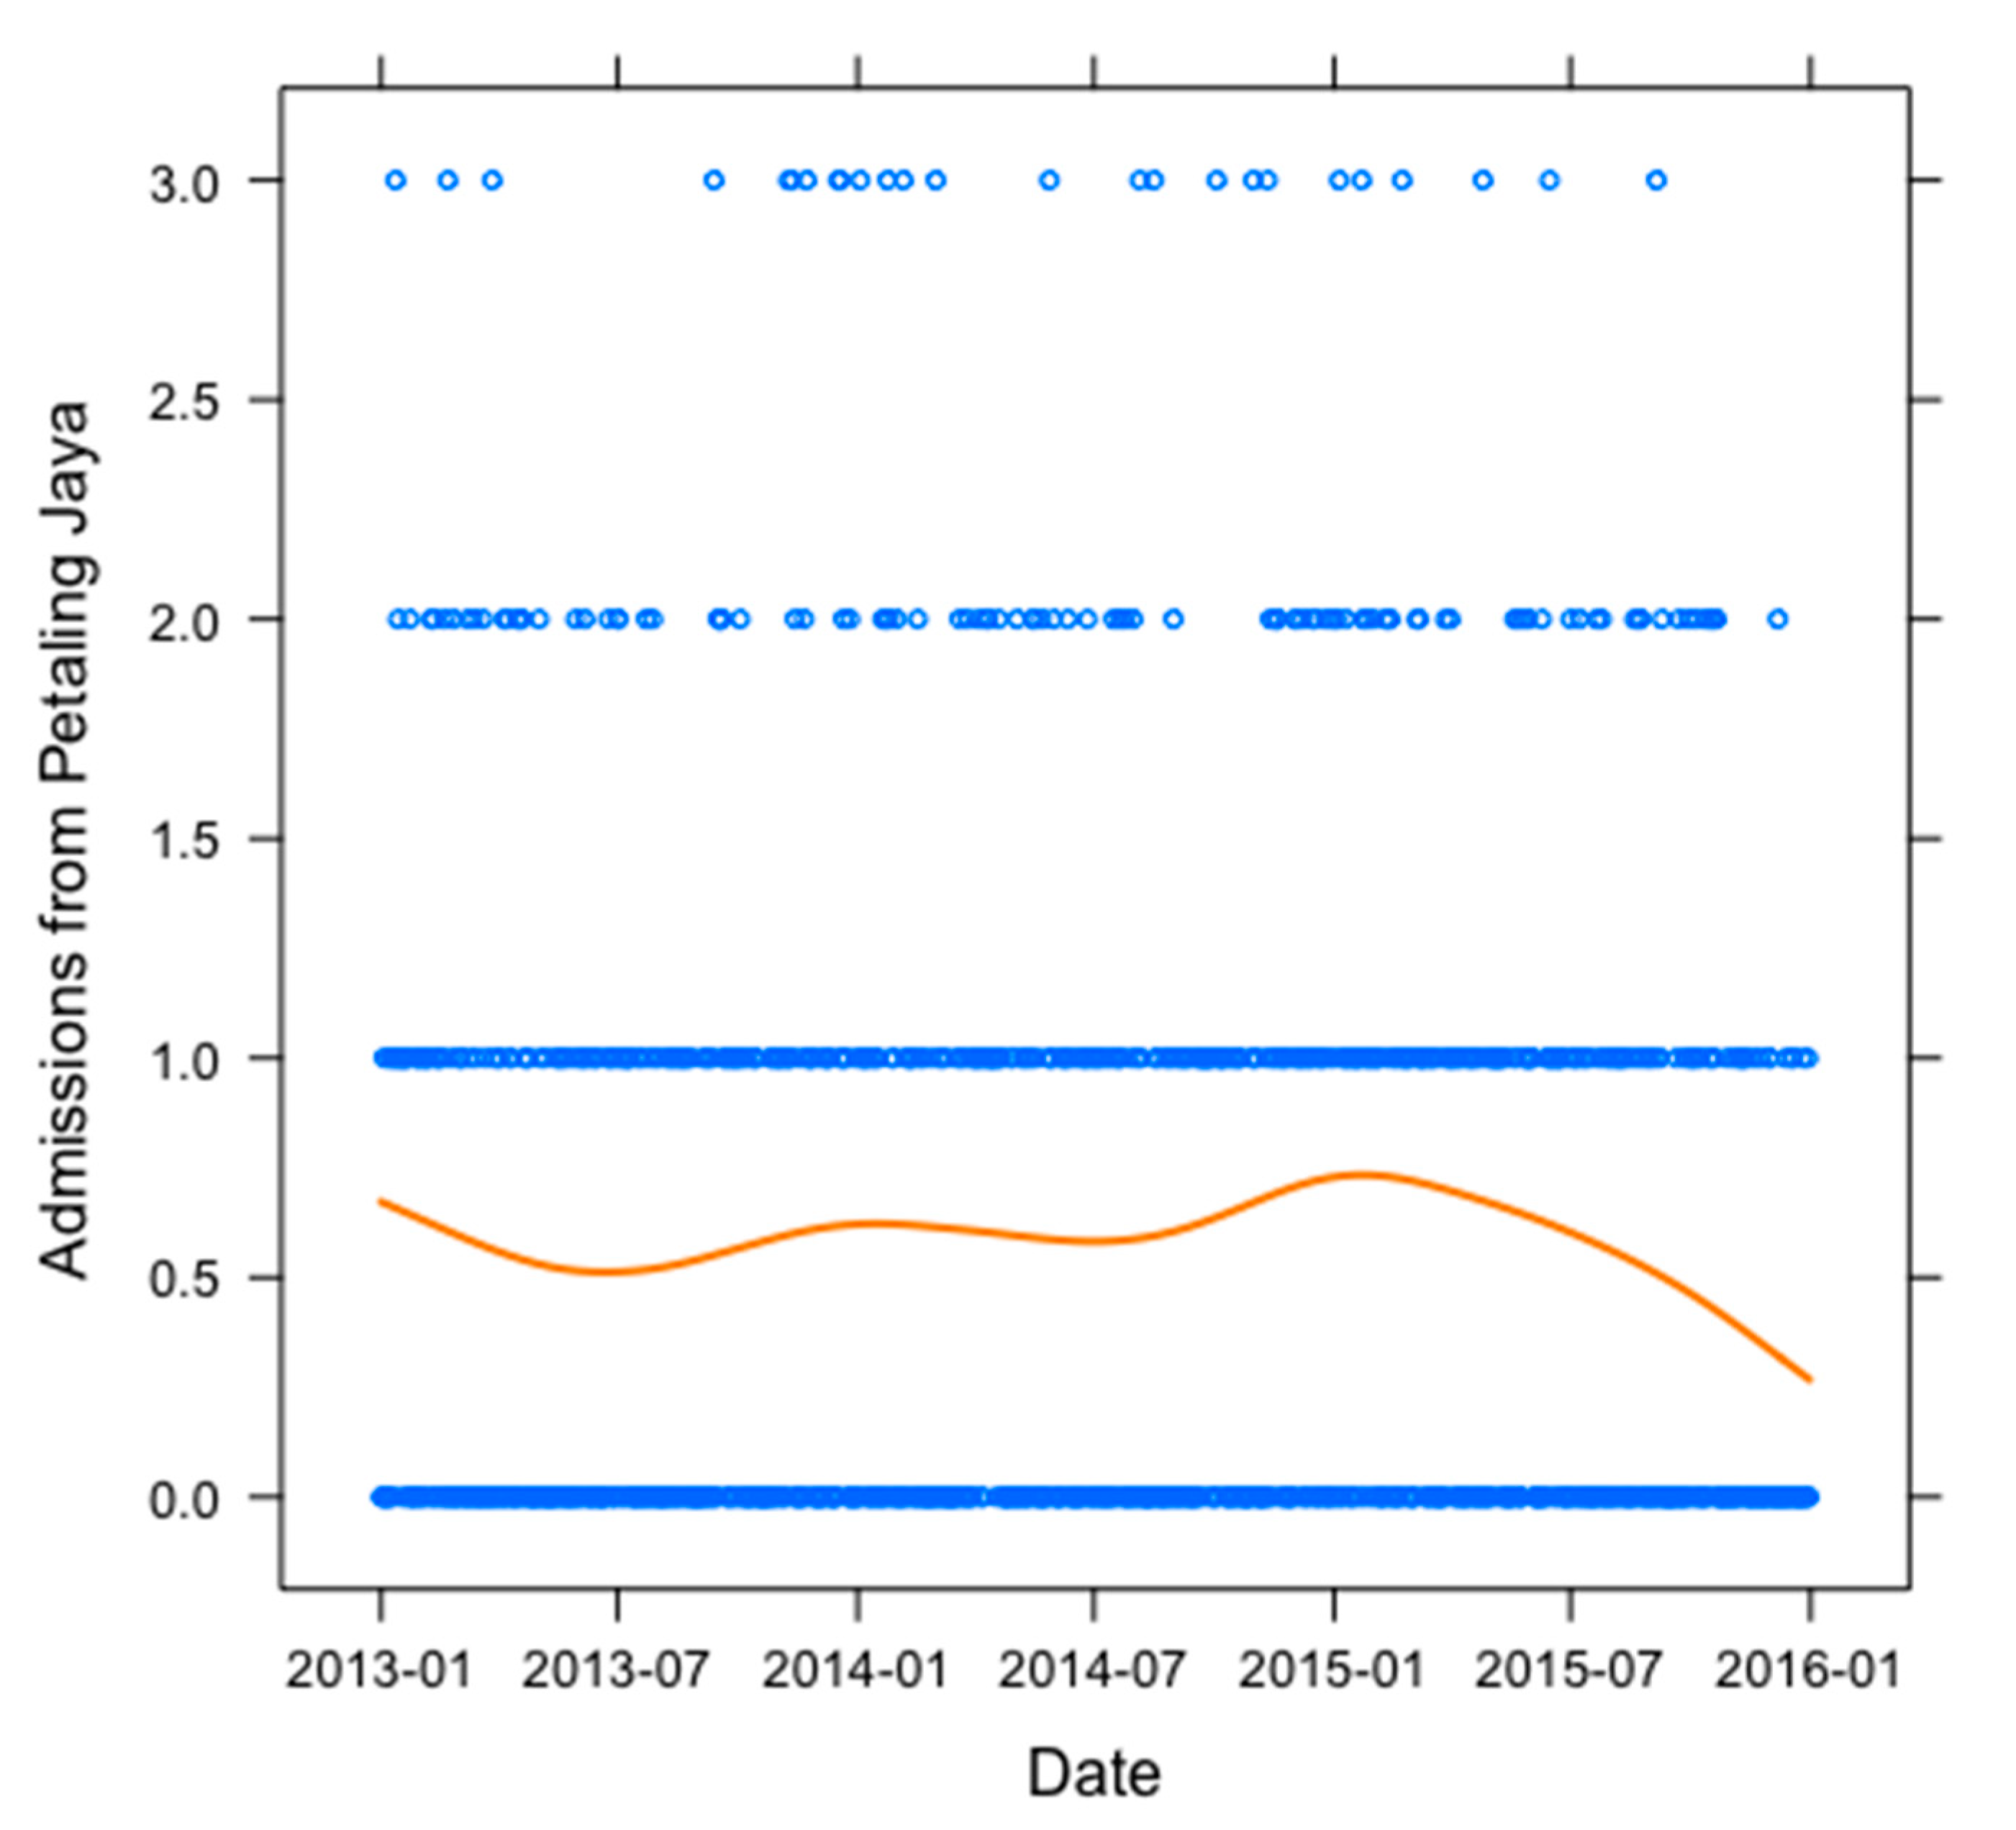
2.2. University of Malaysia Medical Centre (UMMC) Data
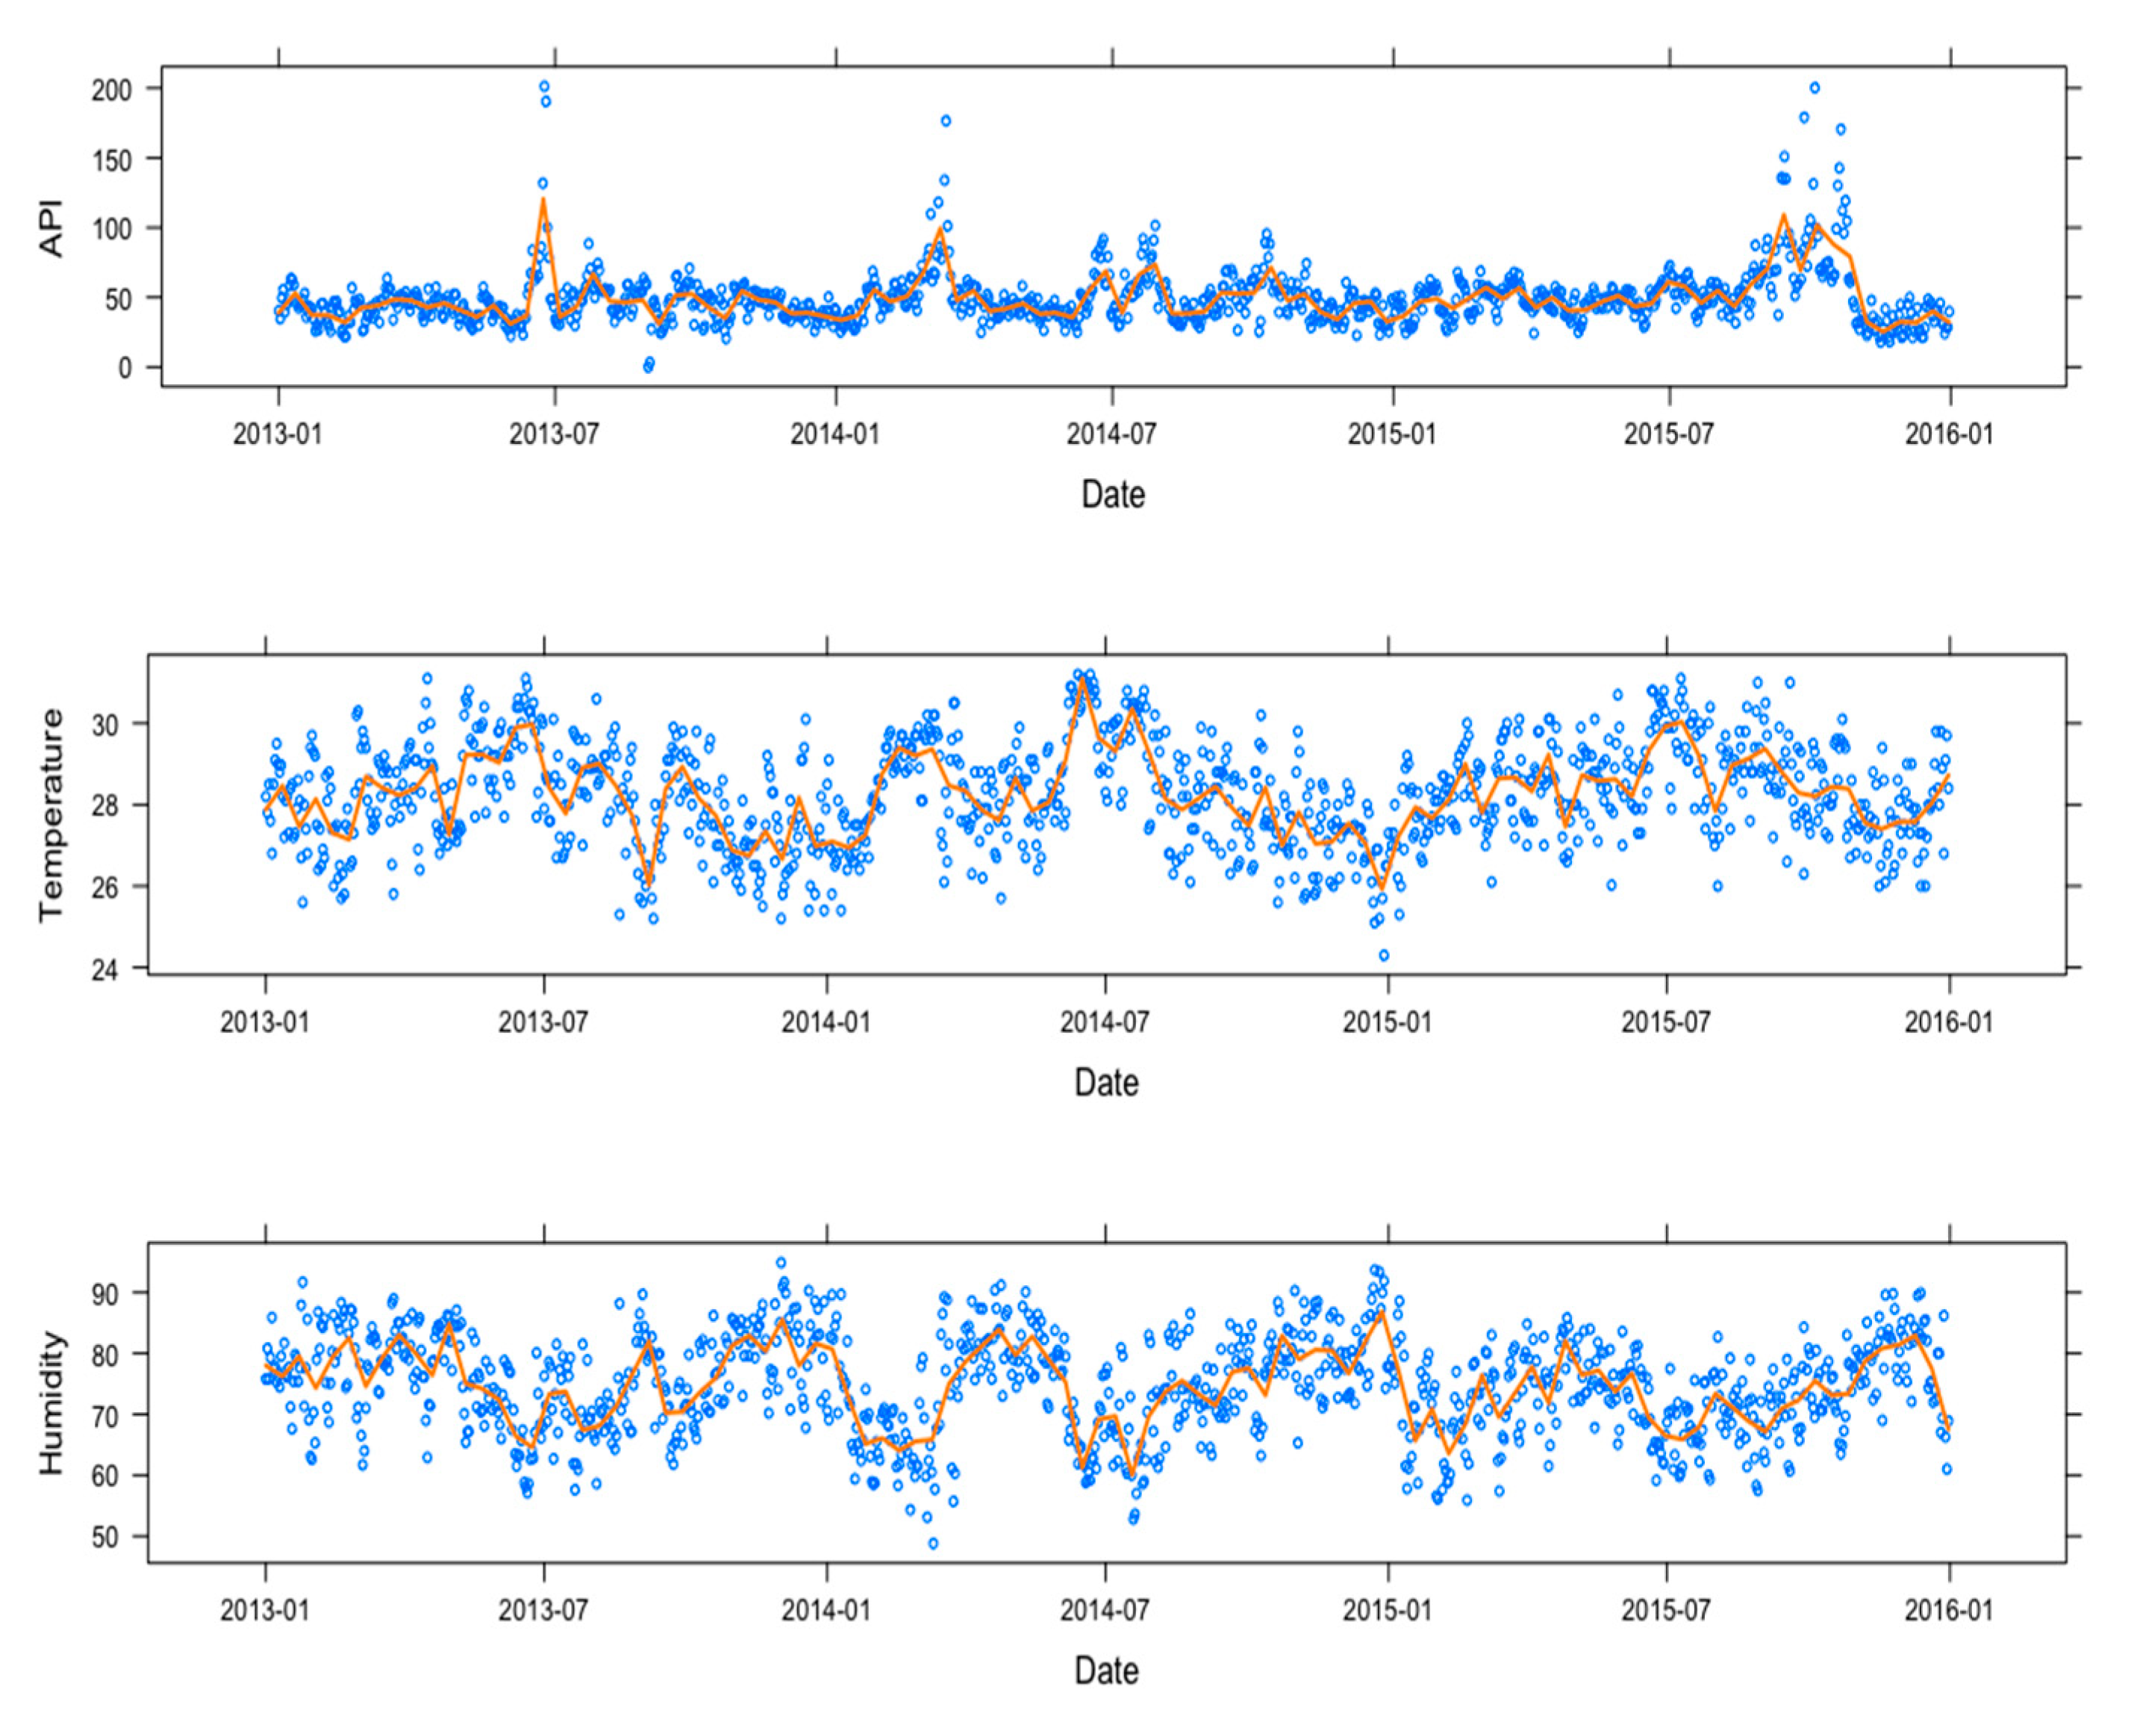
The Malaysian healthcare system is a two-tier health care system consisting of a government funded universal system and a co-existing private system [22,25]. The heavily subsidized public sector caters for approximately 65% of the population, with patients paying only nominal fees for access to both outpatients and inpatient services [22,25]. The University of Malaysia Medical Centre (UMMC) is a large public hospital in the GKV region and serves residents of PJ, an area with a high percent of urban poor with pre-existing health care needs [26], who rely on public health care [22].
Anonymized electronic patient level data relating to hospital admissions for chronic respiratory diseases from January 2013 to December 2015 were sourced from the UMMC Data Department. Patient data included together with information on date of admission, residential district, and occupation. The outcome variable, chronic respiratory diseases admissions was based on the diagnostic codes in accordance with the International Classification of Disease (ICD) 10th version (ICD-10) coding system and included admissions under chronic lower respiratory diseases, (J40–J47) specifically: bronchitis, not specified as acute or chronic (J40); simple and mucopurulent chronic bronchitis (J41); unspecified chronic bronchitis (J42); emphysema (J3); other chronic obstructive pulmonary disease (J44); asthma (J45) and bronchiectasis (J47).
As air pollution data was obtained from one monitoring station in one district (the Petaling Jaya district), to ensure that the air pollution data was matched to individuals that were exposed to the recorded level of pollution, only inpatients residing within the Petaling Jaya district were used in the analysis. Table 1 provides an overview of the hospital admissions data for respiratory conditions. This study was approved by the Medical Ethics Committee, University of Malaya Medical Centre, Malaysia (MECID: 20157-1465).

2.3. Pollution Data

The Malaysian Department of the Environment (DOE) adopted a revised Air Pollution Index (API) definition in 1996 modeled on the US Pollutant Standards Index (PSI) system to assess air quality conditions [26,27]. Individual index values are calculated for each pollutant and the maximum value is then taken forward as the final (single) API value [26,27]. Details on API calculation are provided by Mead et al. (2018). The DOE API system translates measured concentrations of O3, CO, NO2, SO2 and PM10 into API bands (0–500) and descriptors (‘Good’ to ‘Hazardous’). API levels below 100 are considered ‘safe levels’ and above 100 unhealthy [26]. There are 50 continuous monitoring stations throughout Malaysia [27]; however, only API data from Sekolah Kebangsaan Bandar Utama in Petaling Jaya (03°06.612′,101°42.274′) was used in this study.

2.4. Weather Data

Meteorological data was obtained from the Malaysian meteorological system’s data sharing service. Data included daily average ambient temperature, daily average relative humidity, daily average rainfall and daily wind speed.

2.5. Time Series Analysis

Estimating the health impacts from population exposure to air pollutants is a challenging area as it requires both an accurate description of spatio-temporal patterns and trends of air pollutants and robust relationships linking air quality conditions to human morbidity and mortality [26]. Further factors to consider include: the nature of the dependent (response) variable; the potential nonlinear relationship between the dependent variable and the covariates (predictors); and the potential delayed effects of the covariates on the dependent variable [28]. Within this context, this study uses time series analysis, specifically an unconstrained Distributed Lag Model (DLM) for count data to determine the short-term association between air pollution as measured by the API and hospital admissions for chronic respiratory diseases. This approach allows for the investigation of potential time lags between pollutant exposure and hospitalization for chronic respiratory diseases since we do not necessarily expect admissions to occur on the same day as air pollution exposure [28].
Briefly, log-linear generalized linear models (GLMs) were used with a flexible spline function for time with 7 knots per year to control for the long-term trend and seasonal effects and natural cubic spline functions with 4 degrees of freedom to adjust for the effects of temperature and relative humidity. Adjustment for temperature and relative humidity was performed using a polynomial spline with 3 degrees of freedom and a 4-day lag structure. While research has found that in general a second or third degree offers sufficient flexibility in most cases of distributed constrained lag [29], the optimal degrees of freedom (df) for the seasonality and trend component were selected by minimizing the Akaike information criterion (AIC). Day of the week (DOW) and a dummy variable for dry seasons were included in the model. The dry season variable was included to account for potential haze events in the region. Sensitivity analyses were performed to check the robustness of the model. First, an analysis using different degrees of freedom of the natural spline for the time trend function was performed to estimate the effects on the strength of the association. These degrees of freedom were confirmed by cross validation. Second, different methods of adjustment for temperature were performed (decile variable or natural spline with different degrees of freedom).
Risk estimates were performed for a 10 μg/m3 increase in the API. Relative risk (RR) and 95% confidence intervals were calculated with a Poisson regression model using R software (The R Foundation for Statistical Computing, Vienna, Austria) with the spline and dlnm packages. The cumulative effect of the increase in API is calculated from the distributed lag model as the sum of the coefficients of the coefficients [28]. The best model was selected based on the Akaike Information Criterion. Following best practice [28], residuals and autocorrelation were checked graphically to ensure the goodness of the model by analyzing scatter plots of deviance residuals for variation around the long-term pattern and partial autocorrelation functions for residual autocorrelation and overfitting

3. Results

The seasonal pattern of daily admissions for chronic respiratory diseases for residents of PJ is shown in Figure 1, with summary statistics presented in Table 1. Between January 2013 and December 2015, there were a total of 1222 admissions for chronic respiratory related diseases across 1905 days (the duration of the study period). Daily mean admissions for chronic respiratory disease were 1.15 persons with a maximum of 5 admissions per day (Table 1). Peaks were observed in January 2013 and January 2014 with admissions for chronic respiratory diseases decreasing throughout 2015 (Figure 1). Of the 1222 admissions to UMMC hospital, 494 inpatients were from PJ, with an average admissions rate of 0.58 and a maximum of three admissions per day. Table 1 also includes mean, minimum and maximum API, temperature, and humidity readings across our years of interest (2013–2015).
Figure 2 presents a graphical representation for each of these variables. The highest temperatures were recorded in July of each year; however, variation in temperature was small, with much higher rates of variation found for humidity. As noted above, API levels below 100 are considered safe levels, with levels above 100 considered unhealthy [26]. The average recorded API was 49 across the 3 years of the study, well within the boundary of levels considered as safe. However, instances of poor air quality were reported with API measures higher than 100 on 24 of the 1095 days and maximum readings reaching 201, twice the recommended safety level. Included as covariates in the DLM, spearman rank correlations between temperature, relative humidity and API were calculated. As to be expected, API and temperature are positively correlated (0.32), while API and relative humidity are negatively correlated (−0.30).

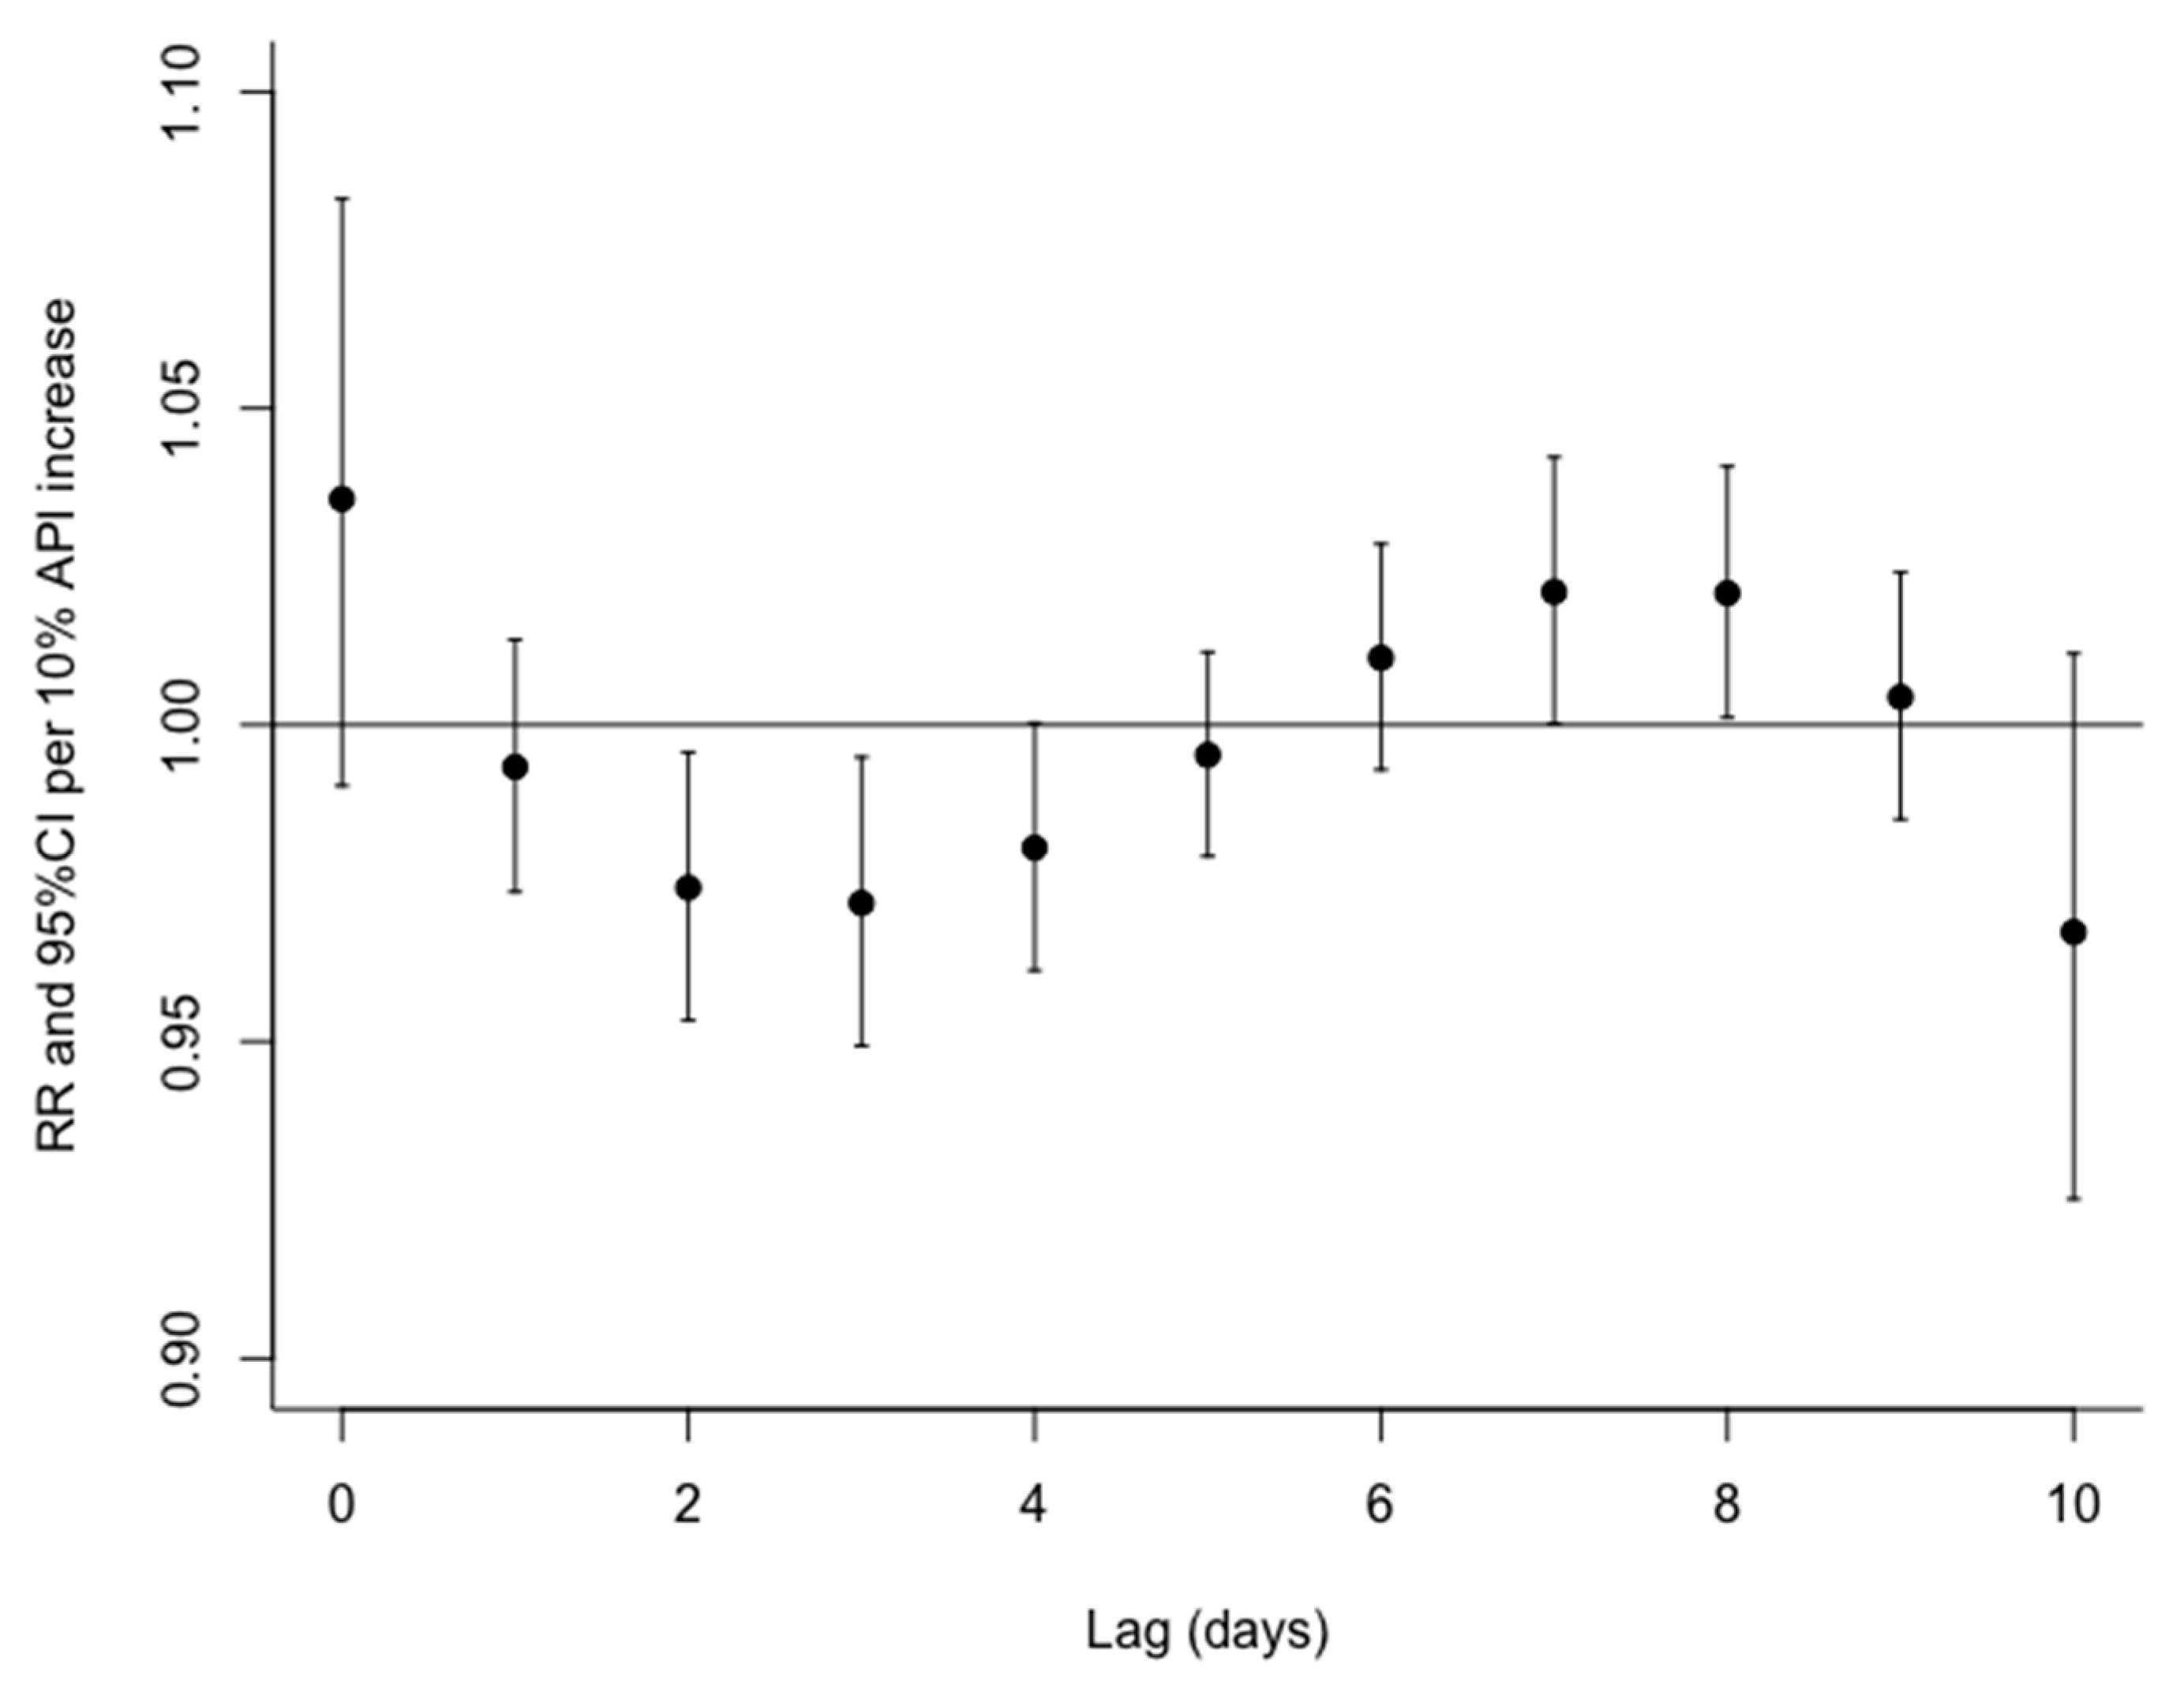
3.1. Single Day Lagged Models

Effect estimates with a 10-day lag as the percentage change in the count of admissions for chronic respiratory disease associated with a 10 μg/m3 increases in the API are presented in Figure 3. A table representing this data with associated 95% confidence interval are available in the Supplementary Materials (Table S1). The results indicate that a 10 μg/m3 increase in the API is significantly associated with adult hospital admissions for chronic respiratory diseases in PJ, with an initial (non-significant) increase in admissions in Day 1, followed by a decrease in admissions between day 3 and 5 peaking at an incident rate ratio of 0.97 (95%, CI 0.95–0.99). By day 6, admissions had started to increase, and the analysis revealed a significant increase in admission on days 7 and 8.

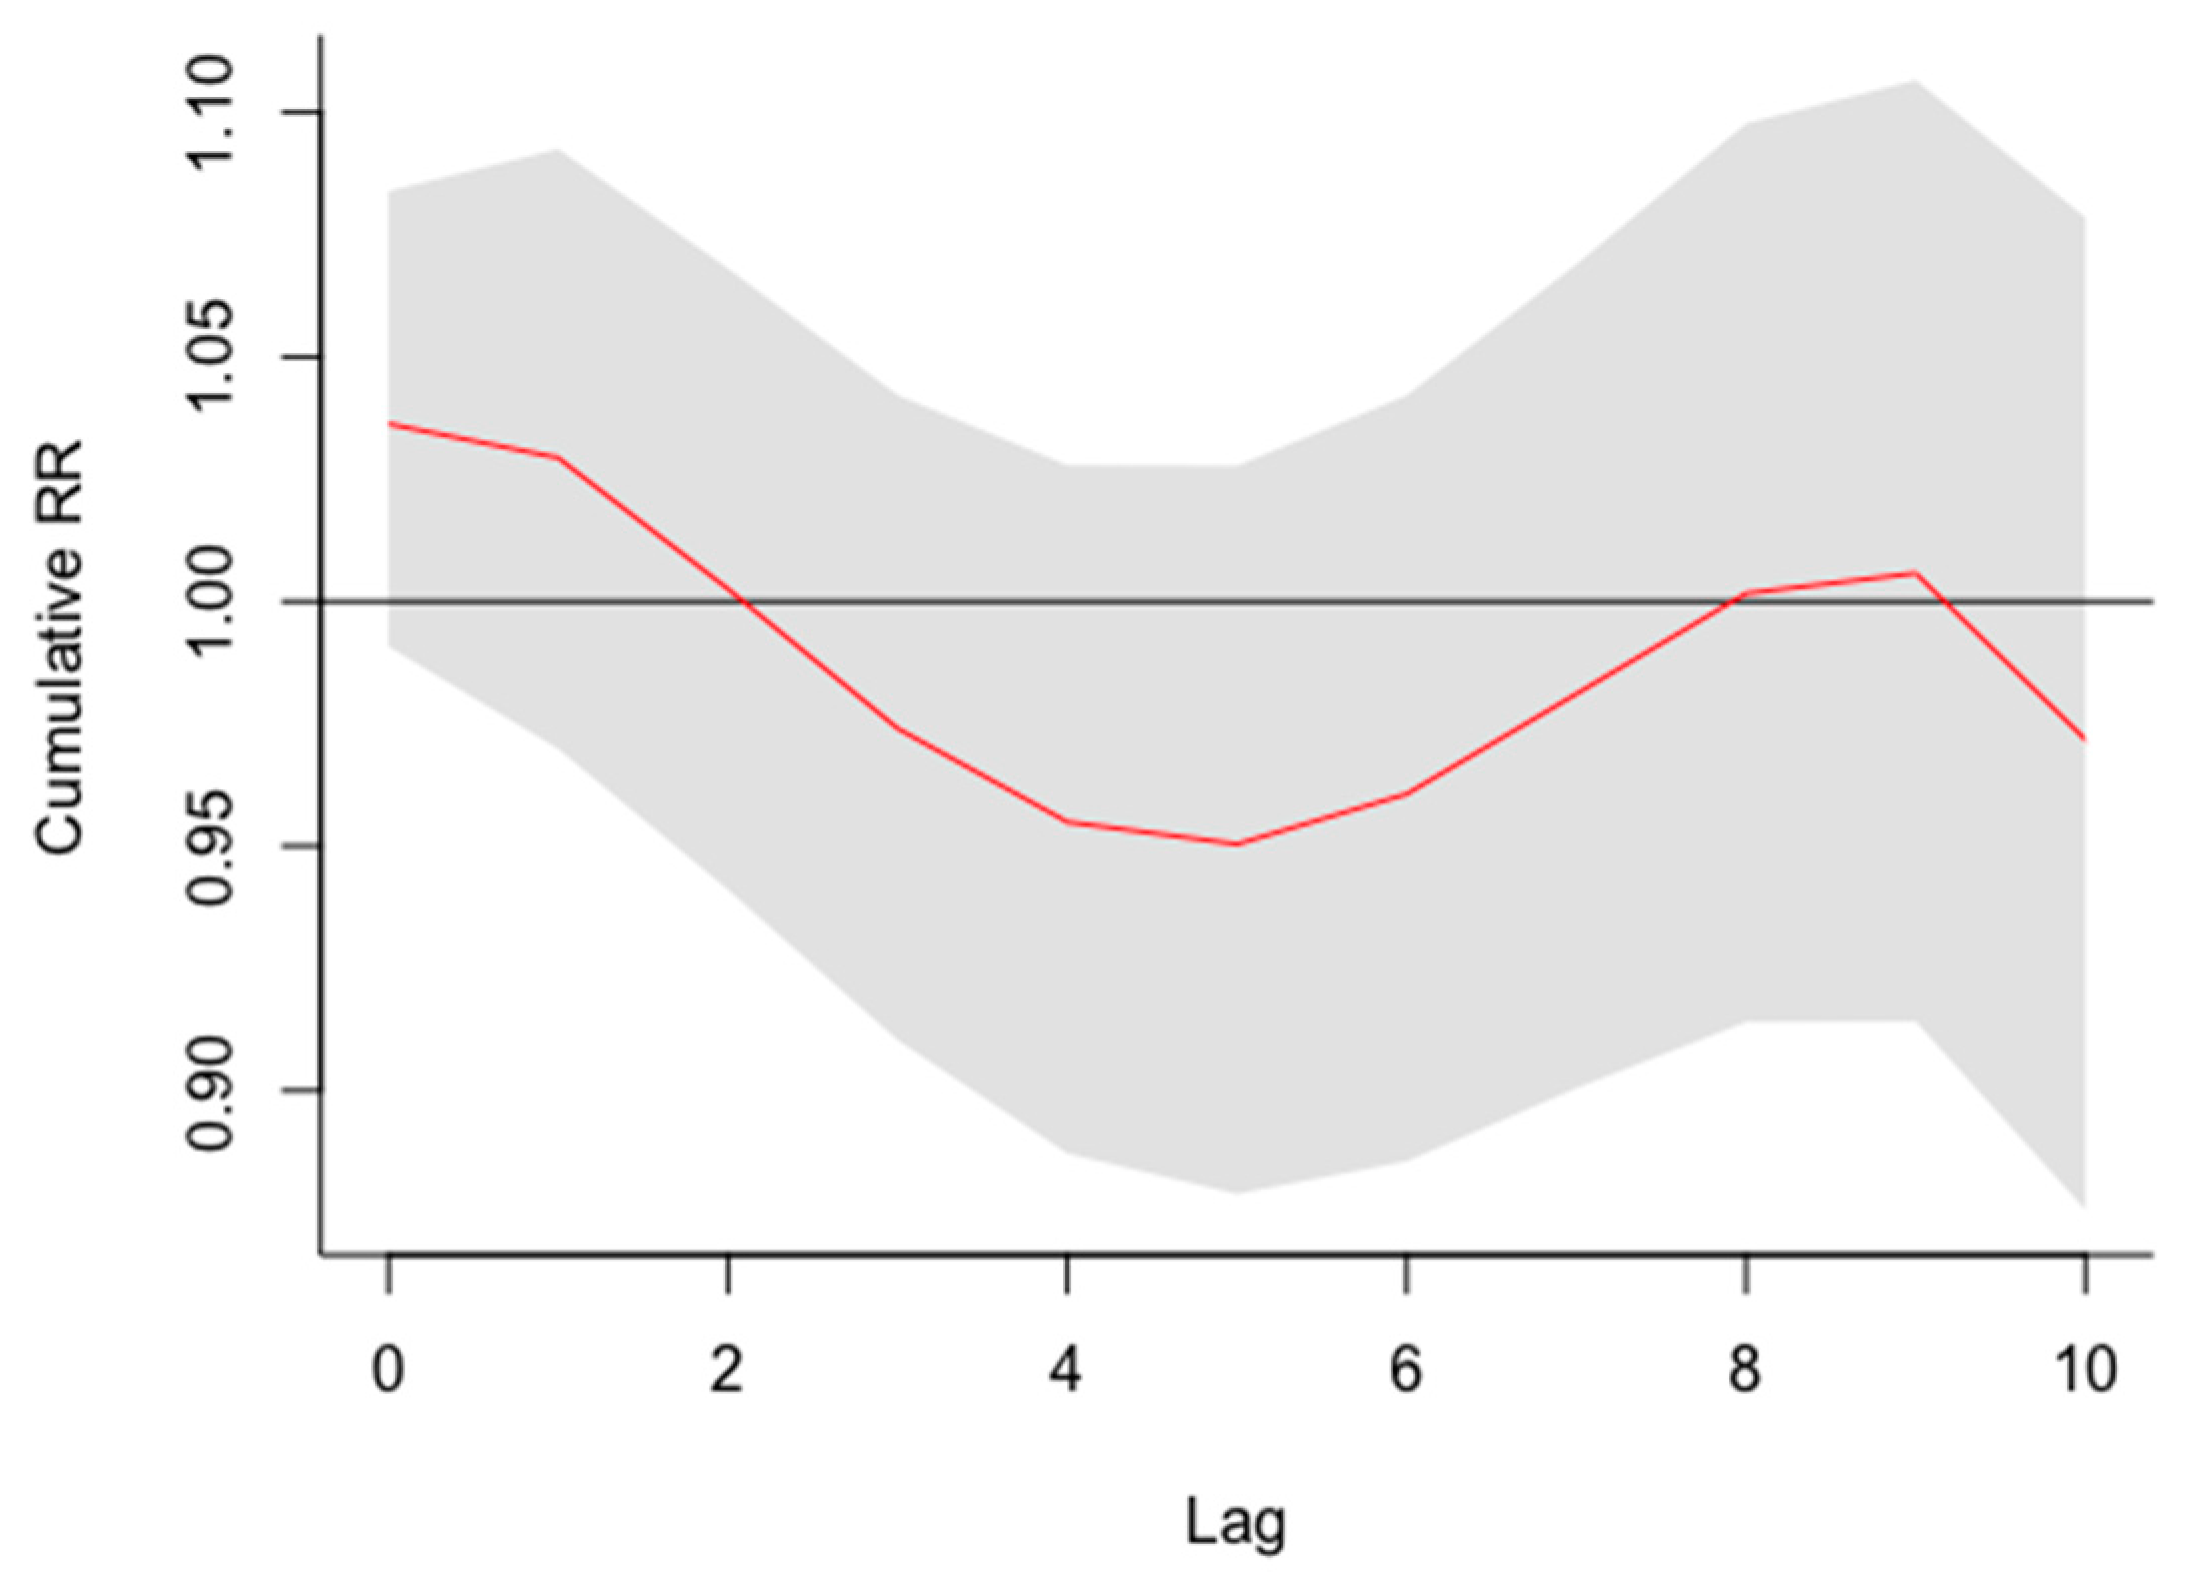
3.2. Cumulative Effect

The overall cumulative effect of a 10 ug/m3 increase in the API over 10 days was a 0.97% (95% CI: 0.87–1.08) increase in all hospital admissions for chronic respiratory diseases. Figure 4 presents a graphical representation of the cumulative effect indicates admissions increased in day 1, with admissions decreasing to below the baseline level after day 2. However, as with the single day lag models we see the risk of admission increasing again at day 7 and 8 indicating that over the 10-day period admissions were above the expected number of admissions associated with harvesting. Therefore, we conclude that there is no evidence of a harvesting effect within this study and a 10 μg/m3 increases in the API increases hospital admissions for chronic respiratory disease outside the already susceptible population.

4. Discussion

The WHO estimates that almost 90% of air-pollution-related deaths occur in low- and middle-income countries, with nearly 2/3 occurring in Southeast Asia and Western Pacific regions [3]. Rapid economic development in Malaysia has resulted in localized air pollution, much of which is in the Greater Kuala Lumpur region [5,27]. At the same time, statistics from the Malaysian Department of Health list respiratory illnesses the fifth highest principal cause of mortality (2.7%) and the second major cause of hospitalization in Malaysia (13.2%) (Ministry of Health, Petaling Jaya, Malaysia). Previous research in Malaysia has identified the urban poor as having a multiplicity of complex health care needs [22], whilst being exposed to continuous air pollution throughout the year [5]. In response, this study examined the impact of a 10 μg/m3 increases in the Malaysian API (i.e., a decrease in air quality) on admissions to a public hospital for residents of Petaling Jaya, a city within the Greeter Kuala Lumpur region. Daily historic air quality data measured by the Malaysian API for Petaling Jaya indicates that the API was lower than the Malaysian Ambient Air Quality Standard (MAAQS), for most of the study period (1071 days out of 1095 days). However, even though air pollution was well below recommended levels for most of the study’s timeframe, with an average daily reading of 49, this analysis found a significantly higher risk for admissions to a public hospital with a 10 μg/m3 increases in the API.
Harvesting or mortality displacement, first discussed within the context of the impact of extreme weather events and their impact on mortality, refer to the seemingly paradoxical decrease in mortality rates for a few days after an environmental stressor has ended [30], because the size of the pool of frailer or ‘more susceptible’ individuals decreases faster than would have been expected due to the environmental stressor, and thus leaves a smaller at-risk pool of individuals on following days [19]. Focusing on admissions to a public hospital in a population with complex health needs and poor living conditions over a short time frame, the lag cumulative effect of air pollution related admissions was estimated to test for harvesting [19]. Both the single day lagged models and the lag cumulative effects model indicate that while admissions for respiratory disease decrease following a 10 μg/m3 increases in the API, admissions are above the expected level by days 7 and 8. Evidence of ‘harvesting’ or displacement is therefore not confirmed and an 10 μg/m3 increases in the Malaysian API is significantly associated with an increase in hospital admissions for chronic respiratory disease outside the already susceptible population within PJ, our case study location.
This study adds to the rich literature emerging on the impact of air quality on public health in Malaysia by using a time series modeling approach to examine the impact of a decrease in air quality on admissions for chronic respiratory conditions among the urban poor. In doing so, this study provides the first evidence for Malaysia that increases in air pollution, even if levels are generally well within recommended standards has a significant impact on hospital admission for chronic respiratory disease among the urban poor. Although this analysis does not allow for the examination of causality, merely association, this adds to with increasing evidence from high income countries of a causal relationship between local air pollution and daily deaths even at relatively low concentrations of air pollution, for example below the United States Environmental Protection Agency standards [16]. From a policy perspective, these results add to the growing research base that suggests that while air quality is improving in the Greater Kuala Lumpur area, no level of air pollution can be deemed safe [18].
Regarding study limitations, estimating the health impacts from population exposure to everyday air pollutants is a challenging area as it requires both an accurate description of spatio-temporal patterns and trends of air pollutants and robust relationships linking air quality conditions to human morbidity and mortality [26]. Time series analysis of the health impact of environmental stressors requires data points across many years [28]. Electronic records for admission in our hospital of interest began in 2013, as such only data from 2013 was available to the authors. However, regardless of the short timeframe, reliable estimation of the burden of air pollution on health are essential to support evidence-based government policy for public health in Malaysia [5].

Supplementary Materials

The following are available online at https://www.mdpi.com/article/10.3390/atmos12081060/s1, Table S1: Model Percentage change (with 95% confidence interval) in admissions for chronic respiratory disease associated with a 10 μg/m3 increases in API (rounding to 2 decimal places) over 10 days

Author Contributions

S.P.F., M.M.R. and M.P.T. proposed the research ideas and methods; formal analysis, K.M.; data curation, A.W., S.P. and A.M.; writing—original draft preparation K.M.; writing—review and editing, A.W., M.P.T., I.C., P.-F.W. and M.M.R.; funding acquisition, S.P.F., M.M.R. and M.P.T. All authors have read and agreed to the published version of the manuscript.

Funding

This research was funded by British Council Newton Ungku Omar Institutional Links Grant (IF017-2015) and Partnership Grant, Universiti Malaya (RK002-2015). The APC was funded by the Allan Turing Institute Grant (109457R).

Institutional Review Board Statement

The study was conducted according to the guidelines of the Declaration of Helsinki, and approved by the Medical Ethics Committee, University of Malaya Medical Centre, Kuala Lumpur, Malaysia (MECID No: 20157-1465).

Informed Consent Statement

Patient consent was waived as this was a secondary data study.

Data Availability Statement

The hospital data presented in this study are not publicly available as they were only available to the authors for the purpose of this study by the University of Malaysia Medical Centre Data Department. The air pollution data presented in this study are not publicly available as they were only available to the authors for the purpose of this study by Department of the Environment, Malaysia. The weather data presented in this study are not publicly available as they were only available to the authors for the purpose of this study by the Malaysian Meterological Department.

Conflicts of Interest

The authors declare no conflict of interest.

References

  1. HEI International Scientific Oversight Committee. Outdoor Air Pollution and Health in the Developing Countries of Asia: A Comprehensive Review; Special Report 18; Health Effects Institute: Boston, MA, USA, 2010. [Google Scholar]
  2. Tajudin, M.A.; Khan, M.F.; Mahiyuddin, W.R.; Hod, R.; Latif, M.T.; Hamid, A.H.; Abd Rahman, S.; Sahani, M. Risk of concentrations of major air pollutants on the prevalence of cardiovascular and respiratory diseases in urbanized area of Kuala Lumpur, Malaysia. Ecotoxicol. Environ. Saf. 2019, 171, 290–300. [Google Scholar] [CrossRef]
  3. WHO. WHO. WHO releases country estimates on air pollution exposure and health impact. In New Interactive Maps Highlight Areas within Countries that Exceed WHO Air Quality Limits; WHO: Geneva, Switzerland, 2016. [Google Scholar]
  4. Rafaj, P.; Kiesewetter, G.; Gül, T.; Schöpp, W.; Cofali, J.; Klimont, Z.; Purohit, P.; Heyes, C.; Amann, M.; Borken-Kleefeld, J.; et al. Outlook for clean air in the context of sustainable development goals. Glob. Environ. Chang. 2018, 53, 1. [Google Scholar] [CrossRef]
  5. Usmani, R.S.; Saeed, A.; Abdullahi, A.M.; Pillai, T.R.; Jhanjhi, N.Z.; Hashem, I.A. Air pollution and its health impacts in Malaysia: A review. Air Qual. Atmos. Health 2020, 13, 1093–1118. [Google Scholar] [CrossRef]
  6. Afroz, R.; Hassan, M.N.; Ibrahin, N.A. Review of air pollution and health impacts in Malaysia. Environ. Res. 2003, 92, 71–77. [Google Scholar] [CrossRef]
  7. Department of Environment (DOE). Malaysia Environmental Quality Report; MoNRE: Kuala Lumpur, Malaysia, 2015.
  8. Qureshi, M.I.; Rasli, A.M.; Awan, U.; Ma, J.; Ali, G.; Alam, A.; Sajjad, F.; Zaman, K. Environment and air pollution: Health services bequeath to grotesque menace. Environ. Sci. Pollut. Res. 2015, 22, 3467–3476. [Google Scholar] [CrossRef]
  9. Awang, M.F.; Jalaludin, J.; Latif, M.T.; Fandi, N.F. Exposure to PM2.5 in urban area and respiratory health symptoms among urban workers in Klang Valley. IOP Conf. Ser. Earth Environ. Sci. 2019, 228, 012015. [Google Scholar] [CrossRef]
  10. Abidin, E.Z.; Semple, S.; Rasdi, I.; Ismail, S.N.; Ayres, J.G. The relationship between air pollution and asthma in Malaysian schoolchildren. Air Quality. Atmos. Health 2014, 7, 421–432. [Google Scholar] [CrossRef]
  11. Mabahwi, N.A.; Leh, O.L.H.; Musthafa, S.N.; Aiyub, K. Air quality-related human health in an urban region. Case study: State of Selangor, Malaysia. Environ. Asia 2018, 11, 194–216. [Google Scholar]
  12. Latif, M.T.; Othman, M.; Idris, N.; Juneng, L.; Abdullah, A.M.; Hamzah, W.P.; Khan, M.F.; Sulaiman, N.M.; Jewaratnam, J.; Aghamohammadi, N.; et al. Impact of regional haze towards air quality in Malaysia: A review. Atmos. Environ. 2018, 177, 28–44. [Google Scholar] [CrossRef]
  13. Wong, L.P.; Alis, H.; Aghamohammadi, N.; Ghadimi, A.; Sulaiman, N.M. Control measures and health effects of air pollution: A survey among public transportation commuters in Malaysia. Sustainability 2017, 9, 1616. [Google Scholar] [CrossRef] [Green Version]
  14. Sulong, N.A.; Latif, M.T.; Khan, M.F.; Amil, N.; Ashfold, M.J.; Wahab, M.I.; Chan, K.M.; Sahani, M. Source apportionment and health risk assessment among specific age groups during haze and non haze episodes in Kuala Lumpur, Malaysia. Sci. Total Environ. 2017, 1, 556–570. [Google Scholar] [CrossRef]
  15. Jie, Y. Air Pollution Associated with Sumatran Forest Fires and Mortality on the Malay Peninsula. Pol. J. Environ. Stud. 2017, 26, 163–171. [Google Scholar] [CrossRef]
  16. Makar, M.; Antonelli, J.; Di, Q.; Cutler, D.; Schwartz, J.; Dominici, F. Estimating the Causal Effect of Fine Particulate Matter Levels on Death and Hospitalization: Are Levels Below the Safety Standards Harmful? Epidemiology 2017, 28, 627. [Google Scholar] [CrossRef]
  17. Schwartz, J.; Bind, M.A.; Koutrakis, P. Estimating causal effects of local air pollution on daily deaths: Effect of low levels. Environ. Health Perspect. 2017, 125, 23–29. [Google Scholar] [CrossRef] [Green Version]
  18. Alari, A.; Schwarz, L.; Zabrocki, L.; Le Nir, G.; Chaix, B.; Benmarhni1, T. The effects of an air quality alert program on premature mortality: A difference-in-differences evaluation in the region of Paris. Environ. Int. 2021, 156, 106583. [Google Scholar] [CrossRef]
  19. Costa, A.F.; Hoek, G.; Brunekreef, B.; Ponce de Leon, A.C. Air pollution and deaths among elderly residents of Sao Paulo, Brazil: An analysis of mortality displacement. Environ. Health Perspect. 2017, 25, 349–354. [Google Scholar] [CrossRef] [Green Version]
  20. Schwartz, J. Is there harvesting in the association of airborne particles with daily deaths and hospital admissions? Epidemiology 2001, 1, 55–61. [Google Scholar] [CrossRef]
  21. Hajat, S.; Armstrong, B.G.; Gouveia, N.; Wilkinson, P. Mortality displacement of heat-related deaths: A comparison of Delhi, Sao Paulo, and London. Epidemiology 2005, 1, 614–620. [Google Scholar] [CrossRef]
  22. Qi, H.; Pu, V.C.; Tia, L. Short-term effects of fine and coarse particles on deaths in Hong Kong elderly population: An analysis of mortality displacement. Environ. Pollut. 2018, 241, 148–154. [Google Scholar] [CrossRef]
  23. Sherina, M.S.; Rampal, L.; Hejar, A.R.; Rozali, A.; Mohd Yunus, A. Prevalence of urban poor and its health related factors in the state of Selangor, Malaysia. Malays. J. Med. Health Sci. 2011, 7, 17–25. [Google Scholar]
  24. Usmani, R.S.; Pillai, T.R.; Hashel, I.A.; Marjani, M.; Shaharudil, R.; Latif, M.T. Air pollution and cardiorespiratory hospitalization, predictive modeling, and analysis using artificial intelligence techniques. Environ. Sci. Pollut. Res. 2021, 1, 1–13. [Google Scholar]
  25. Zizi, N.M.; Noor, N.M.; Hashim, N.I.; Yusuf, S.Y. Spatial and Temporal Characteristics of Air Pollutants Concentrations in Industrial Area in Malaysia. In IOP Conference Series: Materials Science and Engineering; IOP Publishing: Bristol, UK, 2018. [Google Scholar]
  26. Quek, D. The Malaysian healthcare system: A review. In Proceedings of the Intensive Workshop on Health Systems in Transition, Kuala Lumper, Malaysia, 29–30 April 2009; pp. 29–30. [Google Scholar]
  27. Mead, M.I.; Castruccio, S.; Latif, M.T.; Nadzir, M.S.; Dominick, D.; Thota, A.; Crippa, P. Impact of the 2015 wildfires on Malaysian air quality and exposure: A comparative study of observed and modeled data. Environ. Res. Lett. 2018, 13, 044023. [Google Scholar] [CrossRef]
  28. Rani, N.L.; Azid, A.; Khali1, S.I.; Juahit, H.; Samsudir, M.S. Air Pollution Index Trend Analysis in Malaysia, 2010–2015. Polish J. Environ. Stud. 2018, 27, 801–807. [Google Scholar] [CrossRef]
  29. Bhaskaran, K.; Gasparrini, A.; Hajat, S.; Smeeth, L.; Armstrong, B. Time series regression studies in environmental epidemiology. Int. J. Epidemiol. 2013, 42, 1187–1195. [Google Scholar] [CrossRef]
  30. Pope, C.A.; Schwartz, J. Time series for the analysis of pulmonary health data. Am. J. Respir. Crit. Care Med. 1996, 154, S229–S233. [Google Scholar] [CrossRef]
Figure 1. Seasonal pattern of daily admissions for chronic respiratory diseases for Petaling Jaya Residents 2013–2015.
Atmosphere 12 01060 g001
Figure 2. Seasonal pattern of temperature, relative humidity, and air pollution levels in Petaling Jaya (PJ), 2013–2015.
Atmosphere 12 01060 g002
Figure 3. Single day lag models percentage change (with 95% confidence interval) in admissions for chronic respiratory disease associated with a 10 ug/m3 increases in API over 10 days.
Atmosphere 12 01060 g003
Figure 4. Cumulative effect associated with a 10 μg/m3 increases in the API over 10 days on admissions for chronic respiratory disease.
Atmosphere 12 01060 g004
Table 1. Summary Statistics for admissions to UMMC for respiratory conditions and air quality, temperature, and humidity for Petaling Jing, 2013–2015.
Total AdmissionsDaily MeanStandard DeviationMinMaxDays API > 100
Total Admissions to UMMC12221.15 05
Daily Admissions for Petaling Jaya residents4940.580.7503
Air pollution Index (API) 49.2419.90201.324/1095
Temperature 28.271.2624.331.2
Humidity 74.667.9948.894.9
Publisher’s Note: MDPI stays neutral with regard to jurisdictional claims in published maps and institutional affiliations.

