Article

Resolving Elve, Halo and Sprite Halo Images at 10,000 Fps in the Taiwan 2020 Campaign

1
Department of Space Science and Engineering, National Central University, Taoyuan 320, Taiwan
2
Department of Physics, Penn State Lehigh Valley, Center Valley, PA 18034, USA
3
Department of Earth and Planetary Sciences, Cosmosciences, Hokkaido University, Hokkaido 060-0808, Japan
4
Institute of Earth Sciences, Academia Sinica, Taipei 115, Taiwan
5
Department of Atmospheric Sciences, National Central University, Taoyuan 320, Taiwan
*
Author to whom correspondence should be addressed.
Atmosphere 2021, 12(8), 1000; https://doi.org/10.3390/atmos12081000
Submission received: 24 June 2021 / Revised: 30 July 2021 / Accepted: 31 July 2021 / Published: 3 August 2021
(This article belongs to the Special Issue Atmospheric Electricity)

Abstract

:
After almost thirty years’ efforts on studying transient luminous events (TLEs), ground-based observation has confirmed the TLE family, including elves, halos, sprites, and blue jets, etc. The typical elve has the shortest emission time (<1 ms) in comparison with other TLEs. The second shortest is the halo emission. Although elves and halos are supposed to be more frequent than sprites, ground campaigns still have less probability of recording their images due to their fleeting and short emission. Additionally, the submillisecond imaging of elves, halos, and sprite halos helps us resolve their electro-optic dynamics and morphological features, but few have been reported in the literature. Our study presents the 10,000 fps imaging frames on elves, halos and sprite halos, compares their similarity and disparity, and analyzes their parent lightning properties with associated VLF and ELF data.

1. Introduction

The transient luminous events (TLEs) might have been first formally reported by MacKenzie and Toynbee [1886] [1,2]. In 1925, Wilson predicted that a thunderstorm could cause electric discharge above its cloud top and play a role in charging the Earth’s global electric circuit [3,4]. Until 1989, no one seriously considered the possible existence of TLEs, and they directed their efforts towards camera investigations, except for airplane pilots’ report [5]. Since Franz et al. [6] showed the first image of sprites, TLEs have attracted interest from researchers worldwide and drawn their attention to investigate for almost thirty years [7,8,9,10,11,12,13,14,15,16,17].
Elves, halos, and sprites may appear together in the observed events, individually or in any combination. The order of appearance will be elves, halos, and sprite inception if all events are participating [18]. Elves (Emissions of Light and VLF perturbations due to EMP Sources) first occurred with the shortest emission time (<1 ms) [19,20,21,22]. The accompanying halos may last several milliseconds [23,24,25,26,27]. Finally, sprite streamers may incept, branch, and form a complicated sprite structure [28,29,30,31]. Their morphology, generated mechanism, and their parent lightning properties are significantly different compared to elves and halos [23,32]. Hence, for these fleeting phenomena, image recording by a high-speed camera is an essential tool for morphological analysis of their characteristics.
Elves are optical emissions that are 75–95 km in height [19,20,21,22,33,34]. The lightning current radiates the electromagnetic (EM) wave and propagates outward. The electric field in the EM wave accelerates the background electrons, and the energized electrons impact-excite ambient molecular nitrogen and oxygen. The optical emissions in elves are associated with the spontaneous emissions from the excited molecules. The elves model was first proposed and interpreted by numerical modeling [35,36,37,38]. Recently, the Atmosphere–Space Interactions Monitor (ASIM) onboard the International Space Station also revealed that the terrestrial gamma-ray flashes are linked with elves [12].
Halos are pancake-like objects with diameters of ~80 km, occurring at altitudes of ~80 km [18]. The halo-associated emissions are resultant from heating by the electrostatic field just above the thunderstorm. Barrington-Leigh et al. [23] first proved that halos are distinct from elves (which have a much larger diameter of ~300 km and a shorter luminous duration of <1 ms) and compared the modeling results with the halo and elves recorded by a high-speed (3000 frames per second) camera. Halos are discerned as the precursor of sprite inception, and when they exist individually they play a role in the paradox of sprite polarity [27,39].
Unlike sprites, which require the highest frame rate (100,000 fps) [40] to resolve their complex structures [11,28,30,31,41,42], the submillisecond imaging of elves and halos has the opportunity to show their morphological features. Still, there have been few reported in the literature. Our study presents the detailed analyses of 10,000 fps imaging frames, compares their similarity and disparity, and lists the parent lightning properties with very low frequency (VLF) and extremely low frequency (ELF) data.

2. Instruments and Calibrations

2.1. The Imaging Instrument and Lightning Data in Taiwan 2020 Campaign

We utilized a high-speed camera system in the Taiwan 2020 campaign. The campaign was conducted at the Yushan weather station (23°29′21″.49 N, 120°57′06″ E) at an altitude of 3845 m at the North peak of Yushan Mountain in Taiwan. The highest observation site in the Taiwan regions was chosen for the best visibility condition and to minimize the atmospheric attenuation along the line of sight. The observation system consisted of two instrument systems: the narrow-field high-speed camera system with the front-end 20 mm F1.4 lens and the wide-field low-light-level CCD system with the front-end 12 mm F1.2 lens. We used the wide-field CCD system to seek targets at night in clear sky and to be automatically triggered by the TLEs. The activated signals also synchronized the frame reordering in the high-speed camera.
The high-speed camera had an effective pixel size of ~10 μm, and each pixel of the imager sensor had an instantaneous field-of-view (IFOV) angle of 0.03° with a 20 mm focal length lens. For the frame size of 240 (V) × 320 (H) pixels, the high-speed camera (Phantom) with the image intensifier III type had a field-of-view (FOV) of 7.2° (V) × 9.6° (H). The wide-field low-light-level CCD (Watec) had a pixel size of 6.35 (V) × 7.4 (H) μm and an IFOV angle of 0.03° (V) × 0.035° (H), corresponding to a total FOV of 14.4° (V) × 22.4° (H) for a video frame size of 480 (V) × 640 (H) pixels. For the typical TLE distance ~600 km, the corresponding spatial resolution of 0.3 km can be achieved.
We also analyzed the ground electromagnetic signal associated with the parent lightning of these recorded TLE events with WWLLN (World Wide Lightning Location Network) VLF data [11,43,44] and ELF data from the Kuju station [45]. The WWLLN is a network of lightning location sensors at VLF (3–30 kHz), and is operated by the University of Washington in Seattle [43]. The recorded ELF data with sampling frequency of 400 Hz were provided by an induction magnetometer in the ELF range (1–100 Hz) at the Kuju station (33.059° N, 131.233° E) in Japan [45]. The recording video with the GPS timestamp provided by IOT could ensure the precise time accuracy of 0.1 ms necessary for correctly finding TLE-producing lightning. However, the possible uncertainty time within a timestamp frame was about 16.7 milliseconds (ms) since the low-light-level CCD with the interlacing frame rate 30 fps triggered the high-speed-camera.

2.2. Observation Site and Image Field Calibration

We conducted a campaign on 17–26 June 2020. Six TLEs were recorded in the period, including two elves, one halo, one sprite halo, and two sprites, as listed in Table 1. Figure 1 shows the high-speed camera system installed on the platform of the Yushan weather station. In Figure 1a, we set up the camera system and mounted it on the observation platform. In Figure 1b, we investigated the nearby environment of lightning activities provided by the WWLLN website. We also monitored the thunderstorm system based on the cloud top temperature map on the website of the Central Weather Bureau to determine the observation direction.
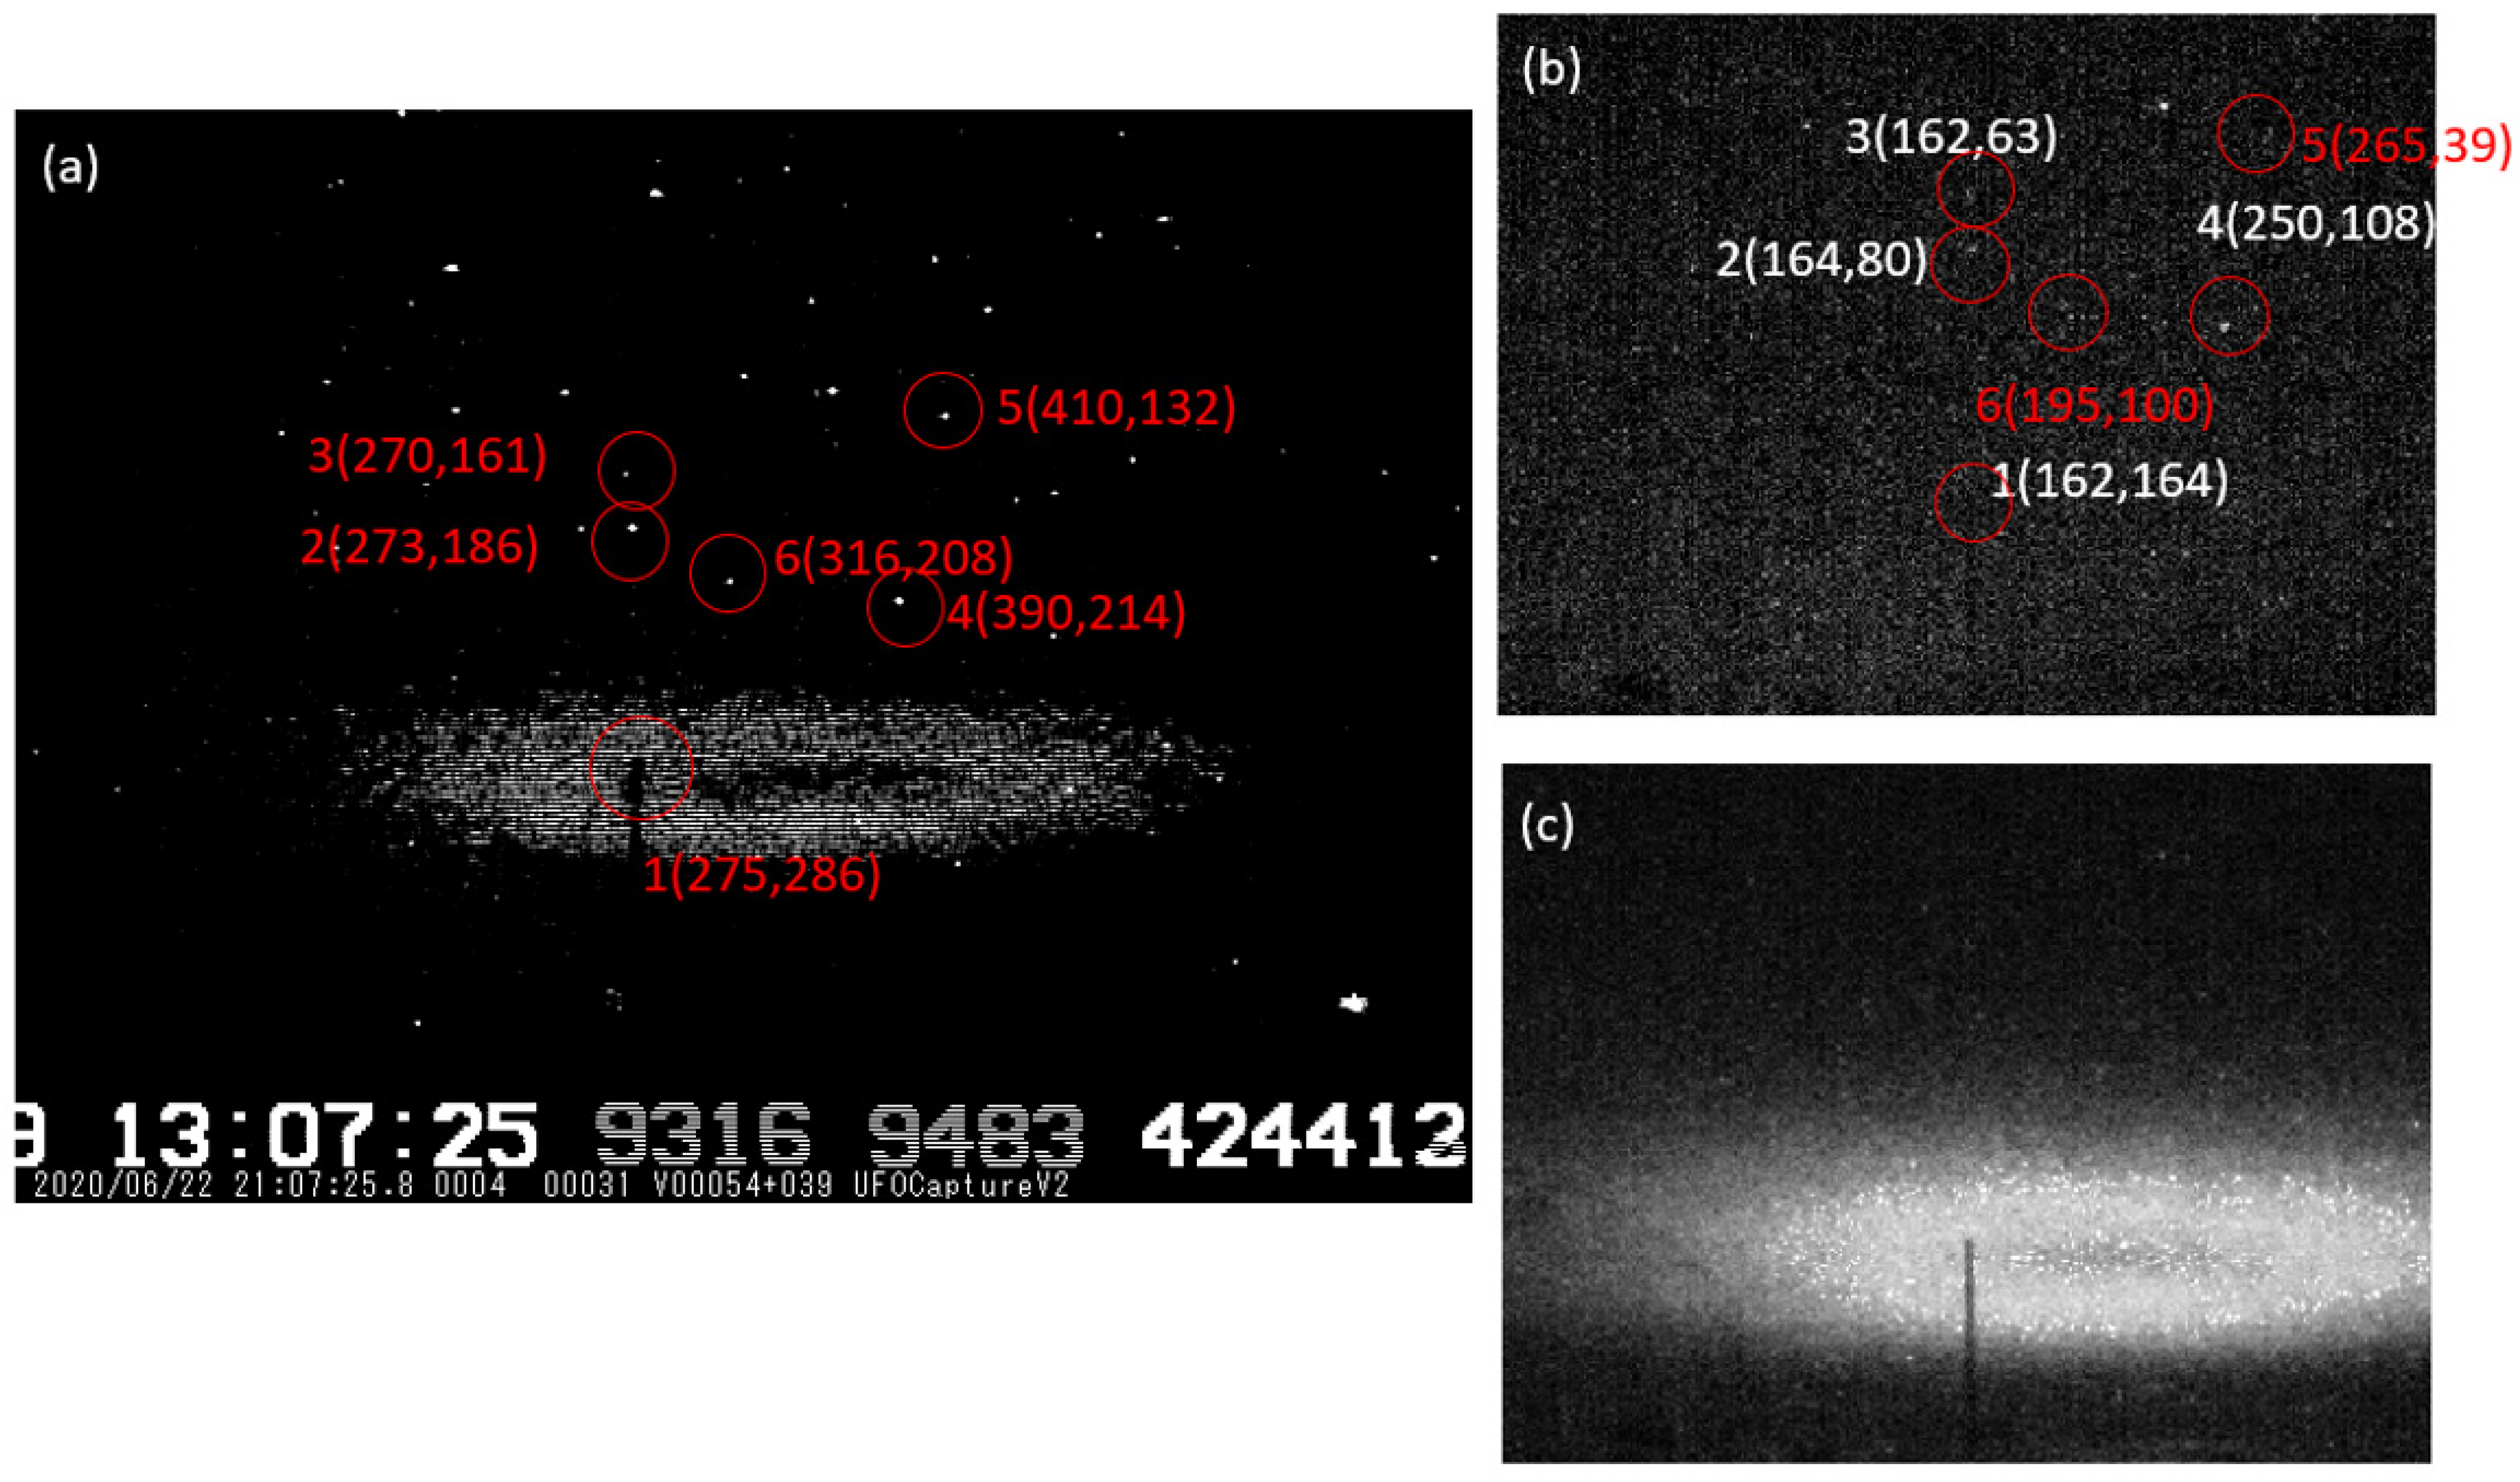
Figure 2 shows our image processing as an example for coordinate calibration. We used the real-time background stars as references to calibrate the FOV, azimuthal, and elevation calibration and the relative position between the low-light-level CCD system and the high-speed camera system [46]. Figure 2a identifies the landscape (antenna tip) and star positions (red circles) in the low-light-level CCD recorded image frame. These positions were individually projected into the corresponding locations in the high-speed camera-recorded image, shown in Figure 2b. To achieve enough S/N and contrast in the photo, we integrated 100 frames into the overplayed image in Figure 2b without elves while selecting 20 frames with a recorded elve as show in Figure 2c for reference. Using star map software (e.g., Stellarium) with known observation location (longitude and latitude) and time, we identified five stars in Figure 2a,b, which provided celestial geometry and the local azimuthal and elevation angle. With the aid of one-to-one star geometry in Figure 2a,b, we evaluated the effective IFOV per pixel of the image frame in the low-light-level CCD and high-speed camera. We also calculated the coordinate transformation between the two camera systems. Besides, with stellar information provided by Stellarium, we could obtain the azimuthal and elevation of recorded images at the observation site, listed in Table 1.

3. Observation Results

Table 1 shows the summary of TLEs observed on June 22 in the Taiwan 2020 campaign. We list the GPS timestamp in the low-light-level CCD and their TLE types in the first and the second column. Based on the WWLLN lightning recording time and geometric location in latitude and longitude, we calculated the distance and azimuthal angle from the observation site in the third to the fifth column. The lightning geometry location helped us confirm the ELF data for their electromagnetic wave propagation azimuthal angles ф using Lissajour Plot [47,48], also shown in Figure 11. The characteristics of TLE-producing lightning, such as derived peak current [49], the VLF energy [49], the measured ELF peak, and the charge-moment-change (CMC) [47,50] are listed in the 9th to the 12th, respectively.
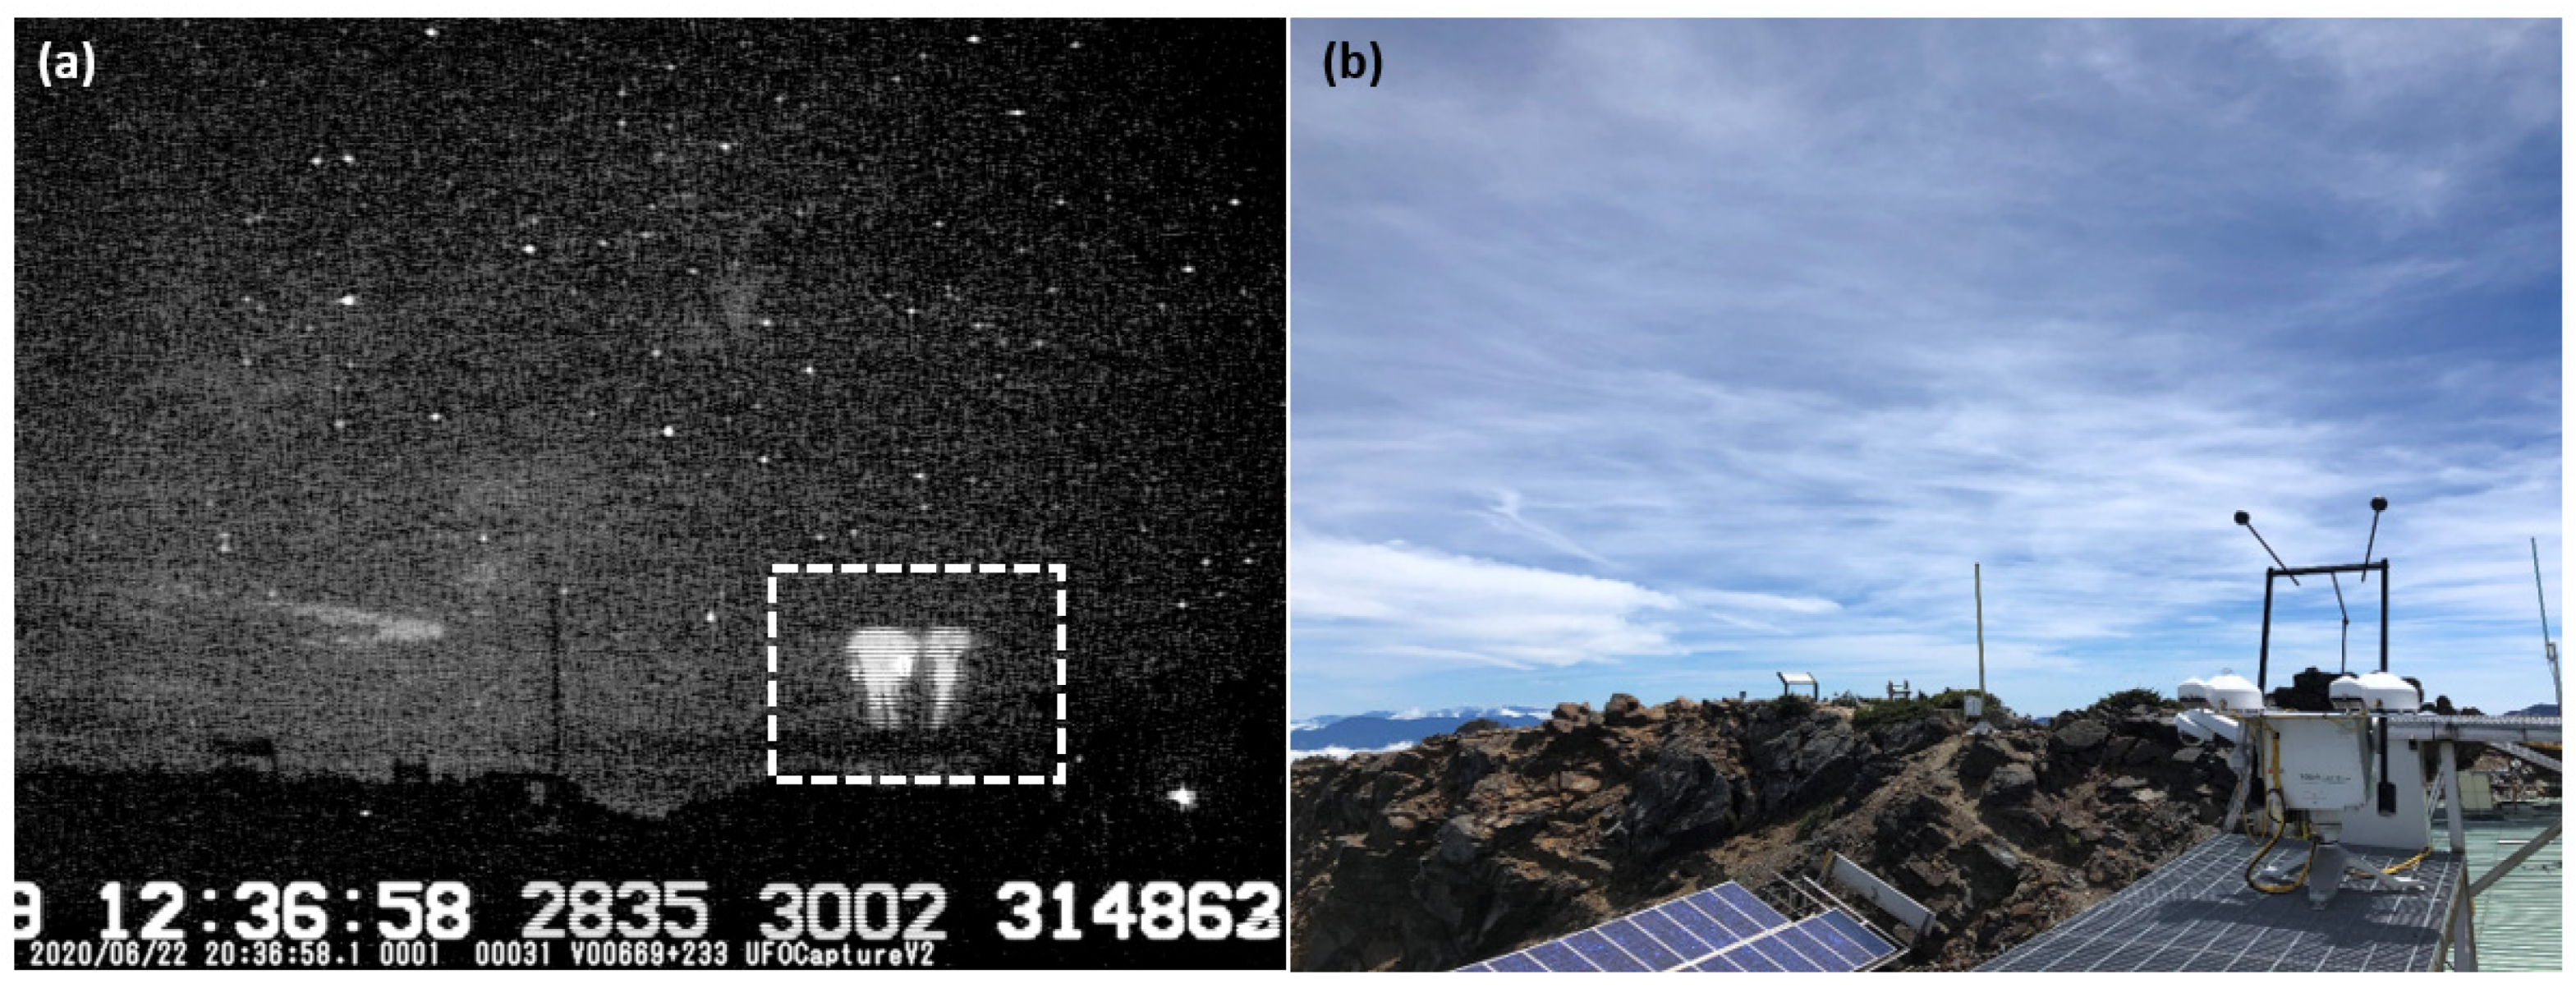
Figure 3a shows one of two sprite events observed by the low-light-level CCD with 30 fps at time 12:36:58 (UT) on June 22 in 2020, while Figure 3b shows a similar view of sky and landscape in the same direction in the daytime. The recorded image in Figure 3a was enhanced to show the background geometry and star fields for evaluating their local azimuthal and elevation angle, where the sprite events are indicated by rectangle dashed lines. We recorded two sprites, but the high-speed camera recorded no frames at that time. The other sprite events recorded at time 12:26:51(UT) without identified WWLLN lightning data are also listed in Table 1. For the sprite events at 12:26:51 (UT), the locally measured azimuthal angle was about 60°. That was consistent with our estimation of an azimuthal angle of 63° with the WWLLN determined lightning location (N 25.8752° and E 126.3395° in Table 1). The estimated distance was 605 km away from the observation site. If we assume the top of the sprite was at an altitude of 90 km, the corresponding elevation angle would be about 8.5°.
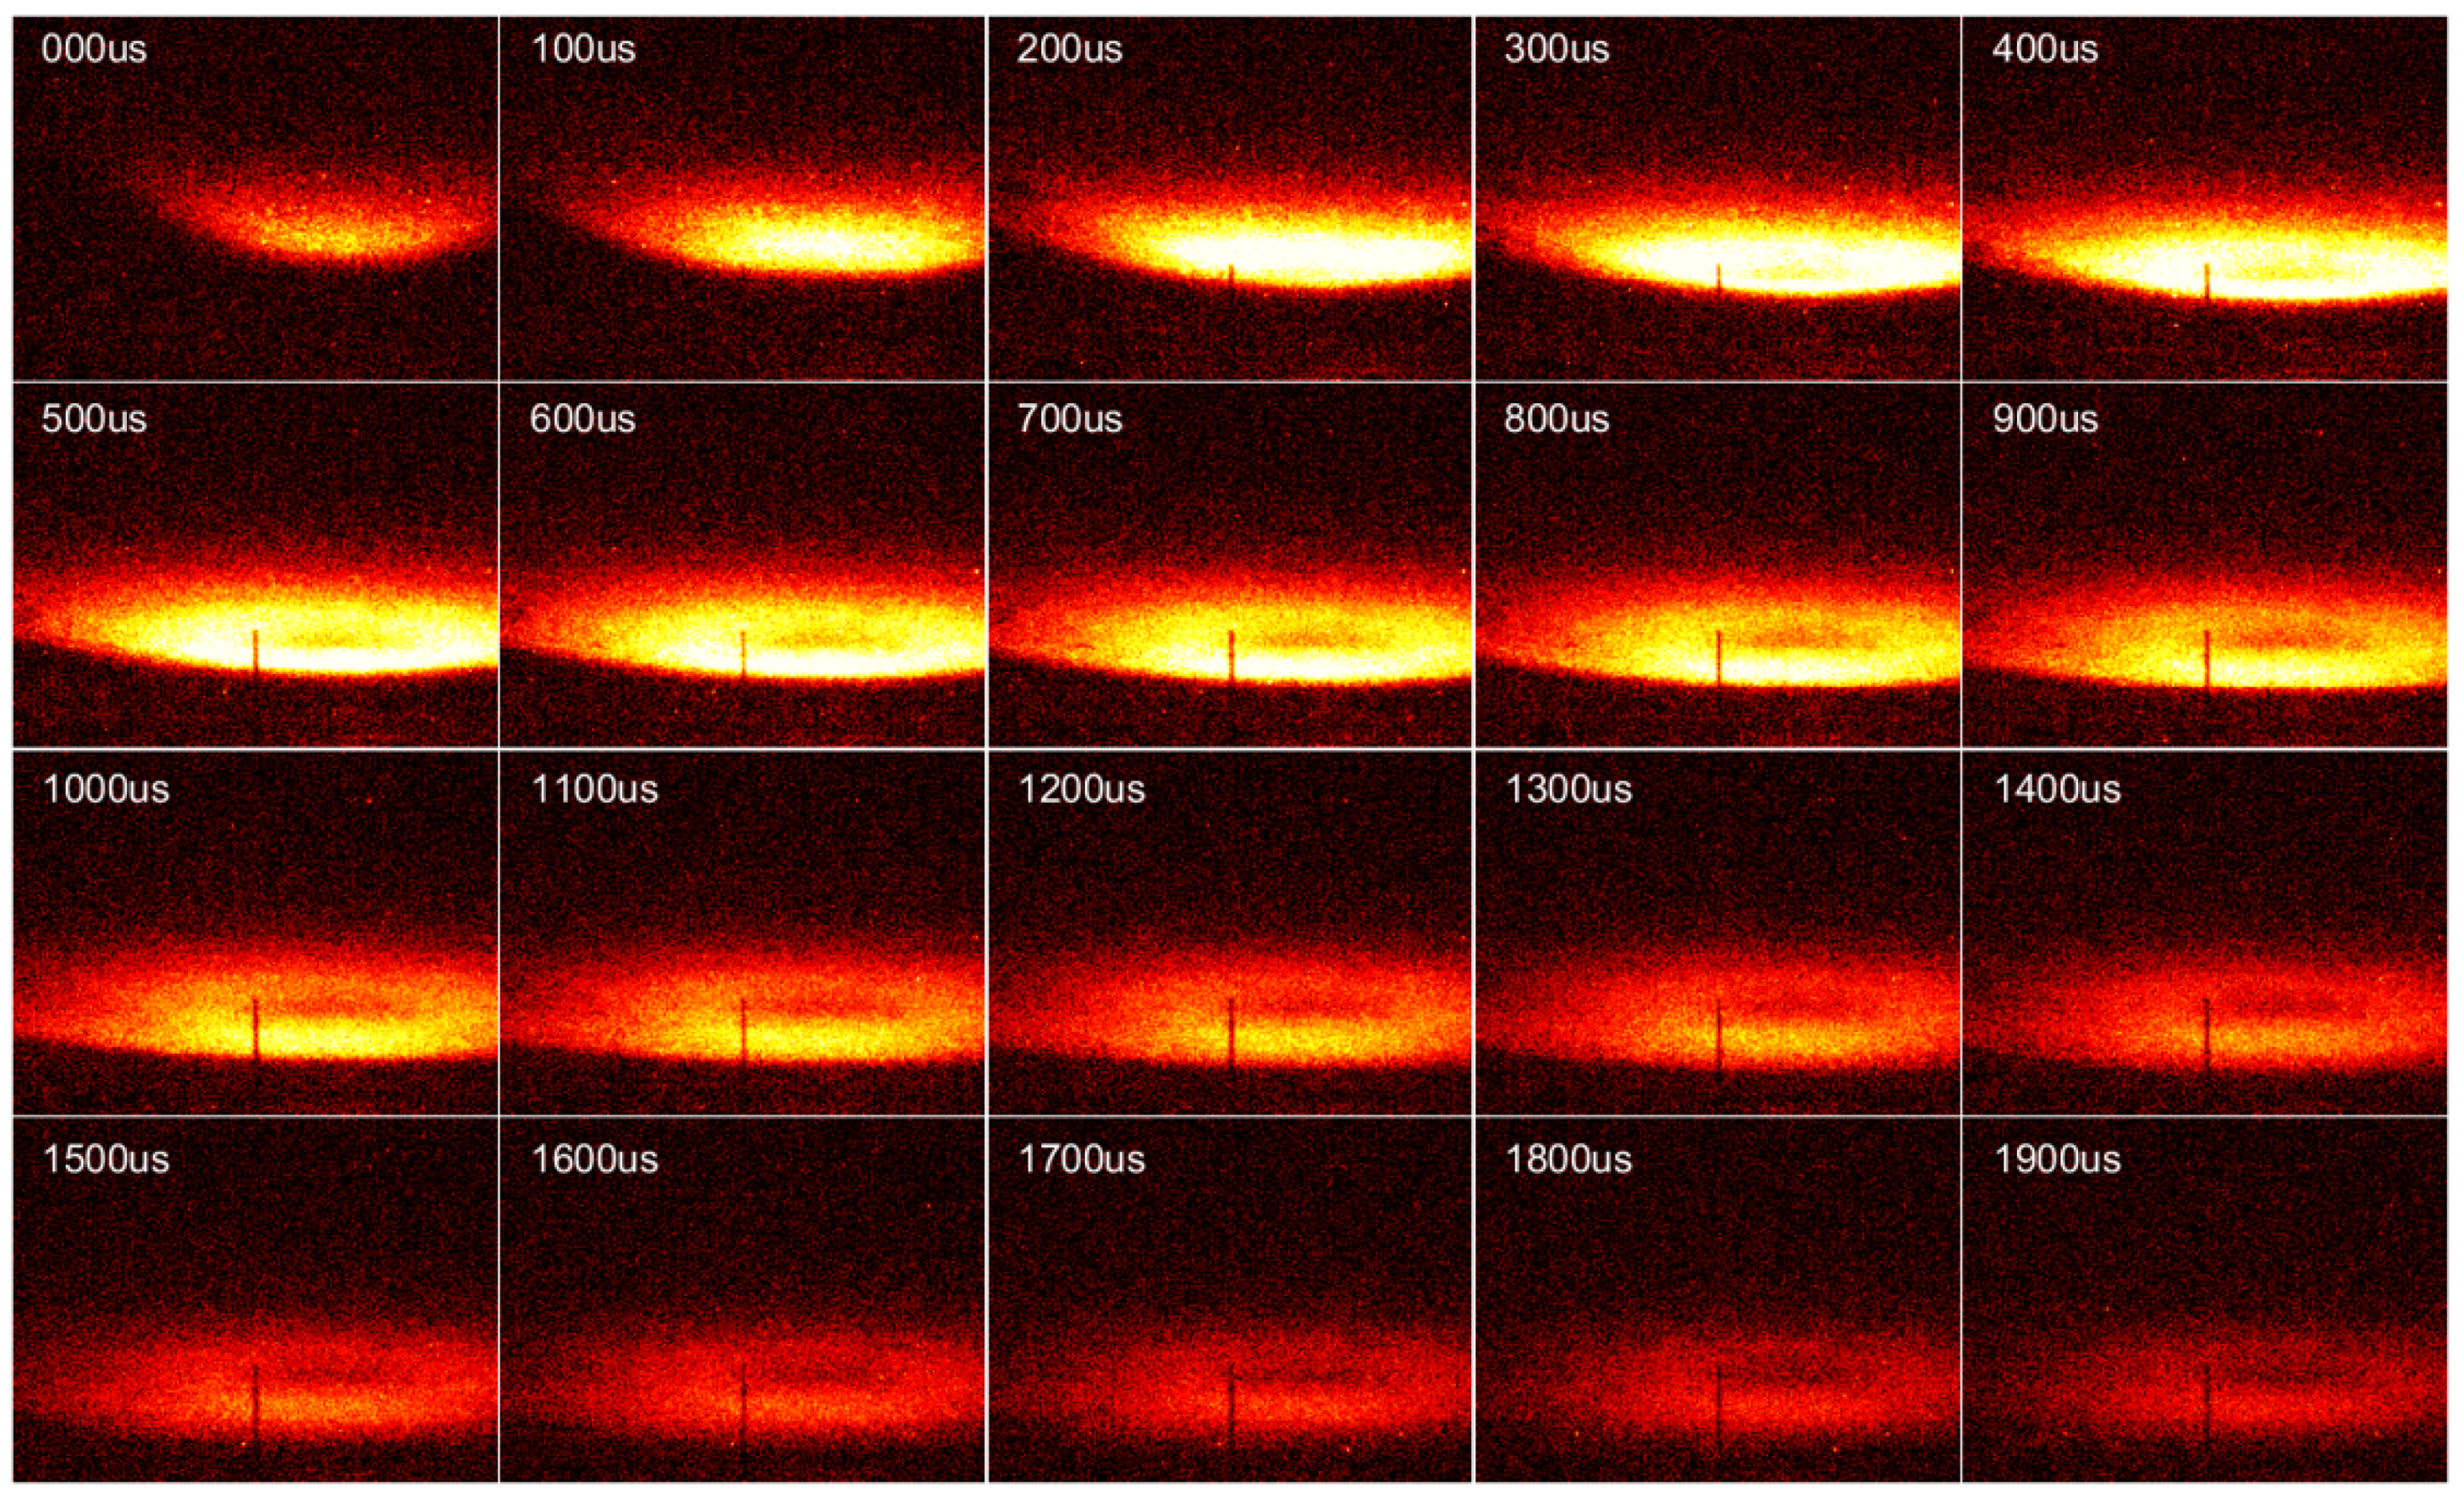
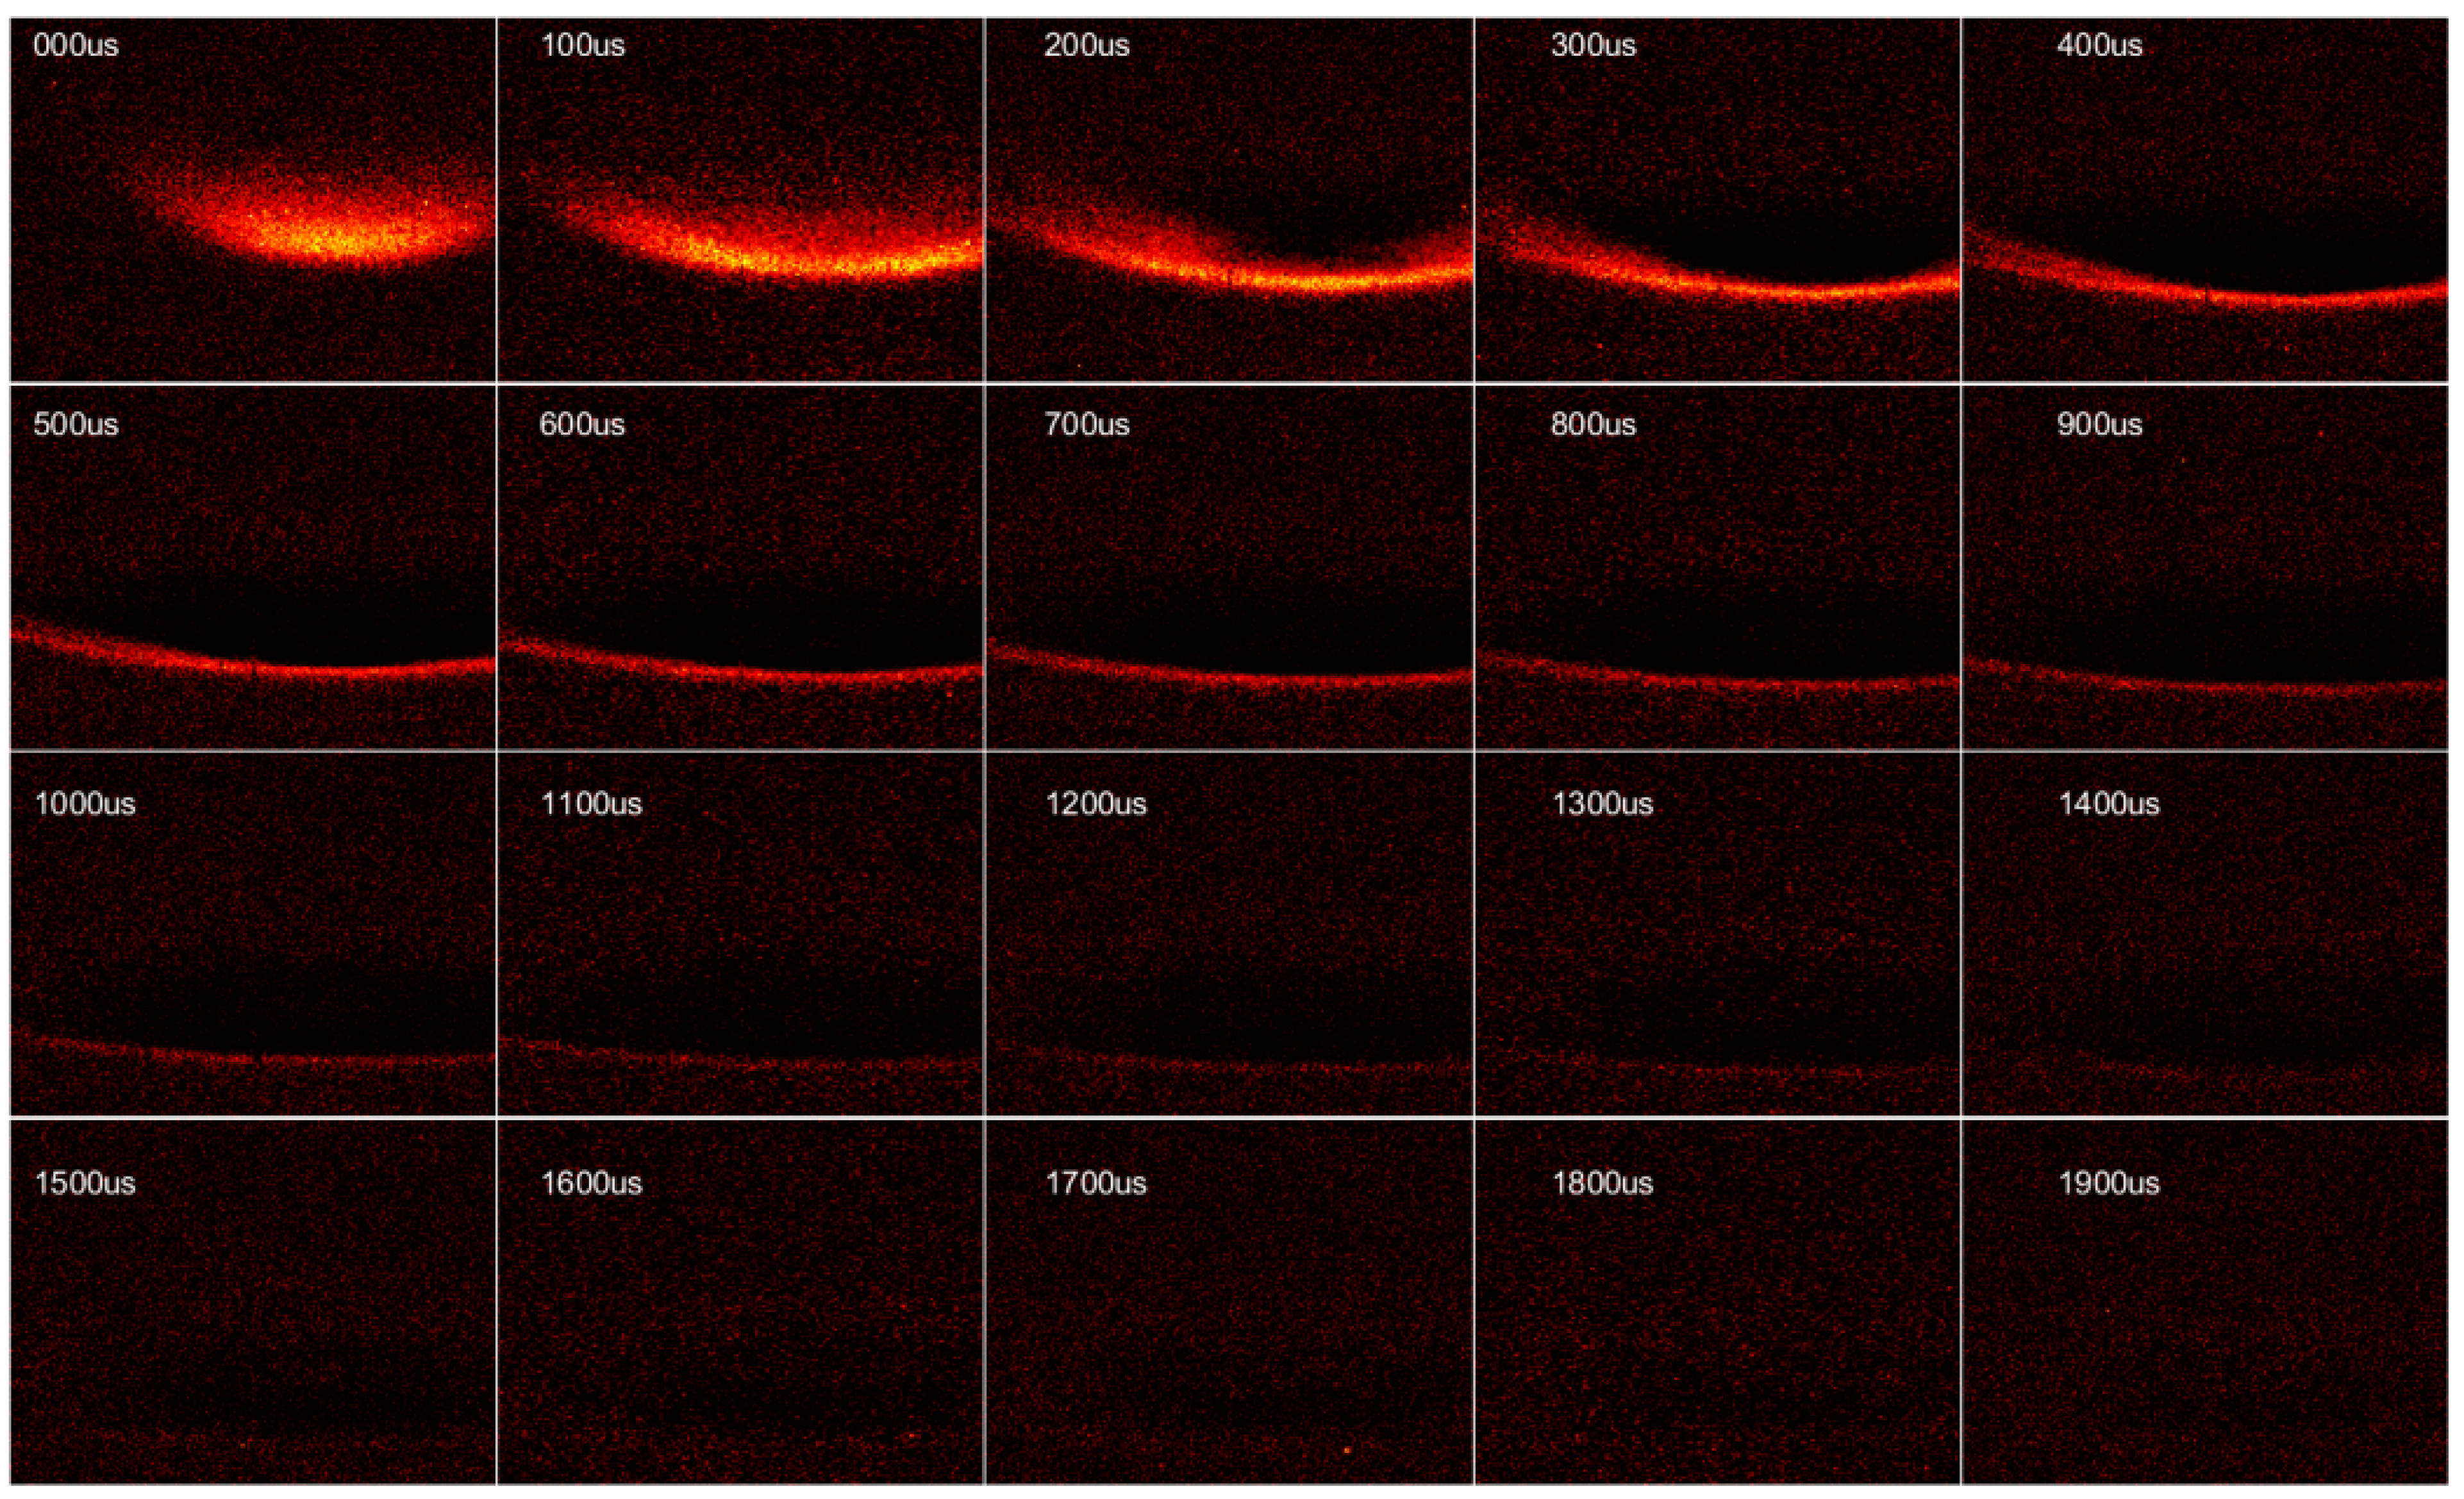
Figure 4 shows the image frames recorded by the high-speed camera (10,000 fps) at time 13:07:25.9316 (UT) on June 22 in 2020, where each frame exposure time is about 99 us. Since the image intensifier III type has a critical optical component of the Phosphor P-43, the photon persistence time of Phosphor P-43 was estimated to be a half-life time between 0.35 ms (dim features) and 0.70 ms (bright features) [42]. Therefore, for the high-speed camera with 10,000 fps, the persistence time of vision is expected to be the duration of 3–7 frames. For clarifying the disparities between the frames of Figure 4, Figure 5 shows the frame difference between the images of Figure 4, except for the first frame. It is noted that the lower emission edge of the elve event continuously decreased its elevation angle sequentially by time. This critical feature of the downward propagating elves emission confirmed the simulation results of the elves models from satellite and ground instruments [23,33].
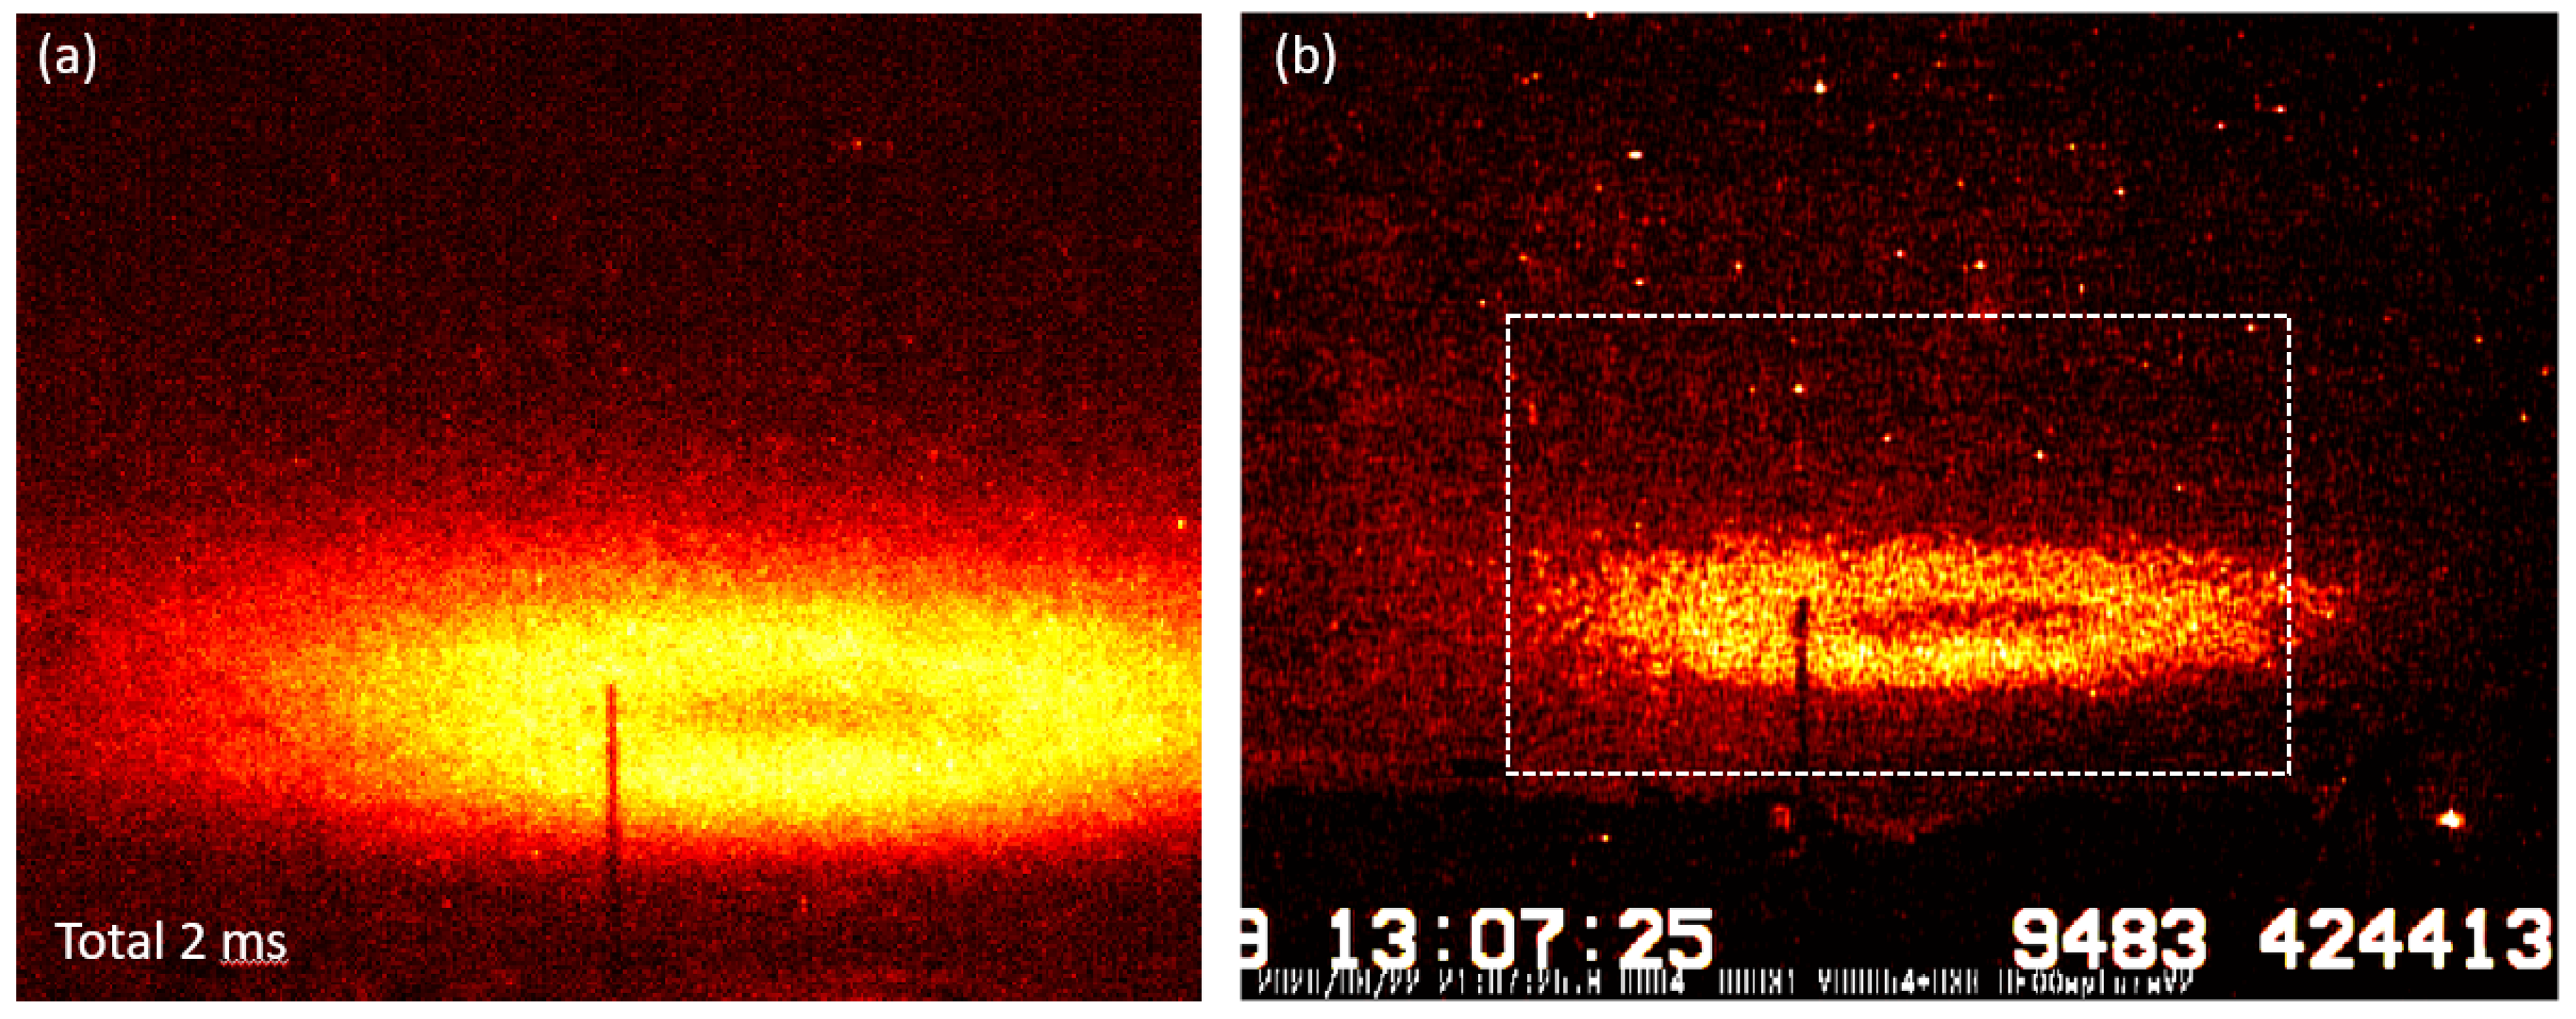
For reconstructing the donut structure of the elves emission, we integrated 20 high-speed camera-recorded frames, each with each a duration 100 us, which equals a total time of 2 ms. Figure 6 shows the reconstructed results between 10,000 fps and 30 fps image frames of the simultaneously recorded elve emission. Figure 6a indicates the first 2 ms time-integrated image from the high-speed camera frame sequence at time resolution 100 us in Figure 4 compared to the 16.7 ms time-integrated image frame in Figure 6b, recorded by the low-light-level CCD at the same time. The rectangular dashed lines indicate the relative position of two different camera recording frames. The reconstructed image from Figure 6a shows the direct observational evidence of the optical signatures for the elve emission recorded at higher speed (e.g., 10,000 fps). As shown in Figure 4, the vertical slicing of the donut-shaped elve emission at 10,000 fps reveals the crucial features of submillisecond resolving elve emission.
For further explanation of the elve and halo emission, we use the cartoon pictures to illustrate the elve and halo generation mechanisms in Figure 7a,b, respectively. In Figure 7a, the lightning-associated electromagnetic wave pulses (EMP) accelerate background electrons, and energized electrons collisionally excite the ambient molecular nitrogen and oxygen. The excited molecules spontaneously emit the photons and relax into the lower energy states. Thus, the EMP-excited emission outwardly propagates nearly at light-speed at 70–95 km altitudes. Similarly, shown in Figure 7b, the electrostatic field above the charges inside the cloud excites the halo emission at about 80 km in height.
Contrary to intuition, the camera-recorded lightning first arrives at the emission region through path (1) for the outer ring of elves since the traveling distance of the electromagnetic wave plus the light wave is shorter than that along paths (2) or (3). In the image sequence of elves recorded by the high-speed camera in Figure 4, we show the observational evidence to illustrate the scenario of recorded images at time resolution 100 us. The emission in the elve far-side ring first appears along the path (1) before that of the elves near-side rings along the paths (2) and (3). Hence, the light arrives first at the near-side outer ring path (1), then the near-side inner ring path (2), and finally for the far-side inner and outer ring path (3).
Figure 8 shows the 16.7 ms time-integrated image of two elves and two halos at UT time (a) 13:07:25.9316, (b) 13:56:28.3870, (c) 15:00:13.2524, and (d) 16:24:03.5149 on June 22 recorded by the low-light-level CCD in the campaign. We enhanced each image to show their essential characteristic of optical emissions. In Figure 8a,c, the broader donut-shaped elve emission was observed, and we estimated the diameter of those emission structures to be 115 and 120 km. In Figure 8b,d, for narrower disk-liked halo emission, the span of the horizontal emission had a width of 80–85 km.
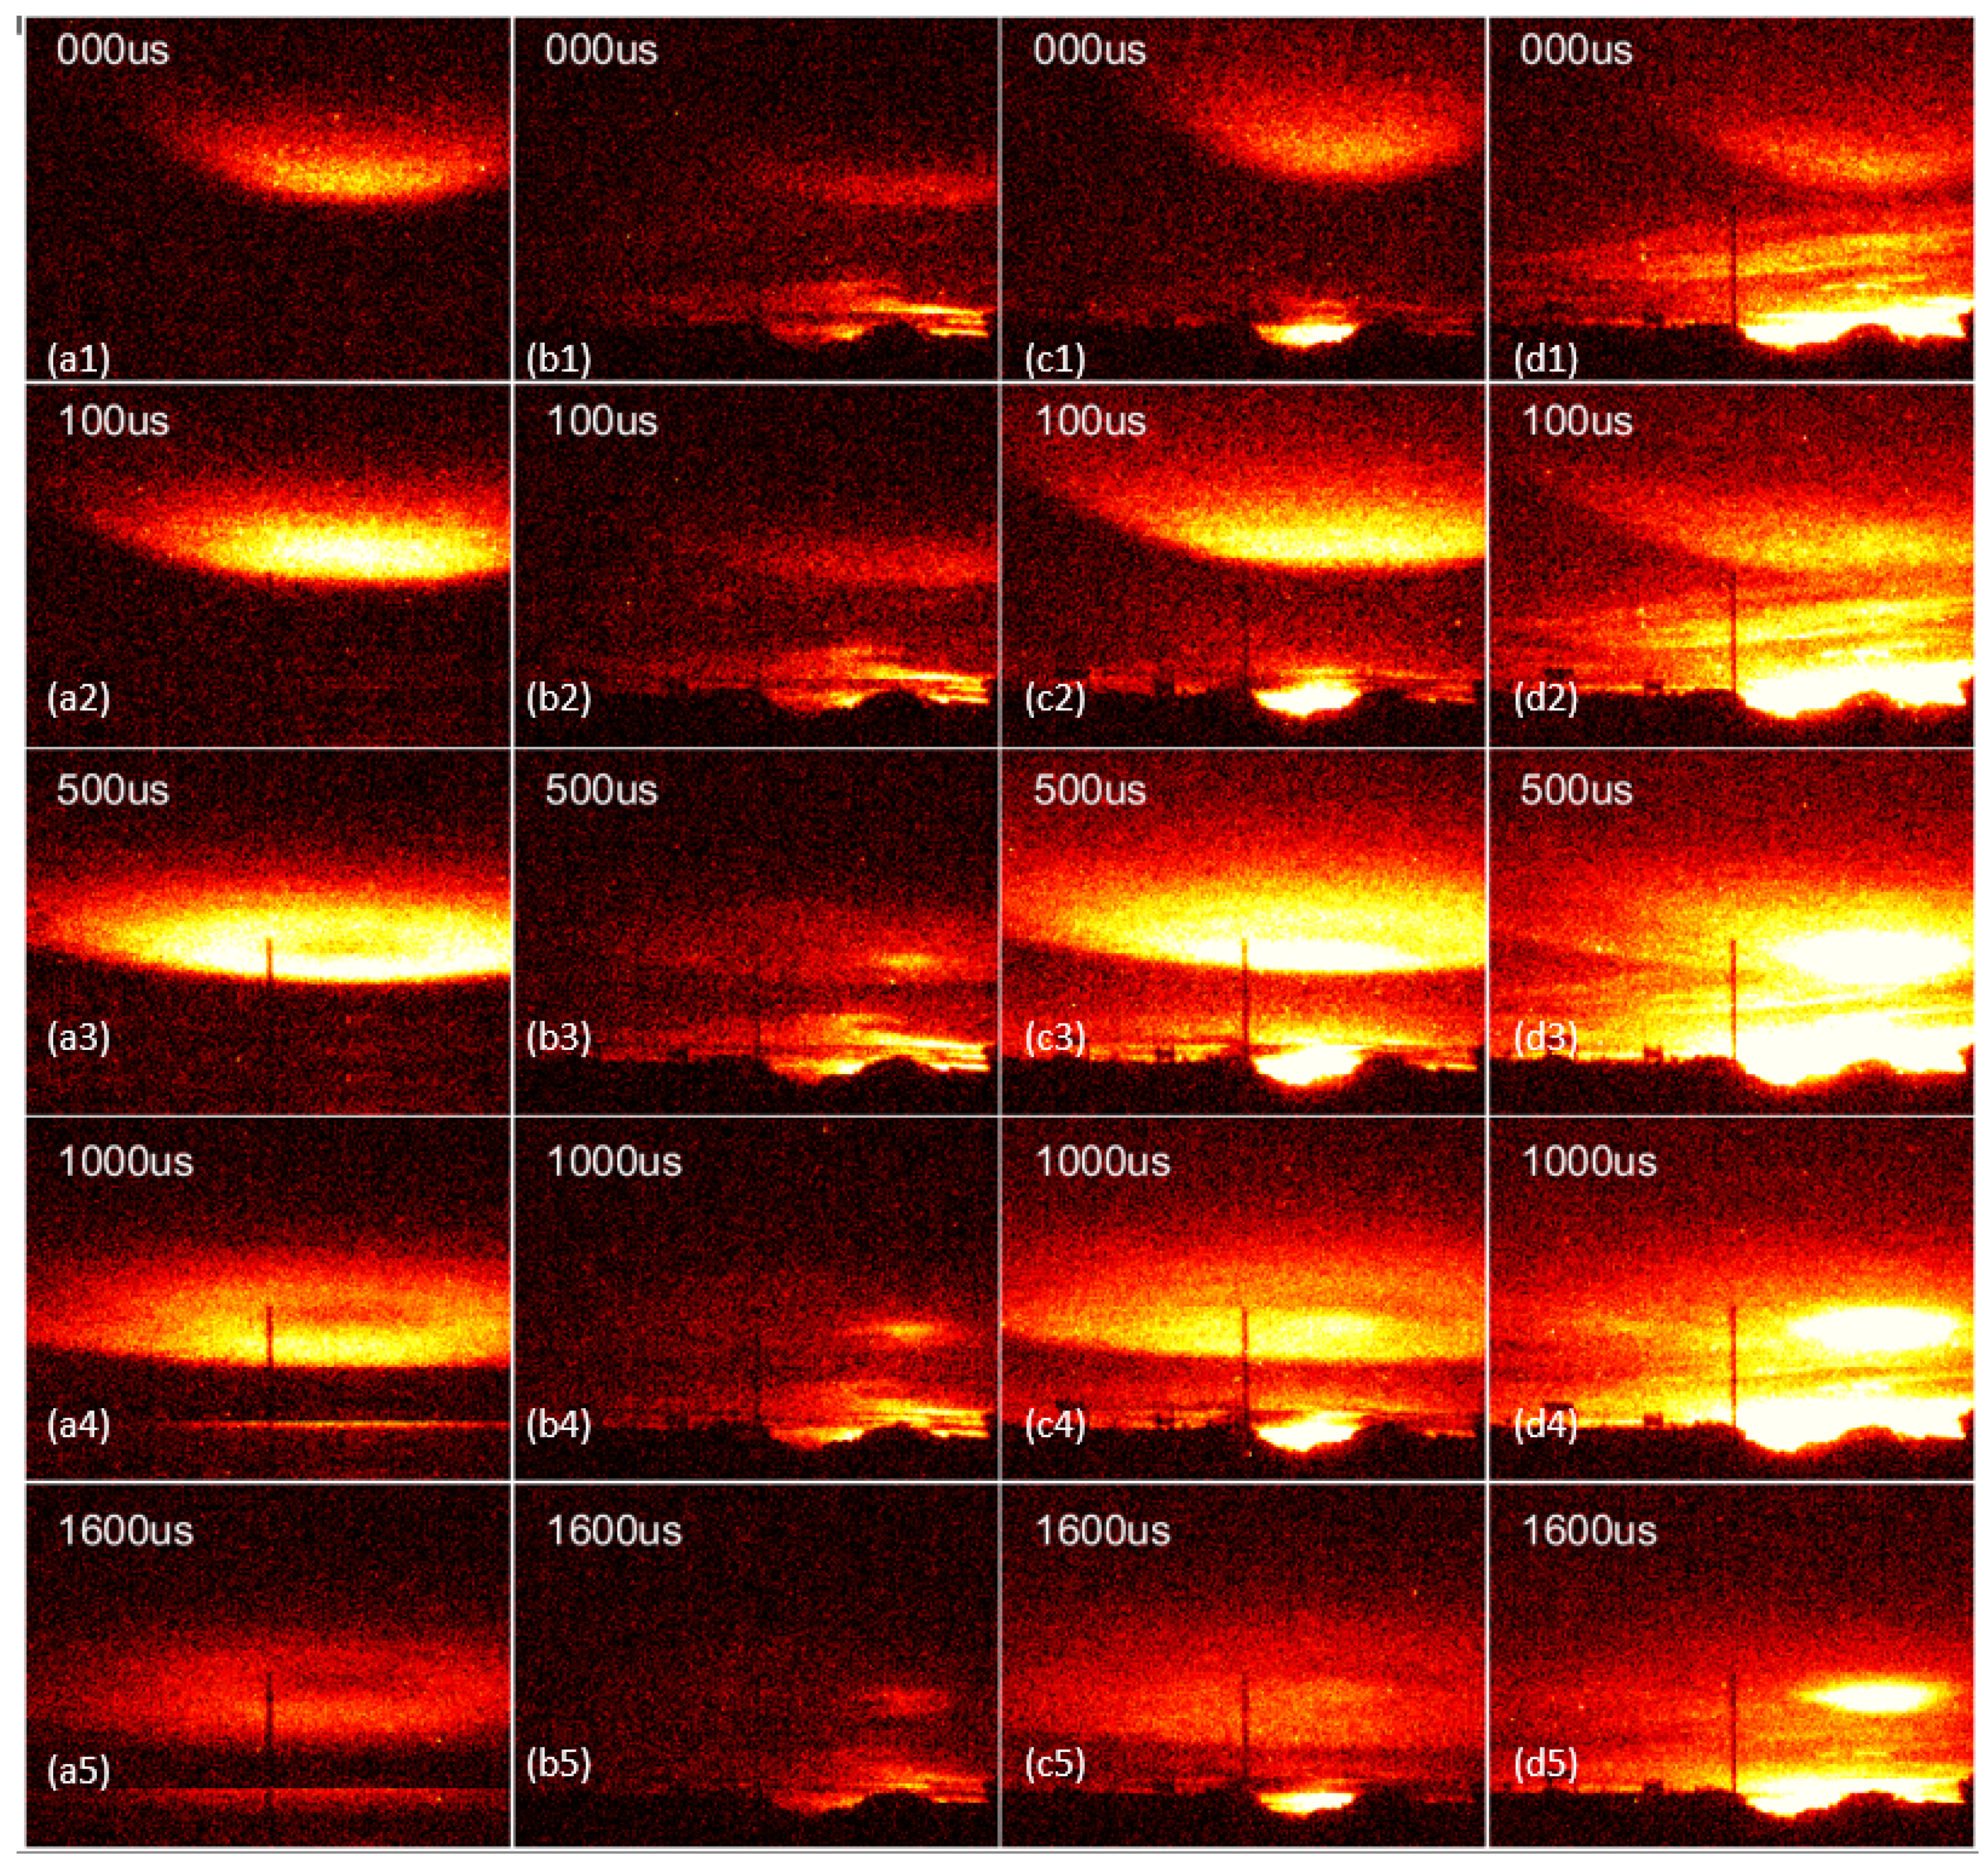
Figure 9 shows the high-speed image frames at selected times 0, 100, 500, 1000, and 1600 for the elve/halo/sprite halo events to manifest their similarity and disparity. The optical signatures of the elve/halo events first arrived at the highest elevation for common similarity. The luminosity of the elve/halo events suddenly appeared as a bowl-shaped object from the top in the first image frame in Figure 9(a1,b1,c1), and its elevation angle gradually decreased to form the whole topology of the elves/halo in Figure 9(a2–a5), Figure 9(b2–b5), and Figure 9(c2–c5).
In contrast, elves finally evolve into the entire toroidal structure, while halos converge into the smaller persisting emission disk. The converging effect in disk-shaped halos may indicate the possible strong electron impact emissions and have a more significant probability for the feasible plasma environment for the inception of sprite streamers. Unexpectedly, the extended glow of the halos in Figure 9(b3,d3) has a wider horizontal size, which was pretty close to the diameter of the elves in Figure 9(a3,c3). The characteristics of the extended glow for the halo emission were inconspicuous in the 16.7 ms time-integrated image in Figure 8b,d.
Recently, Pérez-Invernón [51] used a quasielectrostatic model and an electromagnetic wave model coupled with a detailed chemical scheme, and also simulated the temporal evolution of the halo and elve emission. In their simulation, the halo emission decreased its altitude since the neutralization of inducing charge relaxes the reduced electric field from higher to lower altitudes. The elve emission traced the peaks of the outward electromagnetic wave.
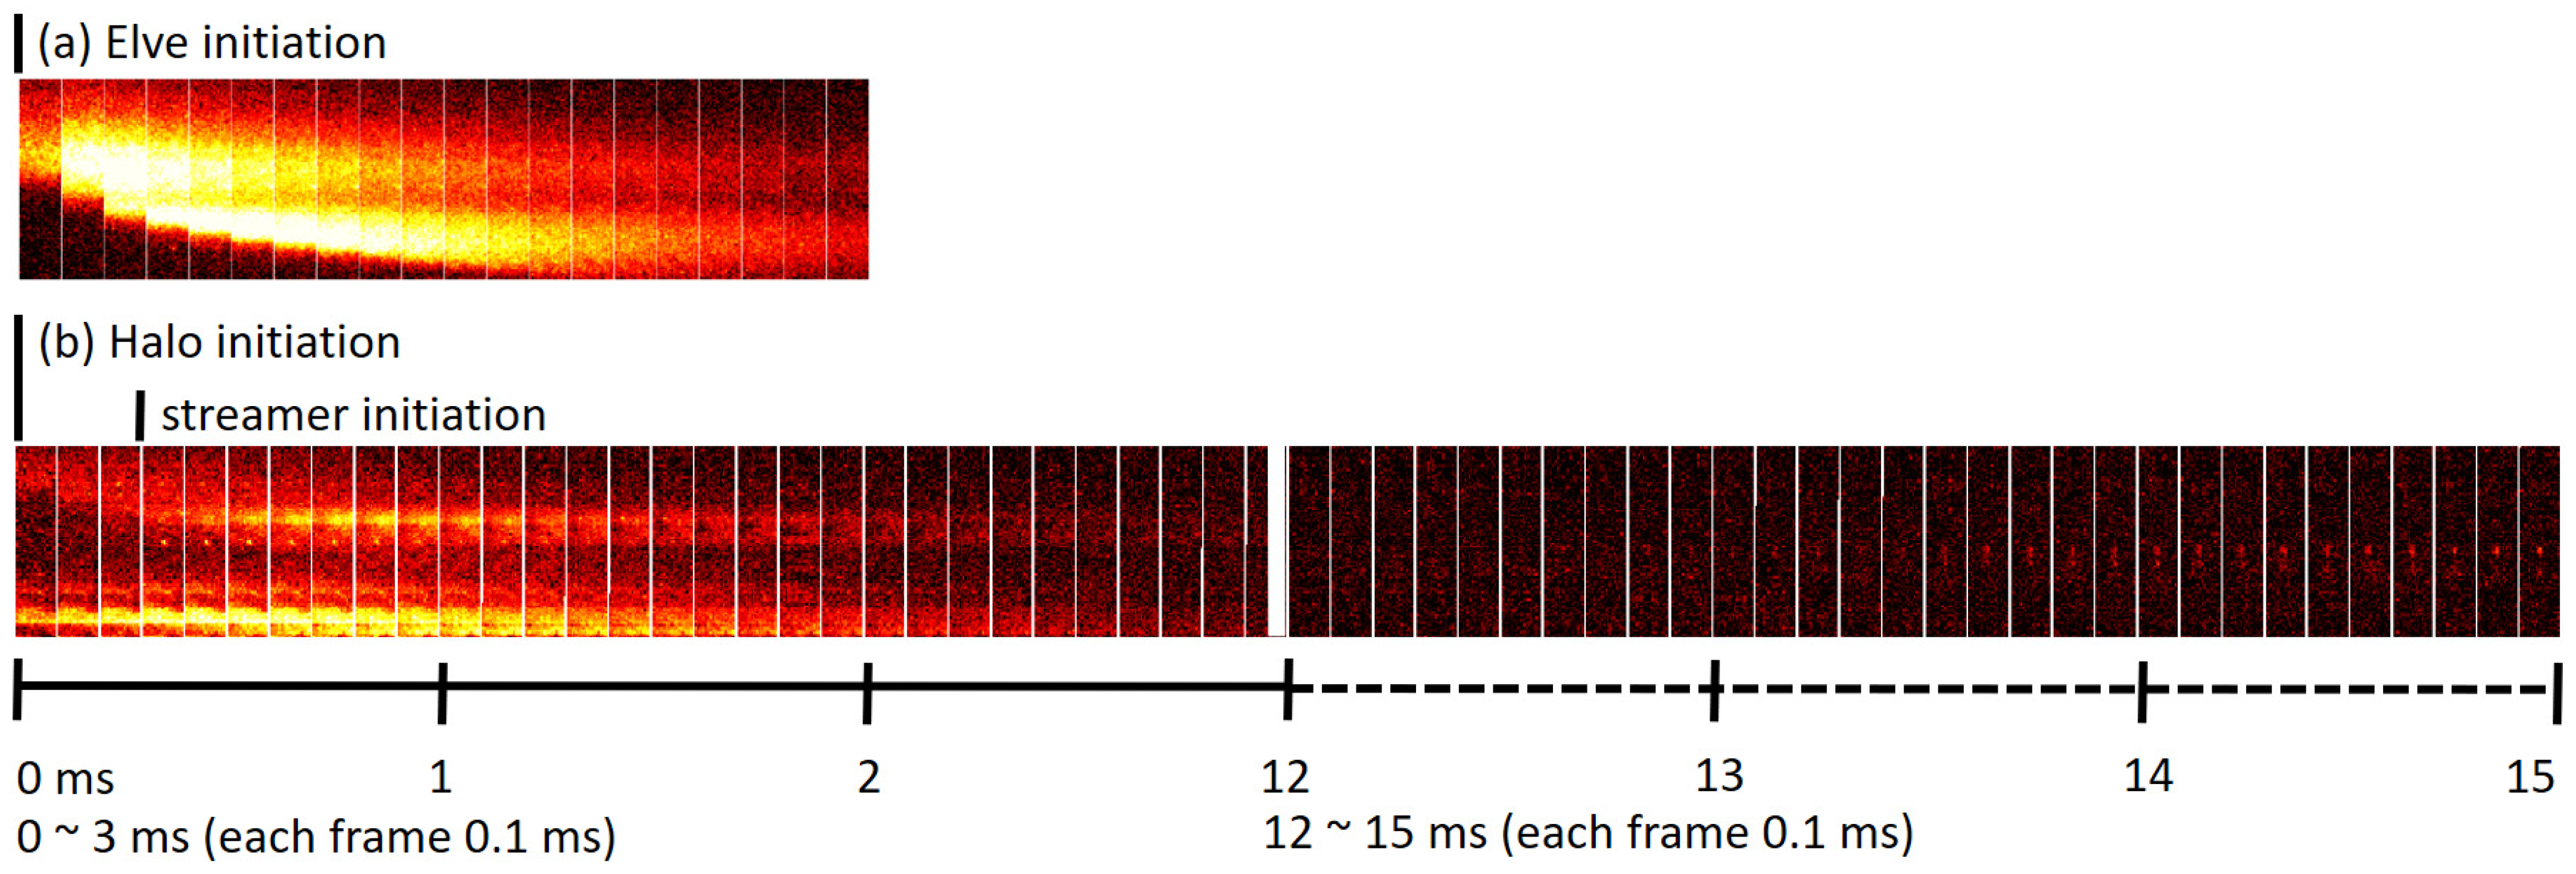
But in contrast from the simple geometry of modeling results, the elve emission was dramatically changed by the low-elevation viewing geometry in the ground campaign compared to the halo emission. Some previous works have studied the high-speed imaging effect on elves caused by lightning [23,33] or Terrestrial Gamma Ray Flashes [52], seeing the temporal development of the emission analyses in Figure 10a. Figure 10a shows the temporal evolution of the elve emission at center. At a low-elevation viewing angle, the elve emission projects into two strips because the near-side and the far-side of toroidal emission structure were integrated along the line-of-sight.
The WWLLN VLF data identified three of four elve/halo/sprite halo events. Fortunately, all events were associated with the ELF data at the Kuju station in Japan after EM propagation direction analyses. In Table 1, the lightning peak current associated with halo events was 118 and 172 kA, while that associated with elve events was smaller, about 58 kA. According to the locations of parent lightning determined by the WWLLN listed in Table 1, the lightning-induced elves from the ELF observation station had a distance of about ~1 Mm (960–980 km) and an azimuthal angle of ~214°, which was consistent with direction analyses from the ELF Lissajour Plot, as mentioned before.
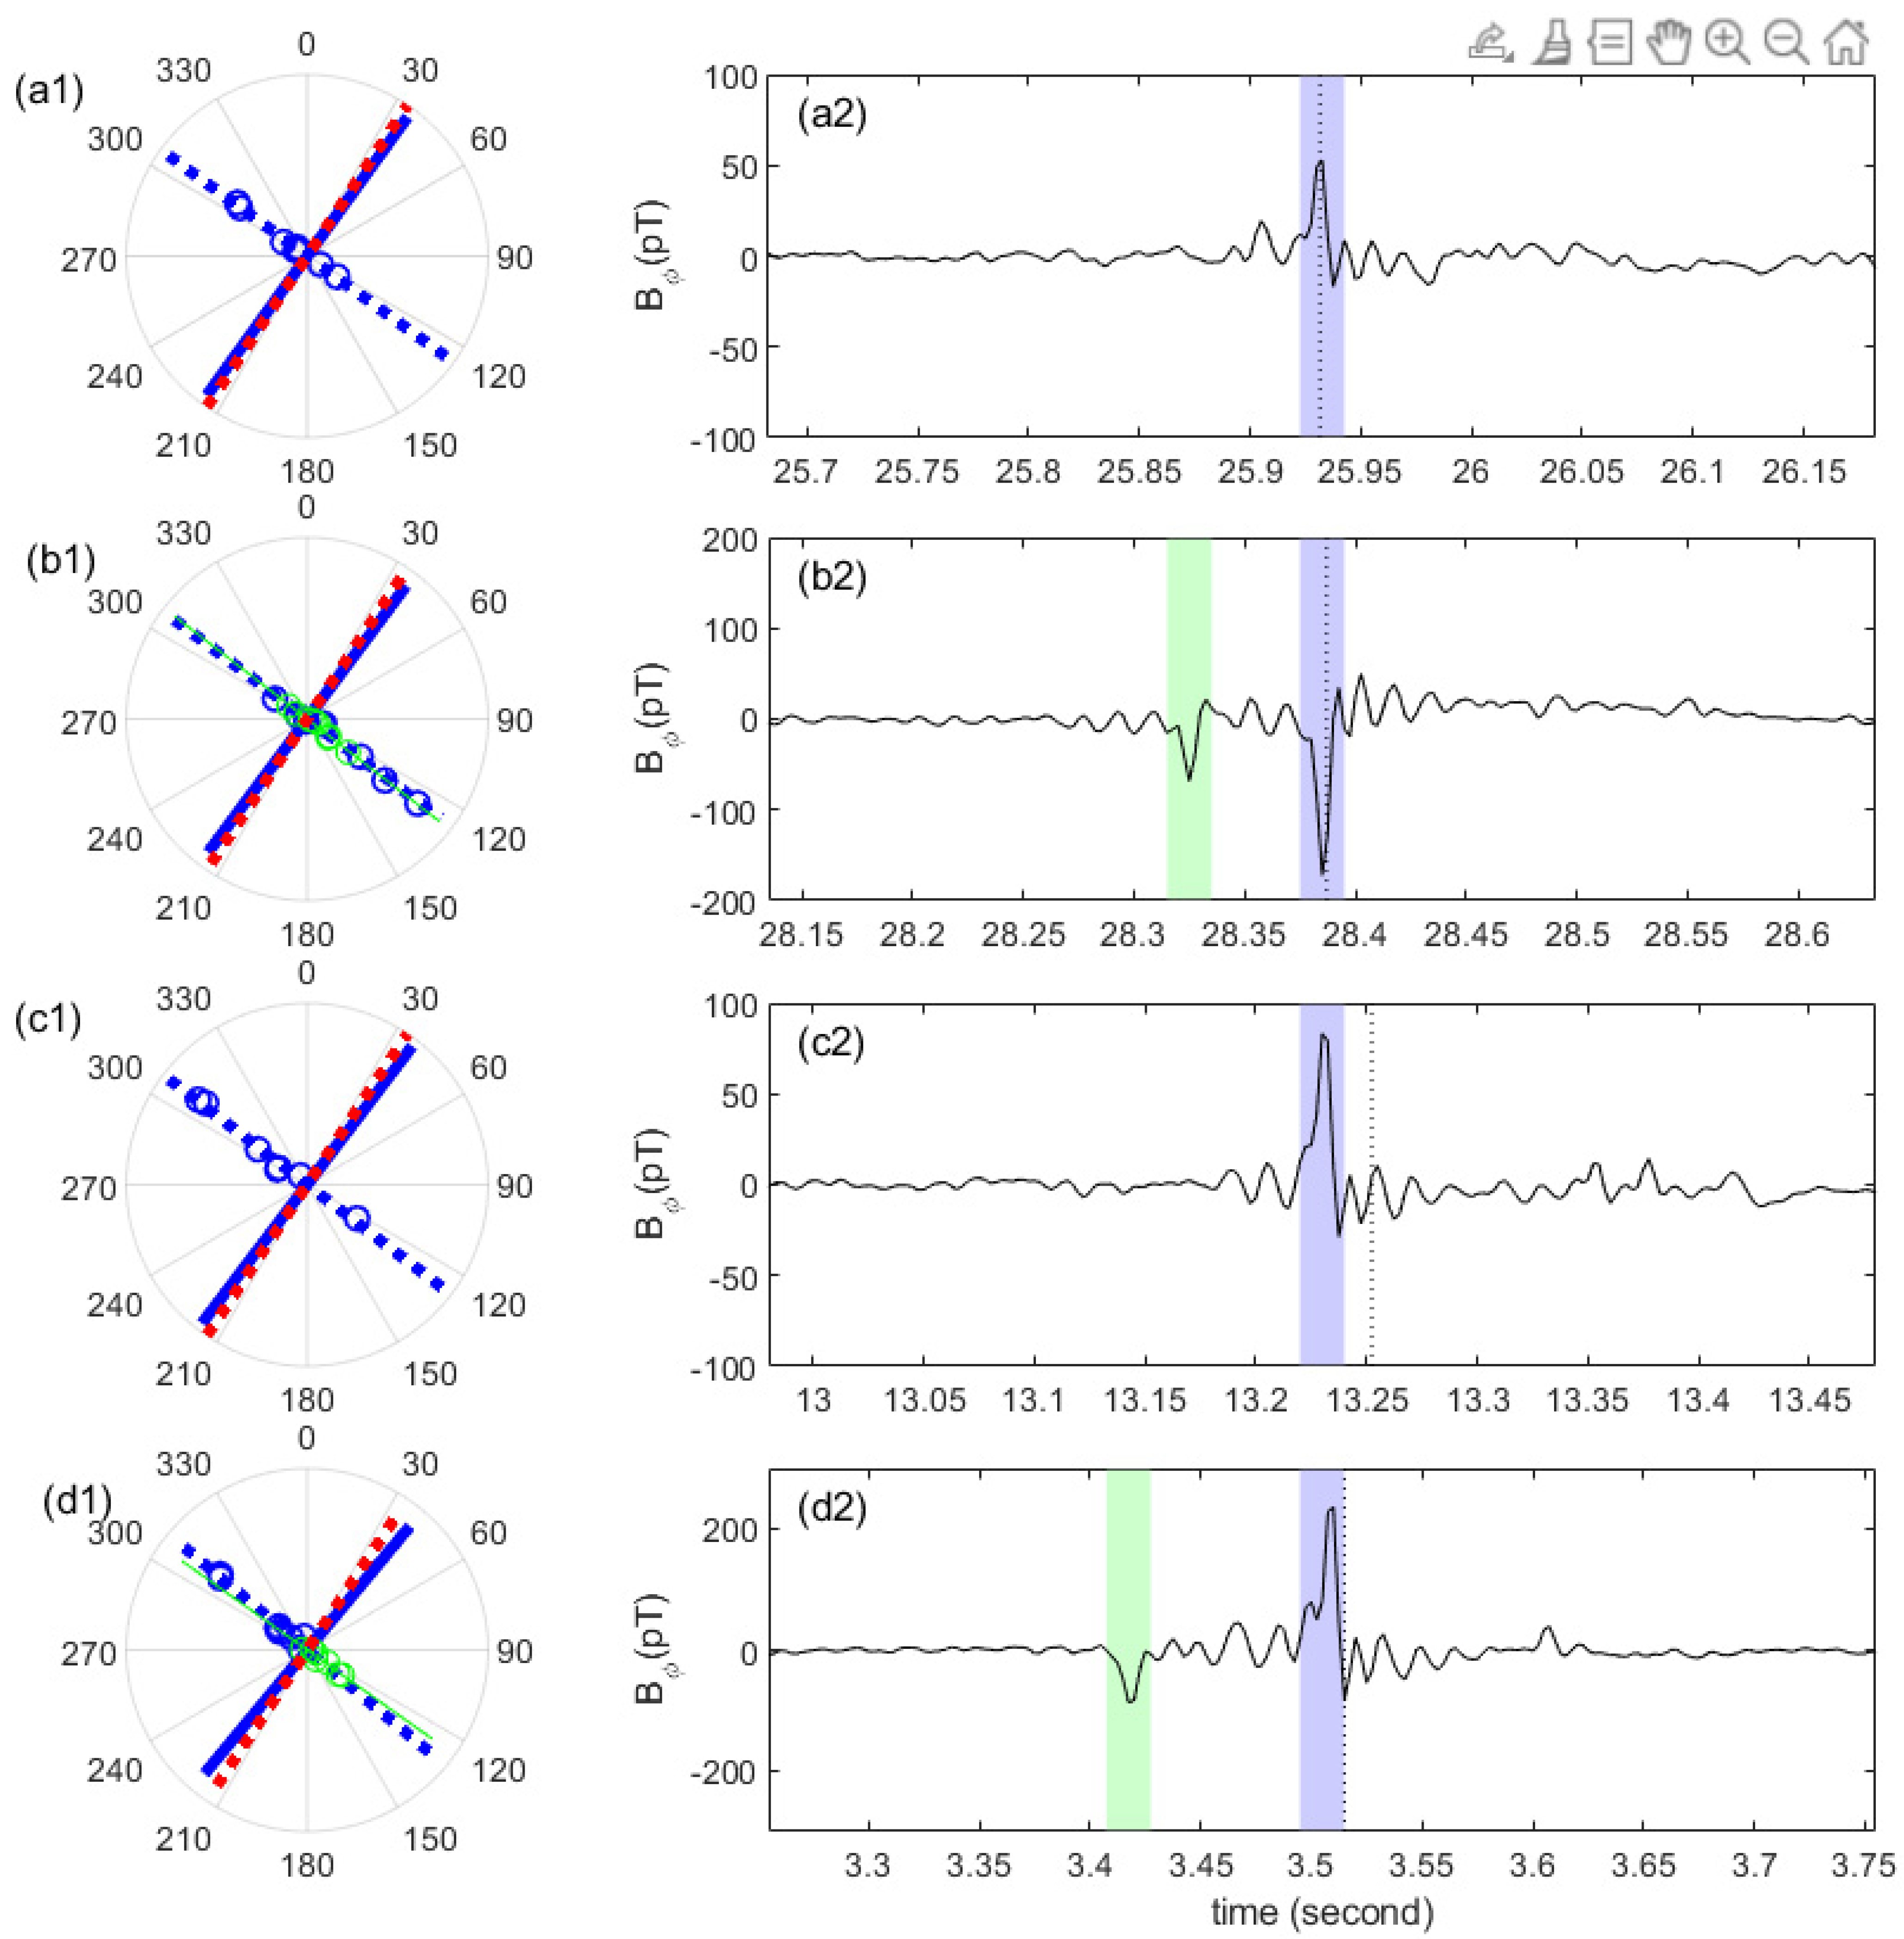
Figure 11 shows our analyses of the ELF data associated with the parent lightning of two elves, halo, and sprite halo events. In Figure 11, we analyzed the azimuthal angle of ELF sources with Lissajour Plots (left panels). In Figure 11 (right panels), we drew the azimuthal component (Bф) of ELF waveforms under the assumption of a wave source at the lightning location. Using the sferic waveforms Bф, we estimated CMC −135 and −402 C-km for elves-inducing CGs in panels (a2) and (c2) of Figure 11.
However, only (c2) had a peak current of 58 kA for corresponding WWLLN measurement. That may explain the missing flash event in WWLLN data at time 13:07:25.9316 due to the low CMC in (a2) compared to that in (c2). Table 1 shows that the lightning peak current (I) scaled well with the peaks of the ELF waveforms. If the WWLLN measured current in Table 1 is proportional to the extremes of the ELF waveforms in Figure 11(b2,c2,d2), we estimated that the elve-producing lightning at time 13:07:25.9316 had a peak current of ~36 kA corresponding to its peak 52.8 pT in Figure 11(a2). Barrington-Leigh [53] reported that the minimum required peak current of CGs for elve production is 56 kA. But there may be some exceptions (e.g., 36 kA in our case) since the VLF recorded waveform was only sensitive to vertical currents. The contribution from lightning horizontal currents was still undetectable at far distance.
For sprite halo/halo events, the estimated CMC of their causative CGs was +670 and −775 C-km, as shown in Figure 11(b2,d2), respectively. Their peak currents were 118 and 172 kA from WWLLN. For the causative CG CMC +670 C-km as shown in Figure 11(b2), the high-speed camera also recorded the streamer initiation at time 0.3 ms after the halo generation, shown in Figure 10b. Figure 10b shows the center-cropped image sequence to demonstrate the temporal characteristics of sprite halo emission. The sprite brightened again after 12 ms and lasted about 15 ms. Qin et al. [54] numerically studied the +/− CG polarity asymmetry on sprites generation, and suggested a minimum CMC of 350 C-km and 500 C-km for their parent lightning +CG and –CG, respectively. The numerical study on sprite initiation also requires the extra condition of the plasma irregularities or small-scale mesospheric [55,56]. That may imply that the actual minimum CMC is still uncertain.
For the pure halo without visible sprite streamers in Figure 8d and Figure 9(d1–d5), the halo-producing –CG with extraordinarily high CMC −750 C-km may be explained by previous studies. Williams et al. [27] found that halos whose causative -CG with extremely high CMC had no identifiable sprite structure. Besides, these halo events were also reported and associated with their causative –CG CMC between −750 to −1450 C-km [26]. Hence, it may explain why the higher value of CMC (−775 C-km) of causative –CG was still unable to incept the detected sprite streamers accompanied by the halos. Besides, CGs are usually associated with impulsive return strokes with less continuing current [54]. Their ELF data lacks the feature of large slow-tail continuing currents after CG pulses, which may not favor producing sprite streamers [57]. Barrington-Leigh [53] also reported the observed sprites associated with –CG of CMC 1340–1550 C-km, but their recorded sferics had the significant features of continuing currents.
In Figure 11(a2,c2), the elves were unambiguously correlated with a single stroke of waveforms. Interestingly, we identified a precursor-like pulse (green color region) appearing less than 60 and 80 ms before the associated sferics (blue color region) for the recorded halos in Figure 11(b2,d2), respectively. That may imply the precursor-like pulse may involve the triggering of lightning with higher energy to incept the halo production. Following the linear relationship between peak current and ELF peak values, the ELF peaks of the precursor-like pulse in Figure 11(b2,d2) were −68.3 and −87.2 pT. That corresponds to the peak currents of +46.8 and +63.5 kA. These associated lightning emissions were also simultaneously recorded by the low-light-level CCD. We conjecture that this precursor-like pulse could be in-cloud (IC) discharge. The polarity of causative IC implies the downward motion of positive leaders or the upward movement of negative leaders. These leaders may cause the charge imbalance inside the cloud and trigger the +CG and –CG later shown in Figure 11(b2,d2), respectively. It implies that this initiation lightning may play the role of triggering the lightning that generates halo/sprite halo with a higher power, as shown in the higher amplitude of the ELF waveform in the blue color region of Figure 11(b2,d2).

4. Conclusions

We conducted the Taiwan 2020 campaign at the Yushan weather station (120°57′06″. 23°29′21″.49) at 3845 m in Taiwan on 17–26 June 2020. On 22 June, a total of 6 TLEs were recorded, including two elves, one halo, one sprite halo, and two sprites. As shown in the 10,000 fps recorded image sequence in Figure 9 and Figure 10, the typical features of elves/halos are characterized by the gradually lowering elevation of the edge of their emissions. The integrated emission of elves/halos finally formed as their donut-shaped and disk-liked emission structure, respectively. The outer ring of the Halo glow was more extensive than expected in the typical 30 fps TV images and was equivalent to the standard size of observed elves. The extended light of the halos shrunk significantly and gradually united as an ultra-compact disk-shaped halo emission, not found in the previous observation of typical 30 fps TV imaging frames of halos.
We analyzed the parent lightning of observed TLE events using WWLLN VLF data in Table 1 and ELF data in Figure 11. For VLF data, the recorded energy of halo-producing lightning was 5036 and 9344 J, which is significantly larger than the 1607 J of that associated with elves. The causative CGs’ CMC of the sprite-producing halo had a value of +670 C-km, greater than the CMC of the elve-producing CGs in Table 1. However, the halo without a visible streamer had a higher CMC of −775 C-km. The halos-producing -CGs with extremely high CMC have been also reported by the literature [27,57].
We also found a precursor-like pulse (green color region) appearing at time 60/80 ms before the sprite halo/halo-associated sferics (blue color region) for the ELF data in Figure 11(b2,d2). The polarity of the pulse implies the downward/upward movement of positive/negative leaders inside the cloud. The precursor-like pulse may trigger lightning with higher energy and cause the inception of the halo-producing lightning.

Author Contributions

Methodology and data analysis, C.-M.H., C.-L.K. and M.S.; validation and investigation, T.-Y.H.; writing—original draft preparation, C.-M.H. and C.-L.K.; writing—review and editing, T.-Y.H.; supervision, L.-C.L.; observation site supports, N.-H.L. All authors have read and agreed to the published version of the manuscript.

Funding

This research was funded by MOST 109-2111-M-008-006 and MOST 108-2111-M-008-005 funded by Ministry of Science and Technology of Taiwan.

Institutional Review Board Statement

Not applicable.

Informed Consent Statement

Not applicable.

Data Availability Statement

The VLF Data used in this paper are available upon request on the WWLLN website (http://wwlln.net/, accessed on 30 July 2021). The ELF data from the Kuju station are directly available upon request from the author Mitsuteru Sato.

Acknowledgments

The authors wish to thank the assistance and support from Nei-Yuan Tang, Chien-Chung Chou, Observation Division Yu-Chi Lee, Shih-Yun Chou and the staff of the Yushan weather station at Central Weather Bureau and the Center for Astronautical Physics & Engineering of National Central University in Taiwan, and the World Wide Lightning Location Network (http://wwlln.net, accessed on 2 August 2020), a collaboration among over 50 universities and institutions, for providing the lightning location data used in this paper. T.-Y. Huang acknowledges support from the US NSF AGS-1903346 to The Pennsylvania State University.

Conflicts of Interest

The authors declare no conflict of interest.

References

  1. MacKenzie, T.; Toynbee, H. Meteorological phenomena. Nature 1886, 33, 26. [Google Scholar] [CrossRef] [Green Version]
  2. Lyons Ccm, W.A.; Nelson, T.E.; Armstrong, R.A.; Pasko, V.P.; Stanley, M.A. Upward Electrical Discharges From Thunderstorm Tops. Bull. Am. Meteorol. Soc. 2003, 84, 445. [Google Scholar] [CrossRef]
  3. Wilson, C.T.R. The electric field of a thunder-storm and some of its effects. Proc. Phys. Soc. Lond. 1925, 37A, 32D. [Google Scholar]
  4. Wilson, C.T.R. A theory of thundercloud electricity. Proc. Phys. Soc. Lond. 1956, 236A, 297–317. [Google Scholar]
  5. Vonnegut, B.; Vaughan, O.H., Jr.; Brook, M. Nocturnal Photographs Taken from a U-2 Airplane Looking Down on Tops of Clouds Illuminated by Lightning. Bull. Am. Meteorol. Soc. 1989, 70, 1263. [Google Scholar] [CrossRef] [Green Version]
  6. Franz, R.C.; Nemzek, R.J.; Winckler, J.R. Television Image of a Large Upward Electrical Discharge Above a Thunderstorm System. Science 1990, 249, 48. [Google Scholar] [CrossRef]
  7. Sato, M.; Mihara, M.; Adachi, T.; Ushio, T.; Morimoto, T.; Kikuchi, M.; Kikuchi, H.; Suzuki, M.; Yamazaki, A.; Takahashi, Y.; et al. Horizontal Distributions of Sprites Derived from the Jem-Glims Nadir Observations. J. Geophys. Res. 2016, 121, 3171. [Google Scholar] [CrossRef] [Green Version]
  8. Ren, H.; Lu, G.; Cummer, S.A.; Peng, K.M.; Lyons, W.A.; Liu, F.; Li, X.; Wang, Y.; Zhang, S.; Cheng, Z. Comparison between High-Speed Video Observation of Sprites and Broadband Sferic Measurements. Geophys. Res. Lett. 2021, 48, e2021GL093094. [Google Scholar] [CrossRef]
  9. Gordillo-Vázquez, F.J.; Pérez-Invernón, F.J. A Review of the Impact of Transient Luminous Events on the Atmospheric Chemistry: Past, Present, and Future. Atmos. Res. 2021, 252, 105432. [Google Scholar] [CrossRef]
  10. SSurkov, V.V.; Hayakawa, M. Progress in the Study of Transient Luminous and Atmospheric Events: A Review. Surv. Geophys. 2020, 41, 1101. [Google Scholar] [CrossRef]
  11. Stenbaek-Nielsen, H.C.; McHarg, M.G.; Haaland, R.; Luque, A. Optical Spectra of Small-Scale Sprite Features Observed at 10,000 Fps. J. Geophys. Res. 2020, 125, e33170. [Google Scholar] [CrossRef]
  12. Neubert, T.; Østgaard, N.; Reglero, V.; Chanrion, O.; Heumesser, M.; Dimitriadou, K.; Christiansen, F.; Budtz-Jørgensen, C.; Kuvvetli, I.; Rasmussen, I.L.; et al. A Terrestrial Gamma-Ray Flash and Ionospheric Ultraviolet Emissions Powered by Lightning. Science 2020, 367, 183. [Google Scholar] [CrossRef]
  13. van der Velde, O.A.; Montanyà, J.; López, J.A.; Cummer, S.A. Gigantic Jet Discharges Evolve Stepwise through the Middle Atmosphere. Nat. Commun. 2019, 10, 4350. [Google Scholar] [CrossRef] [Green Version]
  14. Yang, J.; Liu, N.; Sato, M.; Lu, G.; Wang, Y.; Feng, G. Characteristics of Thunderstorm Structure and Lightning Activity Causing Negative and Positive Sprites. J. Geophys. Res. 2018, 123, 8190. [Google Scholar] [CrossRef]
  15. Yang, J.; Sato, M.; Liu, N.; Lu, G.; Wang, Y.; Wang, Z. A Gigantic Jet Observed over an Mesoscale Convective System in Midlatitude Region. J. Geophys. Res. 2018, 123, 977. [Google Scholar] [CrossRef]
  16. Bózsef, B. Optically Perceptible Characteristics of Sprites Observed in Central Europe in 2007–2009. J. Atmos. Sol. Terr. Phys. 2013, 92, 151. [Google Scholar]
  17. Bór, J.; Zelkó, Z.; Hegedüs, T.; Jäger, Z.; Mlynarczyk, J.; Popek, M.; Betz, H.D. On the Series of +Cg Lightning Strokes in Dancing Sprite Events. J. Geophys. Res. 2018, 123, 11-030. [Google Scholar] [CrossRef] [Green Version]
  18. Wescott, E.M.; Stenbaek-Nielsen, H.C.; Sentman, D.D.; Heavner, M.J.; Moudry, D.R.; Sabbas, F.T.S. Triangulation of sprites, associated halos and their possible relation to causative lightning and micrometeors. J. Geophys. Res. 2001, 106, 10467. [Google Scholar] [CrossRef] [Green Version]
  19. Boeck, W.L.; Vaughan, O.H., Jr.; Blakeslee, R.; Vonnegut, B.; Brook, M. Lightning induced brightening in the airglow layer. Geophys. Res. Lett. 1992, 19, 99–102. [Google Scholar] [CrossRef]
  20. Boeck, W.L.; Vaughan, O.H.; Blakeslee, R.J.; Vonnegut, B.; Brook, M. The role of the space shuttle videotapes in the discovery of sprites, jets and elves. J. Atmos. Terr. Phys. 1998, 60, 669–677. [Google Scholar] [CrossRef]
  21. Boeck, W.L.; Vaughan, O.H.; Blakeslee, R.J.; Vonnegut, B.; Brook, M.; McKune, J. Observations of lightning in the stratosphere. J. Geophys. Res. 1995, 100, 1465–1476. [Google Scholar] [CrossRef]
  22. Fukunishi, H.; Takahashi, Y.; Kubota, M.; Sakanoi, K.; Inan, U.S.; Lyons, W.A. Elves: Lightning-induced transient luminous events in the lower ionosphere. Geophys. Res. Lett. 1996, 23, 2157–2160. [Google Scholar] [CrossRef]
  23. Barrington-Leigh, C.P.; Inan, U.S.; Stanley, M. Identification of sprites and elves with intensified video and broadband array photometry. J. Geophys. Res. 2001, 106, 1741. [Google Scholar] [CrossRef]
  24. Bering, E.A.; Benbrook, J.R.; Garrett, J.A.; Paredes, A.M.; Wescott, E.M.; Moudry, D.R.; Sentman, D.D.; Stenbaek-Nielsen, H.C.; Lyons, W.A. Sprite and elve electrodynamics. Adv. Space Res. 2002, 30, 2585. [Google Scholar] [CrossRef]
  25. Frey, H.U.; Mende, S.B.; Cummer, S.A.; Li, J.; Adachi, T.; Fukunishi, H.; Takahashi, Y.; Chen, A.B.; Hsu, R.-R.; Su, H.-T.; et al. Halos generated by negative cloud-to-ground lightning. Geophys. Res. Lett. 2007, 34, L18801. [Google Scholar] [CrossRef] [Green Version]
  26. Kuo, C.L.; Williams, E.; Bór, J.; Lin, Y.H.; Lee, L.J.; Huang, S.M.; Chou, J.K.; Chen, A.B.; Su, H.T.; Hsu, R.R.; et al. Ionization emissions associated with N2+ 1N band in halos without visible sprite streamers. J. Geophys. Res. 2013, 118, 5317. [Google Scholar] [CrossRef]
  27. Williams, E.; Kuo, C.-L.; Bór, J.; Sátori, G.; Newsome, R.; Adachi, T.; Boldi, R.; Chen, A.; Downes, E.; Hsu, R.R.; et al. Resolution of the sprite polarity paradox: The role of halos. Radio Sci. 2012, 47, RS2002. [Google Scholar] [CrossRef]
  28. Montanyã, J.; van der Velde, O.; Romero, D.; March, V.; Solã, G.; Pineda, N.; Arrayas, M.; Trueba, J.L.; Reglero, V.; Soula, S. High-speed intensified video recordings of sprites and elves over the western Mediterranean Sea during winter thunderstorms. J. Geophys. Res. 2010, 115, A00E18. [Google Scholar] [CrossRef] [Green Version]
  29. Pasko, V.P.; Qin, J.; Celestin, S. Toward Better Understanding of Sprite Streamers: Initiation, Morphology, and Polarity Asymmetry. Surv. Geophys. 2013, 34, 797. [Google Scholar] [CrossRef]
  30. Stanley, M.; Krehbiel, P.; Brook, M.; Moore, C.; Rison, W.; Abrahams, B. High speed video of initial sprite development. Geophys. Res. Lett. 1999, 26, 3201. [Google Scholar] [CrossRef]
  31. Stenbaek-Nielsen, H.C.; Kanmae, T.; McHarg, M.G.; Haaland, R. High-Speed Observations of Sprite Streamers. Surv. Geophys. 2013, 34, 769. [Google Scholar] [CrossRef] [Green Version]
  32. Pérez-Invernón, F.J.; Luque, A.; Gordillo-Vázquez, F.J.; Sato, M.; Ushio, T.; Adachi, T.; Chen, A.B. Spectroscopic Diagnostic of Halos and Elves Detected From Space-Based Photometers. J. Geophys. Res. 2018, 123, 12–917. [Google Scholar] [CrossRef]
  33. Kuo, C.-L.; Chen, A.B.; Lee, Y.J.; Tsai, L.Y.; Chou, R.K.; Hsu, R.R.; Su, H.T.; Lee, L.C.; Cummer, S.A.; Frey, H.U.; et al. Modeling elves observed by FORMOSAT-2 satellite. J. Geophys. Res. 2007, 112, A11312. [Google Scholar] [CrossRef] [Green Version]
  34. van der Velde, O.A.; Montanyà, J. Statistics and variability of the altitude of elves. Geophys. Res. Lett. 2016, 43, 5467. [Google Scholar] [CrossRef] [Green Version]
  35. Barrington-Leigh, C.P.; Inan, U.S. Elves triggered by positive and negative lightning discharges. Geophys. Res. Lett. 1999, 26, 683. [Google Scholar] [CrossRef] [Green Version]
  36. Inan, U.S.; Barrington-Leigh, C.; Hansen, S.; Glukhov, V.S.; Bell, T.F.; Rairden, R. Rapid lateral expansion of optical luminosity in lightning-induced ionospheric flashes referred to as ‘elves’. Geophys. Res. Lett. 1997, 24, 583–586. [Google Scholar] [CrossRef]
  37. Inan, U.S.; Bell, T.F.; Rodriguez, J.V. Heating and ionization of the lower ionosphere by lightning. Geophys. Res. Lett. 1991, 18, 705–708. [Google Scholar] [CrossRef]
  38. Inan, U.S.; Sampson, W.A.; Taranenko, Y.N. Space-time structure of optical flashes and ionization changes produced by lighting-EMP. Geophys. Res. Lett. 1996, 23, 133–136. [Google Scholar] [CrossRef]
  39. Chen, A.B.-C.; Chen, H.; Chuang, C.-W.; Cummer, S.A.; Lu, G.; Fang, H.-K.; Su, H.-T.; Hsu, R.-R. On negative Sprites and the Polarity Paradox. Geophys. Res. Lett. 2019, 46, 9370. [Google Scholar] [CrossRef]
  40. McHarg, M.G.; Harley, J.; Maldonado, C.; Lane, C.T.; Taylor, L.M.; Sonnenfeld, R.; da Silva, C.L.; Jensen, D.; Contreras Vidal, L.; Haaland, R.K.; et al. Sprite Streamer Interactions at 100,000 Frames per Second. In AGU Fall Meeting Abstracts; Volume 2019, p. AE23A-08. Available online: https://ui.adsabs.harvard.edu/abs/2019AGUFMAE23A..08M (accessed on 30 July 2021).
  41. McHarg, M.G.; Stenbaek-Nielsen, H.C.; Kanmae, T.; Haaland, R.K. Streamer tip splitting in sprites. J. Geophys. Res. 2010, 115, A00E53. [Google Scholar] [CrossRef] [Green Version]
  42. Cummer, S.A.; Jaugey, N.; Li, J.; Lyons, W.A.; Nelson, T.E.; Gerken, E.A. Submillisecond imaging of sprite development and structure. Geophys. Res. Lett. 2006, 33, 04104. [Google Scholar] [CrossRef] [Green Version]
  43. Holzworth, R.H.; Brundell, J.B.; McCarthy, M.P.; Jacobson, A.R.; Rodger, C.J.; Anderson, T.S. Lightning in the Arctic. Geophys. Res. Lett. 2021, 48, e91366. [Google Scholar] [CrossRef]
  44. Holzworth, R.H., II; Brundell, J.B.; Sloop, C.; Heckman, S.; Rodger, C.J. WWLLN and Earth Networks new combined Global Lightning Network: First Look. In AGU Fall Meeting Abstracts; Volume 2016, p. AE23A-0408. Available online: https://ui.adsabs.harvard.edu/abs/2016AGUFMAE23A0408H (accessed on 30 July 2021).
  45. Ikeda, A.; Uozumi, T.; Yoshikawa, A.; Fujimoto, A.; Abe, S.; Nozawa, H.; Shinohara, M. Characteristics of Schumann Resonance Parameters at Kuju Station. E3S Web Conf. 2017, 20, 01004. [Google Scholar] [CrossRef]
  46. Chou, C.-C.; Dai, J.; Kuo, C.-L.; Huang, T.-Y. Simultaneous observations of storm-generated sprite and gravity wave over Bangladesh. J. Geophys. Res. Space Phys. 2016, 121, 9222–9233. [Google Scholar] [CrossRef]
  47. Sato, M.; Fukunishi, H. Global sprite occurrence locations and rates derived from triangulation of transient Schumann resonance events. Geophys. Res. Lett. 2003, 30, 1859. [Google Scholar] [CrossRef]
  48. Sato, M.; Takahashi, Y.; Yoshida, A.; Adachi, T. Global distribution of intense lightning discharges and their seasonal variations. J. Phys. D Appl. Phys. 2008, 41, 234011. [Google Scholar] [CrossRef]
  49. Thomas, J.N.; Solorzano, N.N.; Cummer, S.A.; Holzworth, R.H. Polarity and energetics of inner core lightning in three intense North Atlantic hurricanes. J. Geophys. Res. Space Phys. 2010, 115. [Google Scholar] [CrossRef] [Green Version]
  50. Huang, E.; Williams, E.; Boldi, R.; Heckman, S.; Lyons, W.; Taylor, M.; Nelson, T.; Wong, C. Criteria for sprites and elves based on Schumann resonance observations. J. Geophys. Res. Atmos. 1999, 104, 16943–16964. [Google Scholar] [CrossRef]
  51. Pérez-Invernón, F.J.; Luque, A.; Gordillo-Vázquez, F.J. Modeling the Chemical Impact and the Optical Emissions Produced by Lightning-Induced Electromagnetic Fields in the Upper Atmosphere: The case of Halos and Elves Triggered by Different Lightning Discharges. J. Geophys. Res. 2018, 123, 7615. [Google Scholar] [CrossRef]
  52. Liu, N.; Dwyer, J.R.; Cummer, S.A. Elves Accompanying Terrestrial Gamma Ray Flashes. J. Geophys. Res. Space Phys. 2017, 122, 10–563. [Google Scholar] [CrossRef]
  53. Barrington-Leigh, C.P.; Inan, U.S.; Stanley, M.; Cummer, S.A. Sprites triggered by negative lightning discharges. Geophys. Res. Lett. 1999, 26, 3605–3608. [Google Scholar] [CrossRef] [Green Version]
  54. Qin, J.; Celestin, S.; Pasko, V.P. Dependence of positive and negative sprite morphology on lightning characteristics and upper atmospheric ambient conditions. J. Geophys. Res. Space Phys. 2013, 118, 2623–2638. [Google Scholar] [CrossRef] [Green Version]
  55. Liu, N.; Dwyer, J.R.; Stenbaek-Nielsen, H.C.; McHarg, M.G. Sprite streamer initiation from natural mesospheric structures. Nat. Commun. 2015, 6, 7540. [Google Scholar] [CrossRef] [PubMed] [Green Version]
  56. Qin, J.; Pasko, V.P.; McHarg, M.G.; Stenbaek-Nielsen, H.C. Plasma irregularities in the D-region ionosphere in association with sprite streamer initiation. Nat. Commun. 2014, 5, 3740. [Google Scholar] [CrossRef] [PubMed] [Green Version]
  57. Moore, R.C.; Barrington-Leigh, C.P.; Inan, U.S.; Bell, T.F. Early/fast VLF events produced by electron density changes associated with sprite halos. J. Geophys. Res. 2003, 108, 1363. [Google Scholar] [CrossRef]
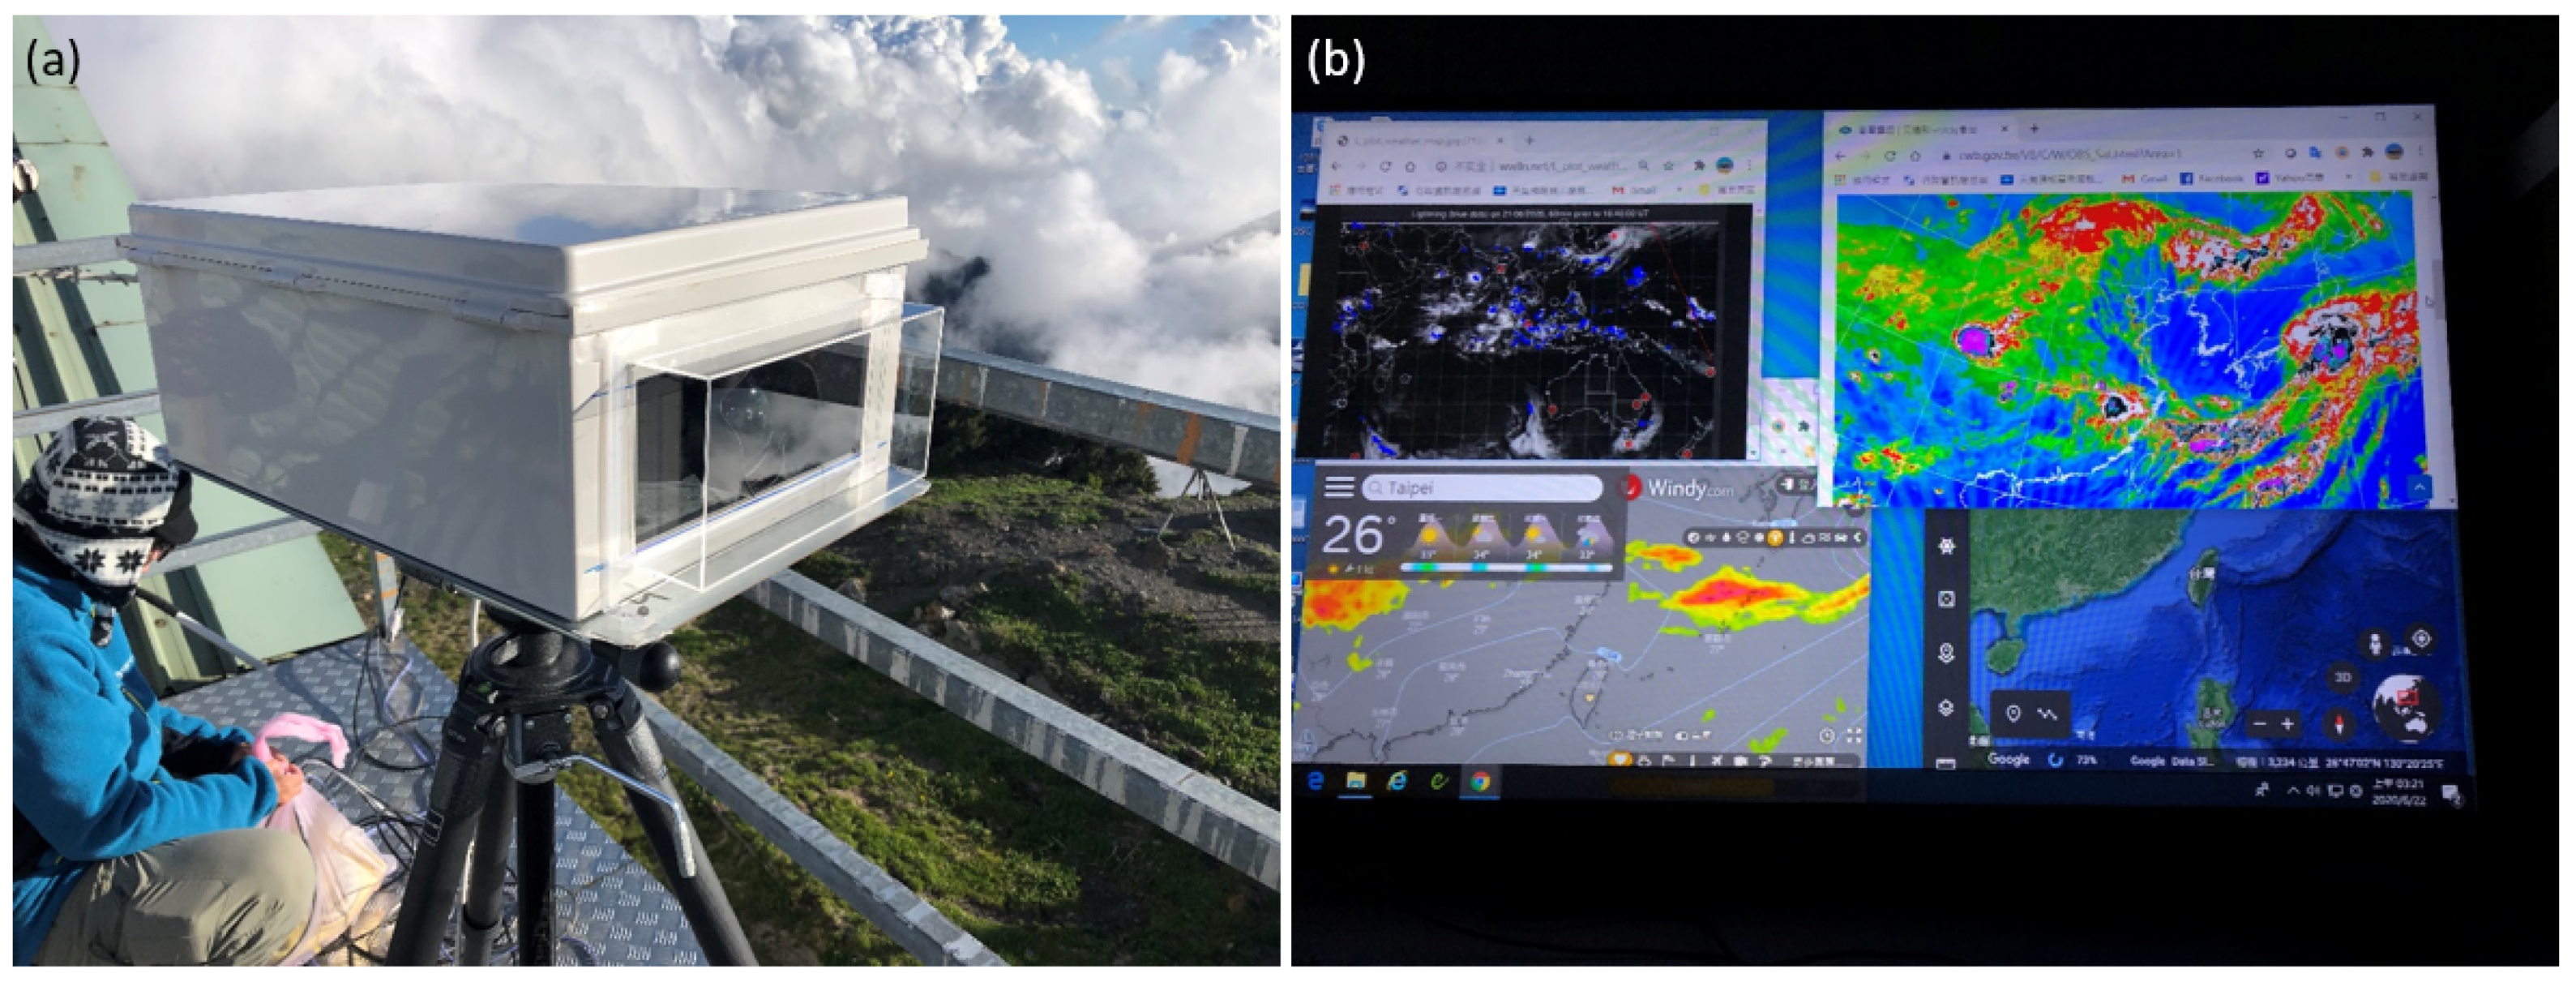
Figure 1. (a) The setup of our low-light-level CCD and high-speed-camera on the elevated work platform, and (b) the LCD monitor to show the near real-time of WWLLN lightning map, cloud top weather map and forecast of weather report in the observation room.
Atmosphere 12 01000 g001
Figure 2. The image processing as an example for coordinate calibration: (a) the landscape (antenna tip at the labeled number 1) and star positions at labeled numbers 2–6 in these red circles of the low-light-level CCD recorded image frame, (b) the background star field using the overplayed high-speed-camera image by integrating 100 frames without elve emission, and (c) the overlapped image by integrating 20 high-speed-camera frames to enhancing the elve emission.
Atmosphere 12 01000 g002
Figure 3. (a) The sprite event recorded by the low-light-level CCD at nighttime, where the rectangle indicates the two carrot sprites, and (b) the corresponding view of geometry at daytime.
Atmosphere 12 01000 g003
Figure 4. A sequence of temporal-integrated images recorded by the high-speed camera system at 10,000 fps for the elve event at time 13:07:25.9316 on 22 June 2020 where each exposure time is close to 100 μs.
Atmosphere 12 01000 g004
Figure 5. The differential images between frames in Figure 4 to reproduce the nearly-real time of elves images.
Atmosphere 12 01000 g005
Figure 6. (a) An elve image recorded by the low-light-level CCD system at time 13:07:25.9316 on 22 June 2020 while simultaneously (b) the time-integrated images of 20 image frames recorded by the intensified high-speed camera system with exposure time 100 us.
Atmosphere 12 01000 g006
Figure 7. The cartoon pictures to illustrate the (a) elve and (b) halo generation mechanisms and their formations.
Atmosphere 12 01000 g007
Figure 8. The low-light-level CCD system recorded images of elves at GPS time (a) 13:07:25.9316 (elve), (b) 13:56:28.3870 (sprite halo), seeing detailed in Figure 10, (c) 15:00:13.2524 (elve) and (d) 16:24:03.5149 (halo) on 22 June 2020 where images were enhanced to show their emission structure of elves and halos.
Atmosphere 12 01000 g008
Figure 9. The recorded images by the high-speed camera system (10,000 fps) at GPS time (a1a5) 13:07:25.9316 for elve, (b1b5) 13:56:28.3870 for sprite halo, seeing detailed in Figure 11, (c1c5) 15:00:13.2524 for elve and (d1d5) 16:24:03.5149 (UT) for halo on 22 June 2020 where the corresponding time-tags are shown in units of μs.
Atmosphere 12 01000 g009
Figure 10. The image sequence for (a) the elve event at UT time 13:07:25.9316, also shown in Figure 4 and Figure 9(a1–a5), and (b) the sprite halo event at UT time 13:56:28.3870 on June 22 to enhance the features of halo initiation and sprite streamer initiation after 0.3 ms. These images were cropped from the high-speed camera-recorded frames, also shown in Figure 9(b1–b5).
Atmosphere 12 01000 g010
Figure 11. We analyzed the recorded ELF signals provided by the magnetometer station at the Kuju station (33.059° N, 131.233° E) in Japan for parent lightning of elves at GPS time (a1,a2) 13:07:25.9316, (b1,b2) 13:56:28.3870, (c1,c2) 15:00:13.2524 and (d1,d2) 16:24:03.5149 (UT) on 22 June 2020. In the left panels (a1,b1,c1,d1), Lissajour Plots show their data points from NS (North-South) and EW (East-West) directions and the wave oscillation plane (blue dashed line). Perpendicular to the wave oscillation plane, the wave propagation direction (solid blue line) traced the generated wave source compared to the direction (red dashed lines) from the Kuju station to the WWLLN determined geometric locations. In the right panels (a2,b2,c2,d2), we plot the ф-component of the ELF waveform from lightning source to the ELF recorded station after the transformation of recorded ELF signals from the North-South/East-West direction to the azimuthal (ф)-direction. Using the Bф in pico-tesla (pT) units, we can estimate the charge-moment-change associated with lightning. The data points (blue and green circles) in the left panel (Lissajour plot) show the wave direction and assure the uniqueness of ELF wave sources, which are also corresponding to the ELF data in the right panel with blue and green filled region, respectively. Vertical black dashed lines indicate their GPS times in Table 1.
Atmosphere 12 01000 g011
Table 1. The 2020 Taiwan campaign observed TLEs (two sprites, two elves, and two halos) on June 22.
GPS Time (UT) (a)Type (b)WWLLN Time (UT) (c)Lat (c)Lon (c)Diameter (d)Distance (km) (e)Az (deg) (e)I (kA) (f)E (J) (f)Bф Peak (pT) (g)CMC (C-km) (g)
12:26:51.8148S----------------------------------- ----------
12:36:58.2835S12:36:58.25236725.8752126.3395-----60563451067----------
13:07:25.9316E---------------115--------------------52.8−135
13:56:28.3870H + S13:56:28.31190425.7193125.895685558631185036172.5+670
15:00:13.2524E15:00:13.21949125.9492125.61451255455958160783.2−402
16:24:03.5149H16:24:03.49581325.7102125.698980539621729344236.3−775
(a) The GPS timestamp inserted in the low-light-level CCD with a time resolution 16.7 ms. (b) The type of TLE (S, H and E) are represented by sprite, halo, and elve, respectively. (c) The time and location in latitude (Lat) and longitude (Lon) are provided by the WWLLN data. (d) The diameter of elve/halo emission was estimated by a distance of 550 km for the low-light-level CCD. (e)The distance and azimuthal (Az) angle for the observation site to the WWLLN determined geometric locations. (f) The lightning peak current (I) in units of kilo-Ampere (kA) and energy (E) in units of Joule (J) were obtained from WWLLN VLF data. (g) The peak amplitude of Bф were listed in units of pico-tesla, and the charge-moment-change (CMC) in units of C-km for TLEs’ parent lightning were estimated using Kuju ELF data.
Publisher’s Note: MDPI stays neutral with regard to jurisdictional claims in published maps and institutional affiliations.