Article

PM2.5-Bound Heavy Metals in Southwestern China: Characterization, Sources, and Health Risks

1
Research Center for Atmospheric Environment, Chongqing Institute of Green and Intelligent Technology, Chinese Academy of Sciences, Chongqing 400714, China
2
School of Urban Construction and Environmental Engineering, Chongqing University, Chongqing 400044, China
3
School of Environment and Resource, Southwest University of Science and Technology, Mianyang 621010, China
4
College of Architecture and Environment, Sichuan University, Chengdu 610065, China
5
School of Basic Medical Sciences, North Sichuan Medical College, Nanchong 637000, China
*
Author to whom correspondence should be addressed.
Atmosphere 2021, 12(7), 929; https://doi.org/10.3390/atmos12070929
Submission received: 15 June 2021 / Revised: 1 July 2021 / Accepted: 16 July 2021 / Published: 20 July 2021

Abstract

:
The health risks of PM2.5-bound heavy metals have attracted extensive attention recently. In order to evaluate those deleterious effects on human health more accurately, and to propose proper measures to reduce health risks of air pollution, the conduction of a source-specific health risk assessment is necessary. Based on daily collected PM2.5 samples at different functional sites during winter 2019 in a megacity Chongqing, China, combining source apportionment results from PMF and health risk assessment from the U.S. EPA, the source-specific health risks from PM2.5-bound heavy metals were given. Six types of PM2.5 sources have been identified, coal burning (25.5%), motor vehicles (22.8%), industrial emissions (20.5%), biomass burning (15.9%), dust (7.8%), and ship emissions (7.5%). Results showed that the total hazard quotient (HQ) was 0.32 and the total carcinogenic risks (CR) were 2.09 × 10⁻⁶ for children and 8.36 × 10⁻⁶ for adults, implying certain risks for local residents. Industrial emissions related with Cr posed both the highest carcinogenic risk and noncarcinogenic risk (contributing 25% CR and 36% HQ). Coal combustion (associated with Cr, As, and Mn) contributed 15.46% CR and 20.64% HQ, while biomass burning and motor vehicles shared 19.99% and 19.05% of the total CR, respectively. This work indicated that health risks of air pollution sources were the combined effects of the source contribution and chemical components. In order to control the health risks of PM2.5 to the local residents, the priority of targeted emission sources should be adopted for industrial emissions, biomass burning, vehicle emissions, and coal combustion sources.

1. Introduction

The components of atmospheric fine particulate matters (PM2.5) are very complicated, including carbonaceous components (organic carbon, OC; elemental carbon, EC), major water-soluble inorganic ions, and trace elements [1,2]. Inhaled PM2.5 can settle in the lungs and blood, causing harmful effects on human health, respiratory diseases such as bronchitis and asthma, as well as heart disease, which are more likely to occur or worsen in areas with high levels of PM2.5 pollution [3,4,5]. Some PM2.5 components can be highly deleterious at low concentrations, such as heavy metals (HMs), which have been shown to cause dysfunctions and carcinogenicity even though only at the level of nanograms per cubic meter in the air [6,7]. The inhaled PM2.5 is an important approach for HMs get into human body and accumulate in the organs and blood [5]. Long-term human exposure to Pb may have adverse effects on the blood and central nervous system [8], e.g., pregnant women exposed to Pb, As, Cd, and Hg during the early and late gestation of pregnancy have an increased incidence of childhood asthma [9]; As, Cd, and Cr(VI) in the environment put children at a higher noncarcinogenic risk than adults [6].
Former studies have researched the pollution status of HMs in PM2.5 in different polluted Chinese cities. Generally, HMs in PM2.5 increased from southern to northern China. Northern cities such as Harbin, Taiyuan, Tianjin, Baoding, Xi’an, Lanzhou, and southern cities such as Kunming, Nanchang, and Wuhan [6,10] displayed relatively high HMs. According to Li et al. [6], the average concentrations of As and Cd have exceeded the annual limits of Chinese Ambient Air Quality Standard (GB3095-2012) by 74% and 33% in some cities; As was even 20 times over its limits (6 ng/m3) in some cases, with both Xi’an and Kunming having concentrations of more than 105 ng/m3. Baoding, Nanchang, Lanzhou, Taiyuan, Tianjin, and Kunming held high Pb concentrations in the range of 281 ng/m3–433 ng/m3 [10,11]. Li et al. [6] evaluated the pollution degree of PM2.5-bound HMs in major cities of China, using enrichment factors (EFs) as the index. All obtained EFs were higher than 1; EFs of Cd, Hg, Pb, Zn, Cu, As, Cr, and Ni in major cities were greater than 40—EF > 20 is usually considered highly enriched and severely polluted by anthropogenic emissions; the relatively high EFs reflected the noteworthy pollution status of PM2.5-bound HMs contributed by anthropogenic sources.
The sources of HMs are very complicated, mainly including crustal sources, coal combustion, traffic emissions, heavy-metal smelting, and other industrial emissions. Coal has been the major energy source for a long time in China. As and Cr are produced by coal burning, winter heating, and coal-dominated industrial emissions, which are the main related sources in northern and northwest China [12,13,14]. Cd and Ni pollution were related to heavy industrial emissions; Ni and V often share similar characteristics and are regarded as trace markers for heavy diesel burning in ship emissions [15], usually showing lower mass concentrations in inland cities than coastal areas [16,17]. Liu et al. [7] developed a provincial emission inventory of 13 HMs from 10 anthropogenic sources in China based on 2015 PM2.5 emission and historical source profiles; the total emission of the mentioned 13 HMs was about 58,000 tons for the base year, and iron production was thought to be the main source of HMs. The northern and eastern regions have generally had a higher emission load, Chongqing’s HMs emission was relatively low throughout the country, but emissions in the neighboring provinces like Sichuan (Cd, V, Ba, As, Cr, Sn), Guizhou (Cd, Sb, Co, Ni, Sn), Hubei (Zn, As, Pb, Cu, Mn), and Hunan (Co, As, Cr, Pb, Cu, Mn) were relatively high. PM2.5-bound HMs can transport far away after being emitted from sources due to their stability in the atmosphere, yielding regional pollution [18]. Air-quality models and receptor models have been widely used in source apportionment of PM2.5 and associated components. Wang et al. [19] used Positive Matrix Factorization (PMF) to analyze the sources of PM2.5 from 1973 to 2010 in Chengdu; HMs were included in the factor identification of the PMF model. It was found that Pb and As were mainly contributed by burning coal, petroleum, and gas; Zn, Mn, As, Pb, and Cu were mostly associated with industrial emission in this area. Kong et al. [20] also studied the PM2.5 sources by PMF in Chengdu and identified that coal combustion, biomass burning, vehicle emissions, dust, and industrial sources were the five main PM2.5 sources.
In the present study, we focused on HM pollution in southwest China, an area topographically isolated as it is surrounded by highlands and characterized by high relative humidity and low wind speeds [21]. Sichuan–Chongqing is one of four highly polluted areas in China and one of the most heavily affected by acid rain, which still continues in some regions [22]. The relatively strong acidity of precipitation and particulate matters in southwest China would enhance the solubility of some HMs and then increase their bioavailability and bioaccumulation [23,24,25]. Considering the toxic properties of HMs, studying the HMs in PM2.5 is of great significance for evaluating the health risk from air pollution emission sources. The research area, Jiangjin District, is located in Chongqing, which is a large city in southwest China and has a population of 32 million (National Bureau of Statistics, China. 1 November 2020). Jiangjin belongs to the eastern part of the Sichuan Basin (SCB; 25°~35° N, 95°~110° E); it is obviously influenced by pollution in the basin range and can represent the corresponding regional air quality. In this work, the characteristics and sources of PM2.5-bound HMs (Cr, As, Pb, Cu, Zn, Ni, V, Mn) were studied and their health risks were evaluated. Although As is a nonmetal element, it has similar health effects with HMs; so, As is discussed in this work. The research conclusions can provide scientific support for environmental administration of the government to establish relevant policies for reducing atmospheric pollution emissions with high health risks.

2. Methods and Materials

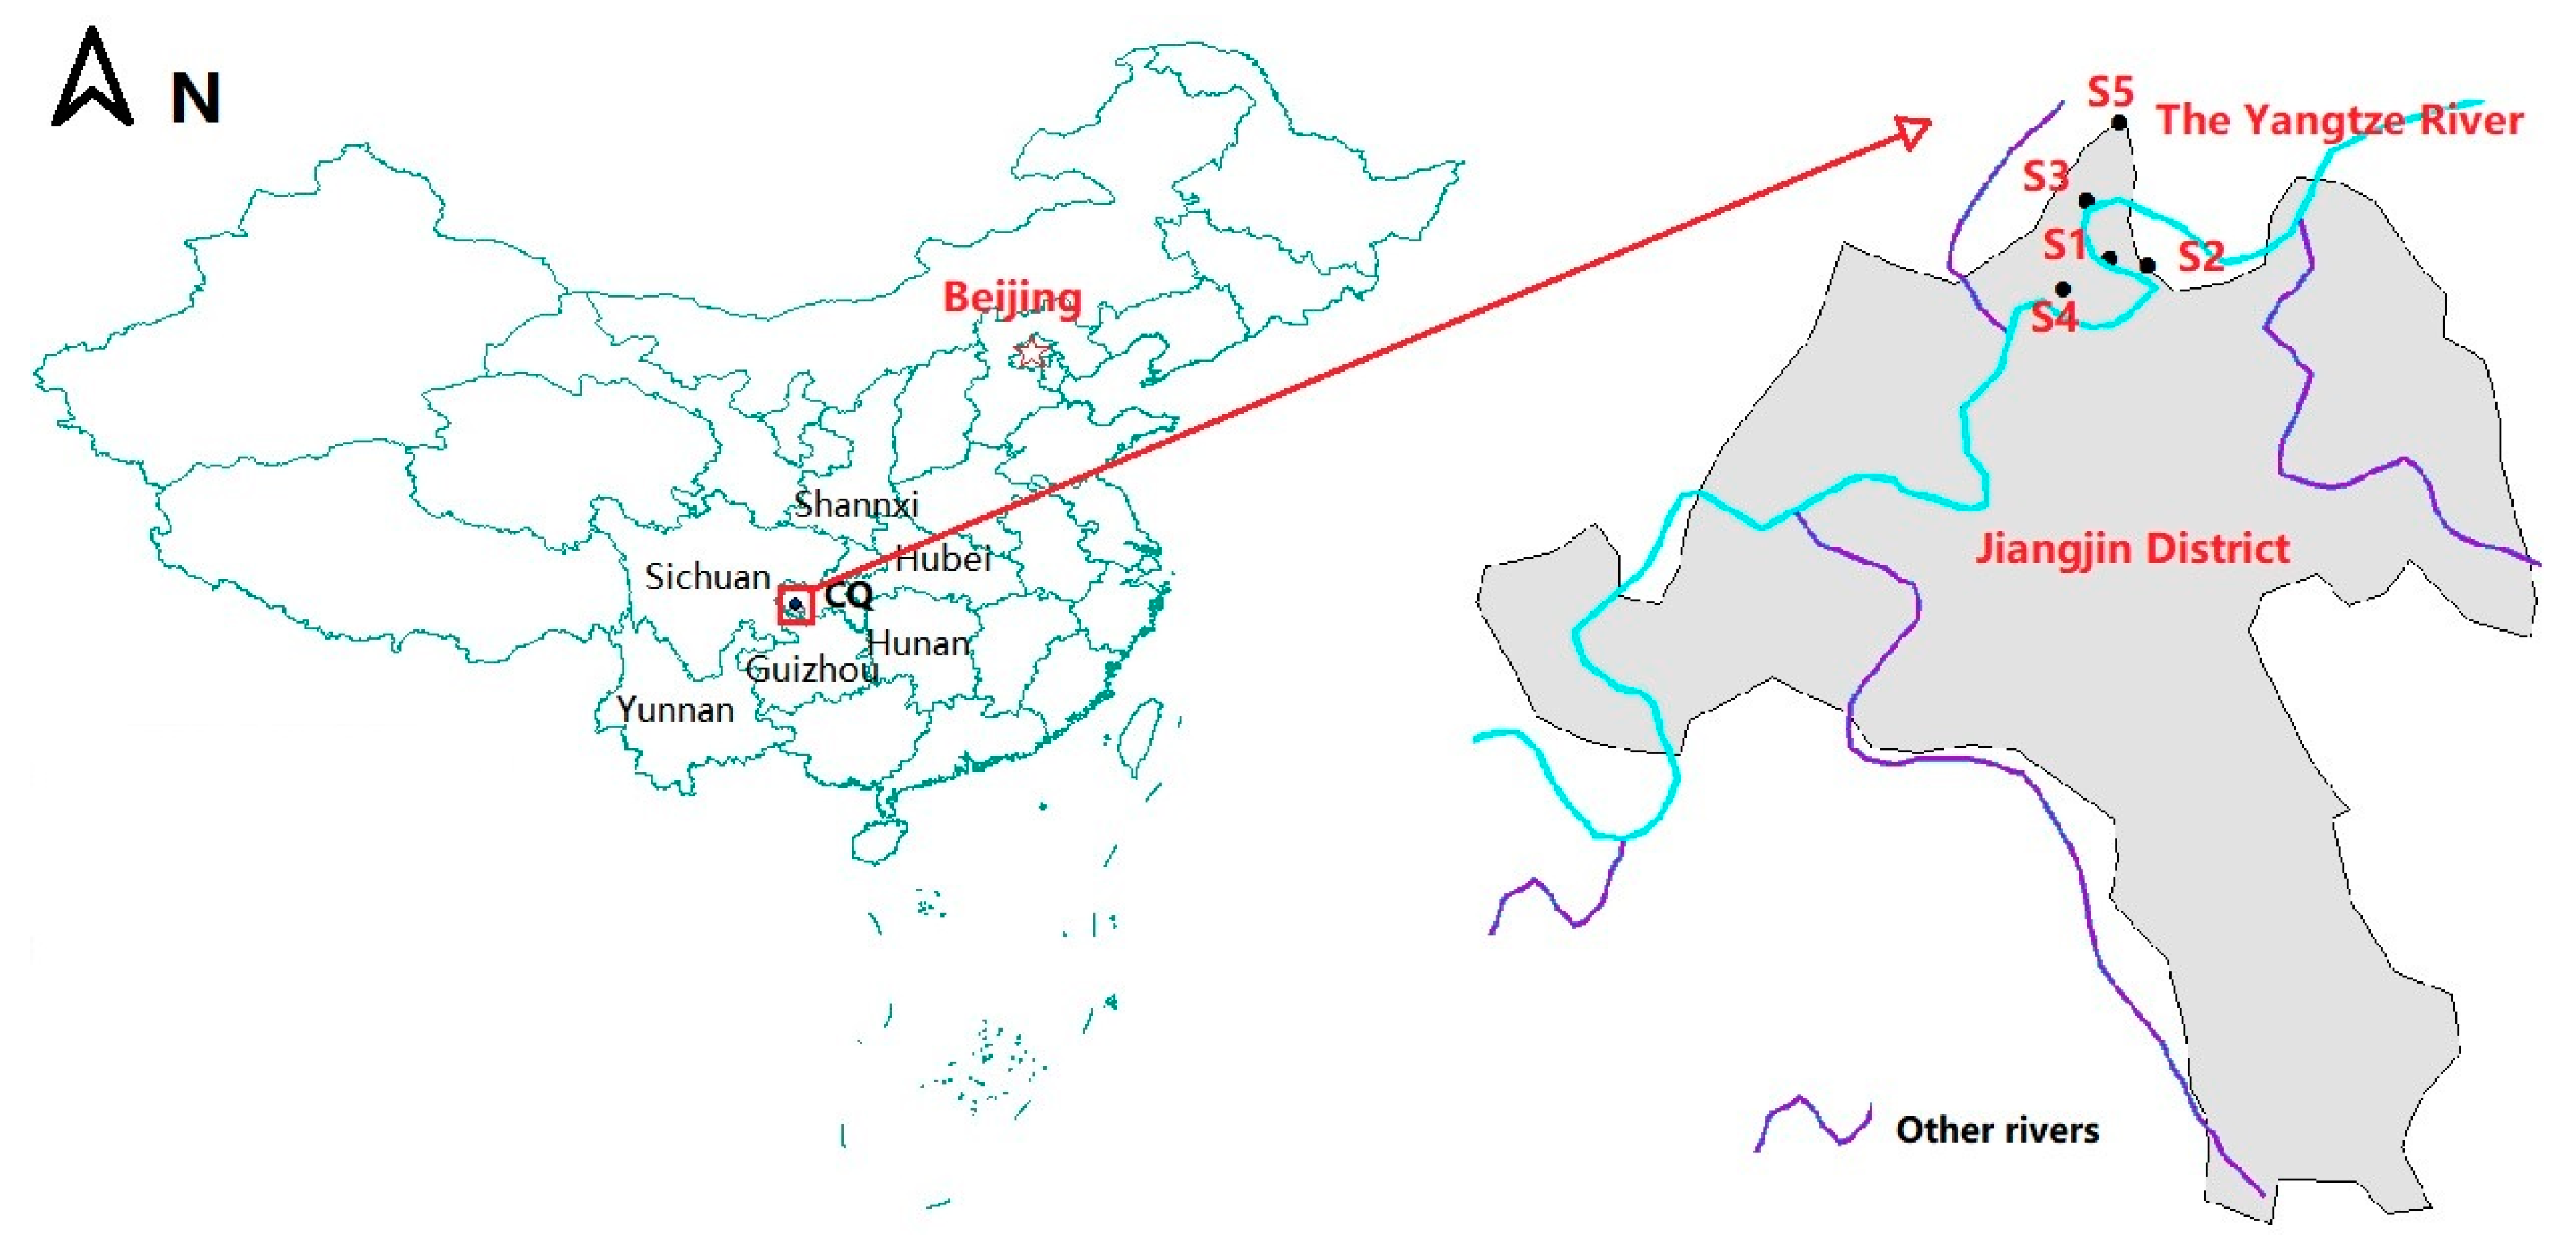
2.1. PM2.5 Sampling and Chemistry Analysis

Jiangjin District is located southwest of Chongqing and is a developed industrial area about 40 km away from the city center. This project examined 5 sampling sites, among which there were two central urban sites, Jiangjin Middle school (S1) and Yuanshuai Square (S2); one suburban site, Binjiang New City (S3); and two industrial sites, De-Gan industrial zone (S4) and Shuangfu industrial zone (S5). The Yangtze River flows through Jiangjin District for 127 km and includes 135 ferry piers, there are large cargo terminals and ports in the vicinities of four industrial zones (Degan, Luohuang, Baisha, and Shuangfu). The sampling sites’ information is shown in Figure 1. BGI OMNI samplers (5 L/min) were used in the urban and suburban sites (S1, S2, S3), Dandong Bettersize automatic sampler (16.67 L/min) was employed in the two industrial sites (S4, S5). All PM2.5 samplers were placed on the roof of the building, which was about 9–15 m above the ground. PM2.5 samples were collected by Teflon filter membrane (Whatman Corp., 47 mm) from 6 January 2019 to 28 January 2019, and collected continuously for 23 h each time from 10:00 to 09:00 the next day. A total of 114 PM2.5 samples and 15 blank samples were obtained. The collected samples were stored in a clean refrigerator environment of −18 °C to avoid contamination and volatilization.
In this study, a weighing method was adopted to measure the mass of PM2.5 samples. Before and after sampling, the Teflon filter membranes were placed in a relatively constant temperature (20–23 °C) and humidity (45–50%) environment for 48 h to reach equilibrium. Then, a microbalance (Sartorius, ME5-F, Goettingen, Germany) was used to weigh the filer membrane. The atmospheric PM2.5 concentration can be obtained according to the ratio of PM2.5 mass on each filter membrane and the sampling air volume. Major chemical components in PM2.5 including water-soluble ions (SO42−, NO3, Cl, F, NH4+, Na+, K+, Mg2+, Ca2+, etc.), carbon-containing components (Organic Carbon, OC; Elemental Carbon, EC), and elements (V, Cr, Mn, Ni, Cu, Zn, As, Pb, Al, Si, Fe, Ti, etc.) have been analyzed. Water-soluble ions were analyzed by Ion Chromatography (ICS-600, Thermo Scientific, Shanghai, China); OC and EC were analyzed by Thermo-Optical Carbon Analyzer (Desert Research Institute Model 2015, Atmoslytic Inc. Calabasas, CA, USA) with Thermo-Optical Reflection (TOR) Method under IMPROVE-A (Interagency Monitoring of Protected Visual Environment) analysis protocol. Elements including HMs were analyzed by X-ray fluorescence spectrometer (Epsilon 5 ED-XRF, Palytical B.V., Netherlands). For methods of quality control and quality assurance, please refer to Wang et al. [26].

2.2. Health Risk Estimation of PM2.5-Bound Heavy Metals

The carcinogenic and noncarcinogenic risks by PM2.5-bound HMs via inhalation were calculated by adopting the U.S. Environmental Protection Agency (US EPA) human health risk assessment models (US EPA, 1989) [27]. The adverse effects of heavy metals were determined by their bioavailable toxicity, which were influenced by chemical form, solubility, active organic location, aerosol surface property, and so on. The method included calculation of the deposition fraction of PM2.5 that can penetrate in lungs [28], the bioavailable concentration of each HM during the monitoring periods [29], the exposure concentration of PM2.5-bound HMs (EC), hazard quotient (HQ, noncarcinogenic health risk), and carcinogenic risk (CR). This study referred to the bioavailable ratios of PM2.5-bound HMs in another research in China—the detail can be seen in Huang et al. [29]. The sensitive residents were divided into two groups, adults and children, the inhalation reference concentration (RfC, mg m−3) and inhalation unit risk (IUR, (μg m−3)−1) were obtained from the Regional Screening Level (RSL) Resident Ambient Air Table (US EPA, 2021) [30]. The 8 HMs that induce noncarcinogenic risks are V, Cr, Mn, Ni, and As, those showing carcinogenic risks are V, Cr, Ni, As, and Pb. The carcinogenic health risks of each air pollution source were assessed by the sum of CR of carcinogenic HMs contributed by that source (CRs), as were the noncarcinogenic health risks of that source (HQs). The CRs and HQs are calculated by Equations (4) and (5), respectively.
EC = C b × E i × ET × EF × ED ATn
CRi = IURi × EC (i = V, Cr(VI), Ni, As, Pb)
HQ i = EC RfC   × 1000   μ g   mg 1   ( i = V ,   Cr ( VI ) ,   Mn ,   Ni ,   As )
CRsj = ∑(CRi × RCij) (i = V, Cr(VI), Ni, As, Pb)
HQsj = ∑(HQi × RCij) (i = V, Cr(VI), Mn, Ni, As)
where Cb is the average bioavailable concentrations of particulate elements (referring to the bioavailable index of heavy metals in Huang et al. [29]); Ei is the deposition fraction of PM2.5 that can penetrate in lungs [28] (Volckens and Leith, 2003); ET is the exposure time (24 h/day); EF is the exposure frequency (180 day/year); ED is the exposure duration (6 years for children and 24 years for adults); ATn is the averaging time (for noncarcinogens ATn = ED × 365 day/year × 24 h/day; for carcinogens ATn = 70 year × 365 day/year × 24 h/day); RCij is the contribution rate of air pollution source j to element i in PM2.5, which was provided by PM2.5 source apportionment results; CRsj and HQsj are the CR and HQ of source j.

3. Results and Discussion

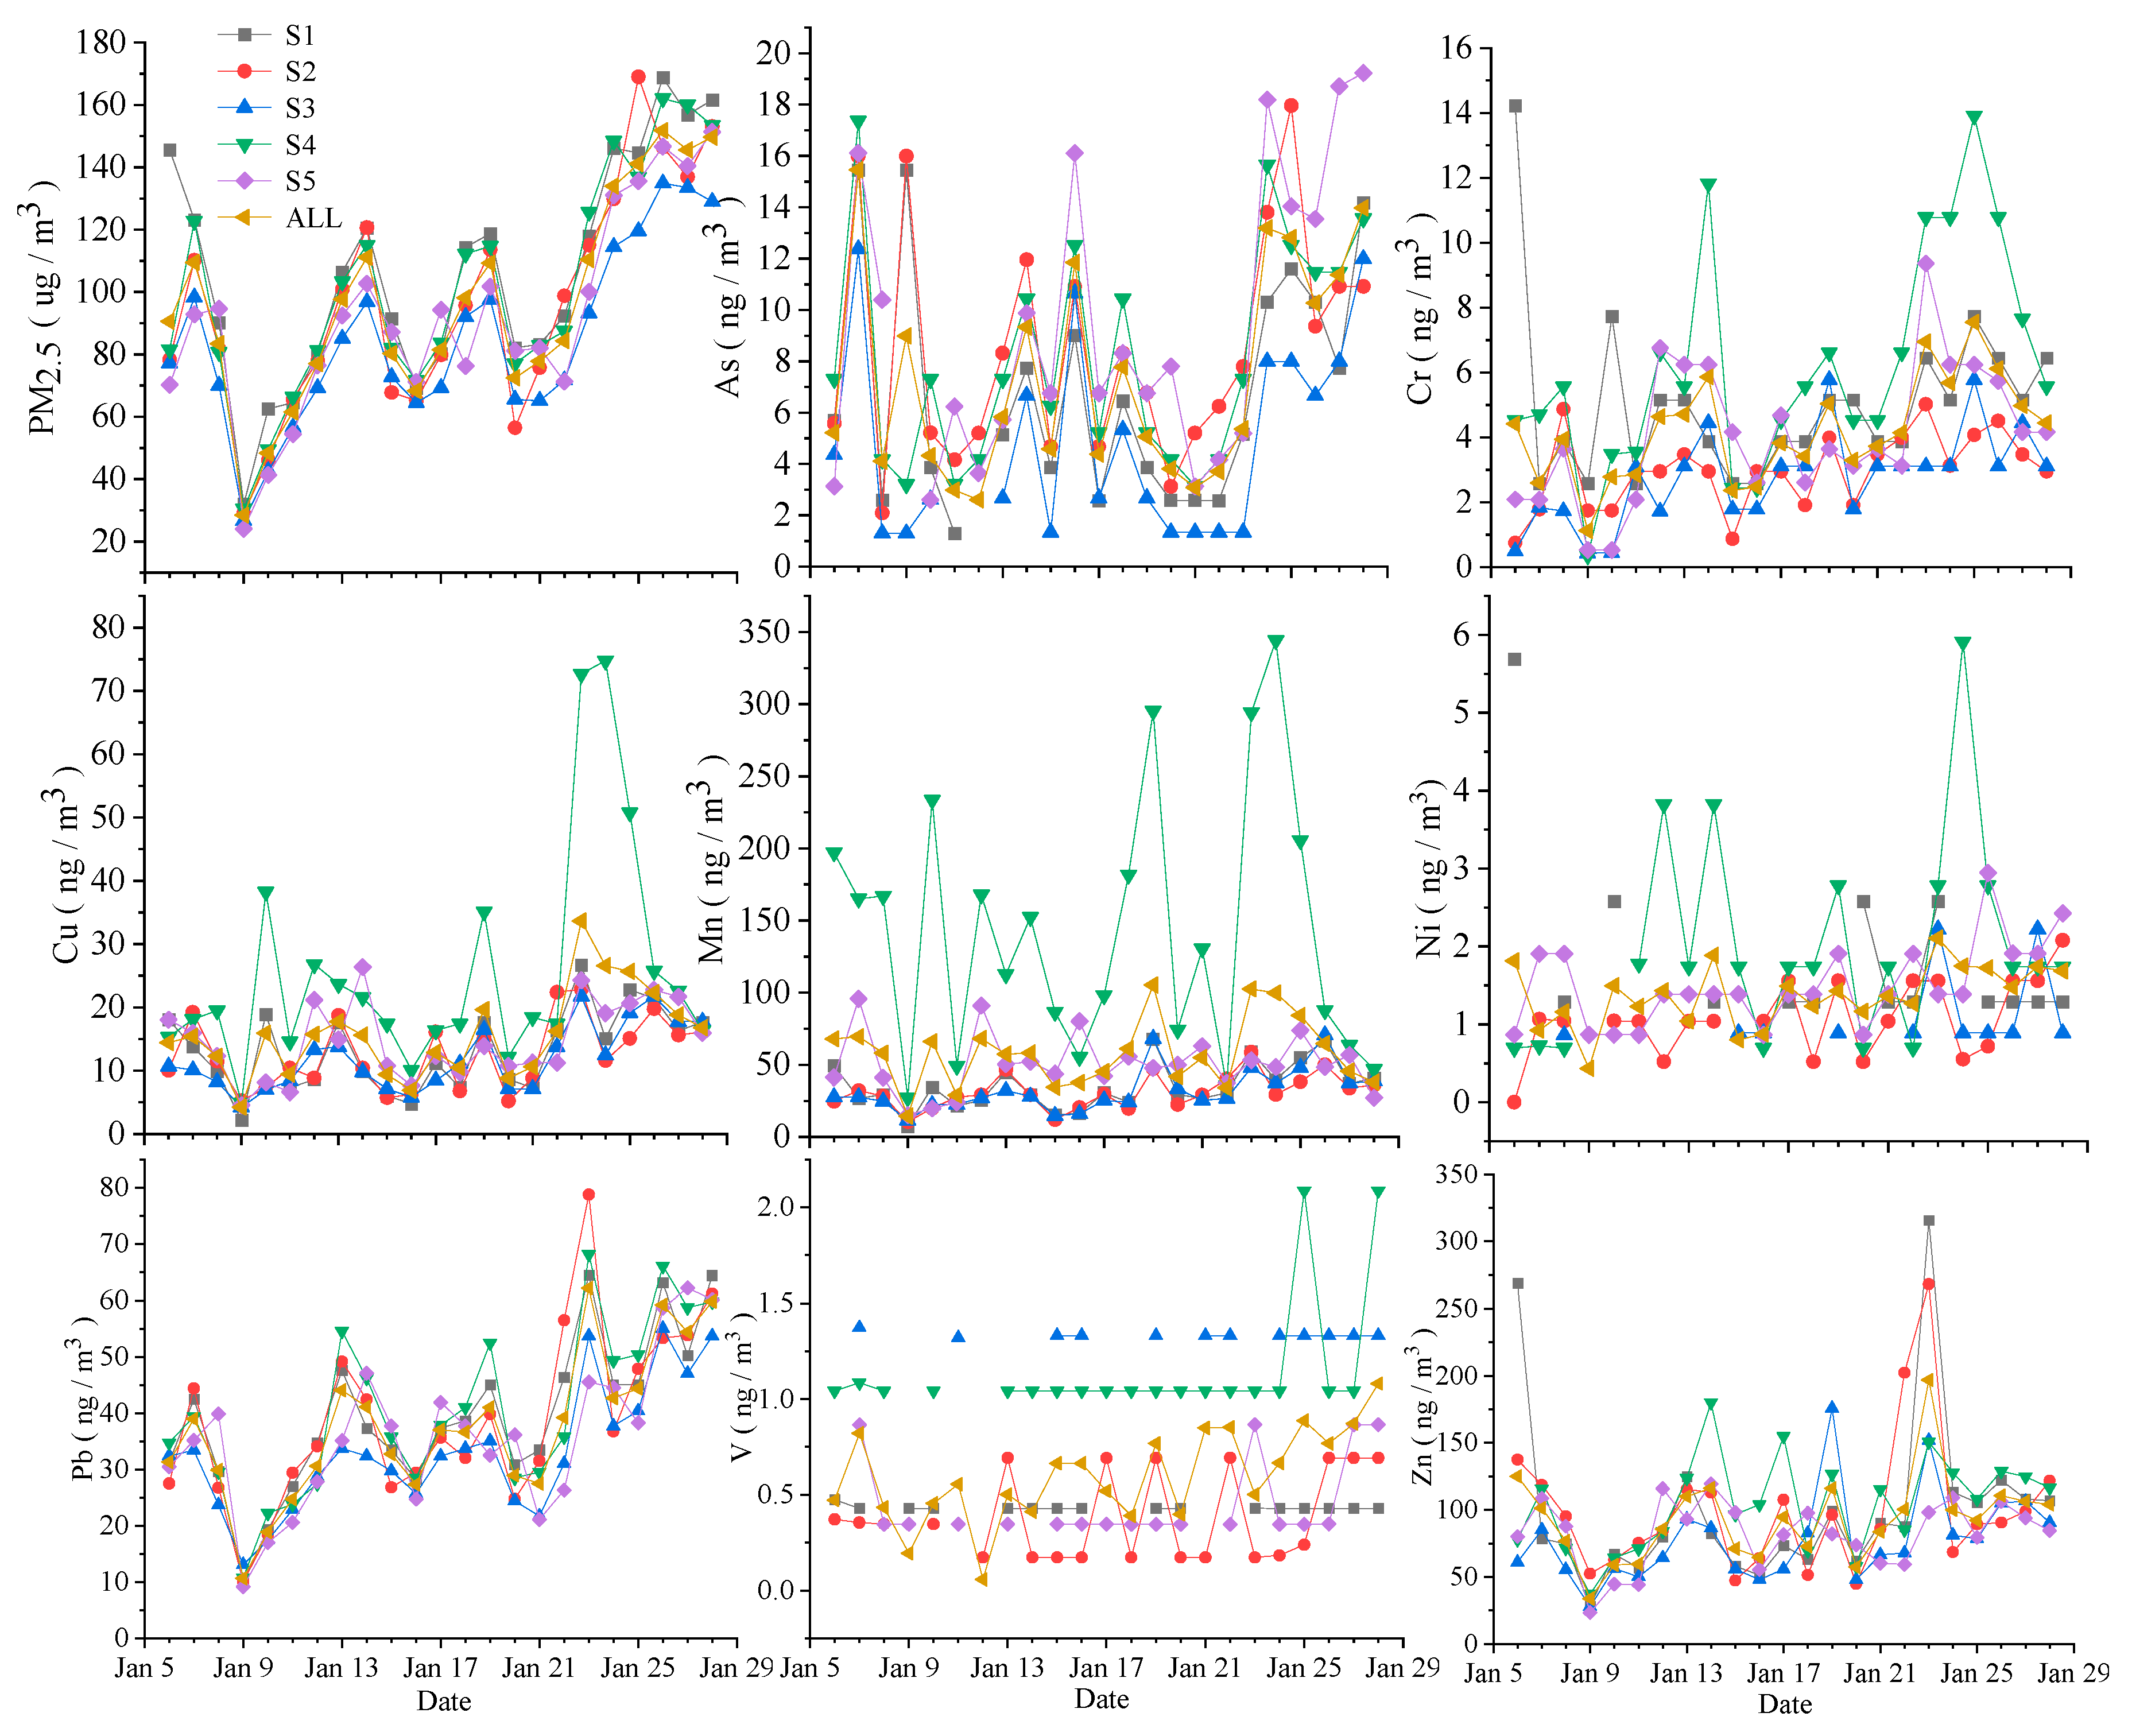
3.1. Pollution Characteristics of Heavy Metals in PM2.5

The mean concentration of PM2.5 and HMs in PM2.5 during the observation period were shown in Table 1. The average PM2.5 concentration was 97.06 μg/m3, varied at each site from 84.56 ± 28.39 to 106.60 ± 36.11 μg/m3; of the 114 samples, 83 had PM2.5 concentrations above 75 μg/m3 (the second level of Chinese Ambient Air Quality Standard, GB3095-2012). The highest PM2.5 concentration was 168.77 μg/m3, 2.25 times the second-level limit.
The total concentration of 8 HMs was 220.46 ng/m3 ranged from 163.30 to 329.53 ng/m3 at five sites on average, which accounted for 0.19% to 0.33% of PM2.5. Zn, Mn, and Pb were the three HMs with high concentrations, accounting for 42.74%, 26.60%, and 17.21% of the total HMs, respectively. The PM2.5 and its chemical compositions of urban areas in Chongqing and Chengdu have been reported by Chen et al. [31] and Tao et al. [32], respectively. In their research, the concentrations of Zn, Mn, and Pb were also higher than those of Cu, As, Cr, Ni, and V. It has also been reported that Zn and Pb in PM2.5 were higher than other HMs during winter in northern China such as Baoding and Beijing [10,11,33]. When compared with the results in 2012, obtained at an urban area of Chongqing by Chen et al. [31], the HMs’ concentrations have decreased, except for Mn and As, which somehow indicate that the air quality in this region has been getting better.
The PM2.5 concentrations generally showed urban > industrial zone > suburban, while PM2.5-bound HMs were industrial zone > urban > suburban. HMs at the southern industrial site (S4, De-Gan Industrial zone) were the highest, accounting for 0.33% of PM2.5, especially Mn, Cu, Ni, and V, maximally 4.63, 2.16, 3.37, and 3.33 times of that at other sampling sites, respectively. However, HM concentrations at the northern industrial site (S5, Shuangfu industrial zone) were similar to those at urban sites. A possible reason was that the Shuangfu industrial zone was only about 40 km southwest of the downtown area of Chongqing. Under the dominant northeast wind, S5 was significantly influenced by the air pollution from the upwind downtown area.
As shown in Figure 2, among all heavy metals, the time trend of Pb and PM2.5 has the best correlation, and the correlation coefficients of the five sites are 0.8~0.91. According to the PMF results of PM2.5 and PM2.5-bound HMs, the proportions of Pb in source profiles of coal burning, motor vehicles, and industrial emission were quite close to each other, and these three sources contributed about 69% PM2.5 and 58% of total Pb in PM2.5, which can explain the high consistency between PM2.5 and Pb. Except for S4, the correlation coefficients between Cu and PM2.5 were 0.66~0.80. The correlation between as and PM2.5 showed obvious differences between sites, poorly correlated in the central urban sites (0.37 and 0.34 at S1 and S2, respectively), while good in the suburbs and industrial sites (0.64, 0.70, and 0.77 in S3, S4, and S5, respectively). The correlation between Zn and PM2.5 was quite similar to that of As. The concentrations of V at the five sites had relatively small changes, indicating that it may have stable local sources like industrial emissions and ship emissions. Generally, the different variation trend of PM2.5-bound HMs among the five sites suggested differences in PM2.5 sources.
Table 2 lists the standard limits for heavy metals defined by China, WHO, the EU, and other countries. On average, As and Cr were the two HMs exceeding the standard limits of GB3095-2012 (As was 26% higher and Cr was 170 times higher) and WHO (As was 15% higher and Cr was 16 times higher). The concentration of PM2.5-bound Mn at the De-Gan industrial zone was higher than GB3095-2012 and WHO limits in nearly half of the sampling time with the highest value of 344.17 ng/m3. The HMs’ pollution in this area was worthy of attention.

3.2. Sources of Fine Particulate Heavy Metals

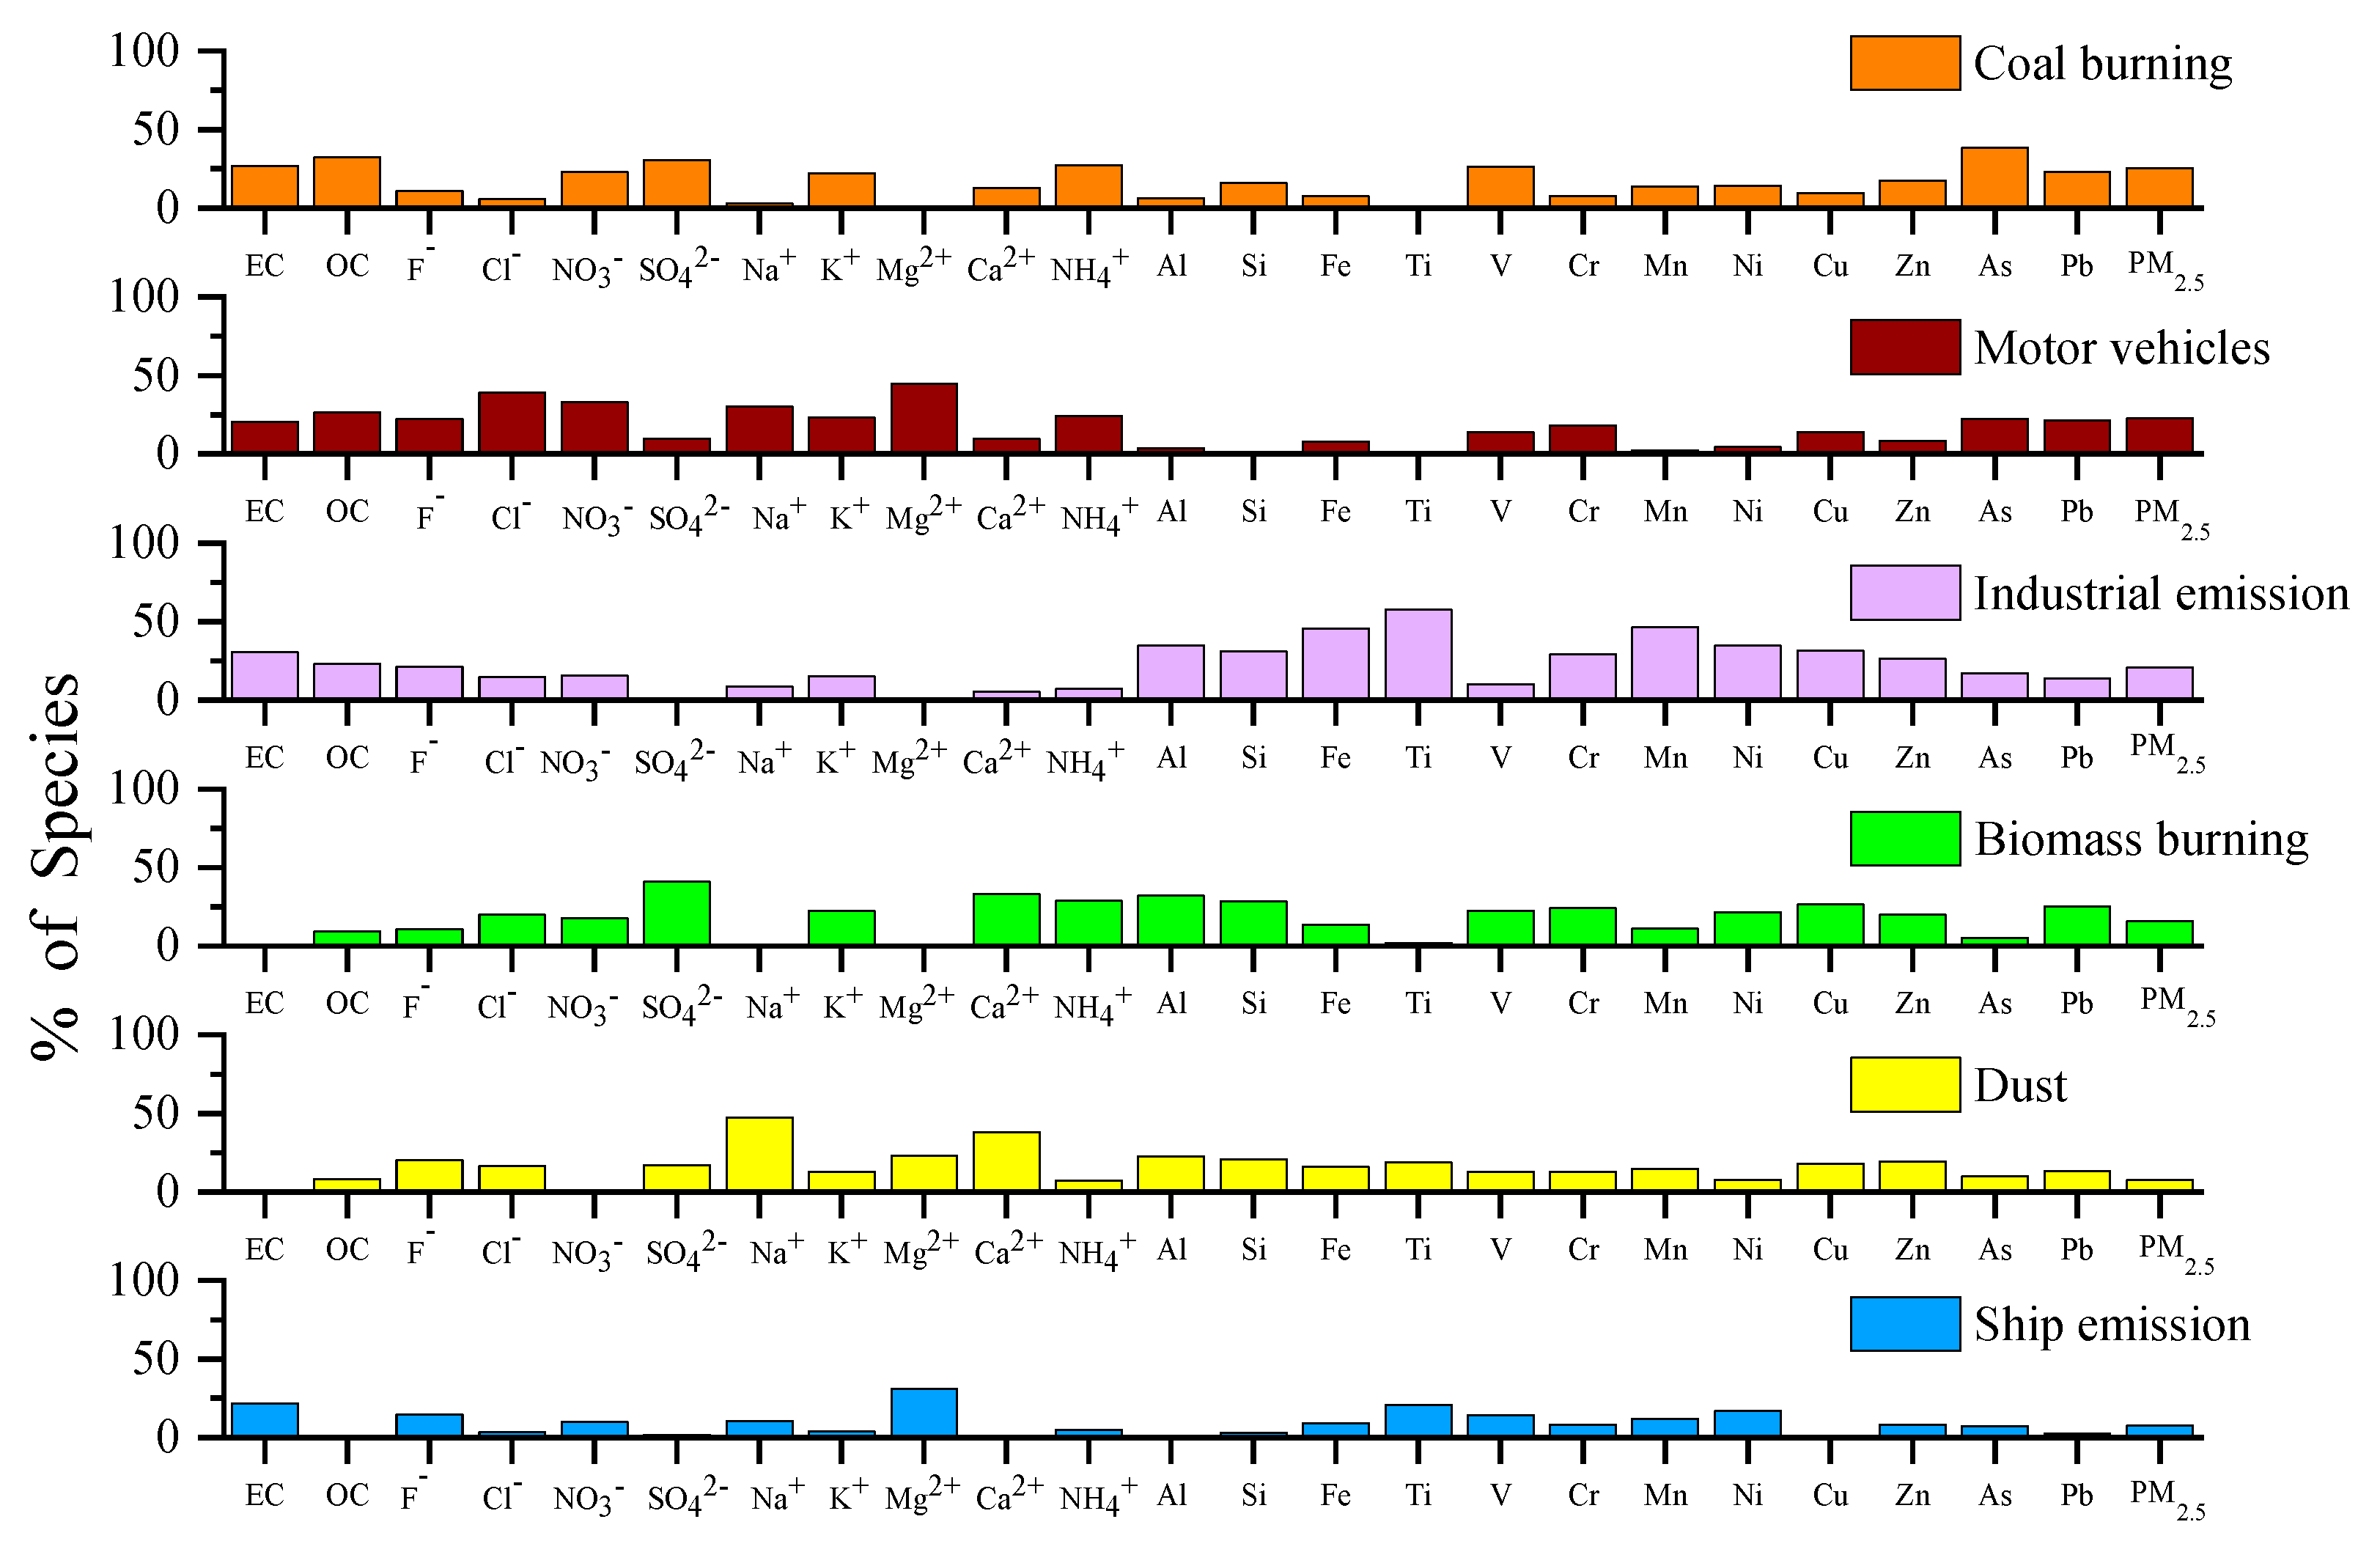
3.2.1. Source Apportionment of PM2.5

Positive Matrix Factorization (PMF) was used to identify the pollution sources of PM2.5 and the related heavy metals in the study area (Qtrue/Qexp = 1.003; detailed method description is available in the literatures reported by Amato and Hopke [34] and Polissar et al. [35]. The other chemical components of PM2.5, including OC, EC, major water-soluble inorganic ions (F, Cl, NO3, SO42−, Na+, K+, Mg2+, Ca2+, NH4+), and other trace elements (Al, Si, Fe, Ti), have also been added into PMF to trace the possible sources. For the five sites on average, we identified the following 6 PM2.5 sources in descending order: coal burning (25.5%), motor vehicles (22.8%), industrial emissions (20.5%), biomass burning (15.9%), dust (7.8%), ship emissions (7.5%) Figure 3. The first factor with high levels of SO42, NO3, OC, EC, K+, and NH4+ was recognized as coal burning [1,29]. Coal combustion plays a major role in Chinese energy consumption and air pollution, former studies have pointed out that coal combustion contributes over 1/3 of PM2.5 [21] and was the highest air pollution source in Sichuan Basin. The second factor was characterized by high OC, EC, NO3, and NH4+, this factor represented PM2.5 from motor vehicles [1,36], which was correlated to the motor vehicle emissions from the vicinity of urban areas such as Chengdu and Chongqing. The sampling sites (29.25°~29.40° N, 106.21°~106.29° E) were located at the southeast Sichuan Basin and only about 40~60 km away from the central downtown of Chongqing, as shown in Figure 1. SCB is a lowland region with more than 11.3 million vehicles, the west and the north of Jiangjin District are generally plain cities, the south includes the Yunnan–Guizhou Plateau, and Wushan Mountains is to the east. under the combined action of disadvantageous diffusion conditions and high vehicle numbers, vehicle emissions have become the important PM2.5 source of the study region. The third factor was dominated by metal elements such as Al, Fe, Mn, Ti, Ni, Cu, Cr, and Zn; OC, EC and NO3 also had significant proportions, which have been considered to be industrial emissions [37,38]. To the northwest of the sampling locations, the adjacent Sichuan province has about 15 steel industries. Chongqing also has a developed automobile manufacturing industry and iron and steel industry. In these factories, it often needs to be accompanied by high energy consumption such as coal combustion sources, so both metallic particulate matter and burning particles existed in this factor. The fourth factor was characterized by high levels of SO42, NO3, NH4+, OC, K+, and Cl and considered to be biomass burning [39,40]. The SCB is one of the most important grain-producing areas in China, as many local rural areas still rely on biomass as their main energy source. Early studies also have widely stated that biomass burning was one of the main sources of air pollution in this area, e.g., 12.8% in Wang et al. [19], 11.7% in Kong et al. [20], and even reached up to 56~65% in Zhou et al. [41,42] and Song et al. [43]. The last two factors were identified as dust and ship emissions, contributing roughly the same amount (less than 8%) to PM2.5. The dust factor was characterized by Na, Ca, Mg, Si, and Al [44,45]. Due to the occlusive terrain, the dust was mostly from local sources such as road dust caused by vehicle movement, construction dust, and soil dust due to urban construction [29]. With the continuous advancement of urbanization process in China, there have been steady construction activities in Chinese cities, including many muck and slag trucks shuttling between the urban area and suburbs, which were thought to be the main dust origin of the sampling sites. The proportions of V, Ni, and Mg in the last factor’s source profile from PMF results were the highest among all the recognized sources. Ni and V have been regarded as trace markers for heavy diesel burning in ship emissions [11,15], then they were identified as ship emissions, which were also characterized by EC and NO3 due to cargo ships generally running on diesel in this area. The sampling sites are located near the Jiangjin Port area along the Yangtze River, which is the main transit port for goods from western Chongqing, northern Guizhou, and southern Sichuan. Therefore, ship emissions would contribute a proportion of air pollution in Jiangjin.

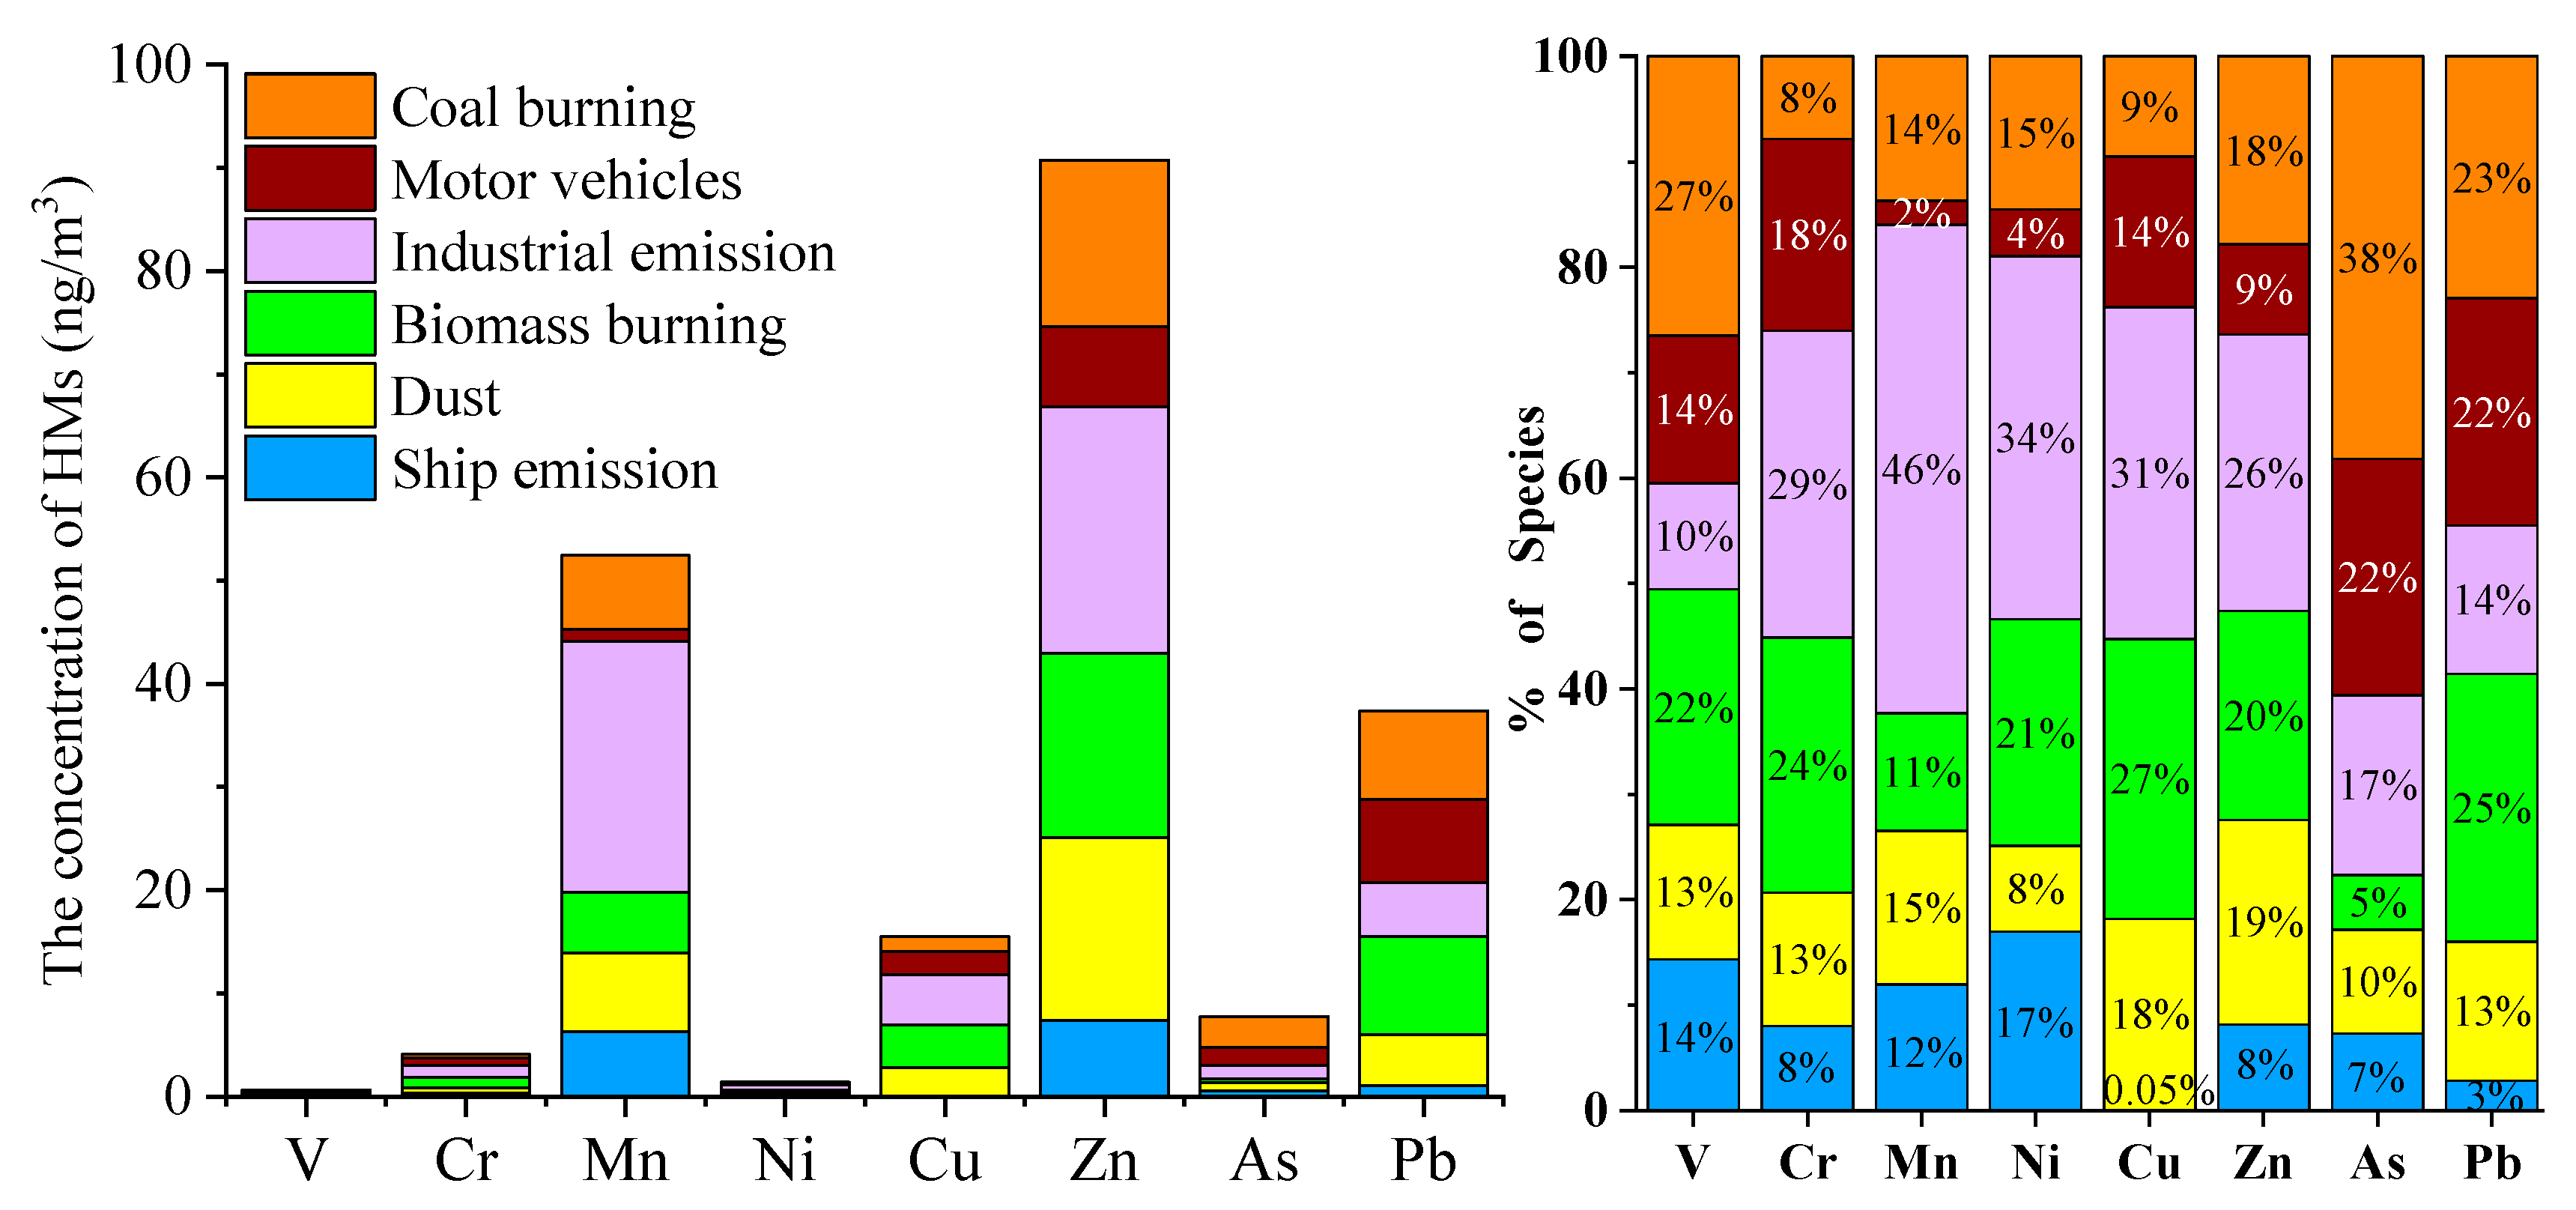
3.2.2. Source Apportionment of PM2.5-Bound Heavy Metals

According to the PMF results, the relative contribution of the above sources to the 8 mentioned HMs was given in Figure 4. The contributors of heavy metals were different from PM2.5, the order of source contributions to the 8 PM2.5-bound HMs was industrial emissions (29.2%) > biomass burning (18.7%) > coal burning (17.7%) > dust (16.4%) > vehicle emissions (10.4%) > ship emissions (7.6%). Although coal burning was the largest PM2.5 contributor, in total, industrial emissions contributed the most of the 8 HMs, and the sources of different metallic elements also varied. V was mainly contributed by coal burning and biomass burning, while motor vehicles, ship emissions, and dust also contributed certain amounts of V. The proportion of V in the ship emissions’ PM2.5 profile from PMF was highest and always used as a marker of heavy oil burning [46,47,48]. Cr was mainly contributed by industrial emissions and biomass burning; motor vehicles also took account of 18% of the total PM2.5-bound Cr. Mn mainly originated from industrial emissions, such as the manganese steel production process [46,49]. The sources of Mn were dust, coal burning, and ship emissions. Ni, Cu, and Zn were mainly emitted from industrial emissions such as metal smelting, while the contribution of biomass burning should not be ignored. Ni can also be emitted from diesel exhausts [46,47,50]; the proportion of ship emissions and motor vehicles contributed about 21% of the total PM2.5-bound Ni. Dust, biomass burning, and coal burning shared similar contribution proportions to PM2.5-bound Zn. It has been reported that Zn accounted for about 1% in the PM2.5 source profile of coal combustion [51]. As was mainly contributed by coal burning, which is used as a tracer for coal combustion [7,52]. Motor vehicles, biomass burning, and coal combustion were three major Pb sources in this study—this is consistent with the results of [11,53].

3.3. Health Risks of Heavy Metals from Pollution Sources

Since the components of PM2.5 varied among different air pollution sources, so do the health risks from each source. Therefore, in order to control the health risk of PM2.5 to the local residents, source apportionment should be integrated with health risk evaluations to estimate source-specific health risks. The corresponding calculation parameters (which have been introduced in 1.2) and health risks of PM2.5-bound HMs were shown in Table 3 and Table 4, respectively. The carcinogenic risk (CR) of PM2.5-bound Cr was the highest among the studied metals in the wintertime of Chongqing due to its high IUR, contributing 72% CR originating from PM2.5-bound HMs. Noncarcinogenic risk (HQ) of PM2.5-bound Mn was the highest in all listed HMs because of its high exposure concentration (44.06 ng/m3), accounting for 65% of the total HMs’ HQ. PM2.5-bound As was the second-highest CR and HQ element, which contributed 22% of the total CR and 26% of the total HQ. The noncarcinogenic risks resulted from PM2.5-bound HMs were the same for adults and children, but PM2.5-bound HMs were four times more likely to cause cancer in adults than in children, which might be due to HMs’ bioaccumulation property in the human body.
Through combining the results of HMs’ source apportionment and health risks assessment, the health risks of HMs from each PM2.5 source were given in Table 5. Industrial emissions were the riskiest heavy metal sources at the study sites, contributing 25% CR and 36% HQ, which resulted from PM2.5-bound HMs, even though industrial emissions are only the third contributors to PM2.5. Biomass burning and vehicle emissions contributed about one fifth of CR, which is the same for industrial emissions; biomass burning was the fourth PM2.5 source, but held similar health risks as the second PM2.5 source. Coal combustion, as the biggest PM2.5 source, only accounted for 15% CR and 21% HQ. All these phenomena indicate that health risks of air pollution sources are the combination effects of the source contribution factor and chemical components’ characteristics. In order to control the health risk of PM2.5 to the local residents, the pollutants from industrial emissions, biomass burning, vehicle emissions, and coal combustion sources should be given more attention in Sichuan Basin and similar regions.

4. Conclusions

In this study, PM2.5 and associated heavy metals were measured from 6 January 2019 to 28 January 2019 in Chongqing, southwest China. The PMF model was adopted to conduct source apportionment of PM2.5-bound HMs, and the health risks carried by 8 listed heavy metals in PM2.5 were assessed with the U.S. EPA method. Finally, this work gave the source-specific health risks from PM2.5-bound HMs by coupling the PMF source apportionment with the risk assessment results. The mean concentrations of PM2.5 and HMs in PM2.5 during the observation period were 97.06 μg/m3 and 220.46 ng/m3, respectively. The downwind industrial site had higher concentrations than the upwind industrial site and urban sites, while suburban was the lowest site. The concentration of Zn was the highest among the 8 heavy metals, followed by Mn and Pb. As and Cr were the two HMs that exceeded the standard limits of GB3095-2012 (As was 26% higher and Cr was 170 times higher) and WHO (As was 15% higher and Cr was 16 times higher). For the five sites on average, six PM2.5 sources have been recognized: coal burning (25.5%), motor vehicles (22.8%), industrial emissions (20.5%), biomass burning (15.9%), dust (7.8%), ship emissions (7.5%). The larger contributors of PM2.5 or PM2.5-bound heavy metals might not be the higher health risk sources; the study results show that health risks of air pollution sources are the combination effects of the source contribution factor and chemical components’ characteristics. Industrial emissions were the riskiest heavy metal sources at the study sites, contributing 25% CR and 36% HQ, which resulted from PM2.5-bound HMs; biomass burning and vehicle emissions contributed about one fifth of CR; coal combustion only accounted for 15% CR and 21% HQ. In order to control the health risk of PM2.5 to the local residents, the pollutants from industrial emissions, biomass burning, vehicle emissions, and coal combustion sources should be given more attention in Sichuan Basin and the similar regions.

Author Contributions

Data curation, J.Z. and S.Z.; Funding acquisition, F.Y.; Investigation, Z.W., H.C. and H.W.; Project administration, M.T. and G.S.; Resources F.Y. and Y.C.; Supervision, Y.C.; Writing original draft, Y.H. All authors have read and agreed to the published version of the manuscript.

Funding

This work was supported by the National Key Research and Development Program of China (No. 2018YFC02004002, 2018YFC0214000 and 2018YFC0214001) and National Natural Science Foundation of China (No. 42075109), Technology Innovation and Application Demonstration Key Project of Chongqing (cstc2018jszx-zdyfxmx0015).

Institutional Review Board Statement

Not applicable.

Informed Consent Statement

Not applicable.

Data Availability Statement

The datasets used and/or analyzed during the current study are available from the corresponding author on reasonable request.

Conflicts of Interest

The authors declare no conflict of interest.

References

  1. Bi, X.; Dai, Q.; Wu, J.; Zhang, Q.; Zhang, W.; Luo, R.; Cheng, Y.; Zhang, J.; Wang, L.; Yu, Z.; et al. Characteristics of the main primary source profiles of particulate matter across China from 1987 to 2017. Atmos. Chem. Phys. Discuss. 2019, 19, 3223–3243. [Google Scholar] [CrossRef] [Green Version]
  2. Yang, F.; Tan, J.; Zhao, Q.; Du, Z.; He, K.; Ma, Y. Characteristics of PM2.5 speciation in representative megacities and across China. Atmos. Chem. Phys. 2011, 11, 1025–1051. [Google Scholar] [CrossRef] [Green Version]
  3. Lim, S.S.; Flaxman, A.D.; Danaei, G.; Shibuya, K. A comparative risk assessment of burden of disease andinjury attributable to 67 risk factors and risk factor clustersin 21 regions, 1990–2010: A systematic analysis for the Global Burden of Disease Study 2010. Lancet 2012, 380, 2224–2260. [Google Scholar] [CrossRef] [Green Version]
  4. Pope, C.A.; Burnett, R.T.; Thun, M.J.; Calle, E.E.; Krewski, D.; Ito, K. Lung cancer, cardiopulmonary mortality, and long-term exposure to fine particulate air pollution. J. Am. Med. Assoc. 2007, 287, 1132–1141. [Google Scholar] [CrossRef] [Green Version]
  5. Shiraiwa, M.; Ueda, K.; Pozzer, A.; Lammel, G.; Kampf, C.J.; Fushimi, A. Aerosol Health Effects from Molecular to Global Scales. Environ. Sci. Technol. 2017, 51, 13545–13567. [Google Scholar] [CrossRef]
  6. Li, F.; Yan, J.J.; Wei, Y.C.; Zeng, J.J.; Wang, X.Y.; Chen, X.Y. PM2.5-bound heavy metals from the major cities in China: Spatiotemporal distribution, fuzzy exposure assessment and health risk management. J. Clean. Prod. 2021, 286, 124967. [Google Scholar] [CrossRef]
  7. Liu, Y.Y.; Xing, J.; Wang, S.X.; Fu, X.; Zheng, H.T. Source-specific speciation profiles of PM2.5 for heavy metals and their anthropogenic emissions in China. Environ. Pollut. 2018, 239, 544–553. [Google Scholar] [CrossRef] [Green Version]
  8. Li, Q.; Cheng, H.G.; Zhou, T.; Lin, C.Y.; Guo, S. The estimated atmospheric lead emissions in China, 1990–2009. Atmos. Environ. 2012, 60, 1–8. [Google Scholar] [CrossRef]
  9. Hsieh, C.; Jung, C.; Lin, C.; Hwang, B. Combined exposure to heavy metals in PM2.5 and pediatric asthma. J. Allergy Clin.Immunol. 2021, 147, 2171–2180. [Google Scholar] [CrossRef]
  10. Xie, J.J.; Yuan, C.G.; Xie, J.; Shen, Y.W.; He, K.Q.; Zhang, K.G. Speciation and bioaccessibility of heavy metals in PM2.5 in Baoding city, China. Environ. Pollut. 2019, 252, 336–343. [Google Scholar] [CrossRef]
  11. Liu, J.W.; Chen, Y.J.; Chao, S.H.; Cao, H.B.; Zhang, A.C.; Yang, Y. Emission control priority of PM2.5-bound heavy metals in different seasons: A comprehensive analysis from health risk perspective. Sci. Total Environ. 2018, 644, 20–30. [Google Scholar] [CrossRef]
  12. Han, Y. The status, dilemma and breakthrough of Shanxi Province energy transformation and development. Coal Econ. Res. 2019, 39, 68–74. (In Chinese) [Google Scholar]
  13. Li, X.; Cui, T. Supportability analysis of sustainable development for coal resources in China. China Coal. 2019, 45, 33–37. (In Chinese) [Google Scholar]
  14. Peng, H.; Chen, Y.L.; Weng, L.P.; Ma, J.; Ma, Y.L.; Li, Y.T. Comparisons of heavy metal input inventory in agricultural soils in North and South China: A review. Sci. Total Environ. 2019, 660, 776–786. [Google Scholar] [CrossRef]
  15. Wen, J.; Wang, X.J.; Zhang, Y.J.; Zhu, H.X.; Chen, Q.; Tian, Y.Z. PM2.5 source profiles and relative heavy metal risk of ship emissions: Source samples from diverse ships, engines, and navigation processes. Atmos. Environ. 2018, 191, 55–63. [Google Scholar] [CrossRef]
  16. Tao, J.; Gao, J.; Zhang, L.; Zhang, R.; Che, H.; Zhang, Z. PM2.5 pollution in a megacity of southwest China: Source apportionment and implication. Atmos. Chem. Phys. 2014, 14, 8679–8699. [Google Scholar] [CrossRef] [Green Version]
  17. Tao, J.; Zhang, L.M.; Zhang, R.J.; Wu, Y.F.; Zhang, Z.S.; Zhang, X.L. Uncertainty assessment of source attribution of PM2.5 and its water-soluble organic carbon content using different biomass burning tracers in positive matrix factorization analysis—A case study in Beijing, China. Sci. Total Environ. 2016, 543, 326–335. [Google Scholar] [CrossRef]
  18. Zhang, N.; Cao, J.; Huang, R.; He, Y.; Wang, Q.; Zhu, C. Seasonal variation, sources and transport of aerosols at lijiang, southeast Tibetan plateau. Aerosol Air Qual. Res. 2016, 16, 1579–1590. [Google Scholar] [CrossRef] [Green Version]
  19. Wang, Q.; Cao, J.; Tao, J.; Li, N.; Su, X.; Chen, L. Long-Term trends in visibility and at Chengdu, China. PLoS ONE 2013, 8, e68894. [Google Scholar] [CrossRef]
  20. Kong, L.; Tan, Q.; Feng, M.; Qu, Y.; An, J.L.; Liu, X.G. Investigating the characteristics and source analyses of PM2.5 seasonal variations in Chengdu, Southwest China. Chemosphere 2020, 243, 125267. [Google Scholar] [CrossRef] [PubMed]
  21. Li, X.J.; Hussain, S.A.; Sobri, S.; Said, M.S.M. Overviewing the air quality models on air pollution in Sichuan Basin, China. Chemosphere 2021, 271, 129502. [Google Scholar] [CrossRef] [PubMed]
  22. Han, Y.; Xu, H.; Bi, X.; Lin, F.; Jiao, L.; Zhang, Y.; Feng, Y. The effect of atmospheric particulates on the rainwater chemistry in the Yangtze River Delta, China. J. Air Waste Manag. Assoc. 2019, 69, 1452–1466. [Google Scholar] [CrossRef] [PubMed]
  23. Tao, M.; Zhou, J.; Liang, J.; Cui, H.; Xu, L.; Zhu, Z. Atmospheric deposition of heavy metals in farmland area around a copper smelter. J. Agro-Environ. Sci. 2014, 33, 1328–1334. [Google Scholar]
  24. Weerasundara, L.; Amarasekara, R.W.K.; Magana-Arachchi, D.N.; Ziyath, A.M.; Karunaratne, D.G.G.P.; Goonetilleke, A. Microorganisms and heavy metals associated with atmospheric deposition in a congested urban environment of a developing country: Sri Lanka. Sci. Total Environ. 2017, s584–585, 803–812. [Google Scholar] [CrossRef] [Green Version]
  25. Wang, X.; Qin, Y.; Qin, J.; Yang, Y.; Qi, T.; Chen, R. The interaction laws of atmospheric heavy metal ions and water-soluble organic compounds in PM2.5 based on the excitation-emission matrix fluorescence spectroscopy. J. Hazard. Mater. 2020, 402, 123497. [Google Scholar] [CrossRef]
  26. Wang, H.B.; Qiao, B.Q.; Zhang, L.M.; Yang, F.M.; Xing, J. Characteristics and sources of trace elements in PM2.5 in two megacities in Sichuan Basin of southwest China. Environ. Pollut. 2018, 242, 1577–1586. [Google Scholar] [CrossRef]
  27. US EPA. Risk Assessment Guidance for Superfund. Volume 1: Human Health Evaluation Manual (Part A). Office of Emergency and Remedial Response. 1989. Available online: http://www.epa.gov/risk/risk-assessment-guidance-superfund-rags-part (accessed on 18 July 2021).
  28. Volckens, J.; Leith, D. Partitioning theory for respiratory deposition of semivolatile aerosols. Ann. Occup. Hyg. 2003, 47, 157–164. [Google Scholar]
  29. Huang, R.J.; Cheng, R.; Jing, M.; Yang, L.; Li, Y.J.; Chen, Q. Source-Specific Health Risk Analysis on Particulate Trace Elements: Coal Combustion and Traffic Emission As Major Contributors in Wintertime Beijing. Environ. Sci. Technol. 2018, 52, 10967–10974. [Google Scholar] [CrossRef]
  30. US EPA. Risk Assessment. Regional Screening Levels (RSLs)–Generic Tables. May 2021. Available online: http://www.epa.gov/risk/regional-screening-levels-rsls-generic-tables (accessed on 18 July 2021).
  31. Chen, Y.; Xie, S.D.; Luo, B.; Zhai, C.Z. Pollution characterization and source apportionment of fine particles in urban Chongqing. Acta. Sci. Circ. 2017, 37, 2420–2430. (In Chinese) [Google Scholar]
  32. Tao, J.; Zhang, L.; Cao, J.; Hsu, S.C.; Xia, X.; Zhang, Z. Characterization and source apportionment of aerosol light extinction in Chengdu, southwest China. Atmos. Environ. 2014, 95, 552–562. [Google Scholar] [CrossRef]
  33. Wang, X.B.; Qin, Y.Y.; Qin, J.J.; Long, X.X.; Qi, T.; Chen, R.Z. Spectroscopic insight into the pH-dependent interactions between atmospheric heavy metals (Cu and Zn) and water-soluble organic compounds in PM2.5. Sci. Total Environ. 2021, 767, 145261. [Google Scholar] [CrossRef]
  34. Amato, F.; Hopke, P.K. Source apportionment of the ambient PM2.5 across St. Louis using constrained positive matrix factorization. Atmos. Environ. 2012, 46, 329–337. [Google Scholar] [CrossRef]
  35. Polissar, A.V.; Hopke, P.K.; Paatero, P.; Malm, W.C.; Sisler, J.F. Atmospheric aerosol over Alaska: 2. Elemental composition and sources. J. Geophys. Res. 1998, 103, 19045–19057. [Google Scholar] [CrossRef]
  36. Hao, Y.; Gao, C.; Deng, S.; Yuan, M.; Song, W.; Lu, Z.; Qiu, Z. Chemical characterisation of PM2.5 emitted from motor vehicles powered by diesel, gasoline, natural gas and methanol fuel. Sci. Total Environ. 2019, 674, 128–139. [Google Scholar] [CrossRef]
  37. Duan, X.; Yan, Y.; Li, R.; Deng, M.; Hu, D.; Peng, L. Seasonal variations, source apportionment, and health risk assessment of trace metals in PM2.5 in the typical industrial city of changzhi, China. Atmos. Pollut. Res. 2021, 12, 365–374. [Google Scholar] [CrossRef]
  38. Guo, Y.; Gao, X.; Zhu, T.; Luo, L.; Zheng, Y. Chemical profiles of PM emitted from the iron and steel industry in northern China. Atmos. Environ. 2017, 150, 187–197. [Google Scholar] [CrossRef] [Green Version]
  39. Zhu, H.; Dai, L.H.; Wei, Y.; Zhang, Y.J.; Hu, Q.H.; Wu, S.P. Characteristics of inorganic ions and organic components in PM2.5 from biomass burning. Acta. Sci. Circum. 2017, 37, 4483–4491. (In Chinese) [Google Scholar]
  40. Li, X.H.; Wang, S.X.; Duan, L.; Hao, J.M.; Nie, Y.F. Carbonaceous aerosol emissions from household bioful combustion in China. Environ. Sci. Technol. 2009, 43, 6076–6081. [Google Scholar] [CrossRef] [PubMed]
  41. Zhou, Y.; Luo, B.; Li, J.; Hao, Y.; Yang, W.; Shi, F. Characteristics of six criteria air pollutants before, during, and after a severe air pollution episode caused by biomass burning in the southern Sichuan Basin, China. Atmos. Environ. 2019, 215, 116840. [Google Scholar] [CrossRef]
  42. Zhou, Z.; Tan, Q.; Deng, Y.; Wu, K.; Yang, X.; Zhou, X. Emission inventory of anthropogenic air pollutant sources and characteristics of VOCs species in Sichuan Province, China. J. Atmos. Chem. 2019, 76, 21–58. [Google Scholar] [CrossRef]
  43. Song, M.; Tan, Q.; Feng, M.; Qu, Y.; Liu, X.; An, J. Source apportionment and secondary transformation of atmospheric nonmethane hydrocarbons in Chengdu, southwest China. J. Geophys. Res. 2018, 123, 9741–9763. [Google Scholar] [CrossRef]
  44. Ho, K.F.; Lee, S.C.; Chow, J.C.; Watson, J.G. Characterization of PM10 and PM2.5 source profiles for fugitive dust in Hong Kong. Atmos. Environ. 2003, 37, 1023–1032. [Google Scholar] [CrossRef]
  45. Shen, Z.X.; Sun, J.; Cao, J.J.; Zhang, L.M.; Zhang, Q.; Lei, Y.L. Chemical profiles of urban fugitive dust PM2.5 samples in Northern Chinese cities. Sci. Total Environ. 2016, 569–570, 619–626. [Google Scholar] [CrossRef] [PubMed]
  46. Wang, S.S.; Hu, G.R.; Yu, R.L.; Shen, H.Z.; Yan, Y. Bioaccessibility and source-specific health risk of heavy metals in PM2.5 in a coastal city in China. Environ. Adv. 2021, 4, 100047. [Google Scholar] [CrossRef]
  47. Kuang, B.Y.; Lin, P.; Huang, X.H.H.; Yu, J.Z. Sources of humic-like substances in the Pearl River Delta, China: Positive matrix factorization analysis of PM2.5 major components and source markers. Atmos. Chem. Phy. 2015, 15, 1995–2008. [Google Scholar] [CrossRef] [Green Version]
  48. Pacyna, J.M.; Pacyna, E.G. An assessment of global and regional emissions of trace metals to the atmosphere from anthropogenic sources worldwide. Environ. Rev. 2001, 9, 269–298. [Google Scholar] [CrossRef]
  49. Ledoux, F.; Kfoury, A.; Delmaire, G.; Roussel, G.; El, Z.A.; Courcot, D. Contributions of local and regional anthropogenic sources of metals in PM2.5 at an urban site in northern France. Chemosphere 2017, 181, 713–724. [Google Scholar] [CrossRef] [PubMed]
  50. Soleimani, M.; Amini, N.; Sadeghian, B.; Wang, D.S.; Fang, L.P. Heavy metals and their source identification in particulate matter (PM2.5) in Isfahan City, Iran. J. Environ. Sci. 2018, 72, 166–175. [Google Scholar] [CrossRef]
  51. Liu, Y.; Hu, J.; Wang, X.; Jia, J.; Li, J.; Wang, L. Distribution, bioaccessibility, and health risk assessment of heavy metals in PM2.5 and PM10 during winter heating periods in five types of cities in Northeast China. Ecotox. Environ. Saf. 2021, 214, 112071. [Google Scholar] [CrossRef]
  52. Dai, Q.; Bi, X.-H.; Wu, J.; Zhang, Y.-F.; Wang, J.; Xu, H.; Yao, L.; Jiao, L.; Feng, Y.-C. Characterization and Source Identification of Heavy Metals in Ambient PM10 and PM2.5 in an Integrated Iron and Steel Industry Zone Compared with a Background Site. Aerosol Air Qual. Res. 2015, 15, 875–887. [Google Scholar] [CrossRef] [Green Version]
  53. Duan, J.; Guo, S.; Tan, J.; Wang, S.; Chai, F. Characteristics of atmospheric carbonyls during haze days in Beijing, China. Atmos. Res. 2012, 114–115, 17–27. [Google Scholar] [CrossRef]
Figure 1. Location of the sampling sites in Jiangjin of Chongqing, China.
Atmosphere 12 00929 g001
Figure 2. Temporal variation of PM2.5-bound HMs at five sampling sites.
Atmosphere 12 00929 g002
Figure 3. Relative source contributions to the measured PM2.5 and associated components.
Atmosphere 12 00929 g003
Figure 4. Absolute (left) and relative (right) source contributions to the 8 HMs in PM2.5.
Atmosphere 12 00929 g004
Table 1. The concentrations of PM2.5 and PM2.5-bound HMs (mean ± std).
SitesS1S2S3S4S5All
PM2.5 (μg/m3)106.60 ± 36.1192.92 ± 32.8484.56 ± 28.39101.25 ± 35.4992.10 ± 32.4897.06 ± 33.05
HMs (ng/m3)201.41 ± 34.03193.95 ± 33.75163.30 ± 26.82329.53 ± 53.28198.54 ± 29.35220.46 ± 72.53
Zn (ng/m3)100.78 ± 65.46100.17 ± 51.9578.03 ± 33.62104.08 ± 34.7382.51 ± 24.9494.22 ± 32.90
Mn (ng/m3)34.99 ± 15.9430.69 ± 12.0631.97 ± 14.89142.17 ± 89.4150.28 ± 20.5158.63 ± 24.48
Pb (ng/m3)39.38 ± 13.5038.32 ± 15.6733.02 ± 11.1640.48 ± 15.0036.10 ± 13.4837.93 ± 13.29
Cu (ng/m3)13.25 ± 6.3812.44 ± 5.6811.85 ± 5.1425.63 ± 18.0214.76 ± 6.0515.83 ± 7.22
As (ng/m3)6.52 ± 4.558.05 ± 3.994.43 ± 3.868.15 ± 4.288.97 ± 5.757.56 ± 4.38
Cr (ng/m3)5.04 ± 2.552.92 ± 1.182.76 ± 1.466.21 ± 3.364.07 ± 2.144.29 ± 1.76
Ni (ng/m3)1.14 ± 1.331.00 ± 0.580.54 ± 0.681.82 ± 1.381.50 ± 0.541.39 ± 0.42
V (ng/m3)0.30 ± 0.200.36 ± 0.250.70 ± 0.681.00 ± 0.500.36 ± 0.280.60 ± 0.25
HMs—heavy metals; std—standard deviation.
Table 2. Reference concentration limits for HMs in ambient air (ng/m3).
SourcePbVAsMnNiCr (VI)Issued Year
GB3095-2012500 6150 0.0252012
WHO50010006.6150250.252000
EU 6 20 2004
U.S. EPA150 2016
India 6 20 2009
WHO—World Health Organization; EU—European Union; U.S. EPA—U.S. Environmental Protection Agency.
Table 3. The calculated Ei, C, RfC, and IUR.
ElementsEiC (ng/m3)RfC (mg/m3)IUR (μg/m3)−1
V0.480.417.00 × 10−68.30 × 10⁻³
Cr0.480.891.00 × 10−48.40 × 10⁻²
Mn0.4844.065.00 × 10−5
Ni0.480.641.40 × 10−52.40 × 10⁻⁴
As0.485.271.50 × 10−54.30 × 10⁻³
Pb0.4832.62 8.00 × 10⁻⁵
Ei—the deposition fraction of PM2.5 that can penetrate in lung; C—the inhaled concentration of each HM during the monitoring periods; RfC—the inhalation reference concentration; IUR—inhalation unit risk.
Table 4. Carcinogenic risks and noncarcinogenic risks resulted from PM2.5-bound HMs.
ElementsCRHQ (Non-CR)
AdultsChildrenAdultsChildren
V2.72 × 10−76.81 × 10−81.37 × 10−21.37 × 10⁻²
Cr6.04 × 10−61.51 × 10−62.10 × 10−32.10 × 10⁻³
Mn 2.07 × 10−12.07 × 10−1
Ni1.24 × 10−83.10 × 10−91.08 × 10−21.08 × 10⁻²
As1.82 × 10−64.56 × 10−78.24 × 10−28.24 × 10⁻²
Pb2.10 × 10−75.25 × 10⁻⁸
Sum8.36 × 10−62.09 × 10−63.16 × 10−13.16 × 10⁻¹
HQ—hazard quotient; CR—carcinogenic risk.
Table 5. Carcinogenic and noncarcinogenic risks resulted from six emission sources via inhalation exposure to PM2.5 in winter 2019 in Chongqing.
SourcesCRHQ (Non-CR)
AdultsChildrenAdultsChildren
Coal combustion1.29 × 10−63.23 × 10−76.52 × 10−26.52 × 10⁻²
Biomass burning1.67 × 10−64.18 × 10−73.33 × 10−23.33 × 10⁻²
Industrial emission2.13 × 10−65.32 × 10−71.16 × 10−11.16 × 10⁻¹
Ship emission6.67 × 10−71.67 × 10−73.48 × 10−23.48 × 10⁻²
Dust1.01 × 10−62.52 × 10−74.11 × 10−24.11 × 10⁻²
Vehicle emission1.59 × 10−63.98 × 10−72.59 × 10−22.59 × 10⁻²
Sum8.36 × 10−62.09 × 10−63.16 × 10−13.16 × 10⁻¹
HQ—hazard quotient; CR—carcinogenic risk.
Publisher’s Note: MDPI stays neutral with regard to jurisdictional claims in published maps and institutional affiliations.

