
The Impact of Large-Scale Social Restriction Phases on the Air Quality Index in Jakarta

 ,
,  , , and
Abstract
:1. Introduction
2. Materials and Methods
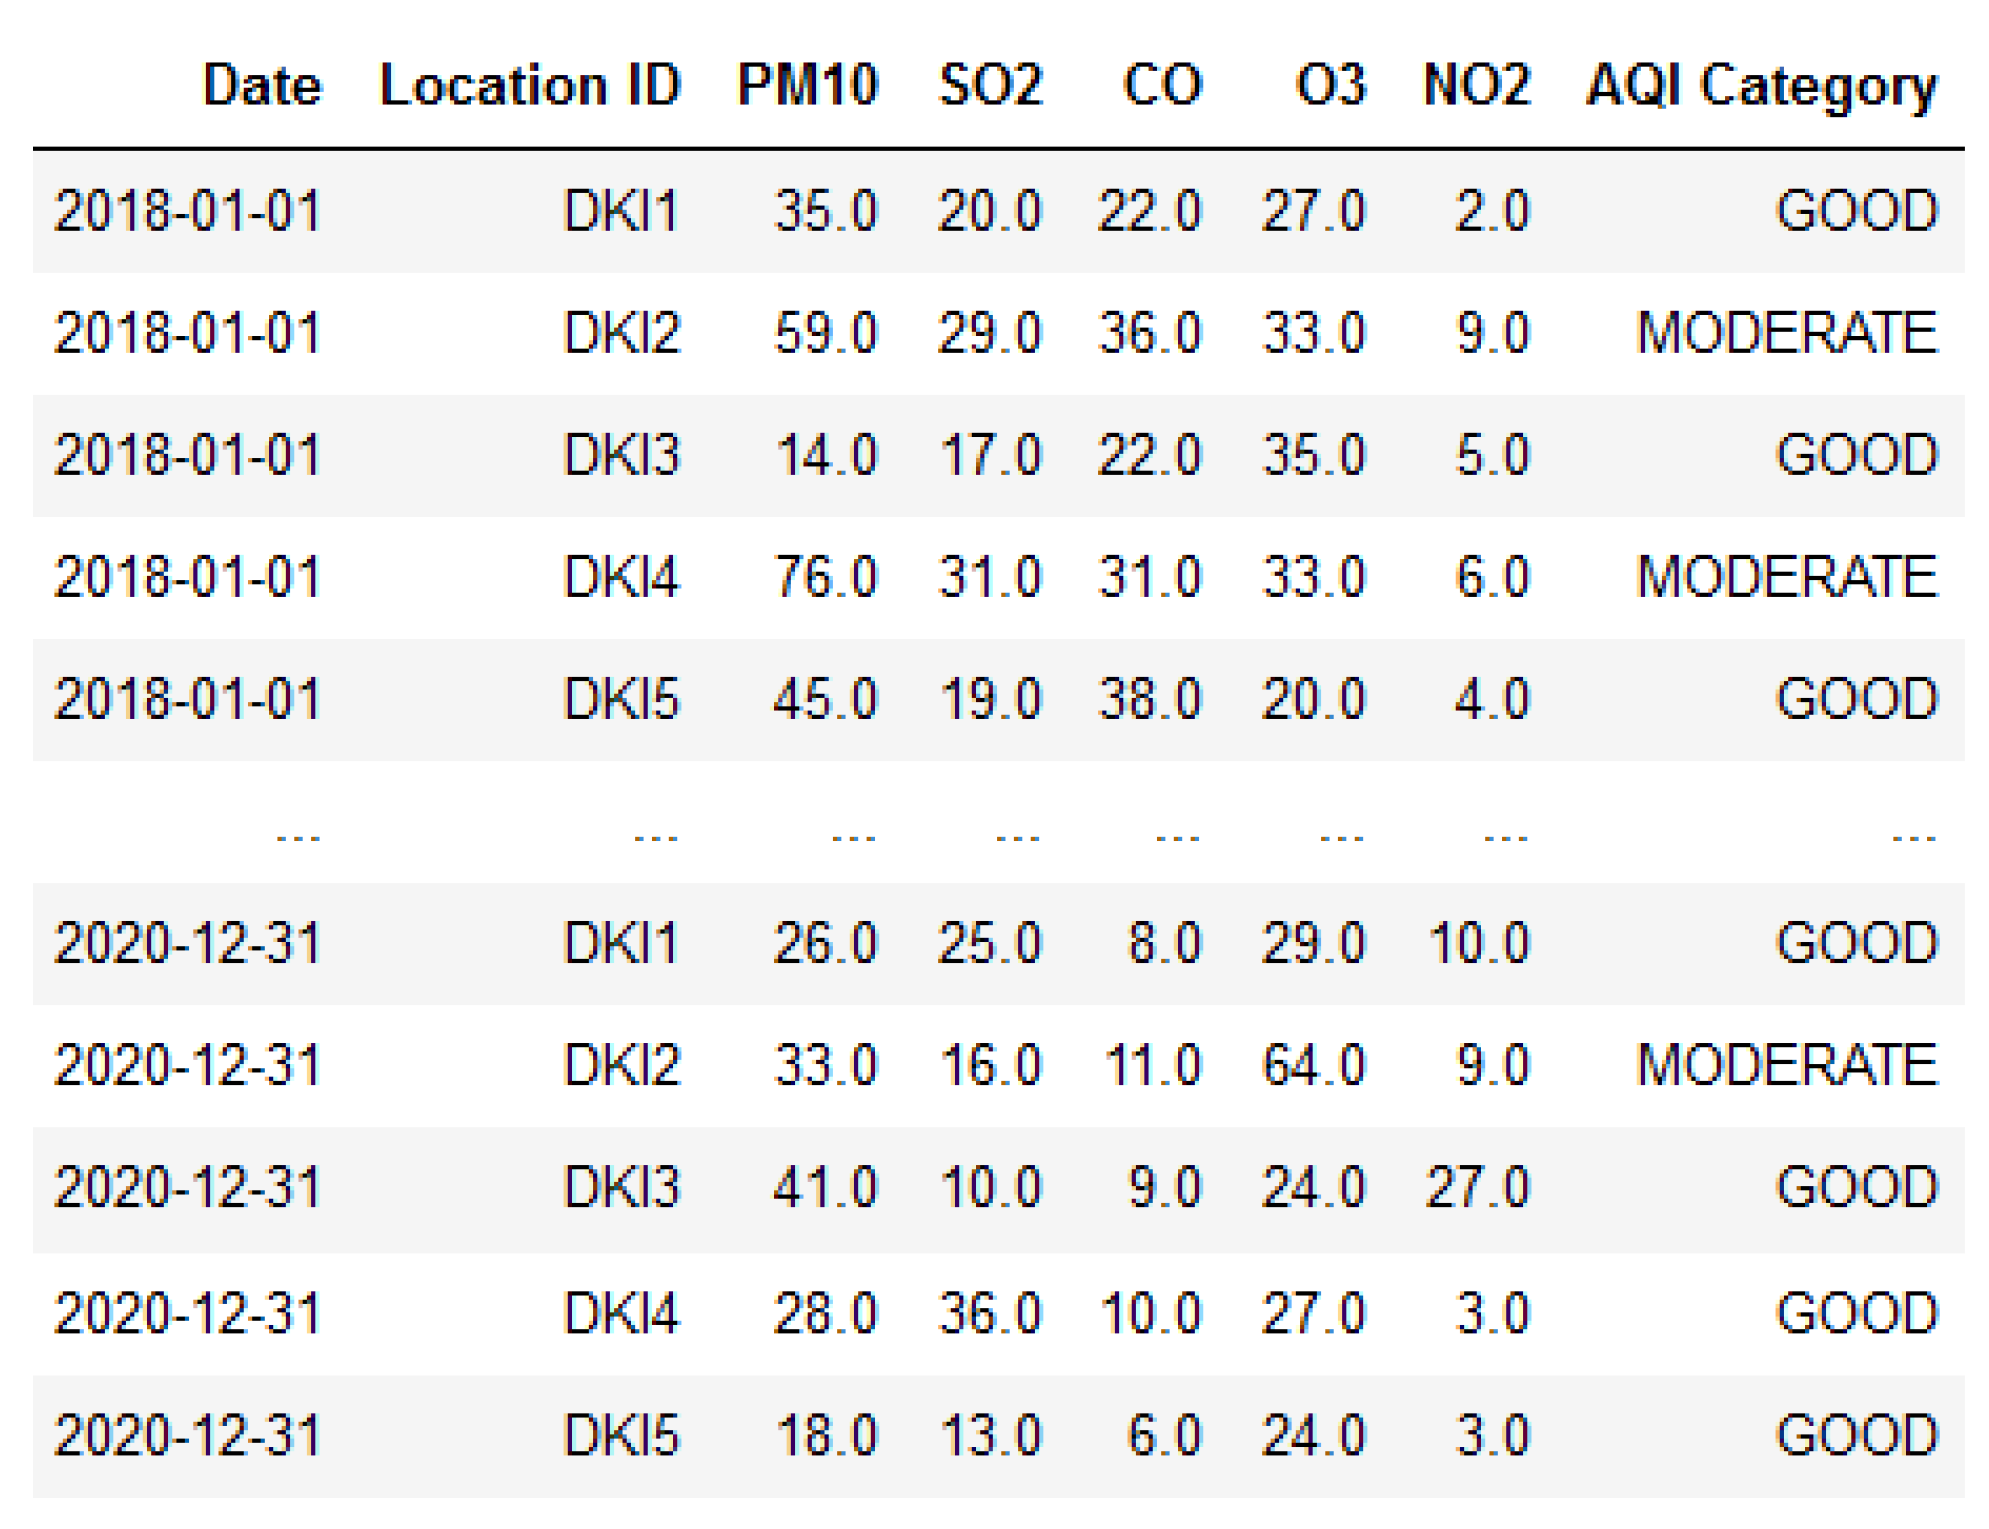
2.1. Dataset
2.2. Statistical Analysis
3. Results
4. Discussion
5. Conclusions
Author Contributions
Funding
Institutional Review Board Statement
Informed Consent Statement
Data Availability Statement
Acknowledgments
Conflicts of Interest
Abbreviations
| AQI | Air Quality Index; |
| LSSR | Large-Scale Social Restriction. |
References
- Li, Q.; Guan, X.; Wu, P.; Wang, X.; Zhou, L.; Tong, Y.; Ren, R.; Leung, K.S.; Lau, E.H.; Wong, J.Y.; et al. Early transmission dynamics in Wuhan, China, of novel coronavirus–infected pneumonia. N. Engl. J. Med. 2020, 382, 1199–1207. [Google Scholar] [CrossRef]
- WHO. WHO Director-General’s Opening Remarks at the Media Briefing on COVID-19–11 March 2020; WHO: Geneva, Switzerland, 2020. [Google Scholar]
- Caraka, R.; Lee, Y.; Kurniawan, R.; Herliansyah, R.; Kaban, P.; Nasution, B.; Gio, P.; Chen, R.; Toharudin, T.; Pardamean, B. Impact of COVID-19 large scale restriction on environment and economy in Indonesia. Glob. J. Environ. Sci. Manag. 2020, 6, 65–84. [Google Scholar]
- DKI Jakarta Government. DKI Jakarta Governor Regulation No. 33/2020. On LSSR Implementation in DKI Jakarta; DKI Jakarta Government: Jakarta, Indonesia, 2020.
- DKI Jakarta Government. DKI Jakarta Governor Regulation No. 51/2020. On Health Protocols and Guidelines for Workplace during Transitional LSSR; DKI Jakarta Government: Jakarta, Indonesia, 2020.
- DKI Jakarta Government. DKI Jakarta Governor Regulation No. 88/2020. Amendment of Governor Regulation No. 33/2020 on LSSR Implementation in DKI Jakarta; DKI Jakarta Government: Jakarta, Indonesia, 2020.
- DKI Jakarta Government. DKI Jakarta Governor Regulation No. 101/2020. Amendment of Governor Regulation No. 79/2020 on Health Protocol Enforcement to Prevent and Control the Spread of COVID-19; DKI Jakarta Government: Jakarta, Indonesia, 2020.
- Lestari, P.; Damayanti, S.; Arrohman, M.K. Emission Inventory of Pollutants (CO, SO2, PM2.5, and NOX) in Jakarta Indonesia. In IOP Conference Series: Earth and Environmental Science; IOP Publishing: Kuala Lumpur, Malaysia, 2020; Volume 489, p. 012014. [Google Scholar]
- Filippini, T.; Rothman, K.J.; Goffi, A.; Ferrari, F.; Maffeis, G.; Orsini, N.; Vinceti, M. Satellite-detected tropospheric nitrogen dioxide and spread of SARS-CoV-2 infection in Northern Italy. Sci. Total Environ. 2020, 739, 140278. [Google Scholar] [CrossRef]
- Huang, G.; Sun, K. Non-negligible impacts of clean air regulations on the reduction of tropospheric NO2 over East China during the COVID-19 pandemic observed by OMI and TROPOMI. Sci. Total Environ. 2020, 745, 141023. [Google Scholar] [CrossRef]
- Marlier, M.E.; Xing, J.; Zhu, Y.; Wang, S. Impacts of COVID-19 response actions on air quality in China. Environ. Res. Commun. 2020, 2, 075003. [Google Scholar] [CrossRef]
- Ranjan, A.K.; Patra, A.; Gorai, A. Effect of lockdown due to SARS COVID-19 on aerosol optical depth (AOD) over urban and mining regions in India. Sci. Total Environ. 2020, 745, 141024. [Google Scholar] [CrossRef] [PubMed]
- Wang, Q.; Su, M. A preliminary assessment of the impact of COVID-19 on environment—A case study of China. Sci. Total Environ. 2020, 728, 138915. [Google Scholar] [CrossRef]
- Vuong, Q.T.; Thang, P.Q.; Park, M.K.; Choi, S.D. Effects of the COVID-19 lockdown on criteria air pollutants in the city of Daegu, the epicenter of South Korea’s outbreak. Environ. Sci. Pollut. Res. 2020, 27, 45983–45991. [Google Scholar] [CrossRef]
- Zhang, R.; Zhang, Y.; Lin, H.; Feng, X.; Fu, T.M.; Wang, Y. NOx emission reduction and recovery during COVID-19 in East China. Atmosphere 2020, 11, 433. [Google Scholar] [CrossRef] [Green Version]
- Dong, L.; Chen, B.; Huang, Y.; Song, Z.; Yang, T. Analysis on the Characteristics of Air Pollution in China during the COVID-19 Outbreak. Atmosphere 2021, 12, 205. [Google Scholar] [CrossRef]
- Chauhan, A.; Singh, R.P. Decline in PM2.5 concentrations over major cities around the world associated with COVID-19. Environ. Res. 2020, 187, 109634. [Google Scholar] [CrossRef] [PubMed]
- Kumar, S. Effect of meteorological parameters on spread of COVID-19 in India and air quality during lockdown. Sci. Total Environ. 2020, 745, 141021. [Google Scholar] [CrossRef] [PubMed]
- Vadrevu, K.P.; Eaturu, A.; Biswas, S.; Lasko, K.; Sahu, S.; Garg, J.; Justice, C. Spatial and temporal variations of air pollution over 41 cities of India during the COVID-19 lockdown period. Sci. Rep. 2020, 10, 16574. [Google Scholar] [CrossRef]
- Kanniah, K.D.; Zaman, N.A.F.K.; Kaskaoutis, D.G.; Latif, M.T. COVID-19’s impact on the atmospheric environment in the Southeast Asia region. Sci. Total Environ. 2020, 736, 139658. [Google Scholar] [CrossRef]
- Stratoulias, D.; Nuthammachot, N. Air quality development during the COVID-19 pandemic over a medium-sized urban area in Thailand. Sci. Total Environ. 2020, 746, 141320. [Google Scholar] [CrossRef]
- Anugerah, A.R.; Muttaqin, P.S.; Purnama, D.A. Effect of large-scale social restriction (PSBB) during COVID-19 on outdoor air quality: Evidence from five cities in DKI Jakarta Province, Indonesia. Environ. Res. 2021, 197, 111164. [Google Scholar] [CrossRef]
- Rahutomo, R.; Purwandari, K.; Sigalingging, J.W.; Pardamean, B. Improvement of Jakarta’s Air Quality during Large Scale Social Restriction. In IOP Conference Series: Earth and Environmental Science; IOP Publishing: Jakarta, Indonesia, 2021; Volume 729, p. 012132. [Google Scholar]
- Baldasano, J.M. COVID-19 lockdown effects on air quality by NO2 in the cities of Barcelona and Madrid (Spain). Sci. Total Environ. 2020, 741, 140353. [Google Scholar] [CrossRef]
- Collivignarelli, M.C.; Abbà, A.; Bertanza, G.; Pedrazzani, R.; Ricciardi, P.; Miino, M.C. Lockdown for CoViD-2019 in Milan: What are the effects on air quality? Sci. Total Environ. 2020, 732, 139280. [Google Scholar] [CrossRef]
- Hörmann, S.; Jammoul, F.; Kuenzer, T.; Stadlober, E. Separating the impact of gradual lockdown measures on air pollutants from seasonal variability. Atmos. Pollut. Res. 2021, 12, 84–92. [Google Scholar] [CrossRef]
- Piccoli, A.; Agresti, V.; Balzarini, A.; Bedogni, M.; Bonanno, R.; Collino, E.; Colzi, F.; Lacavalla, M.; Lanzani, G.; Pirovano, G.; et al. Modeling the Effect of COVID-19 Lockdown on Mobility and NO2 Concentration in the Lombardy Region. Atmosphere 2020, 11, 1319. [Google Scholar] [CrossRef]
- Sicard, P.; De Marco, A.; Agathokleous, E.; Feng, Z.; Xu, X.; Paoletti, E.; Rodriguez, J.J.D.; Calatayud, V. Amplified ozone pollution in cities during the COVID-19 lockdown. Sci. Total Environ. 2020, 735, 139542. [Google Scholar] [CrossRef] [PubMed]
- Tobías, A.; Carnerero, C.; Reche, C.; Massagué, J.; Via, M.; Minguillón, M.C.; Alastuey, A.; Querol, X. Changes in air quality during the lockdown in Barcelona (Spain) one month into the SARS-CoV-2 epidemic. Sci. Total Environ. 2020, 726, 138540. [Google Scholar] [CrossRef] [PubMed]
- Kaskaoutis, D.G.; Grivas, G.; Liakakou, E.; Kalivitis, N.; Kouvarakis, G.; Stavroulas, I.; Kalkavouras, P.; Zarmpas, P.; Dumka, U.C.; Gerasopoulos, E.; et al. Assessment of the COVID-19 Lockdown Effects on Spectral Aerosol Scattering and Absorption Properties in Athens, Greece. Atmosphere 2021, 12, 231. [Google Scholar] [CrossRef]
- Lonati, G.; Riva, F. Regional Scale Impact of the COVID-19 Lockdown on Air Quality: Gaseous Pollutants in the Po Valley, Northern Italy. Atmosphere 2021, 12, 264. [Google Scholar] [CrossRef]
- Grivas, G.; Athanasopoulou, E.; Kakouri, A.; Bailey, J.; Liakakou, E.; Stavroulas, I.; Kalkavouras, P.; Bougiatioti, A.; Kaskaoutis, D.G.; Ramonet, M.; et al. Integrating in situ Measurements and City Scale Modelling to Assess the COVID-19 Lockdown Effects on Emissions and Air Quality in Athens, Greece. Atmosphere 2020, 11, 1174. [Google Scholar] [CrossRef]
- Dinoi, A.; Gulli, D.; Ammoscato, I.; Calidonna, C.R.; Contini, D. Impact of the Coronavirus Pandemic Lockdown on Atmospheric Nanoparticle Concentrations in Two Sites of Southern Italy. Atmosphere 2021, 12, 352. [Google Scholar] [CrossRef]
- Jia, C.; Fu, X.; Bartelli, D.; Smith, L. Insignificant Impact of the “Stay-At-Home” Order on Ambient Air Quality in the Memphis Metropolitan Area, USA. Atmosphere 2020, 11, 630. [Google Scholar] [CrossRef]
- Zangari, S.; Hill, D.T.; Charette, A.T.; Mirowsky, J.E. Air quality changes in New York City during the COVID-19 pandemic. Sci. Total Environ. 2020, 742, 140496. [Google Scholar] [CrossRef] [PubMed]
- Bolaño-Ortiz, T.R.; Pascual-Flores, R.M.; Puliafito, S.E.; Camargo-Caicedo, Y.; Berná-Peña, L.L.; Ruggeri, M.F.; Lopez-Noreña, A.I.; Tames, M.F.; Cereceda-Balic, F. Spread of COVID-19, Meteorological Conditions and Air Quality in the City of Buenos Aires, Argentina: Two Facets Observed during Its Pandemic Lockdown. Atmosphere 2020, 11, 1045. [Google Scholar] [CrossRef]
- Dantas, G.; Siciliano, B.; França, B.B.; da Silva, C.M.; Arbilla, G. The impact of COVID-19 partial lockdown on the air quality of the city of Rio de Janeiro, Brazil. Sci. Total Environ. 2020, 729, 139085. [Google Scholar] [CrossRef]
- Parra, R.; Espinoza, C. Insights for Air Quality Management from Modeling and Record Studies in Cuenca, Ecuador. Atmosphere 2020, 11, 998. [Google Scholar] [CrossRef]
- Virtanen, P.; Gommers, R.; Oliphant, T.E.; Haberland, M.; Reddy, T.; Cournapeau, D.; Burovski, E.; Peterson, P.; Weckesser, W.; Bright, J.; et al. SciPy 1.0: Fundamental Algorithms for Scientific Computing in Python. Nat. Methods 2020, 17, 261–272. [Google Scholar] [CrossRef] [PubMed] [Green Version]
- Roy, S.; Saha, M.; Dhar, B.; Pandit, S.; Nasrin, R. Geospatial analysis of COVID-19 lockdown effects on air quality in the South and Southeast Asian region. Sci. Total Environ. 2021, 756, 144009. [Google Scholar] [CrossRef] [PubMed]


| Name of the Phase | Period | Key Characteristics |
|---|---|---|
| The 1st regular LSSR phase | 10 April–3 June | Total shutdown of social interaction in non-vital sectors |
| The 1st transition phase | 4 June–13 September | Fifty percent of office room occupation was allowed for the previously restricted sectors |
| The 2nd regular LSSR phase | 14 September–11 October | Twenty-five percent of office room occupation was allowed for the previously restricted sectors |
| The 2nd transition phase | 12 October–21 December | Fifty percent of office room occupation was allowed for the previously restricted sectors |
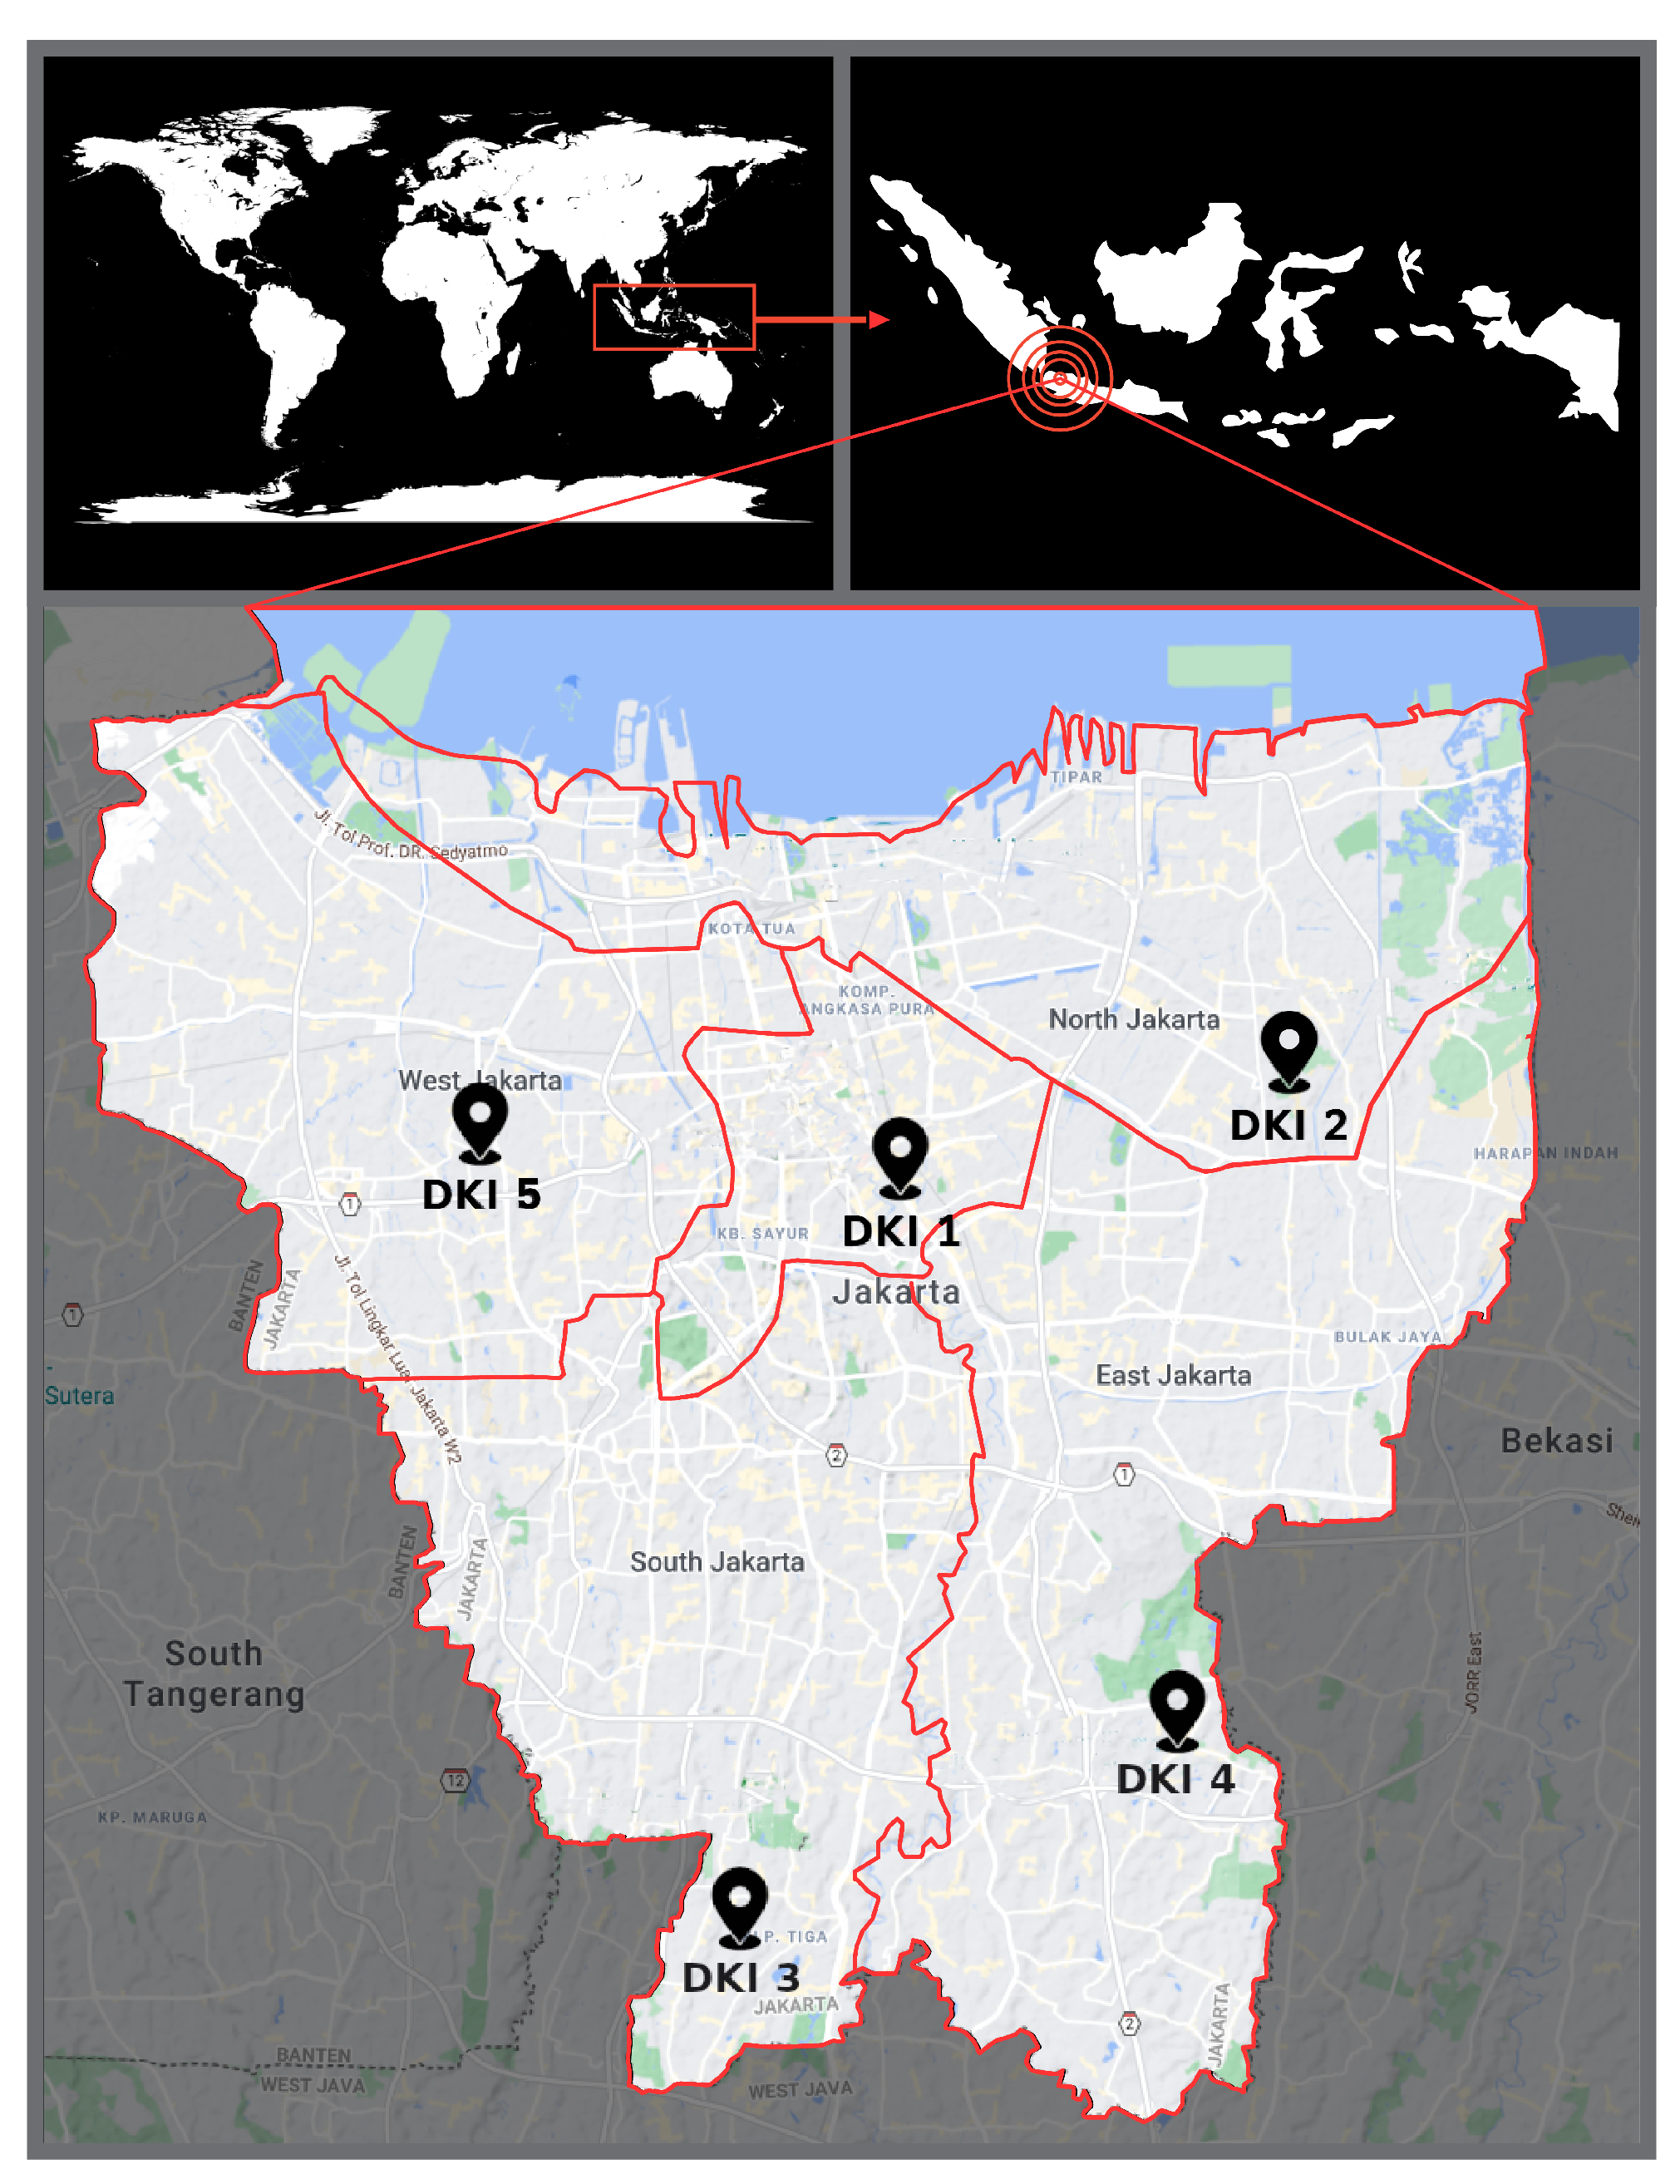
| Code | Location | Region | Characteristic |
|---|---|---|---|
| DKI1 | Bundaran HI | Central Jakarta | Office district |
| DKI2 | Kelapa Gading | North Jakarta | Crowded residential close to industrial parks |
| DKI3 | Jagakarsa | South Jakarta | Crowded residential |
| DKI4 | Lubang Buaya | East Jakarta | Less crowded residential and recreation spot |
| DKI5 | Kebon Jeruk | West Jakarta | Crowded residential, offices, and shops |
| Category | Value Range |
|---|---|
| Good | 0–50 |
| Moderate | 51–100 |
| Unhealthy | 101–199 |
| Very Unhealthy | 200–299 |
| Hazardous | 300 or more |
| Location | Year | Good | Moderate | Unhealthy | Very Unhealthy | p-Value |
|---|---|---|---|---|---|---|
| All | 2018 | 323 | 828 | 297 | 25 | * |
| Diff. to 2020 | 17 | 208 | ||||
| 2019 | 151 | 1052 | 271 | 7 | * | |
| Diff. to 2020 | 190 | |||||
| DKI1 | 2018 | 144 | 144 | 4 | 0 | * |
| Diff. to 2020 | 37 | 0 | ||||
| 2019 | 49 | 232 | 13 | 0 | * | |
| Diff. to 2020 | 57 | 0 | ||||
| DKI2 | 2018 | 53 | 147 | 88 | 10 | * |
| Diff. to 2020 | 14 | 66 | ||||
| 2019 | 32 | 228 | 41 | 0 | * | |
| Diff. to 2020 | 36 | 0 | ||||
| DKI3 | 2018 | 45 | 175 | 68 | 0 | * |
| Diff. to 2020 | 4 | 46 | 0 | |||
| 2019 | 10 | 201 | 84 | 0 | * | |
| Diff. to 2020 | 43 | 25 | 0 | |||
| DKI4 | 2018 | 46 | 239 | 8 | 0 | |
| Diff. to 2020 | 13 | 5 | 0 | |||
| 2019 | 33 | 209 | 46 | 0 | * | |
| Diff. to 2020 | 24 | 10 | 0 | |||
| DKI5 | 2018 | 35 | 123 | 129 | 15 | * |
| Diff. to 2020 | 22 | 77 | ||||
| 2019 | 27 | 182 | 87 | 7 | * | |
| Diff. to 2020 | 30 | 20 |
| Phase | Year | Good | Moderate | Unhealthy | Very Unhealthy | p-Value |
|---|---|---|---|---|---|---|
| Pre-LSSR | 2018 | 161 | 125 | 1 | 0 | * |
| Diff. to 2020 | 19 | 13 | 0 | |||
| 2019 | 99 | 171 | 20 | 0 | * | |
| Diff. to 2020 | 32 | 0 | ||||
| REG1 | 2018 | 32 | 188 | 44 | 1 | * |
| Diff. to 2020 | 15 | 11 | ||||
| 2019 | 34 | 206 | 32 | 0 | ||
| Diff. to 2020 | 14 | 0 | ||||
| TR1 | 2018 | 18 | 247 | 149 | 15 | * |
| Diff. to 2020 | 142 | |||||
| 2019 | 5 | 345 | 84 | 2 | * | |
| Diff. to 2020 | 12 | 52 | ||||
| REG2 | 2018 | 8 | 27 | 19 | 0 | * |
| Diff. to 2020 | 17 | 0 | ||||
| 2019 | 1 | 33 | 18 | 1 | ||
| Diff. to 2020 | 10 | |||||
| TR2 | 2018 | 42 | 215 | 79 | 8 | * |
| Diff. to 2020 | 58 | 1 | ||||
| 2019 | 8 | 224 | 105 | 2 | * | |
| Diff. to 2020 | 92 |
| Phase | Pollutant | Compared Years | Average | Difference of Average | p-Value | |
|---|---|---|---|---|---|---|
| Year 1 | Year 2 | |||||
| Pre-LSSR | PM | 2018–2020 | 32.56 | 45.30 | * | |
| 2019–2020 | 45.44 | 45.30 | 0.15 | |||
| SO | 2018–2020 | 24.68 | 17.08 | 7.60 | * | |
| 2019–2020 | 16.43 | 17.08 | ||||
| CO | 2018–2020 | 19.14 | 23.53 | * | ||
| 2019–2020 | 19.83 | 23.53 | * | |||
| O | 2018–2020 | 42.95 | 51.67 | * | ||
| 2019–2020 | 58.67 | 51.67 | 7.00 | * | ||
| NO | 2018–2020 | 6.97 | 8.21 | * | ||
| 2019–2020 | 10.46 | 8.21 | 2.24 | * | ||
| REG1 | PM | 2018–2020 | 60.08 | 51.30 | 8.78 | * |
| 2019–2020 | 55.73 | 51.30 | 4.43 | * | ||
| SO | 2018–2020 | 19.63 | 14.94 | 4.69 | * | |
| 2019–2020 | 13.93 | 14.94 | * | |||
| CO | 2018–2020 | 18.91 | 13.17 | 5.75 | * | |
| 2019–2020 | 19.84 | 13.17 | 6.67 | * | ||
| O | 2018–2020 | 74.24 | 63.23 | 11.00 | * | |
| 2019–2020 | 71.34 | 63.23 | 8.11 | * | ||
| NO | 2018–2020 | 9.25 | 7.41 | 1.84 | * | |
| 2019–2020 | 10.45 | 7.41 | 3.04 | * | ||
| TR1 | PM | 2018–2020 | 62.16 | 61.63 | 0.53 | |
| 2019–2020 | 64.58 | 61.63 | 2.95 | * | ||
| SO | 2018–2020 | 19.67 | 19.30 | 0.36 | ||
| 2019-2020 | 17.48 | 19.30 | * | |||
| CO | 2018–2020 | 15.03 | 12.74 | 2.29 | * | |
| 2019–2020 | 15.90 | 12.74 | 3.16 | * | ||
| O | 2018–2020 | 94.01 | 67.44 | 26.57 | * | |
| 2019–2020 | 82.84 | 67.44 | 15.40 | * | ||
| NO | 2018–2020 | 9.09 | 9.19 | |||
| 2019–2020 | 10.62 | 9.19 | 1.43 | * | ||
| Phase | Pollutant | Compared Years | Average | Difference of Average | p-Value | |
|---|---|---|---|---|---|---|
| Year 1 | Year 2 | |||||
| REG2 | PM | 2018–2020 | 59.98 | 52.22 | 7.76 | * |
| 2019–2020 | 67.65 | 52.22 | 15.43 | * | ||
| SO | 2018–2020 | 22.65 | 18.89 | 3.76 | * | |
| 2019–2020 | 19.89 | 18.89 | 1.00 | |||
| CO | 2018–2020 | 15.78 | 41.44 | * | ||
| 2019–2020 | 13.86 | 41.44 | * | |||
| O | 2018–2020 | 79.31 | 51.85 | 27.46 | * | |
| 2019–2020 | 98.75 | 51.85 | 46.90 | * | ||
| NO | 2018–2020 | 7.79 | 42.04 | * | ||
| 2019–2020 | 11.26 | 42.04 | * | |||
| TR2 | PM | 2018–2020 | 53.03 | 45.31 | 7.72 | * |
| 2019–2020 | 59.90 | 45.31 | 14.58 | * | ||
| SO | 2018–2020 | 19.54 | 40.28 | * | ||
| 2019–2020 | 19.52 | 40.28 | * | |||
| CO | 2018–2020 | 19.48 | 23.04 | * | ||
| 2019–2020 | 17.84 | 23.04 | * | |||
| O | 2018–2020 | 84.50 | 36.85 | 47.65 | * | |
| 2019–2020 | 92.47 | 36.85 | 55.62 | * | ||
| NO | 2018–2020 | 9.50 | 30.35 | * | ||
| 2019–2020 | 10.20 | 30.35 | * | |||
Publisher’s Note: MDPI stays neutral with regard to jurisdictional claims in published maps and institutional affiliations. |
© 2021 by the authors. Licensee MDPI, Basel, Switzerland. This article is an open access article distributed under the terms and conditions of the Creative Commons Attribution (CC BY) license (https://creativecommons.org/licenses/by/4.0/).
Share and Cite
Pardamean, B.; Rahutomo, R.; Cenggoro, T.W.; Budiarto, A.; Perbangsa, A.S. The Impact of Large-Scale Social Restriction Phases on the Air Quality Index in Jakarta. Atmosphere 2021, 12, 922. https://doi.org/10.3390/atmos12070922
Pardamean B, Rahutomo R, Cenggoro TW, Budiarto A, Perbangsa AS. The Impact of Large-Scale Social Restriction Phases on the Air Quality Index in Jakarta. Atmosphere. 2021; 12(7):922. https://doi.org/10.3390/atmos12070922
Chicago/Turabian StylePardamean, Bens, Reza Rahutomo, Tjeng Wawan Cenggoro, Arif Budiarto, and Anzaludin Samsinga Perbangsa. 2021. "The Impact of Large-Scale Social Restriction Phases on the Air Quality Index in Jakarta" Atmosphere 12, no. 7: 922. https://doi.org/10.3390/atmos12070922
APA StylePardamean, B., Rahutomo, R., Cenggoro, T. W., Budiarto, A., & Perbangsa, A. S. (2021). The Impact of Large-Scale Social Restriction Phases on the Air Quality Index in Jakarta. Atmosphere, 12(7), 922. https://doi.org/10.3390/atmos12070922