Article

Urban Heat Islands and Vulnerable Populations in a Mid-Size Coastal City in an Arid Environment

by
Carolina Quintana-Talvac
1,
Oscar Corvacho-Ganahin
1,
Pamela Smith
2,
Pablo Sarricolea
2,
Manuel Prieto
1 and
Oliver Meseguer-Ruiz
3,*
1
Departamento de Ciencias Históricas y Geográficas, Universidad de Tarapacá, 18 de Septiembre 2222, Arica 1010069, Chile
2
Departamento de Geografía, Universidad de Chile, Portugal 84, Santiago Centro, Santiago 8331051, Chile
3
Departamento de Ciencias Históricas y Geográficas, Universidad de Tarapacá, Luis Emilio Recabarren 2477, Iquique 1101783, Chile
*
Author to whom correspondence should be addressed.
Atmosphere 2021, 12(7), 917; https://doi.org/10.3390/atmos12070917
Submission received: 18 June 2021 / Revised: 13 July 2021 / Accepted: 15 July 2021 / Published: 17 July 2021
(This article belongs to the Section Biometeorology)

Abstract

:
Arica is a coastal city located in northern Chile, in the Atacama Desert. The behavior of surface temperatures in the city between 1985 and 2019 was studied using Landsat satellite images, leading to the identification of surface urban heat islands (SUHI), surface urban cold islands (SUCI), and average temperature zones. The higher intensities of the SUHI reach values of almost 45 °C and the SUCI lower values are below 13 °C. From the socioeconomic characterisation of the population based on indicators retrieved from the 2012 and 2017 population censuses, we identified that during the study period there was a lower presence of SUHI, but these were linked to spaces of lower socioeconomic level and, for the most part, would form new urban spaces within the city. On the other hand, SUCI had a greater spatial presence in the study area and in the urban morphology, being found mostly in areas of high socioeconomic level and in consolidated spaces with few possibilities of generating new constructions.

1. Introduction

Urbanization processes have been established as one of the major territorial expressions since the late seventeenth century [1]. However, it was not until the second half of the 20th century that this reality became apparent outside metropolitan areas and large cities in Latin America and the Caribbean [2]. While 50% of the planet’s inhabitants live in cities, in this macro-region, this percentage increases to 79.5%, with inhabitants living between large and medium-sized cities [3] that may be subjected to different tropical, desert, or temperate climates [4].
Urban areas and their subsequent evolution have gradually modified space, in turn modifying the natural energetic and hydrological exchanges [5]. This is mainly materialized in the spatial elements and conditions [6] determined initially by geographic location and atmospheric conditions [7], generating a new urban climate and implying a local climate modification. This phenomenon is known as the urban heat island (UHI), which has been documented worldwide [8,9]. The high number of studies to date can mainly be attributed to the development of remote sensing as a method of analysis. This method has provided a wide range of data not limited to meteorological stations and/or mobile transects [7], and also allowing the estimation of land surfaces temperatures (LST), from which surface urban heat islands (SUHI) can be identified.
The behavior of LST becomes a key variable in defining the thermal regime of urban areas as it can be considered a proxy for the thermal infrared energy radiated from the surface to the atmosphere, which ultimately influences the planetary boundary layer temperature and thermal comfort [10,11]. Although this approach has been extensively developed in different geographic locations, the literature has rarely focused on arid or hyper-arid zones [6], even though they are immersed in the same processes of local climate modification or environmental change.
In cities located in desert environments, it has been observed that the thermal behaviour of urban areas presents lower temperatures than the surrounding rural areas [7]. In contrast, in other climatic zones, unplanned anthropogenic interference, depending on spatial arrangements, generates an inverse temperature relationship [12]. Similarly, it has been found that, in these areas, the higher presence of vegetation in the urban areas tends to mitigate SUHI, identified as surface urban cold islands (SUCI).
Although heat waves affect entire cities, entire metropolitan areas, or larger regions, their intensity is spatially variable, causing differential effects on neighborhoods [13,14]. This situation is especially critical in cities where the location of neighborhoods, the type of building structure, density, and the availability of green areas depend on socioeconomic factors. Following this statement, the literature on climate justice has shown how the spatial distribution of temperatures is not evenly distributed among city dwellers, but is associated with socioeconomic, racial, land use, and demographic factors [15]. This situation can be understood as a problem of “thermal inequity,” in which the most vulnerable and oppressed sectors suffer disproportionately from the effects of temperature [16]. Latin American cities provide a good example of this. They are affected by a very high degree of segregation [17], and the SUHI phenomenon affects the urban population in a differentiated manner, showing an intra-city variation that may lead to a differential impact of urban heat stress on different demographic groups [18]. Land use and land cover patterns are strongly related to the population distribution and socioeconomic levels, directly affecting the distribution of SUHI [19]. It has been demonstrated that one of the most important contributors to SUHI variability is the vegetation density, which in desert cities, such as those in Northern Chile, is strongly correlated with family income-level due to its high irrigation rates [20]. Other socioeconomic variables affect the SUHI intensity through changes in the physical environment, but their influence is less important than landscape [21]. Moreover, more impoverished neighborhoods show no critical resources (such as thermal comfort) disposal in their physical and social environments to help them deal with extreme events associated with high temperatures [22].
The city of Arica in Northern Chile is located in a coastal desert environment at 18° S and covers an area of 47.82 km2. It exhibits a BWh coastal desert climate type according to the Köppen-Geiger classification [23], with an average annual temperature of 18 °C. Its location gives it some climatic particularities (Figure 1) representative of its latitude and its immediate spatial relationship with the Atacama Desert, the Andes Mountains, and the South Pacific Anticyclone. These factors condition precipitation during the summer period (from December to March) which does not exceed 1 mm annually and frequent stratiform cloudiness during the winter period [24]. The city of Arica is inhabited by 221,364 people, which corresponds to 97.9% of the Arica y Parinacota region’s population [25], a medium-sized city according to the classification of the Housing and Urbanism Ministry [26].
In this context, the importance of observing the thermal behavior of temperatures in urban areas of medium-sized cities is recognized since, in northern Chile, cities concentrate a large percentage of the regional population. Thus, this work aims to analyze the behavior of the surface urban heat island in the city of Arica, and to evidence that the areas with the highest intensity of the UHI affect the lowest socioeconomic level population, while the population with the highest socioeconomic level is affected by lower intensities of the UHI.

2. Materials and Methods

2.1. Satellite Images

We used 234 satellite images from the Landsat 4, 5, 7, and 8 missions, without cloud cover in the study area between 1985 and 2019, of which 182 correspond to summer-autumn seasons (warm) and 32 to winter-spring seasons (cold). The 86 Landsat 7 satellite images were restored [27]. The transformation of radiometric information to LST was developed for the TM (Landsat 4–5) and ETM+ (Landsat 7) sensors [28], and for the TIRS (Landsat 8) sensor [29,30]. The vegetation was determined using the well-known Normalized Difference Vegetation Index (NDVI). All the satellite images were processed considering series for the warm and cold seasons (Supplementary Table S1).
We calculated the annual averages for both warm and cold seasons of the LSTs for the study period and established a reclassification into three categories: (1) low temperatures or SUCI (12.6–28.3 °C), (2) average temperatures (28.3–32.7 °C), and (3) high temperatures or SUHI (32.7–44.97 °C); for both warm and cold seasons. These categories were obtained by adding and subtracting the average of the standard deviation to the average temperature (30.5 °C), thus establishing the low and high thresholds of the average temperature. Extreme temperatures were obtained from the minimum and maximum temperatures recorded in the series of annual averages. Finally, 32 representative years of the research data series were obtained, leaving out the years 1987, 1994, and 1997 because they had only one base image or did not reach the temperature to identify SUHI. We also observed the urban concentration in the annual averages of SUHI, SUCI, and average surface temperature, which is understood as the identification of the perimeter of the urban stain within the study area, to relate both the constant of the identification of the surface temperature classification and the evolution of the urban soil of the city.

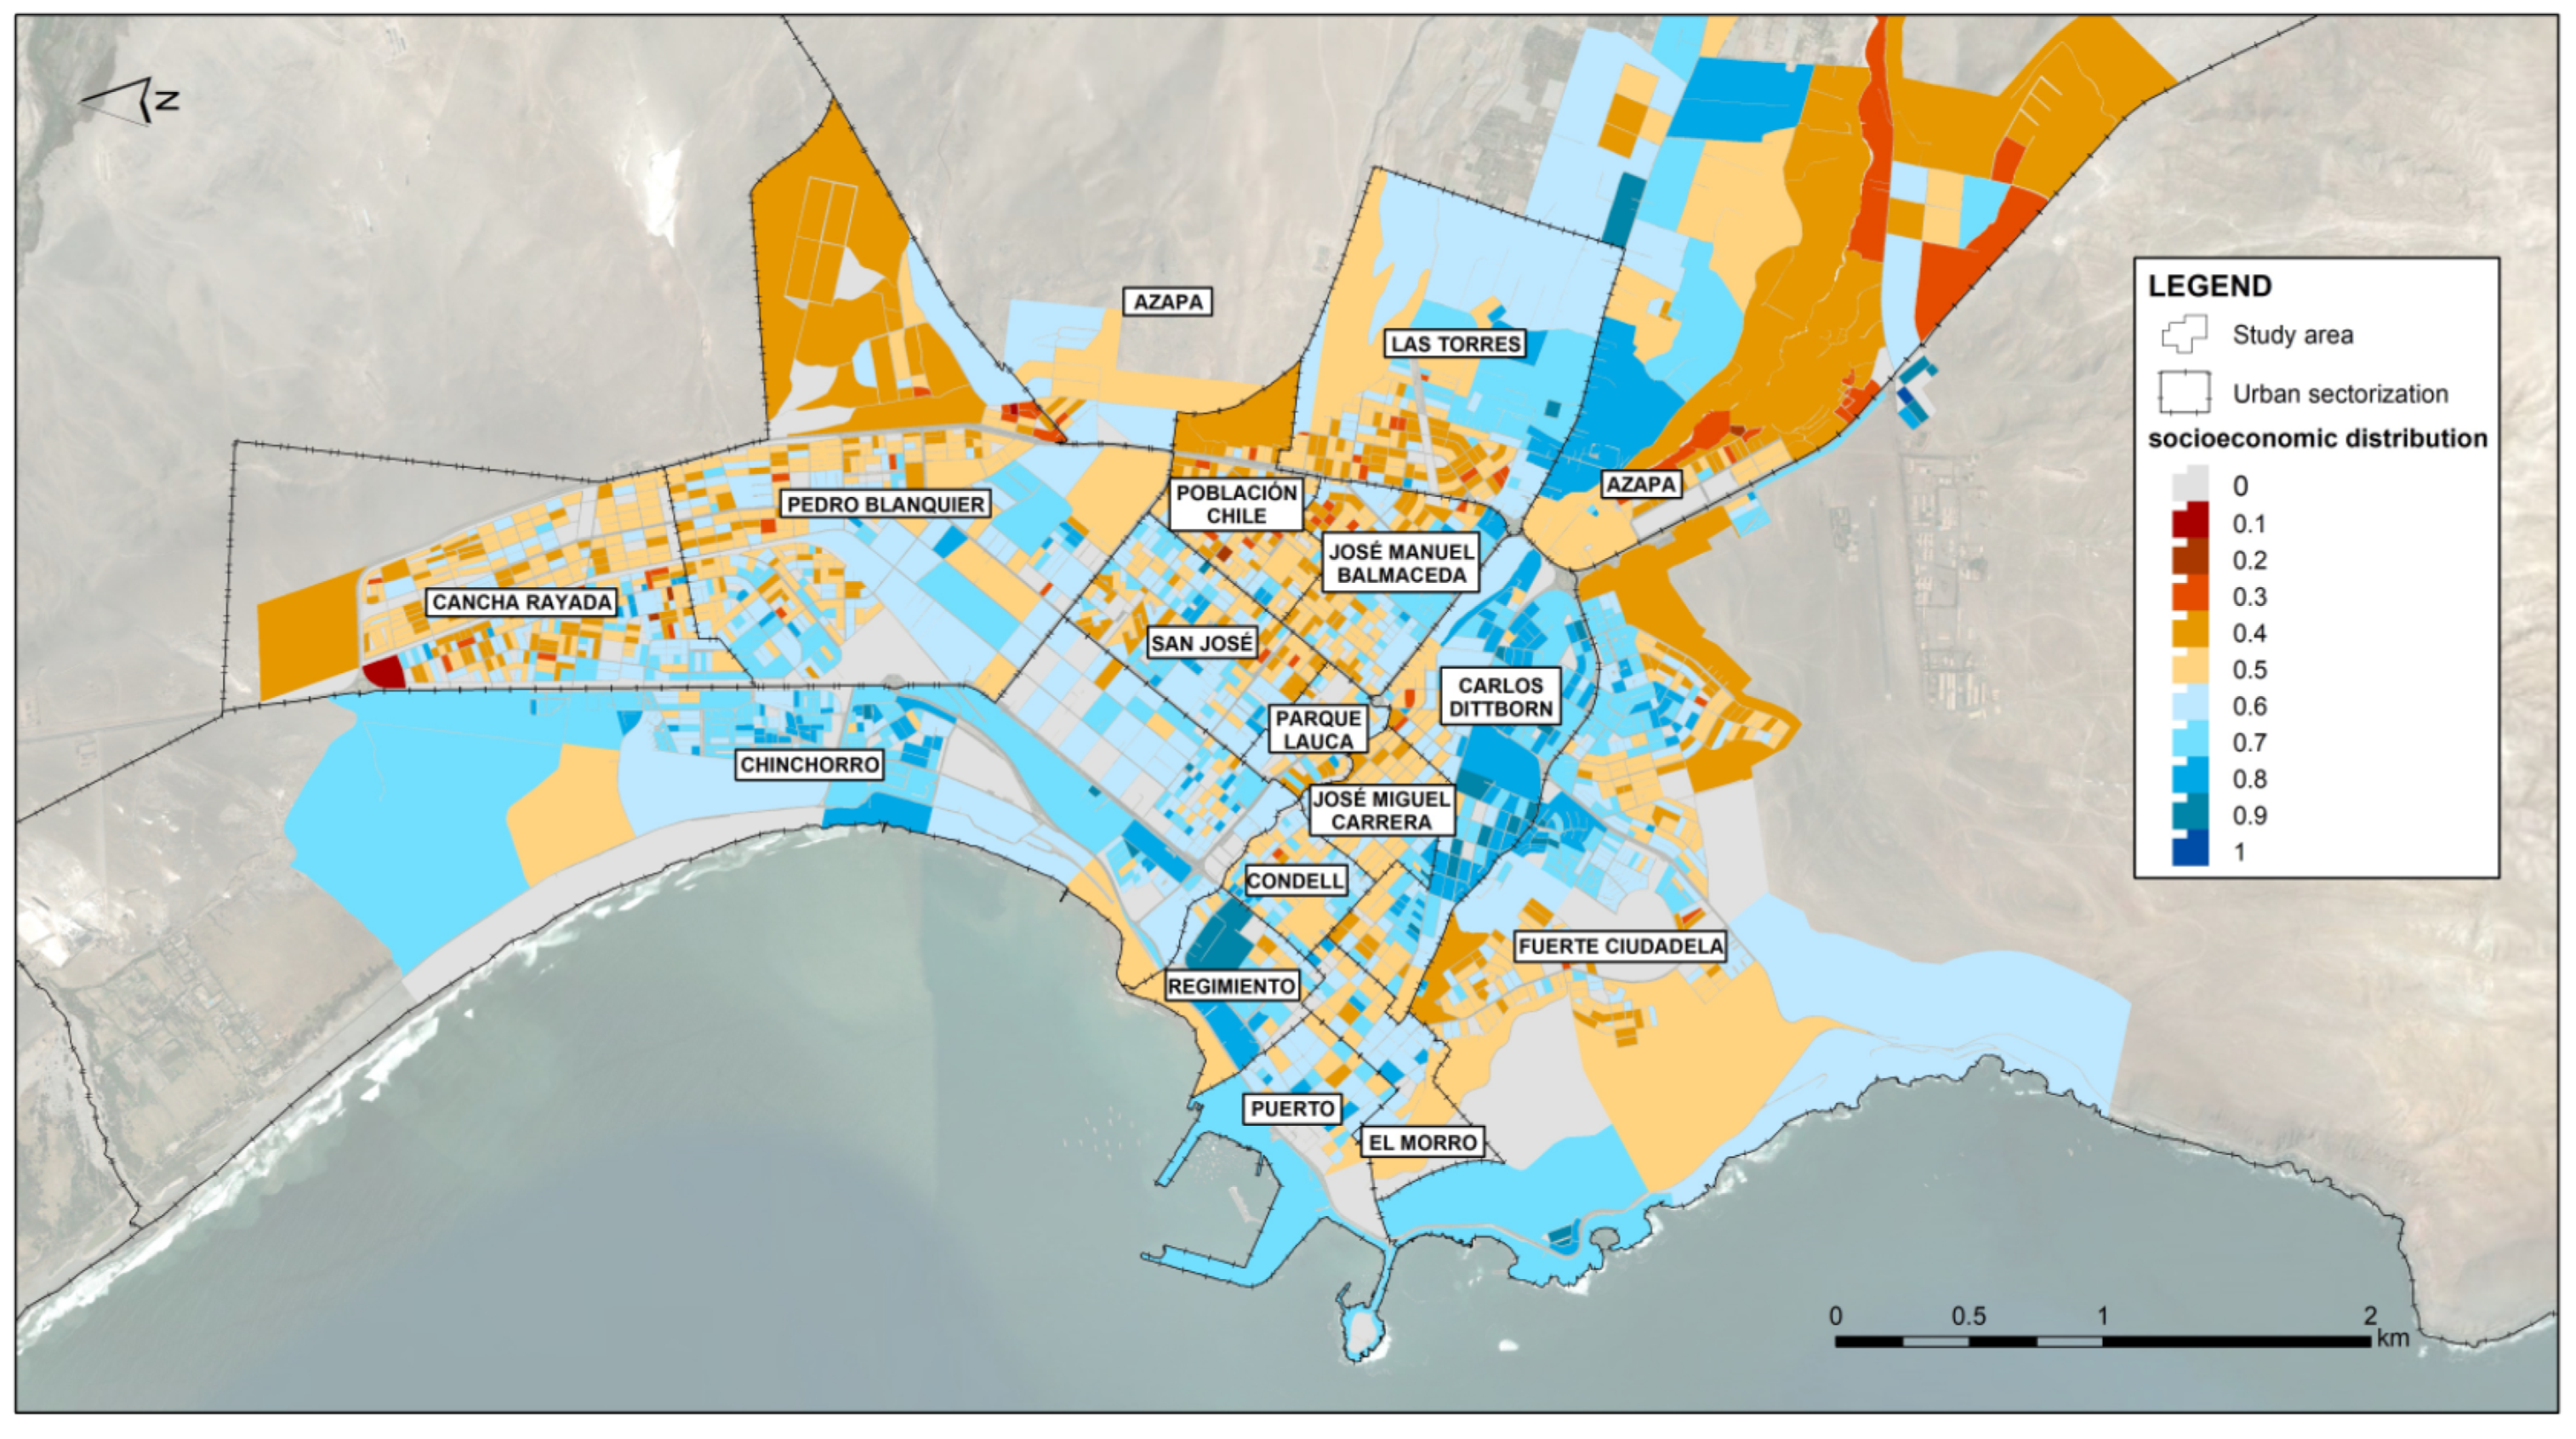
2.2. Socioeconomic Characterization of the Population in the Urban Area

The socioeconomic information of the population for the city of Arica is available in the Socioeconomic Dimension of the Territorial Intelligence Center (CIT) at www.bienestarterritorial.cl (accessed 19 June 2020), spatialized at the level of The National Statistics Institute (INE for its Spanish acronym) census blocks, allowing scaling to different parameters of spatial understanding, such as: neighborhood units, districts, communes, and cities (CIT 2020). These data allow for a territorial welfare index (TWi) of different Chilean cities to be calculated according to official data from 2012 and 2017. This builds a multidimensional approximation of urban habitats, contributing to the characterization of various cities in Chile, weighing the problems of omission of information from the 2012 census. The dimensions, defined through the calculation of the different indicators (Table 1), deliver information that is normalized from 0 to 1 at the block level, i.e., the block with the best weighting has a value of 1 and the one with the lowest values has a value of 0.1. Blocks with a value of 0 were not considered in this study because they were no-information blocks.
We classified the data through 3 ranges: (1) a low socioeconomic classification considering TWi values between 0.1 and 0.4; (2) an average socioeconomic classification with TWi values between 0.5 and 0.7; and (3) a high socioeconomic classification consisting of TWi values between 0.8 and 1.
INE’s census districts have an operational character to include the country’s municipalities in a sectorized way and thus generate the census data collection. Particularly, in Arica, there are nineteen census districts (Table 2), of which only sixteen are located in the blocks that are within the spatial cover area of the socioeconomic dimension.

2.3. Data Integration

We displayed two different layers to visualize their spatial crossing: (1) a raster file with the spatial distribution of the study area, where the SUHI, mean temperatures sectors, and SUCI for the period 1985–2019 are identified; and (2) a vector file of the socioeconomic classification with the blocks of the TWi ranges 0.1–0.4 (low) and 0.8–1 (high). We analyzed the data crossing according to the interception of temperatures and the number of blocks in the selected ranges. Finally, according to the socioeconomic classification, we identified the urban sectors where they are located. According to this exercise, to complement the information acquired through the GIS work, new information was generated in a vector file format, generating polygons that represent the analyzed blocks and other polygons that symbolize the spatialization of SUHI and SUCI. These files were exported to a mobile device to be visualized. By means of this, the distribution of the analyzed areas was supervised in the field, looking for representative photographic capture points to evidence and incorporate the spatial diversity of the areas identified in the crossing of variables, thus complementing the results obtained.

3. Results

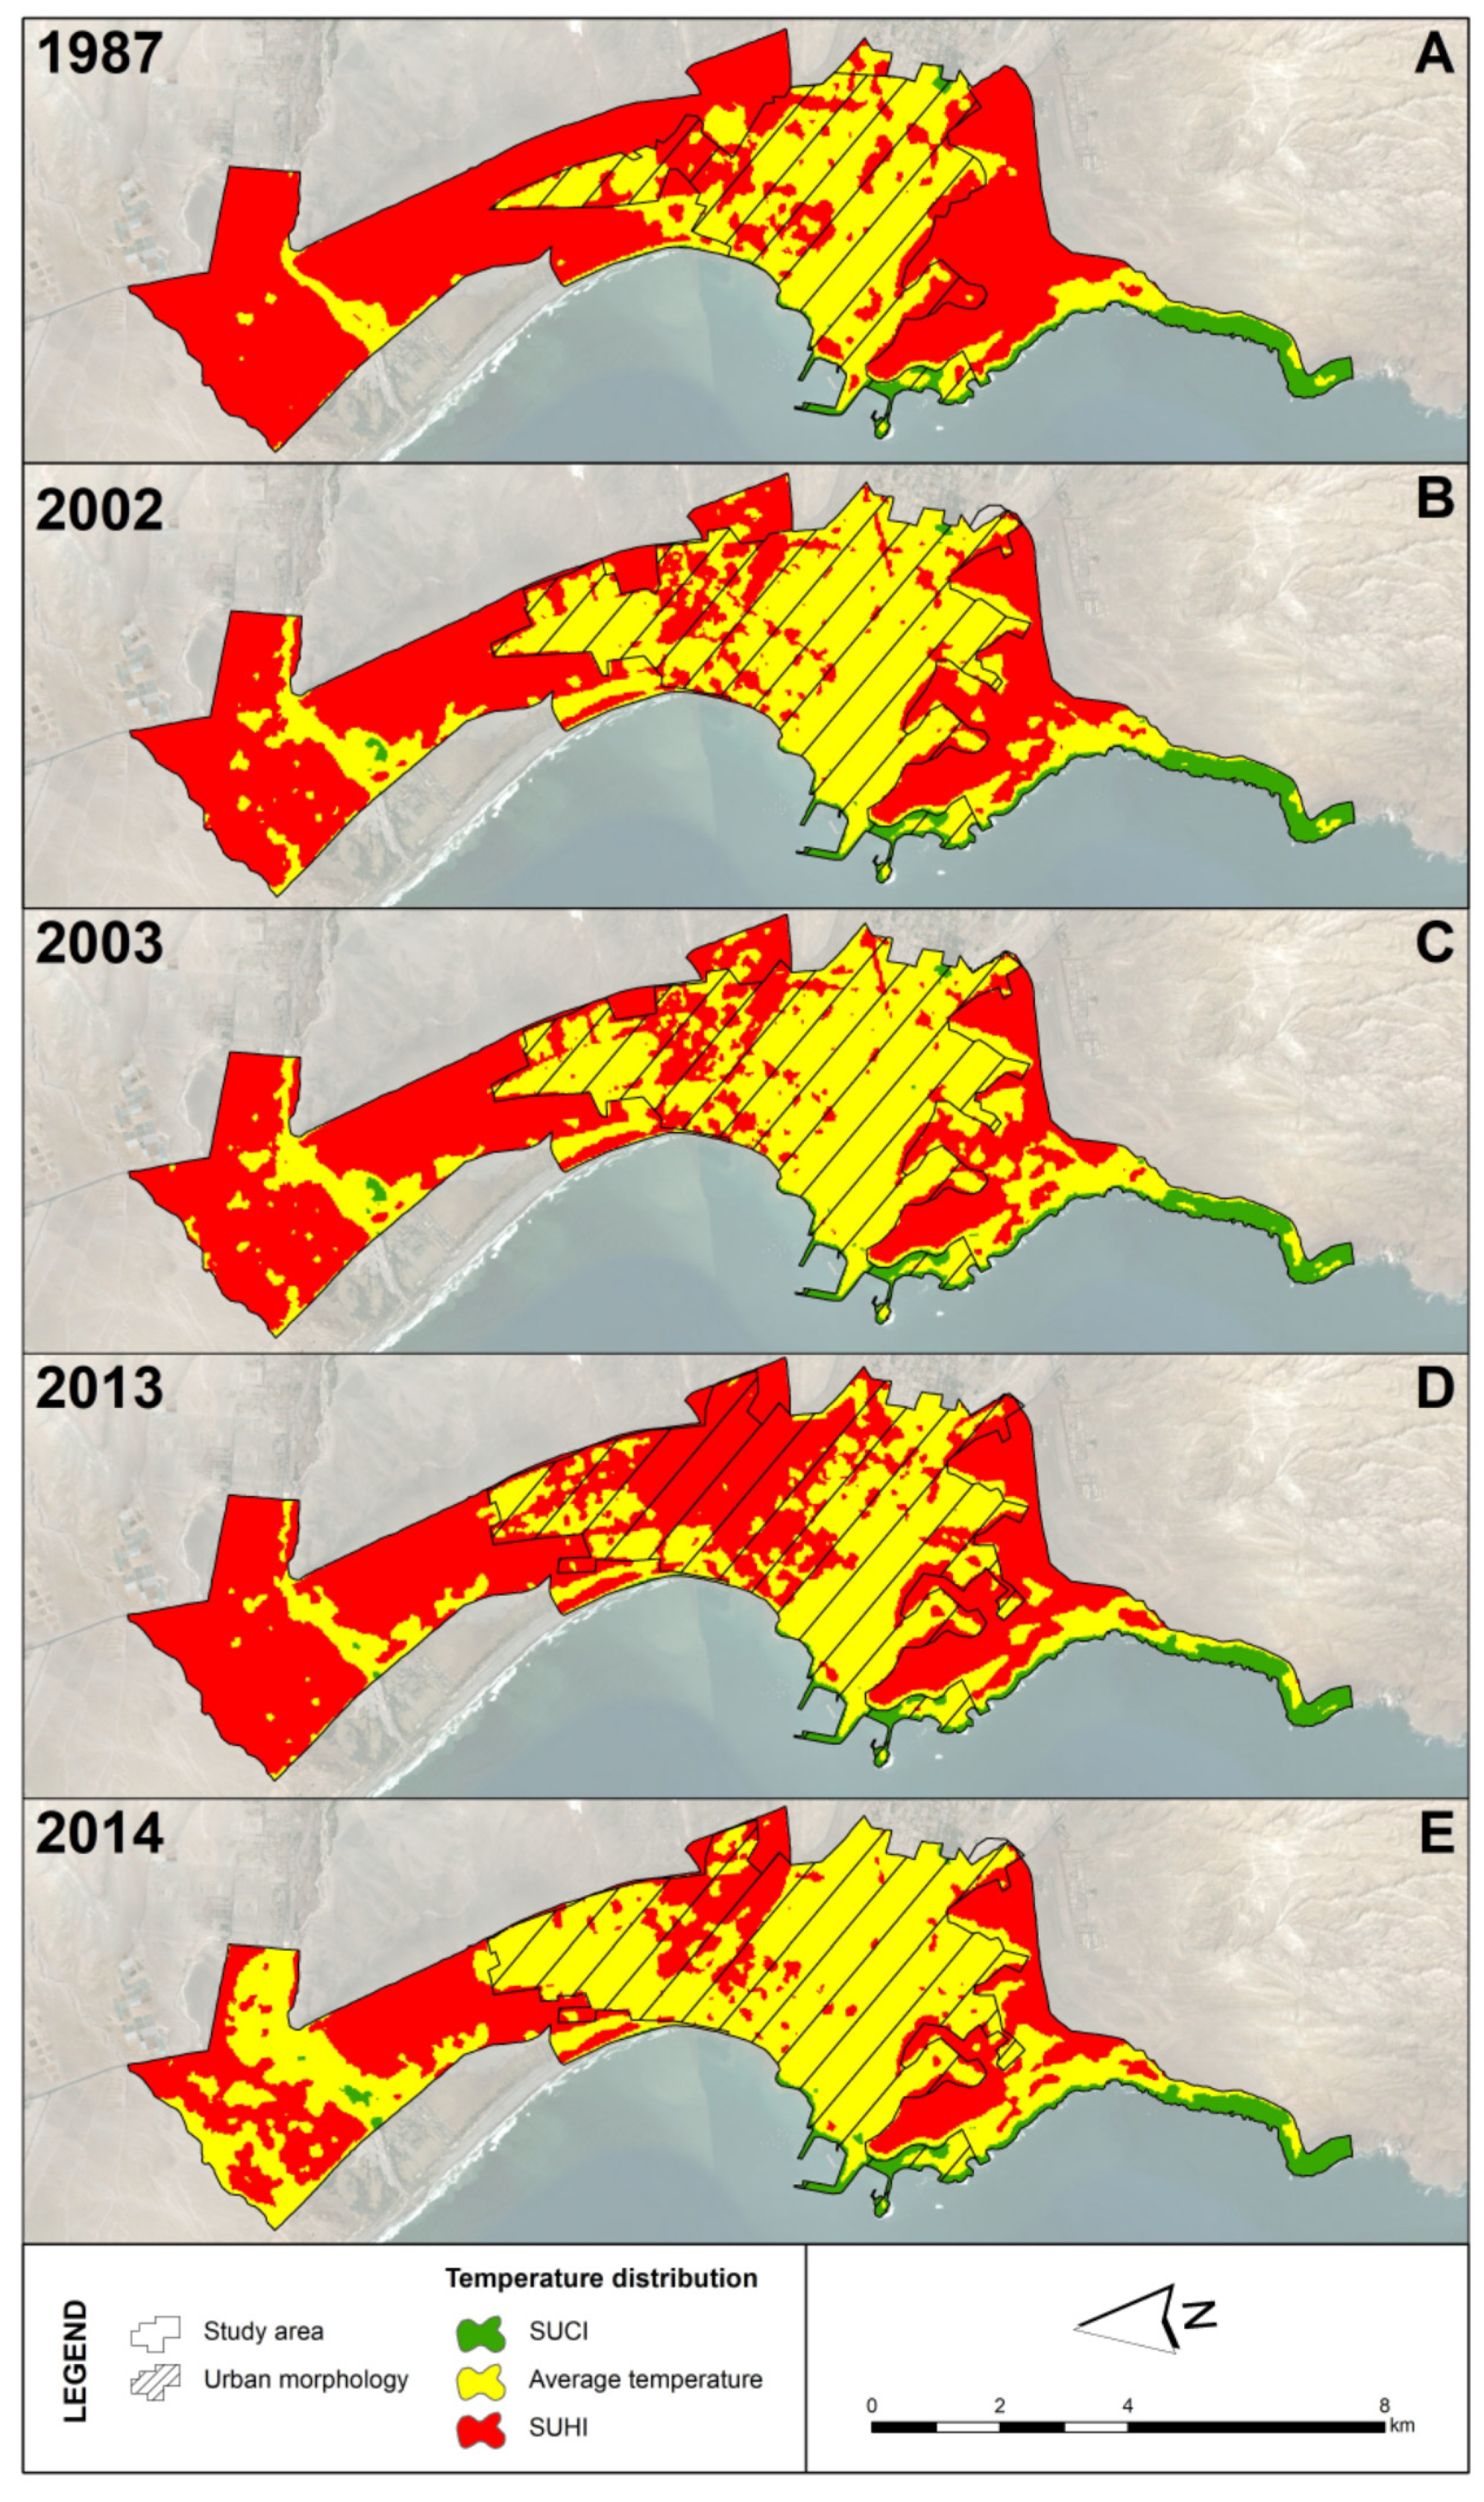
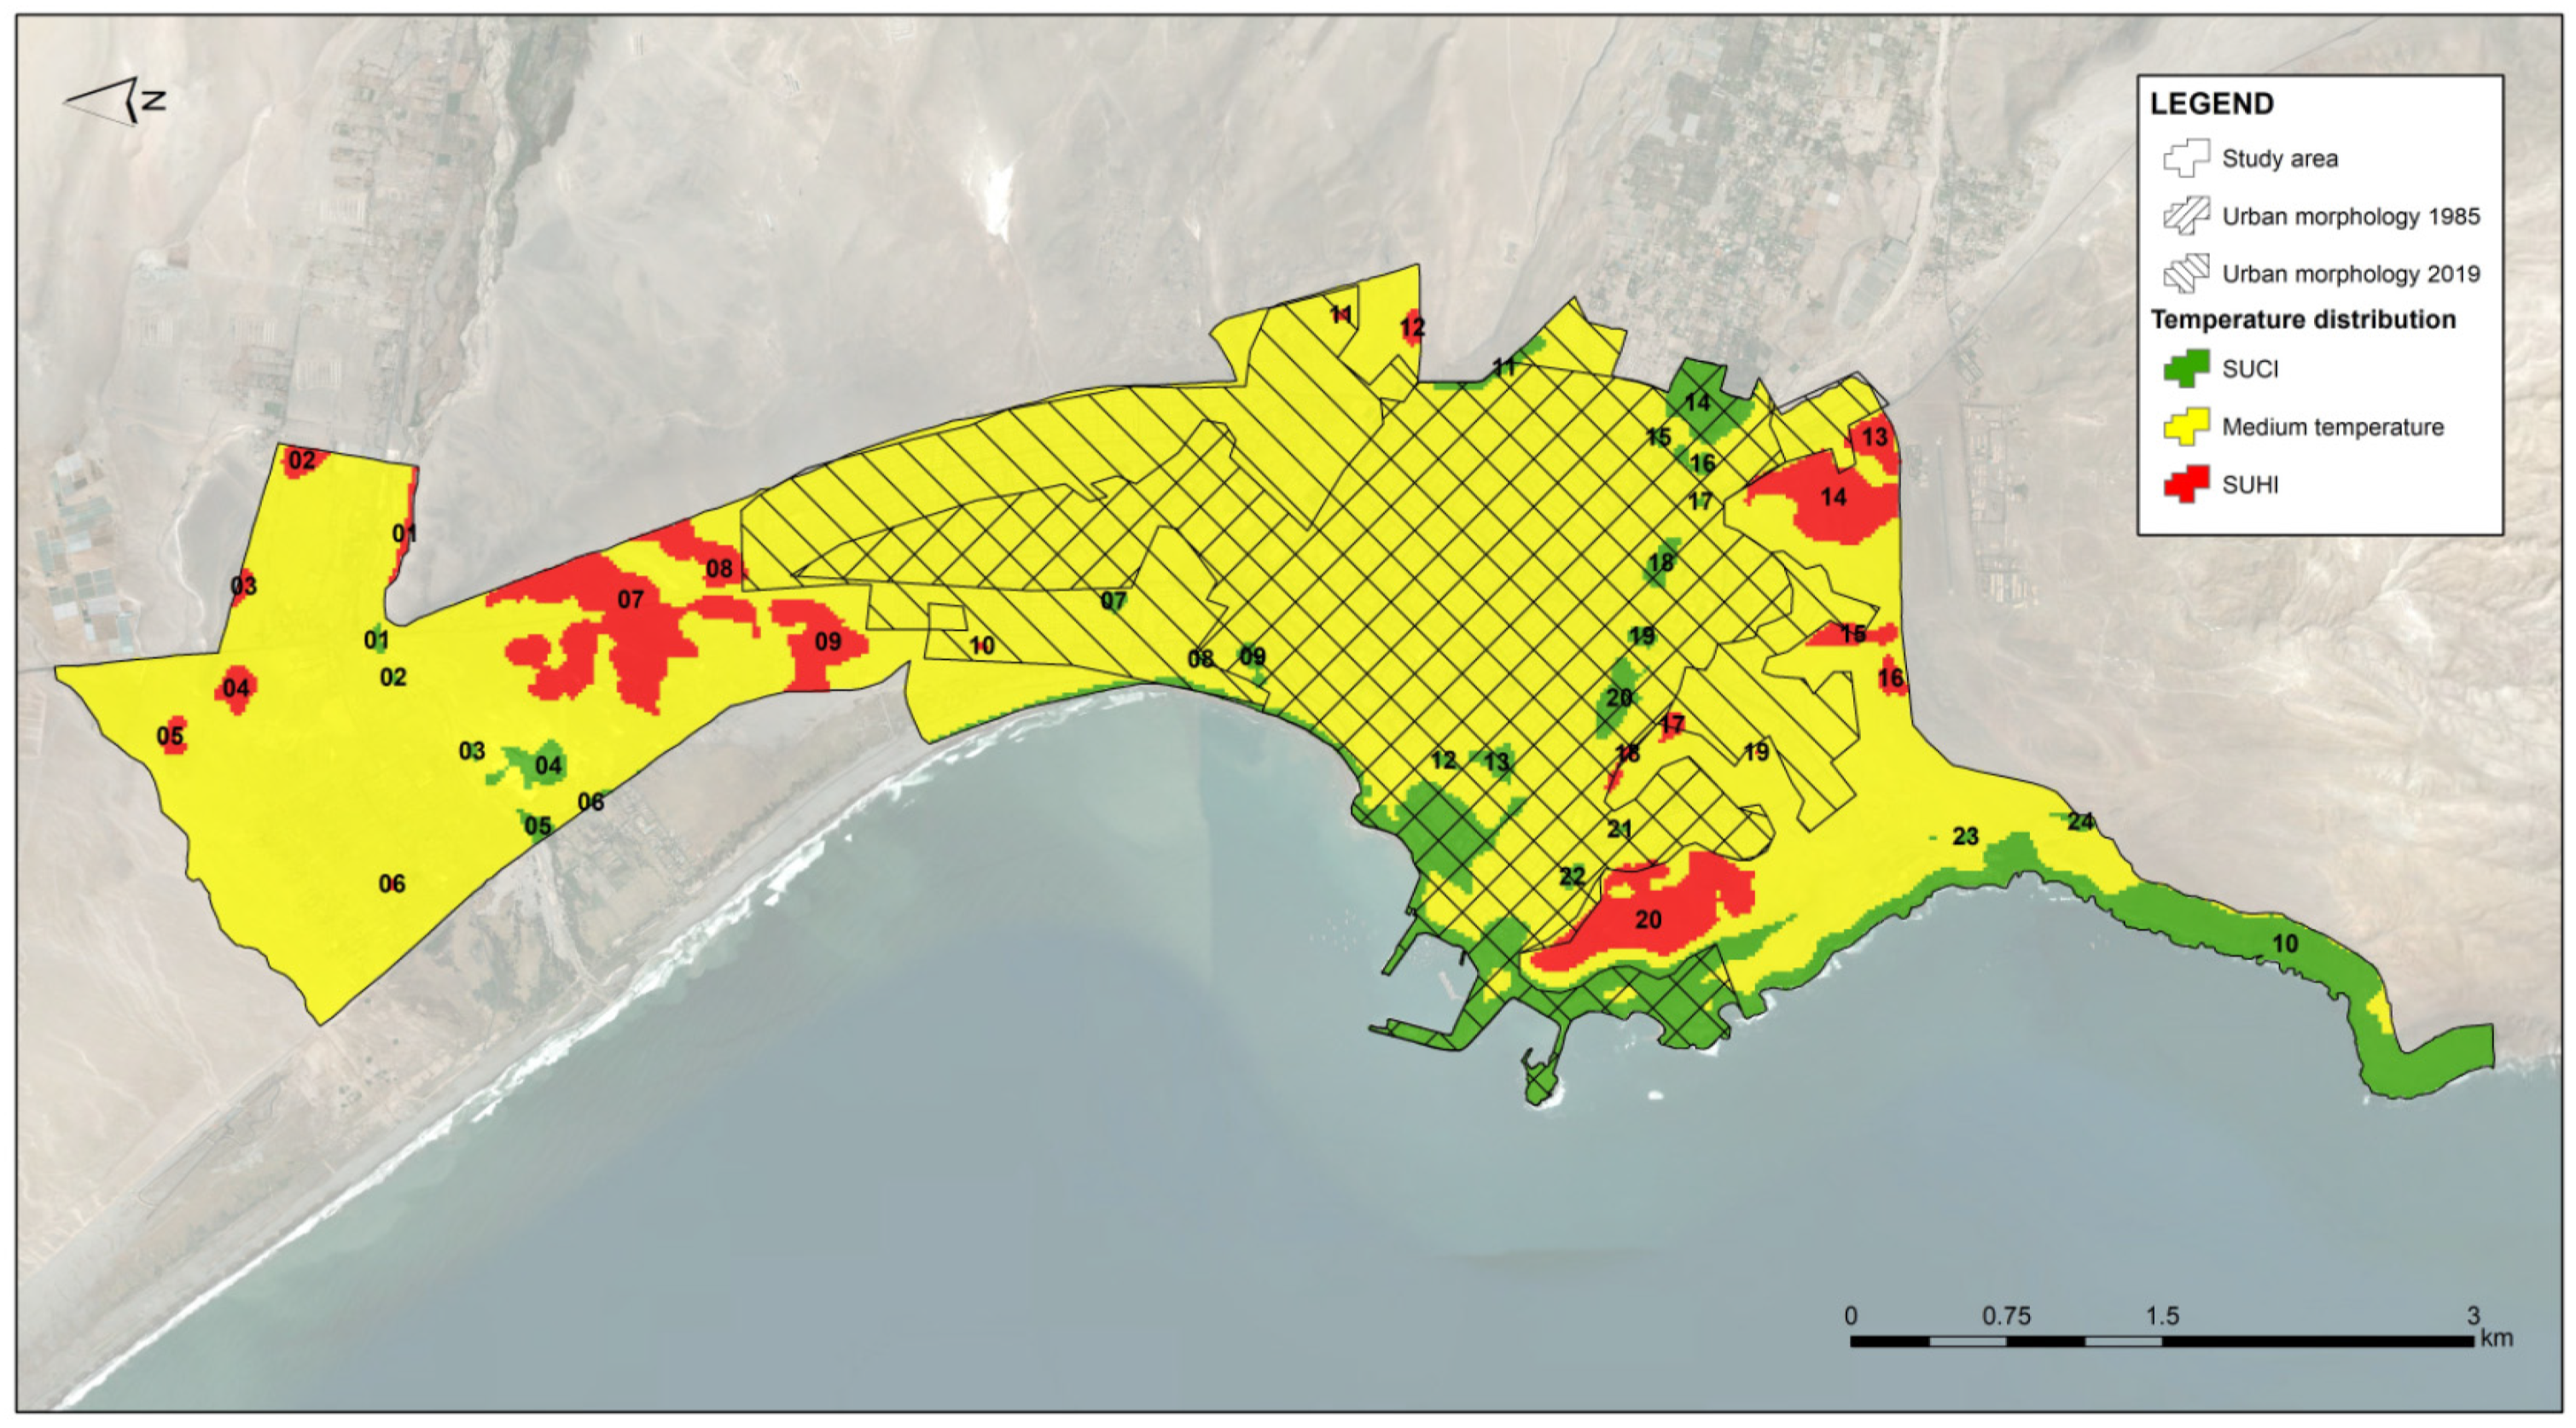
3.1. SUHI and SUCI Location

The greatest presence of SUHI was found in 1987, covering 29.23 km2 (63.1%) of the study area. On the other hand, SUCI corresponds to 1.94 km2 (4.2%). This year, the urban concentration, or urban morphology, covered 16.75 km2, of which 4.52 km2 (27.0%) corresponded to SUHI and 0.55 km2 (3.3%) to SUCI. The average annual temperature corresponded to 33.59 °C and is represented by two satellite images for the warm period and one image for the cold period (Figure 2A). For the year 2002, the SUHI extended over 22.55 km2 (48.6%) in the study area, while the SUCI was concentrated over 2.02 km2 (4.4%). As for the urban concentration, it extended over 20.8 km2, of which 3.77 km2 (18.1%) corresponded to SUHI and 0.58 km2 (2.8%) to SUCI. The average annual temperature corresponded to 32.65 °C and is represented by five images for the warm period and one image for the cold period (Figure 2B). In 2003, SUHI had an area of 21.73 km2 (46.9%) in the study area, while SUCI was concentrated over an area of 1.99 km2 (4.3%). As for the urban concentration, it extended over 21.05 km2, of which 4.00 km2 (19.0%) corresponded to SUHI and 0.6 km2 (2.8%) to SUCI. The average annual temperature corresponded to 32.57 °C, with eight satellite images, where six corresponded to the warm period and two to the cold seasons (Figure 2C). For 2013, 28.70 km2 (61.9%) of the study area consisted of SUHI, while SUCI corresponded to 1.75 km2 (3.8%). Regarding the urban morphology, it extended over 23.02 km2, of which 10.59 km2 (46.0%) corresponded to SUHI and 0.5 km2 (2.2%) to SUCI. The average annual temperature corresponded to 33.12 °C and is represented by seven satellite images for the warm period and three satellite images for the cold period (Figure 2D). Finally, in 2014, SUHI extended over an area of 16.8 km2 (36.2%) in the study area, while SUCI was concentrated over 2.12 km2 (4.6%). Regarding urban concentration, it extended over 23.29 km2, of which 3.83 km2 (16.4%) corresponded to SUHI and 0.66 km2 (2.9%) to SUCI. The average temperature reached 32.18 °C with seven warm period images and four cold period images (Figure 2E).
For the year 1990, the SUHI had a covered 0.10 km2 (0.2%), while the SUCI extended over 29.36 km2 (63.3%). The urban morphology extended over 17.10 km2, where average temperatures reached 0.34 km2 (2.1%) and SUCI—16.76 km2 (97.9%). The average temperature corresponded to 27.38 °C, calculated from four warm season images (Figure 3A). The lowest presence of SUHI was seen in 1991, where it extended over 0.06 km2 (0.1%) of the study area and SUCI covered 29.28 km2 (63.1%). The urban concentration was equivalent to 17.56 km2, where 0.27 km2 (1.5%) corresponded to average temperatures and 17.28 km2 (98.4%) to SUCI. The average temperature corresponded to 27.37 °C, obtained from three satellite images of the warm season and one of the cold season (Figure 3B). In 1996, SUHI covered 0.36 km2 (0.8%) of the area, while the SUCI was concentrated over 22.44 km2 (48.4%). Regarding the urban concentration of Arica, this is equivalent to 18.42 km2 which had no SUHI, and 15.75 km2 (85.52%) of SUCI. However, the average temperature covered 2.67 km2 (14.5%). The mean temperature was 28.47 °C calculated from three warm season images and one cold season image (Figure 3C). One of the lowest presences of SUHI in the study area was shown in 2001, covering 0.47 km2 (1%) of the area, while SUCI covered 20.32 km2 (43.8%). Regarding the urban concentration of Arica, this is equivalent to 20.24 km2, of which 0.01 km2 (0.0%) corresponded to SUHI and 14.84 km2 (73.3%) to SUCI. The average temperature reached 28.71 °C, calculated using only six warm season satellite images (Figure 3D). Finally, in 2006, SUHI covered 0.42 km2 (0.9%) of the area, while SUCI was concentrated over 20.29 km2 (43.8%). Regarding the urban concentration of Arica, this is equivalent to 21.84 km2, of which 0.01 km2 (0.0%) corresponded to SUHI and 15.01 km2 (68.8%) to SUCI. The average calculated temperature was 28.7 °C, obtained through warm season images and two cold period images (Figure 3E).
As a result of the 1985–2019 period average, the SUHI extended over 3.4 km2, the UCI over 4.6 km2, and the average temperatures over 38.1 km2. Likewise, we recognised the transformation of the urban morphology with the 1985–2019 comparison with a spatial difference of 7.9 km2 (Figure 4).

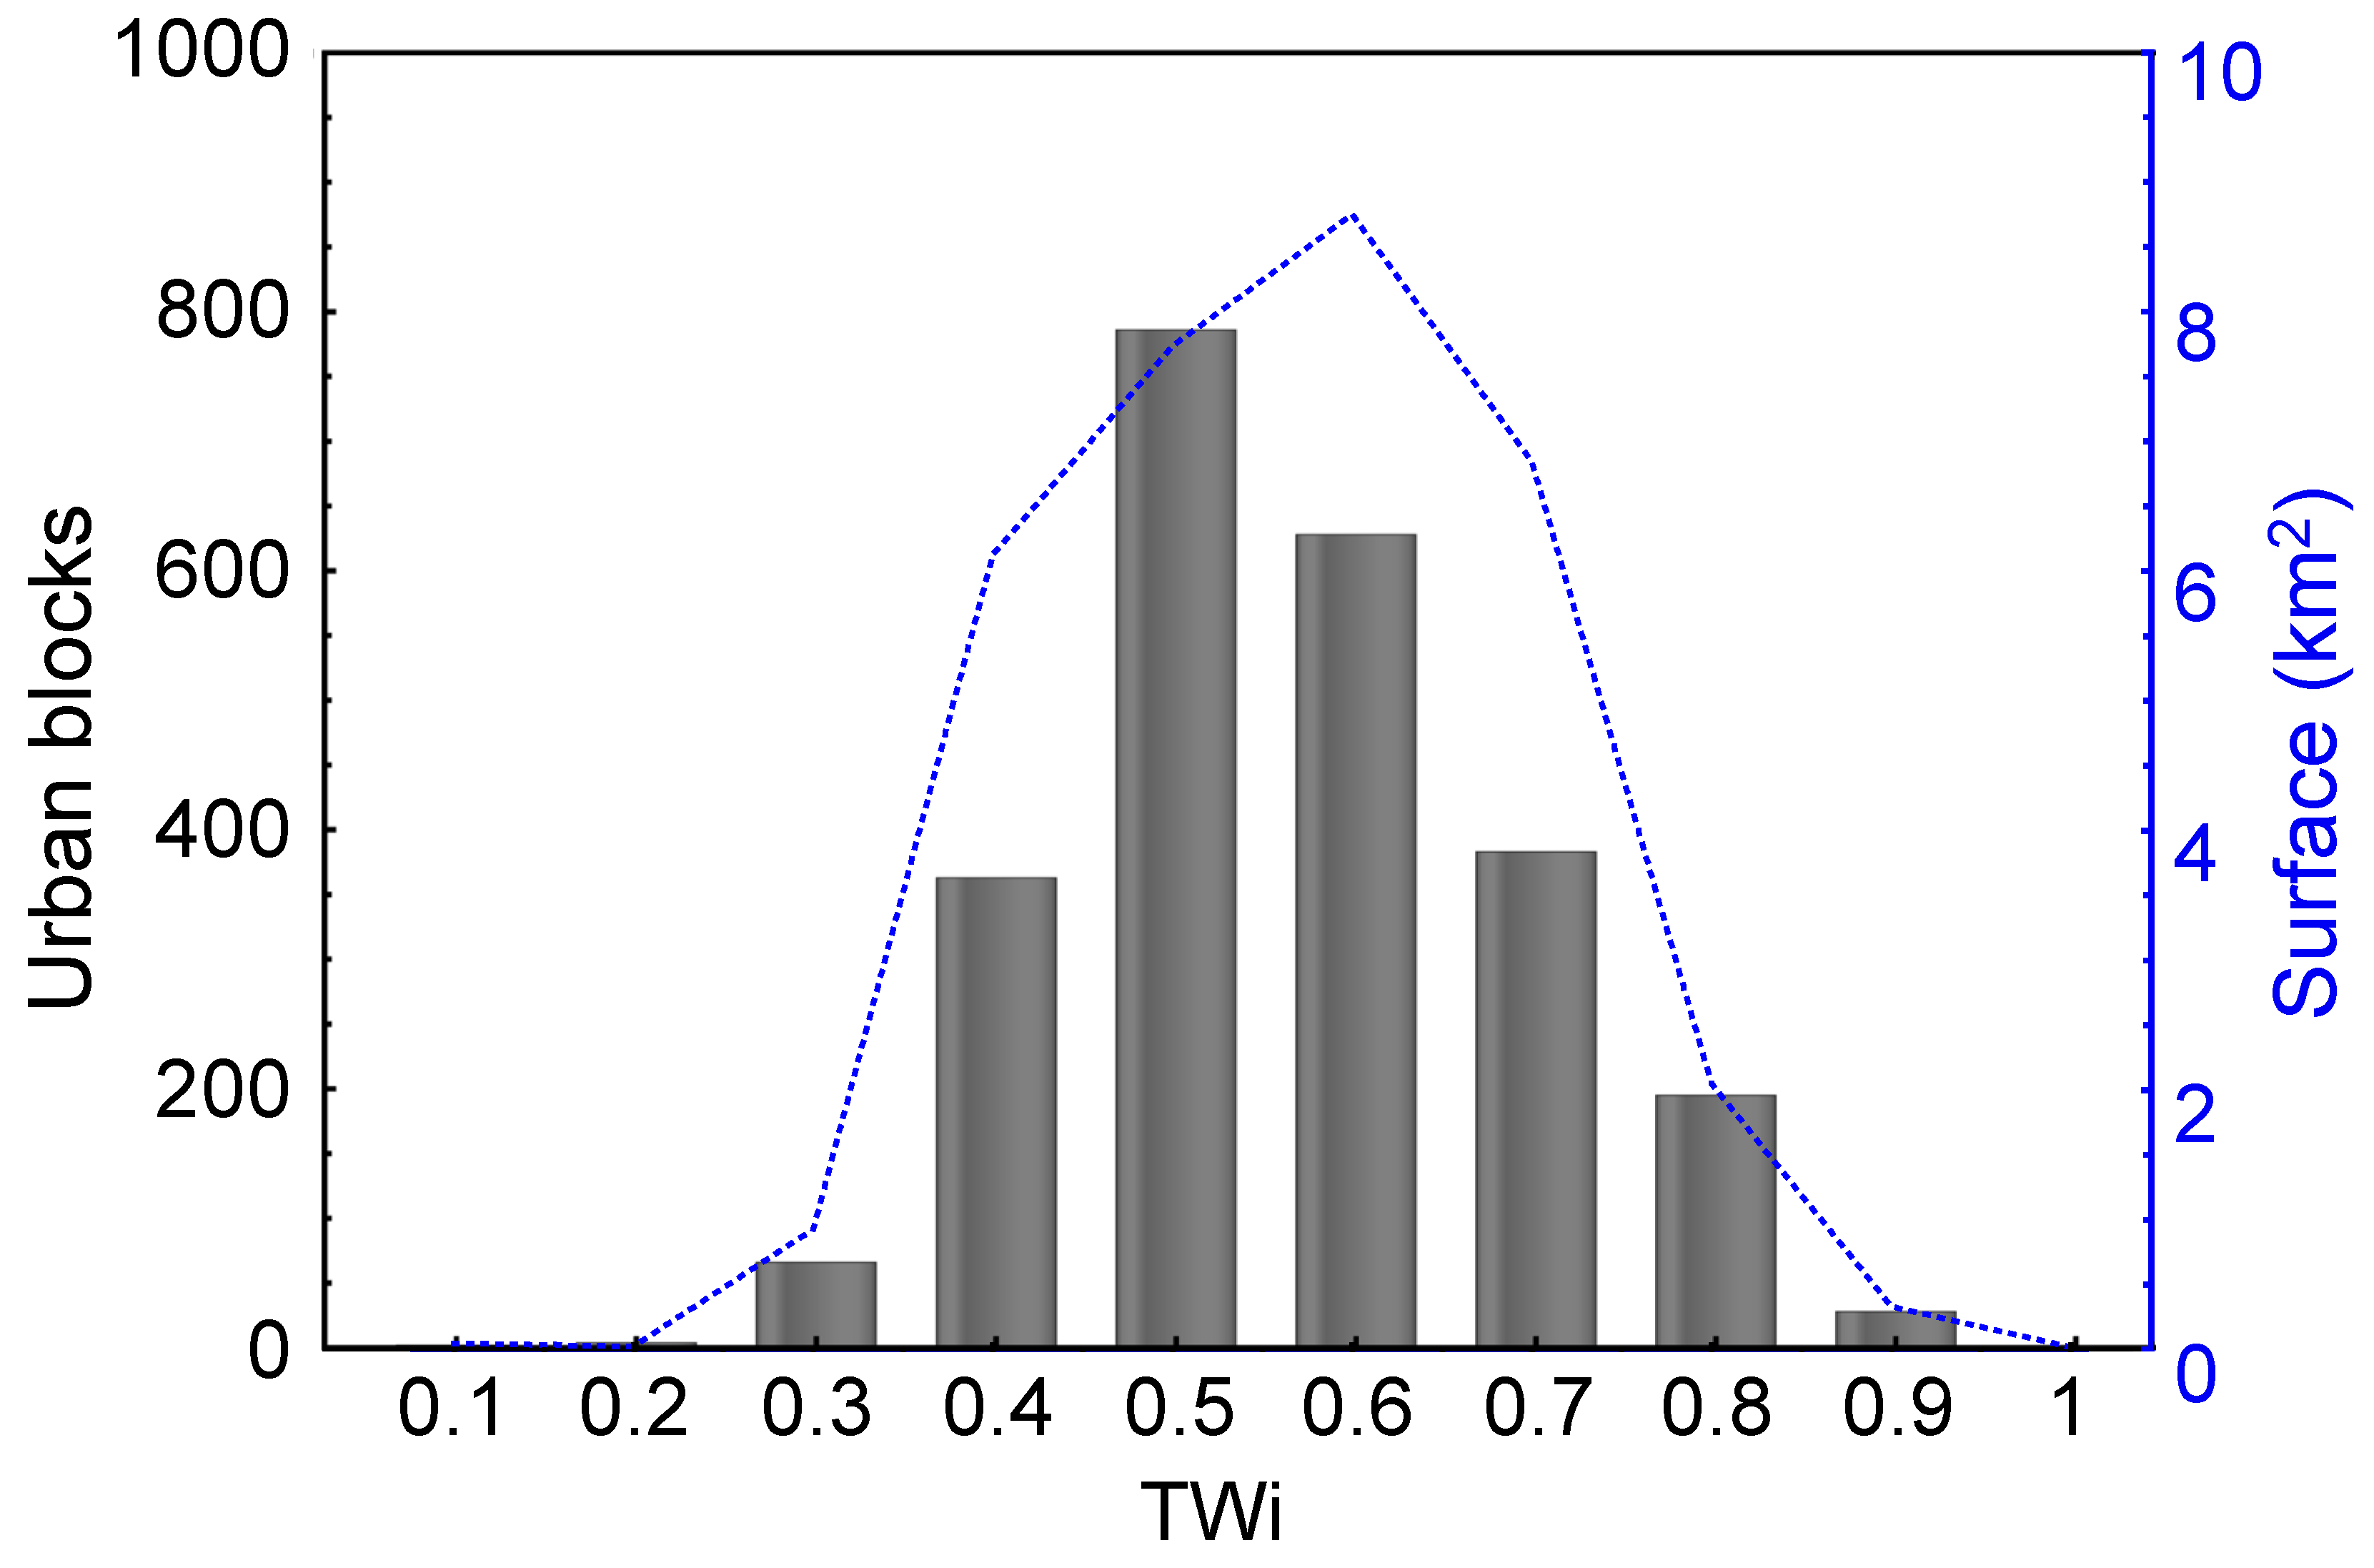
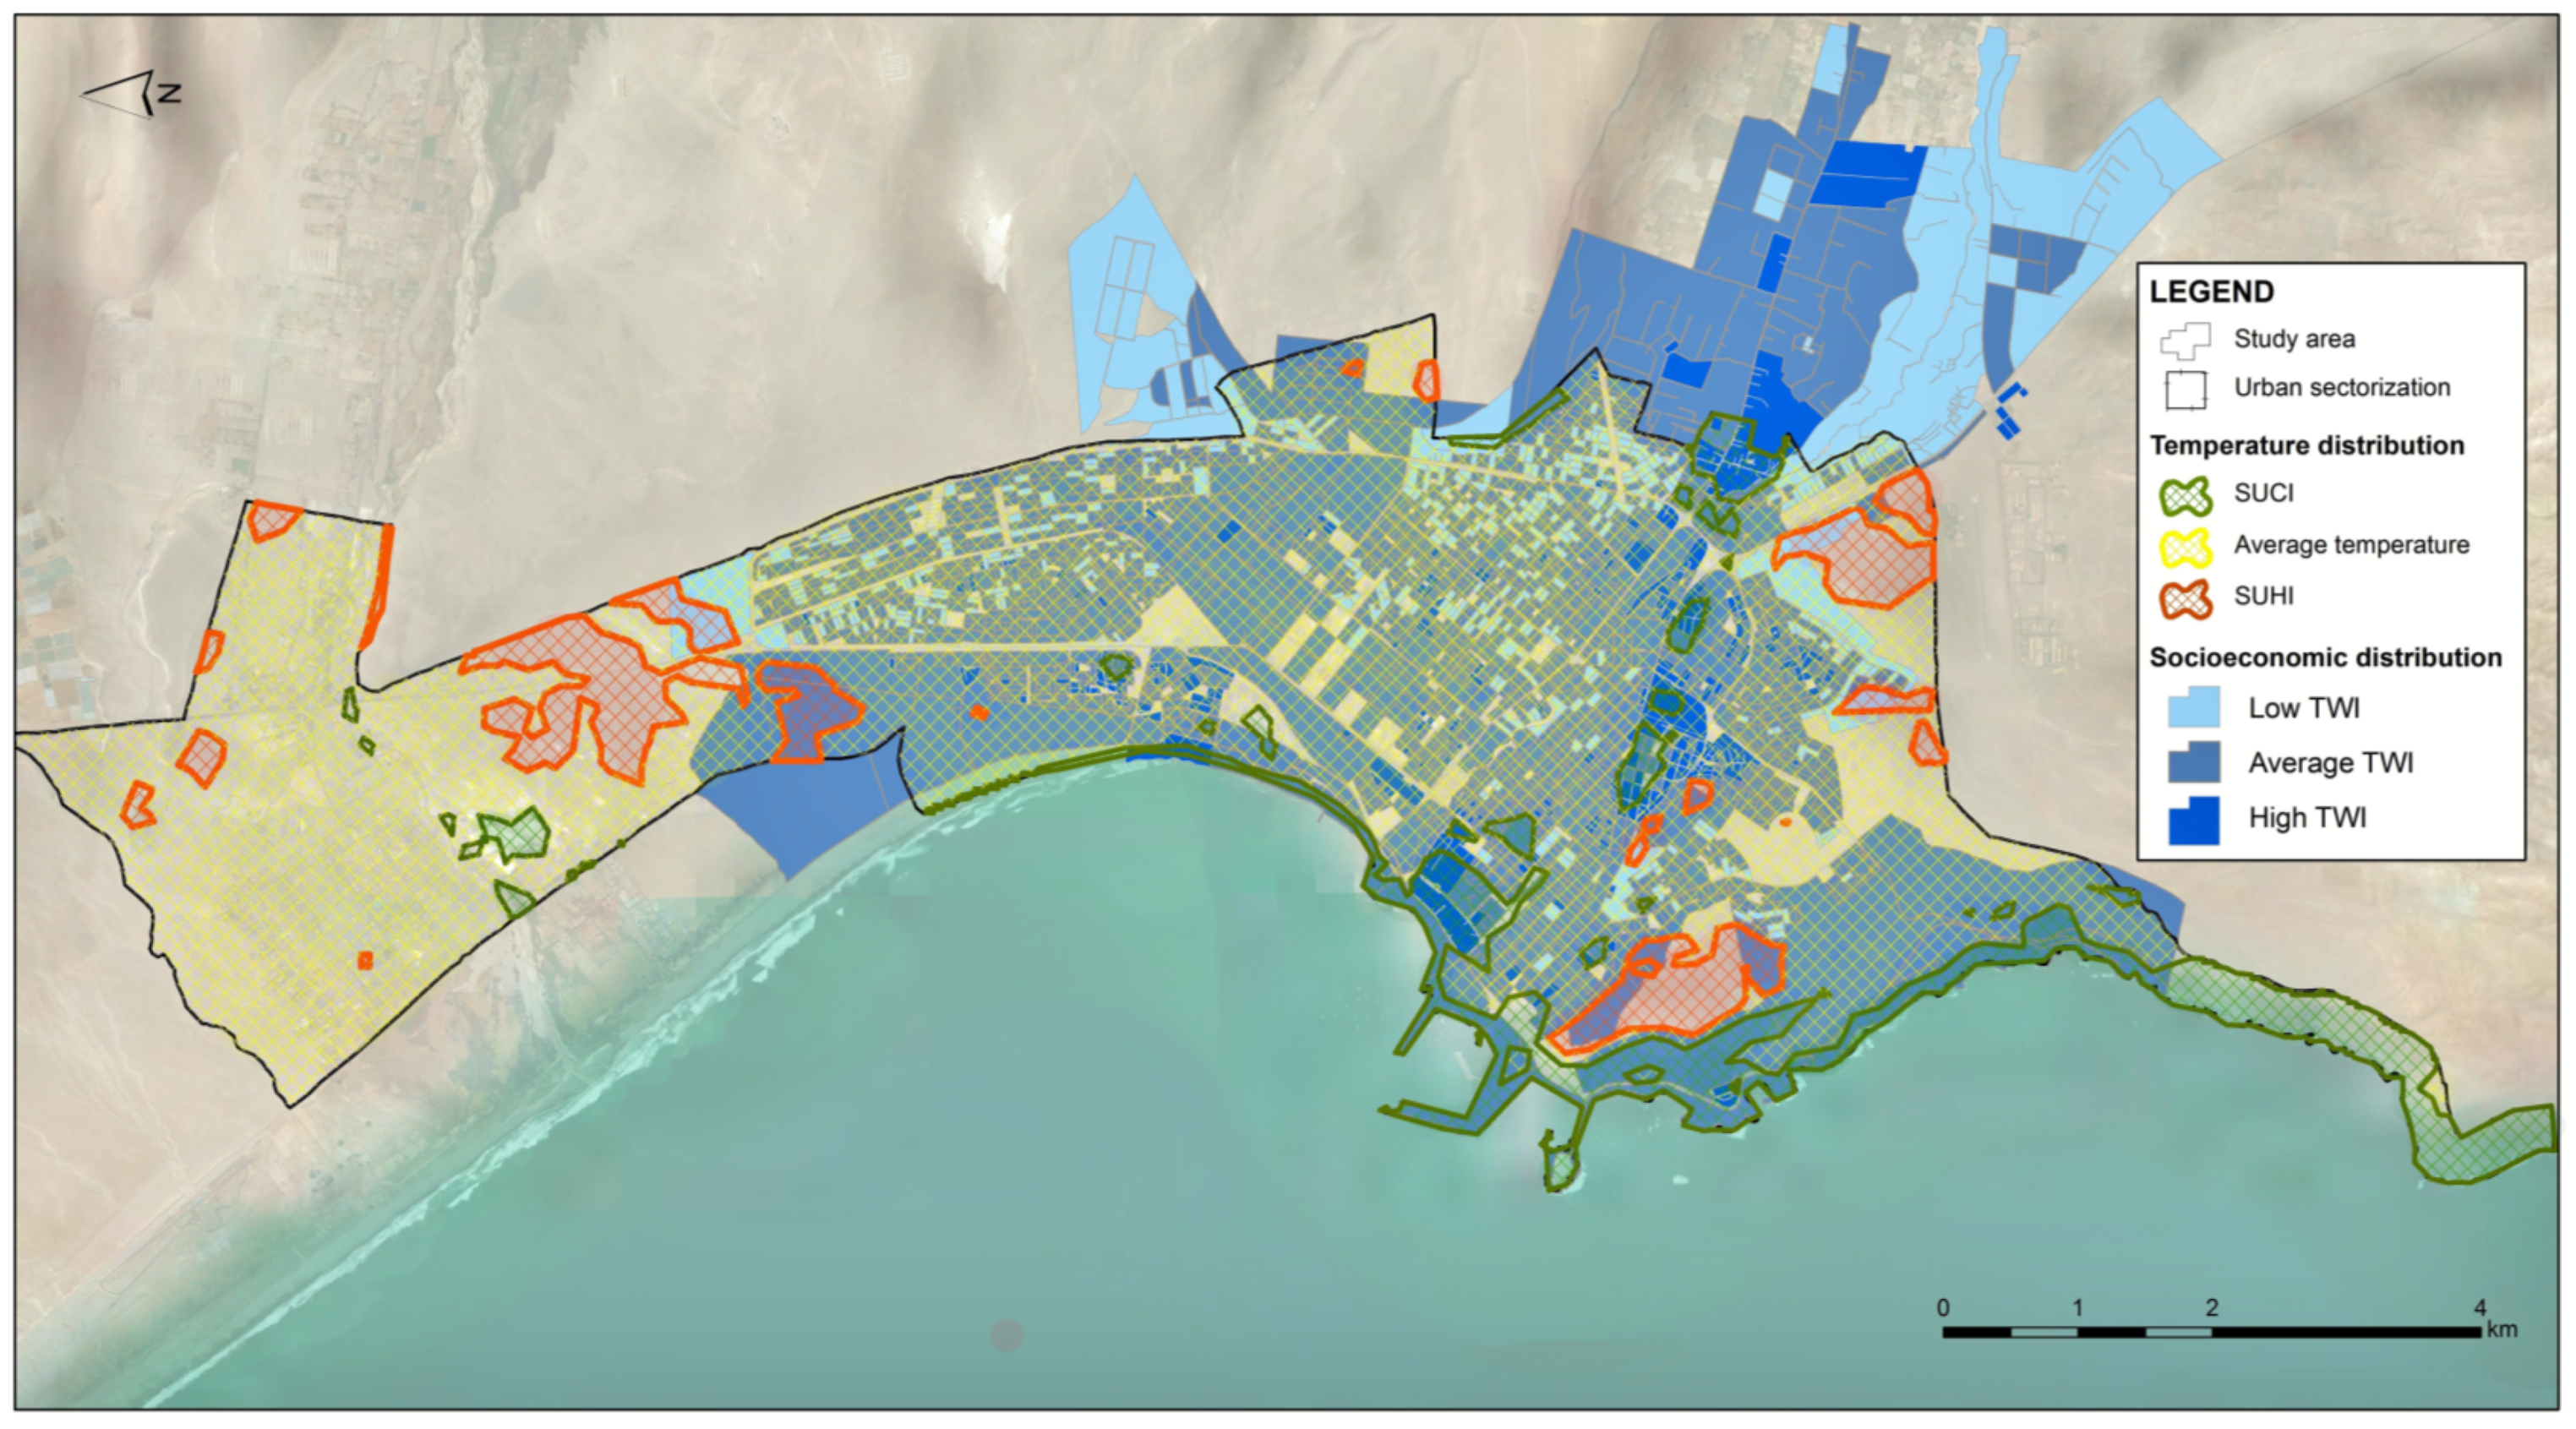
3.2. Socioeconomic Characterisation of the Urban Population

According to the explained methodology in Section 2.2, we detected 2,456 urban blocks distributed as follows (Figure 5): the average TWi (range 0.5–0.7) comprises 1797 blocks (73.2%) with a spatial coverage of 29 km2; secondly, with 435 blocks (17.7%), the low TWi (range 0.1–0.4) distributed over 4.7 km2; and finally, with 224 (9.1%), the high TWi (range 0.8–1) spanning over 2.5 km2.
The dispersion of data will be sectorized based on those census districts located in the study area and with information on socioeconomic ranges, namely Puerto, Regimiento, Chinchorro, San José, Población Chile, Azapa, José Manuel Balmaceda, Carlos Dittborn, Parque Lauca, José Miguel Carrera, Condell, Fuerte Ciudadela, El Morro, Pedro Blanquier, Cancha Rayada, and Las Torres (Figure 6).
The spatial distribution of low TWi, which represents those blocks with a low socioeconomic classification, shows that the most significant amount of data was found in the urban sectors of Cancha Rayada with eighty-nine blocks and 0.7 km2, Pedro Blanquier with fifty-nine blocks distributed over 0.4 km2, and Fuerte Ciudadela with fifty census blocks totalling 0.8 km2. On the other hand, the lowest concentration of data was located in the Condell district with four blocks, Chinchorro with two, and Puerto, El Morro, and Regimiento with one census block in each sector, with a total of less than 0.01 km2 in these five zones. These values are concentrated in the eastern sector of the study area, leaving little range data in the western zone (Supplementary Figure S1). Regarding the spatial distribution of high TWi, representing the blocks with high socioeconomic classification, it can be mentioned that the largest amount of data was found in the urban sectors of Carlos Dittborn with sixty blocks and 0.5 km2, Chinchorro with fifty-two blocks distributed over 0.3 km2, and Fuerte Ciudadela with twenty-eight census blocks adding up to 0.1 km2. On the other hand, the lowest concentration of data was located in the Condell districts with three blocks distributed over 0.4 km2, Población Chile with two blocks, and Parque Lauca with one census block, both over less than 0.01 km2. Contrary to the previous case, the highest concentration of data occurred in the southwestern and southeastern areas of the city and to a lesser extent in the northern part of the city (Supplementary Figure S2).
By crossing the variables of the average of the study period and the spatial distribution of the low and high TWi, the presence of SUHI and SUCI with the aforementioned ranges was generated (Figure 7). In this context, Table 3 shows the ranges and distribution of SUHI, average temperatures, and SUCI. For the analysis of the period with the crossing of the socioeconomic categorizations, there are more spatial intercepts between the ranks and the SUCI than with the SUHI. Likewise, there is a greater presence of SUCI within the urban morphology, as well as in the study area in general.

4. Discussion

Considering a study period of 35 years includes analyzing the spatial dynamics for both the distribution of the climate effect and the transformation of urban concentrations or morphology in the study area. As can be seen in the comparison of urban morphology between 1985 and 2019, with an increase in urban land of 7.9 km2, with a predominance of expansion towards the north, a change in the distribution of SUHI/SUCI can be observed. Surface temperature is unevenly distributed according to socioeconomic distribution: the districts Puerto, Regimiento, Chinchorro, Azapa, Carlos Dittborn, Condell, and El Morro have a higher socioeconomic classification, while the urban sectors San José, Población Chile, José Manuel Balmaceda, Parque Lauca, José Miguel Carrera, Fuerte Ciudadela, Pedro Blanquier, Cancha Rayada, and Las Torres have a lower socioeconomic classification. This expansion zone tends to contain the greatest presence of SUHI outside the urban morphology, i.e., in places where there are areas of wasteland devoid of urban coverage. This finding coincides with the results presented by Romero [17], where this configuration resulting from the urban climate is generated from inadvertent and intentional transformations introduced on the regional and local base climates. This configuration is characterized by its intertropical location where solar radiation is more or less homogeneous throughout the year, in addition to being subjected to a constant influence of the Pacific Ocean.
Through the identification of the SUHI, we generated additional knowledge in the study area, which allows us to understand the spatial relationships presented by a given place and, as concluded through the analysis of the local climate zones in Hong Kong and Guangzhou led by Chen et al. [31], to determine the need to generate a new understanding of space to facilitate the development of spatial strategies to improve urban thermal conditions. In this sense, we also obtained other elements to understand the urban climatology of Arica, such as SUCI and average temperatures. Both urban islands are inversely related, i.e., when there is a greater presence of one, the other is present to a lesser extent.
The SUHI values of our study correspond to those obtained for the UCI calculated by Henríquez et al. [32] through a modification of the formula proposed by Oke [5] using data from the present period (1990–2010) published in the Climate Risk Atlas of Chile (ARClim—arclim.mma.gob.cl, accessed 12 May 2021), where Arica is among those with the UCI highest intensity. In this same study, an increase in the SUHI was projected for the future scenario (2035–2065), reaching a value of 5.11 °C. In addition, some studies have estimated that the energy demand for cooling will increase between 2% and 4% for every 1 °C increase in the maximum daily temperature, above a threshold between 15°C and 20 °C [33]. For its part, according to the estimates of the Department of Energy of the United States, 10 billion dollars are spent annually on energy for cooling to alleviate the heat island effect [34]. According to our results, only some areas of the city are affected by SUHI, and consequently the effects on the health and welfare of the population as well as their need to access cooling mechanisms are also heterogeneous and will intensify in the future.
Studies developed in Madrid [35] have determined that the vulnerable population is located in warmer areas, leading people living in these areas to be more prone to developing health problems, especially in risk groups, in addition to having greater exposure to extreme events. According to these findings, Chakraborty et al. [18] concluded that the population characterized by a lower socioeconomic level was more likely to suffer from diseases and live-in housing with structural deficiencies than those with a higher socioeconomic level. In other words, regardless of whether this relationship depends on their attributes or their spatial context, the lower socioeconomic ranks are more exposed to the imbalances of urban spaces. It can be pointed out that the spatial relationships found in Arica follow these postulates, since there is a direct relationship between the SUHI and the low socioeconomic ranks, and another between the SUCI and the high socioeconomic ranks. In a binary distribution, the sectors with the highest socioeconomic classification are the districts of Puerto, Regimiento, Chinchorro, Azapa, Carlos Dittborn, Condell, and El Morro, and by lower socioeconomic classification, San José, Población Chile, José Manuel Balmaceda, Parque Lauca, José Miguel Carrera, Fuerte Ciudadela, Pedro Blanquier, Cancha Rayada, and Las Torres.
Extensively, regardless of the number of blocks in the low TWi, SUHI intercepts 50% more in sectors of lower socioeconomic classification than in the high TWi. However, the IFUs are mostly spatialized in the urban concentration, intercepting mostly in areas of higher socioeconomic classification, with 95% more blocks in the high than in the low TWi.
Although Arica represents one of the cities with a lower socioeconomic segregation, given the relationship of surface temperatures with the analyzed ranges, a similarity with the study of Smith and Henriquez [36], which indicated that high-income areas have a better climate and environment, was noted. According to this finding, the spatial relationship represented in Arica is like that of the national reality, where urban climates are part of the landscape mosaic [18], which in its interior harbors or represents deep social inequalities [17]. In this sense and comparing with what happens in another mid-sized city such as Chillán, inhabitants of low socioeconomic status categories do not have the resources to mitigate thermal discomfort, unless this is provided by public spaces, while private sectors have access to high-quality public spaces. This relationship provides clear evidence of environmental injustice [36]. Besides, most of the studies in Chile have focused on locations where UHI are characterized by their Mediterranean conditions, and hence, a traditional study of the thermal difference between urbanization and rurality. More studies should be conducted to better understand the overall UHI phenomenon, e.g., in Dubai [9], also investigating surface UHI and boundary UHI to cover different scales of research. Moreover, the coastal desert location of Arica, where the marine breeze interacts with the circulation of the UHI, inhibits the advection of warm air, so the city stays cooler [37]. This phenomenon has also been observed in cities in Asia, Oceania, and the Middle East [6].
Likewise, it is important to highlight the areas identified as new urban areas within the current concentration of the city [13]. However, a few of them are located with the presence of SUHI in a block of low socioeconomic classification, while only one is located in the area of SUCI, with a high socioeconomic classification. It should be noted that, according to several authors, planning the urban structure and morphology, in relation to buildings, construction materials, and the availability of green areas, would reduce the causes of potential problems associated with thermal exposure [14,18,22,31] in the context of the spatial inequality that cities present [3,36], in addition to incorporating the prevention and mitigation of the intensification of the effects of climate change in cities [38].

5. Conclusions

Our study provides substantial data to the body of literature on climate justice and thermal inequity. The results contribute to generating a basis for understanding the behaviour of surface temperatures in the city of Arica, as well as the distribution of SUHI and SUCI in the study area. Results show how, in the city of Arica, temperature is unevenly distributed according to socioeconomic factors. Regarding the socioeconomic distribution, it is understood that the districts Puerto, Regimiento, Chinchorro, Azapa, Carlos Dittborn, Condell, and El Morro have a higher socioeconomic classification, while the urban sectors San José, Población Chile, José Manuel Balmaceda, Parque Lauca, José Miguel Carrera, Fuerte Ciudadela, Pedro Blanquier, Cancha Rayada, and Las Torres have a lower socioeconomic classification.
Through the linkage of both variables, we determined that, in the study period, there was a lower presence of SUHI, but these were linked to spaces of lower socioeconomic classification and, for the most part, would form new urban spaces within the city. On the other hand, SUCI had a greater spatial presence in the study area and in the urban morphology, being found mostly in areas of high socioeconomic classification and in consolidated spaces with few possibilities of generating new constructions. This finding shows a climate gap, where the adverse effects of climate change are distributed unevenly among individuals according to their socioeconomic status.
Eventually, if this study is developed in other localities, whether Chilean or Latin American, it would be an important point of contrast to determine if this situation is replicated in different places and to identify whether this parameter is common or not. From this basic research, new studies can be undertaken to contribute to the increase of scientific knowledge in the city of Arica: developing the spatial relationship between climate quality indicators and/or the distribution of climate justice in the city. This type of research reaffirms that thermal inequality is at the center of environmental justice problems. The fact that economically disadvantaged people face the effects of climate change unequally should motivate the extension of this type of basic research to other cities in the region to spatially relate climate quality to socioeconomic factors or other forms of discrimination (such as those based on race and ethnicity). In addition, this type of study can inform city planning and the design of heat mitigation strategies of the adverse effects in the context of climate change.
These results are based exclusively on data provided by Landsat satellite images. In future stages, it will be interesting to consider in-situ measurements in the inside of different buildings or houses of different socioeconomic levels to contrast these findings with those presented in this work.

Supplementary Materials

The following are available online at https://www.mdpi.com/article/10.3390/atmos12070917/s1. Table S1. Annual averages for the 1985–2019 period and satellite images used according to warm and cold seasons; Figure S1. Spatial distribution of the low Twi; Figure S2. Spatial distribution of the high Twi.

Author Contributions

Conceptualization, O.M.-R.; methodology, C.Q.-T. and O.C.-G.; validation, P.S. (Pamela Smith) and P.S. (Pablo Sarricolea); formal analysis, C.Q.-T. and O.M.-R.; investigation, C.Q.-T., M.P., P.S. (Pamela Smith), and O.M.-R.; resources, C.Q.-T. and O.C.-G.; data curation, O.C.-G.; writing—original draft preparation, O.M.-R.; funding acquisition, P.S. (Pamela Smith). All authors have read and agreed to the published version of the manuscript.

Funding

This research was funded by project ANID-FONDECYT 11180990.

Institutional Review Board Statement

Not applicable.

Informed Consent Statement

Not applicable.

Data Availability Statement

All the Satellite images were retrieved from the EarthExplorer USGS website at https://earthexplorer.usgs.gov/, accessed 18 April 2020. The socioeconomic information of the population for the city of Arica is available in the Socioeconomic Dimension of the Centro de Inteligencia Territorial (CIT) at www.bienestarterritorial.cl, accessed 20 May 2020, from the Universidad Adolfo Ibañez (Chile).

Acknowledgments

The authors want to thank the ANID-FONDECYT project 11180990.

Conflicts of Interest

The authors declare no conflict of interest.

References

  1. Moreno, M.C. Climatología Urbana; Universitat de Barcelona: Barcelona, Spain, 2010; p. 80. [Google Scholar]
  2. INE-MINVU. Metodología para Medir el Crecimiento Físico de los Asentamientos Humanos en Chile; Comisión de Estudios Habitacionales y Urbanos, del Ministerio de Vivienda y Urbanismo: Santiago, Chile, 2019; p. 105. [Google Scholar]
  3. Smith, P.; Henríquez, C. Microclimate Metrics Linked to the Use and Perception of Public Spaces: The Case of Chillán City, Chile. Atmosphere 2018, 9, 186. [Google Scholar] [CrossRef] [Green Version]
  4. Sarricolea, P.; Meseguer-Ruiz, O. Urban Climates of Large Cities: Comparison of the Urban Heat Island Effect in Latin America. In Urban Climates in Latin America; Henríquez, C., Romero, H., Eds.; Springer: Cham, Switzerland, 2019; pp. 17–32. [Google Scholar]
  5. Oke, T.R. Boundary Layer Climates; Methuen Press: London, UK, 1987. [Google Scholar]
  6. Yun, G.Y.; Ngarambe, J.; Duhirwe, P.N.; Ulpiani, G.; Paolini, R.; Haddad, S.; Vasilakopoulou, K.; Santamouris, M. Predicting the magnitude and the characteristics of the urban heat island in coastal cities in the proximity of desert landforms. The case of Sydney. Sci. Total Environ. 2020, 709, 136068. [Google Scholar] [CrossRef]
  7. Nassar, A.K.; Blackburn, G.A.; Whyatt, J.D. Dynamics and controls of urban heat sink and island phenomena in a desert city: Development of a local climate zone scheme using remotely-sensed inputs. Int. J. Appl. Earth Obs. Geoinf. 2016, 51, 76–90. [Google Scholar] [CrossRef] [Green Version]
  8. Santamouris, M. Analyzing the heat island magnitude and characteristics in one hundred Asian and Australian cities and regions. Sci. Total Environ. 2015, 512–513, 582–598. [Google Scholar] [CrossRef] [PubMed]
  9. Mohammed, A.; Pignatta, G.; Topriska, E.; Santamouris, M. Canopy Urban Heat Island and Its Association with Climate Conditions in Dubai, UAE. Climate 2020, 8, 81. [Google Scholar] [CrossRef]
  10. Lazzarini, M.; Marpu, P.R.; Ghedira, H. Temperature-land cover interactions: The inversion of urban heat island phenomenon in desert city areas. Remote Sens. Environ. 2013, 130, 136–152. [Google Scholar] [CrossRef]
  11. Lazzarini, M.; Molini, A.; Marpu, P.R.; Ouarda, T.B.; Ghedira, H. Urban climate modifications in hot desert cities: The role of land cover, local climate, and seasonality. Geophys. Res. Lett. 2015, 42, 9980–9989. [Google Scholar] [CrossRef] [Green Version]
  12. Fan, C.; Myint, S.W.; Kaplan, S.; Middel, A.; Zheng, B.; Rahman, A.; Huang, H.-P.; Brazel, A.; Blumberg, D.G. Understanding the Impact of Urbanization on Surface Urban Heat Islands—A Longitudinal Analysis of the Oasis Effect in Subtropical Desert Cities. Remote Sens. 2017, 9, 672. [Google Scholar] [CrossRef] [Green Version]
  13. Mitchell, B.C.; Chakraborty, J. Exploring the relationship between residential segregation and thermal inequity in 20 U.S. cities. Local Environ. 2018, 23, 796–813. [Google Scholar] [CrossRef]
  14. Mitchell, B.C.; Chakraborty, J. Thermal inequity: The relationship between urban structure and social disparities in an era of climate change. In Routledge Handbook of Climate Justice; Jarfy, T., Ed.; Routledge: New York, NY, USA, 2018. [Google Scholar]
  15. Saverino, K.; Routman, E.; Lookingbill, T.; Eanes, A.; Hoffman, J.; Bao, R. Thermal Inequity in Richmond, VA: The Effect of an Unjust Evolution of the Urban Landscape on Urban Heat Islands. Sustainability 2021, 13, 1511. [Google Scholar] [CrossRef]
  16. Dialesandro, J.; Brazil, N.; Wheeler, S.; Abunnasr, Y. Dimensions of Thermal Inequity: Neighborhood Social Demographics and Urban Heat in the Southwestern U.S. Int. J. Environ. Res. Public Health 2021, 18, 941. [Google Scholar] [CrossRef] [PubMed]
  17. Romero, H. Urban Climates and the Challenge of Sustainable Development of Chilean Cities. In Urban Climates in Latin America; Henríquez, C., Romero, H., Eds.; Springer: Cham, Switzerland, 2019; pp. 207–256. [Google Scholar]
  18. Chakraborty, T.; Hsu, A.; Manya, D.; Sheriff, G. Disproportionately higher exposure to urban heat in lower-income neighborhoods: A multi-city perspective. Environ. Res. Lett. 2019, 14, 105003. [Google Scholar] [CrossRef] [Green Version]
  19. Siqi, J.; Yuhong, W. Effects of land use and land cover pattern on urban temperature variations: A case study in Hong Kong. Urban Clim. 2020, 34, 100693. [Google Scholar] [CrossRef]
  20. Reyes-Paecke, S.; Gironás, J.; Melo, O.; Vicuña, S.; Herrera, J. Irrigation of green spaces and residential gardens in a Mediterranean metropolis: Gaps and opportunities for climate change adaptation. Landsc. Urban Plan. 2019, 182, 34–43. [Google Scholar] [CrossRef]
  21. Tang, J.; Di, L.; Xiao, J.; Lu, D.; Zhou, Y. Impacts of land use and socioeconomic patterns on urban heat Island. Int. J. Remote Sens. 2017, 38, 3445–3465. [Google Scholar] [CrossRef]
  22. Harlan, S.L.; Brazel, A.J.; Darrel Jenerette, G.; Jones, N.S.; Larsen, L.; Prashad, L.; Stefanov, W.L. In the shade of affluence: The inequitable distribution of the urban heat island. In Equity and the Environment; Research in Social Problems and Public Policy; Wilkinson, R.C., Freudenburg, W.R., Eds.; Emerald Group Publishing Limited: Bingley, UK, 2007; Volume 15, pp. 173–202. [Google Scholar] [CrossRef]
  23. Sarricolea, P.; Herrera-Ossandon, M.; Meseguer-Ruiz, Ó. Climatic regionalisation of continental Chile. J. Maps 2017, 13, 66–73. [Google Scholar] [CrossRef]
  24. Meseguer-Ruiz, O.; Ponce-Philimon, P.I.; Guijarro, J.; Sarricolea, P. Spatial distribution and trends of different precipitation variability indices based on daily data in Northern Chile between 1966 and 2015. Int. J. Clim. 2019, 39, 4595–4610. [Google Scholar] [CrossRef]
  25. INE. Censo 2017. Available online: https://www.censo2017.cl/ (accessed on 20 April 2020).
  26. Miranda, F.M.; Aguayo, P.M. Medición de la Superficie Ocupada por las Ciudades de Chile de Más de 15.000 Habitantes: 1993–2003; Ministerio de Vivienda y Urbanismo: Santiago de Chile, Chile, 2007; p. 63.
  27. Yin, G.; Mariethoz, G.; McCabe, M.F. Gap-Filling of Landsat 7 Imagery Using the Direct Sampling Method. Remote Sens. 2017, 9, 12. [Google Scholar] [CrossRef] [Green Version]
  28. Ghulam, A.; Saint Louis University, Saint Louis, MI, USA. Calculating Surface Temperature Using Landsat Thermal Imagery. Personal communication, 2010. [Google Scholar]
  29. Avdan, U.; Jovanovska, G. Algorithm for Automated Mapping of Land Surface Temperature Using LANDSAT 8 Satellite Data. J. Sens. 2016, 2016, 1480307. [Google Scholar] [CrossRef] [Green Version]
  30. Soto-Estrada, E. Estimación de la isla de calor urbana en Medellín, Colombia. Rev. Int. Contam. Ambient. 2019, 35, 421–434. [Google Scholar] [CrossRef]
  31. Chen, X.; Xu, Y.; Yang, J.; Wu, Z.; Zhu, H. Remote sensing of urban thermal environments within local climate zones: A case study of two high-density subtropical Chinese cities. Urban Clim. 2020, 31, 100568. [Google Scholar] [CrossRef]
  32. Henríquez, C.; Smith, P.; Contreras, P.; Quense, J. Variación en la intensidad de la isla de calor urbana por efecto del cambio climático en ciudades chilenas. Geographicalia 2021. accepted. [Google Scholar]
  33. Akbari, H.; Pomerantz, M.; Taha, H. Cool surfaces and shade trees to reduce energy use and improve air quality in urban areas. Sol. Energy 2001, 70, 295–310. [Google Scholar] [CrossRef]
  34. Rosenfeld, A.H.; Romm, J.J.; Akbari, H.; Pomerantz, M.; Taha, H.G. Policies to Reduce Heat Islands: Magnitudes of Benefits and Incentives to Achieve Them; Asilomar Conference Ground: Pacific Grove, CA, USA, 1996. [Google Scholar]
  35. Sánchez-Guevara, C.; Núñez, M.; Neila, F. Isla de calor urbana y población vulnerable. El caso de Madrid. In Proceedings of the 3rd International Congress on Sustainable Construction and Eco-Efficient Solutions, Seville, Spain, 27–29 March 2017; Mercader-Moyano, P., Ed.; Universidad de Sevilla: Sevilla, Spain, 2017; pp. 545–556. [Google Scholar]
  36. Smith, P.; Henríquez, C. Public Spaces as Climate Justice Places? Climate Quality in the City of Chillán, Chile. Environ. Justice 2019, 12, 164–174. [Google Scholar] [CrossRef]
  37. Morris, C.; Simmonds, I. Associations between varying magnitudes of the urban heat island and the synoptic climatology in Melbourne, Australia. Int. J. Clim. 2000, 20, 1931–1954. [Google Scholar] [CrossRef]
  38. Dirksen, M.; Ronda, R.; Theeuwes, N.; Pagani, G. Sky view factor calculations and its application in urban heat island studies. Urban Clim. 2019, 30, 100498. [Google Scholar] [CrossRef]
Figure 1. Location of the study area.
Atmosphere 12 00917 g001
Figure 2. Locations of SUHI and SUCI and their spatial distribution in Arica during the warmer years: (A) 1987, (B) 2002, (C) 2003, (D) 2013, and (E) 2014.
Atmosphere 12 00917 g002
Figure 3. Locations of SUHI and SUCI and their spatial distribution in Arica during the colder years: (A) 1990, (B) 1991, (C) 1996, (D) 2001, and (E) 2006.
Atmosphere 12 00917 g003
Figure 4. Mean surface temperatures in Arica between 1985 and 2019.
Atmosphere 12 00917 g004
Figure 5. Spatial socioeconomic distribution per surfaces and urban blocks in Arica by rank.
Atmosphere 12 00917 g005
Figure 6. Distribution of socioeconomic ranks in Arica, according to their location in urban sectors.
Atmosphere 12 00917 g006
Figure 7. Average surface heat islands and socioeconomic distribution in the city of Arica.
Atmosphere 12 00917 g007
Table 1. Indicators and variables considered for calculating the socioeconomic dimension.
Indicators 2012DescriptionIndicators 2017Description
Socioeconomic levelCensus 2012 housing, household, and breadwinner variables.Housing qualitySynthetic variable of all housing materials, by means of a linear average of 3 sub-indicators (walls, floors, and ceilings).
Dispersion concentrationFrom the SEL, homogeneity or socioeconomic heterogeneity observed within a 300 m radius around each block was calculated by calculating the standard deviation of the SEL centile.Housing sufficiencyNumber of dwellings in overcrowded conditions and number of dwellings in severely overcrowded conditions. Overcrowded dwellings correspond to those with between 2.5 and 4.9 persons per bedroom.
Schooling of head of householdCorresponds to the average number of years of study of the heads of household within a city block.
Household resilienceIs the additive inverse of the proportion of single-parent households within a block.
EmploymentProportion of the working population with employment, with respect to the total number of people able and willing to work in each block.
Youth participation in employment and studyProportion of the participation of young people between 14 and 24 years old who work or study with respect to the total number of people in this age segment in the block.
Table 2. Arica census districts.
District NumberNameUsed (Y/N)District NumberNameUsed (Y/N)
01PuertoY11CondellY
02RegimientoY12Fuerte CiudadelaY
03ChinchorroY13ChacaN
04San JoséY14El MorroY
05Población ChileY15ChacallutaN
06AzapaY16MolinosN
07José Manuel BalmacedaY17Pedro BlanquierY
08Carlos DittbornY18Cancha RayadaY
09Parque LaucaY19Las TorresY
10José Miguel CarreraY
Table 3. Distribution of surface temperatures by socioeconomic range.
TWi RangeLowHigh
SUHI (km2)4.02.0
Average temperatures (km2)42.918.3
SUCI (km2)2.039.0
Publisher’s Note: MDPI stays neutral with regard to jurisdictional claims in published maps and institutional affiliations.

