Abstract
Several studies have highlighted the negative effects of ozone (O3) on wheat development and productivity. The negative effects of O3 are mediated by changes in photosynthetic carbon and nitrogen metabolism, which are difficult and time-consuming to assess and are thus only measured sporadically throughout the plant cycle. Stable isotope measurements in grains can help integrate the effects of chronic O3 exposure over the lifespan of the plant. This particular study focuses on the extent to which the stomatal conductance and productivity of Mediterranean wheat are related to carbon and nitrogen isotopic signatures under chronic O3 exposure. An open top chamber experiment was designed to analyse the effects of the pollutant on 12 Spanish wheat genotypes, which included modern cultivars, old cultivars and landraces. Four O3 treatments were considered. Stomatal conductance (gs) measurements were carried out during anthesis, and yield and nitrogen content parameters were taken at maturity, along with the carbon (δ13C) and nitrogen (δ15N) isotopic composition measured in grains. Modern and old cultivars responded similarly to O3 and were sensitive to the pollutant regarding yield parameters and gs, while landraces were more O3-tolerant. Grain δ13C had a strong negative correlation with grain yield and stomatal conductance across genotypes and O3 conditions, and increased under higher O3 concentrations, showing its capacity to integrate O3 stress throughout the wheat cycle. Meanwhile, a higher nitrogen concentration in grains, coupled with smaller grains, led to an overall decreased grain nitrogen yield under higher O3 concentrations. This nitrogen concentration effect within the grain differed among genotypes bred at different ages, following their respective O3-sensitivity. δ15N showed a possible indirect effect of O3 on nitrogen redistribution, particularly under the highest O3 concentration. The correlations of δ15N and δ13C to the usual effects of ozone on the plant suggest their potential as indicators of chronic ozone exposure.
1. Introduction
Even though tropospheric ozone (O3) is both a naturally occurring and anthropogenic gas, current global levels are mainly caused by photochemical reactions, due to precursors from industrial and urban emissions [1,2]. Local and regional air masses can transport precursors throughout long distances before leading to ozone production. When high ozone precursors and O3-favorable meteorological conditions for atmospheric chemistry coincide, pollutant formation increases, causing chronic and extensive O3-pollution problems in rural and forested areas, far away from the source of emissions [3]. This, along with the complexity of atmospheric O3 photochemistry, coupled with high NOx levels, explains the difficulty in maintaining O3 levels under safe values for crops and ecosystems [2,4]. In Europe, several EU Directives have prompted the reduction of O3-precursor emissions (2008/50/EU and 2016/2284/EU), which caused the high O3 peaks that were of maximum concern during the eighties. Nonetheless, background O3 levels still do not present a clear decreasing trend [5,6], and safe levels are not expected to be reached by the year 2030 [2].
Regarding chronically-high O3 levels, the Mediterranean basin is the most affected area in Europe [5,7]. Its stable summer conditions, high temperatures and high solar radiation favour photochemical O3 formation, which causes surface levels during spring and summer that surpass the threshold targets of the EU Directives (2008/50/EU and 2016/2284/EU) and the critical levels of the United Nations Air Convention for plant protection [5,8,9].
Along with the pollution problem, the expected impact of Climate Change is also recognized as a major concern in the Mediterranean area, a transition zone located between the arid North African climate and the temperate central European climate, which is prone to suffer substantial climatic changes [10,11]. Temperature is expected to increase by up to 5 °C by 2100 and, coupled with 25% less precipitation in the Mediterranean basin, these changes are expected to greatly harm crop yields [11] and worsen the O3 pollution problem [6,12].
O3 affects the plant by entering through the leaf stomata and producing reactive oxygen species (ROS), which react with the cell membranes and walls [13]. This early O3-induced oxidative burst drives cellular chain effects that alter physiological processes such as carbon assimilation by affecting stomatal conductance (gs), inducing partial closure or less efficient stomatal control [14], reducing foliar pigment content [15], affecting the electron transport chain [16], reducing the efficiency of Calvin cycle enzymes such as Rubisco [17], reducing photosynthates made available for redistribution [18] and increasing respiration rates [19]. As a final result, yield and grain quality are reduced [20,21]. Over 20% of all crop production in Europe is currently considered at risk of damage by O3 pollution, as O3-sensitive and moderately sensitive crops are grown in around 16% and 7%, respectively, of the agricultural land in Europe [21,22].
Wheat, one of the most important staple crops on a global scale, is also one of the most O3-sensitive crops [21,23,24]. Studies from the last decades have shown that this pollutant can induce important wheat yield losses and reduce grain quality (i.e., starch content, seed size), while also affecting N use efficiency and protein yield [25]. O3-induced wheat yield reduction is important both for its economic impact and its effect on global food security. In terms of wheat yield, modelling exercises have shown that O3 pollution can account for an average global reduction of 7.1% [26], ranging between 4.1–12.1% for Europe [19]. Moreover, data worsens when coupled with other constraints such as climate change and pressures to maintain natural resources [27].
Breeding for higher grain yield (GY) in wheat and other herbaceous crops has been coupled frequently with an enhancement of stomatal conductance (gs), which favours higher photosynthetic rates and cools down plants [28,29,30,31]. However, the higher gs of modern wheat cultivars can also potentially increase their O3-sensitivity, as they absorb the pollutant more readily. This has led to a clear trend in the genotypic variation regarding how wheat cultivars respond to O3. In general, modern cultivars are more O3-sensitive than older ones [28,32]. This also applies to wheat bred for Mediterranean conditions, although their adaptation to water-limited environments might have also made them more O3-tolerant (Bermejo-Bermejo et al., in press).
Ozone-induced effects in plants are usually studied through discrete gas exchange measurements during the crop season [28,33,34]. However, as these measures are very time consuming, they are usually only performed a small number of times throughout the growth cycle [26,35,36]. Usually, what is observed in these instantaneous measurements is extrapolated to the entire cycle, even though O3 responses can differ depending on the plant growth stage, with grain filling appearing to be the most susceptible stage [37,38]. A better-integrated response of plant gas exchange and assimilation can be analysed through the study of the stable carbon (δ13C) and nitrogen (δ15N) isotope compositions [39,40,41,42], particularly when analysed in grain after harvest.
Carbon fractionation is driven by the discrimination of stable carbon isotopes, favouring the uptake and further assimilation from the surrounding air of the lighter isotope, 12C, against 13C [39,43]. It should, however, be noted that frequently, rather than expressing the isotope signature as a composition (denoted as δ) which is the deviation of the 13C/12C molar abundance ratio between the analysed substance and a standard, values are transformed to discrimination (denoted as Δ13C) of the 13C from the atmosphere surrounding the plants [43]. From a physiological point of view, this discrimination depends on the ratio of intercellular to atmospheric CO2 concentration (Ci/Ca) [39,43]. If this ratio is integrated over time, it shows the balance between the gs and the net photosynthetic assimilation of the plant during the considered period [43,44,45]. Thus, δ13C discrimination occurs due to the diffusion of CO2 through the stomata and by Rubisco carboxylation [43,46]; therefore, if the stomata close, for example as a response to water stress, gs decreases, restricting the CO2 supply to the carboxylation sites, and overall decreasing the Ci/Ca and consequently Δ13C, while increasing δ13C [39,40,43].
Meanwhile, δ15N values are driven by discrimination of 14N against 15N, which depends largely on the capacity of the plant to assimilate the nitrogen available in the soil. Thus, δ15N in the plant may reflect δ15N of the nitrogen available in the soil, as well as metabolism, including recycling, transport through the plant, including the grains and even volatilization during senescence [38,47,48].
In that sense, changes in gs may affect the transpiration stream and, subsequently, nitrogen uptake from the soil, its transport to the leaves and volatilization, thus affecting δ15N [49]. Similarly, retranslocation of nitrogen through the plant via phloem, as well as photorespiration, can cause δ15N to increase in the upper organs, whereas roots tend to have lower δ15N than the stems and leaves, and these have less δ15N than the ears [47]. Nitrogen uptake after anthesis is quite low [50], therefore, as O3-effect is more predominant post-anthesis [37], N redistribution could be expected to be affected more than uptake by the pollutant.
In the present study, the effects of O3 exposure on the stable carbon and nitrogen isotope composition and its relation to yield parameters, as well as gs, were studied, considering a set of Mediterranean bread wheat genotypes that included landraces, along with old and modern commercial varieties, of which all except for one were developed after the so-called Green Revolution, which took place in the middle of the last century. The objective of the study was to assess the performance of grain δ13C and δ15N as an integrated tool to monitor chronic O3 effects on C assimilation and N metabolism in Mediterranean wheat genotypes. Both δ13C and δ15N have been shown to perform as useful indicators in wheat under other types of stresses, such as water-stress and salinity [39,42,51].
The starting hypotheses were that higher O3-stress will decrease gs, increasing δ13C (or lowering carbon isotope discrimination, Δ13C) particularly on the more O3-sensitive genotypes, in comparison to the tolerant genotypes. We postulate that this would cause a negative correlation between δ13C and yield parameters or gs due to the effect of O3, differing among wheat genotypes developed at different times. Even though the mechanisms explaining δ15N are less established than those of δ13C, since N absorption, metabolism and redistribution affect the nitrogen isotope signature, continuous O3-exposure is also expected to affect δ15N of mature grains.
2. Materials and Methods
2.1. Field Site
The experiment was developed in the CIEMAT Open Top Chambers (OTCs) facility located at “La Higueruela” MNCN/CSIC Research Farm (Santa Olalla, Toledo) in central Spain (450 m.a.s.l.; 40°3′ N, 4°26′ W) (Figure 1), which was specifically designed to study the effects of increasing O3 levels on crop plants. According to the Köppen–Geiger climate classification, this area experiences a hot-summer Mediterranean Climate (Csa) [52] and is used for rainfed cereals, characteristic of the agriculture of the central Iberian Peninsula.
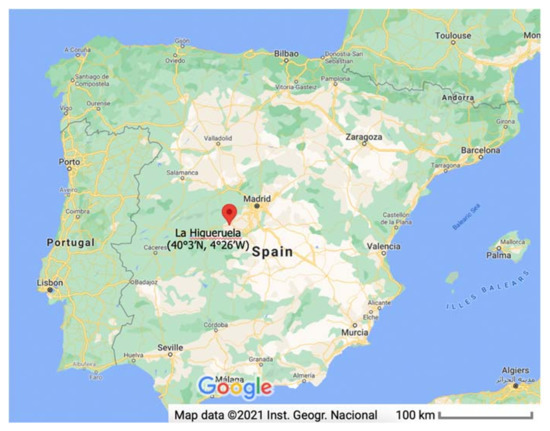
Figure 1.
Location of the CIEMAT OTC facility at the “La Higueruela” MNCN/CSIC Research Farm (Santa Olalla municipality, Toledo, Spain).
2.2. Open Top Chamber Facility
The experiment employed fifteen NCLAN-type OTCs, which are circular-like greenhouses (3 m high × 3 m diameter) that are open at the top through a conic structure (frustrum) to prevent wind from entering the chambers [53].
The experimental design of the facility included a complete randomized 3-block design with four O3 treatments replicated three times: thus, 3 OTCs per O3 treatment: Charcoal Filtered Air (FA), Non-filtered air (NFA) to reproduce ambient levels, Non-filtered air+ 20 nL L−1 of O3 (NFA+) and Non-filtered air + 40 nL L−1 of O3 (NFA++); where the last two reproduce O3 levels that are expected along this decade, as well as three chamberless plots (ambient air—AA) to check for chamber effect. More detailed information on the OTC facility can be found in Calvete-Sogo et al., 2016 [54].
2.3. Instrumentation OTC Facility
An O3 generator (A2Z Ozone Systems Inc., Louisville, KY, USA) system, located in a control cabin and fed with pure O2, was used to apply O3 to the NFA+ and NFA++ OTCs for 8 h day−1 (6:00 to 14:00 GTM), seven days a week. Air pollution was monitored continuously above the canopy inside each of the OTCs and AA plots by employing a timesharing system, with a sampling period of 10 min per plot. The air pollutants measured were: Ozone (ML® 9810B, Teledyne Monitor Labs, Englewood, CO, USA) and nitrogen oxides (NO2 and NO; ML®9841, Teledyne Monitor Labs, Englewood, CO, USA). Monitors were calibrated at the beginning of the experiment following a standard protocol.
Meteorological parameters were also monitored within six of the OTCs and the three AA plots: air relative humidity (RH), temperature (HOBO® Pro v2, Onset, Bourne, MA, USA) and photosynthetic active radiation (PAR; OSO-SUN HOBO®, Onset, Bourne, MA, USA).
2.4. Ozone Exposure Indices
Several ozone exposure indices were calculated to describe ozone exposure during the fumigation period: the accumulated AOT40 index was calculated as the sum of exceedances of O3-hourly mean values over 40 nL L−1 during daylight hours through the O3-exposure period [55]. In addition, 24 h-mean, 7 h mean and maximum hourly O3 values were also calculated.
2.5. Plant Material
Twelve Spanish wheat genotypes were selected for the assay: 4 modern commercial varieties (CVs), 4 old CVs and 4 landraces (Table 1). Pane 247 and the landraces were released pre-green revolution. The Plant Breeding Unit of the Agronomic Engineer School of Madrid (UPM) provided the seeds which were germinated in a plant nursery greenhouse. Seedlings were transported to the OTC field for transplanting into pots (18 cm3) using a mixture of turf (60%), perlite (20%) and vermiculite (20%) on January 26–28 of the year 2015. Four plants per pot were considered as well as four pots per cultivar and OTC (totalling 12 pots per CVs and O3 treatment). Pots were fertilized following the commercial management of wheat fields in the area, with 120 kg N ha−1 applied in two doses, on April 14th and 30th. Regarding irrigation, plants were watered manually based on the plant needs at the time (e.g., climatic conditions) to maintain water saturation at field capacity, approximately every two days, until the beginning of grain hardening towards the end of May, at which point watering stopped to allow for grain maturity.

Table 1.
Wheat genotype grown under Mediterranean conditions, Genotype Age, Harvest Date, Growth Habit, Year of Release and References. The dashed line represents pre and post green revolution release dates.
Plant O3 exposure began on April 14th, 77 days after transplant to pot (DaT), when plants were close to the anthesis stage. Fumigation lasted for 51–71 days, depending on the CV, until plants reached full grain maturity and were harvested.
2.6. Physiological and Yield Parameters
Stomatal conductance (gs) measurements were performed using a portable gas exchange system (Li-Cor 6400; Li-Cor, Lincoln, NE, USA) between 9:00–13:00 h GMT from May 4–14 (depending on the cultivar) after 20–30 days of exposure to the different O3-treatments and, therefore, around 100 DaT. Two plants per OTC for two blocks were randomly selected for the measurements, with one flag leaf per plant. The standardized conditions during gas exchange measurements for all the cultivars were: PAR 1000 μmol m2 s−1, RH 55% and a temperature range of 20–22 °C.
Yield, agronomical yield components and nitrogen content parameters were taken at grain maturity from June 3 to June 23 depending on each genotype (Table 1). After harvesting plants from the base, they were divided into straw and spikes, dried at 60 °C for 48 h and weighted to obtain the dry weight of the different plant parts (DW pot−1), totalling 48 pots per CV and 12 pots per CV and O3 treatment. Spikes were manually shelled to calculate the grain yield. Harvest Index (HI) was calculated as the ratio between grain and the total weight of the aerial plant (straw plus grain husks). Individual grain weight was then calculated and further grain nitrogen content analysed as described below. The number of grains per ear was calculated by dividing the total number of grains over the total number of ears for each pot.
2.7. Nitrogen Content and Stable Carbon and Nitrogen Composition
After measuring harvest parameters, the whole grain production from each genotype and OTC was pooled for isotopic analysis (15 samples per genotype and 3 samples per O3 treatment and genotype). Pooled grain per OTC and genotype was ground and analysed for total nitrogen content and 13C/12C and 15N/14N signature using an isotope ratio mass spectrometer (Delta C IRMS, ThermoFinnigan, Bremen, Germany) paired with an elemental analyser (Flash 1112 EA, ThermoFinnigan, Bremen, Germany). One-mg samples of the ground wheat, and reference materials, were weighed, placed in tin capsules, sealed and loaded onto an automatic sampler (ThermoFinnigan, Bremen, Germany) for EA-IRMS analysis. These measurements were carried out at the CCiT (Centres Científics i Tecnológics) at the University of Barcelona. Total nitrogen content was expressed as percentage (%) of dry matter, while the isotope 13C/12C ratio was expressed in δ notation [46]:
where “sample” refers to plant material and “standard” to the international secondary standards of known 13C/12C ratios (IAEA CH7 polyethylene foil, IAEA CH6 sucrose, and USGS 40 L-glutamic acid) calibrated against Vienna Pee Dee Belemnite calcium carbonate (VPDB). Analyses were performed with an analytical precision (SD) of 0.10‰. The 15N/14N ratio is also expressed in δ notation (δ15N); however, using international secondary standards of known 15N/14N ratios (IAEA N1 and IAEA N2 ammonium sulphate and IAEA NO3 potassium nitrate) calibrated against N2 in the air, with an analytical precision of 0.18‰. Nitrogen as a concentration (N%) was converted into Nitrogen Grain Yield (NGY) following the function: NGY = (N% × Grain Yield)/100.
δ13C (‰) = (13C/12C)sample/(13C/12C)standard − 1
2.8. Statistical Analysis
Effects of O3 and genotype age-type factors on the different variables were analysed via two-way analysis of variance (ANOVA) with IBM® SPSS® Statistics 20 (Chicago, IL, USA) using block as a random factor. Significant differences among levels of the factors (p < 0.05) were assessed with the Tukey Honestly Significant Difference test (HSD). The two-way ANOVA data were previously checked to fulfil the ANOVA requirements of normality and homoscedasticity through Shapiro–Wilk and Levene’s tests, respectively, using the SPSS Explore Descriptive Statistics function, with Plots. The same procedure was then followed with a one-way ANOVA analysis of each genotype, using the post-hoc Tukey’s HSD test. The old CV Pane 247 was excluded when the grouped analysis of the modern and old CVs was done, due to its proximity to the landrace group and its behaviour as an outlier within these age-groups.
Pearson correlations between δ13C and δ15N and stomatal conductance and yield parameters were analysed. The significance of the regressions was assessed by p-value (p < 0.05) and the goodness of fit was judged by the determination coefficient (R2).
Finally, a Principal Component Analysis, without rotation and with Keiser Normalization, was performed. The standardized data, excluding Pane 247, were checked for Kaiser–Meyer–Olkin Measure of Sampling Adequacy and Bartlett’s Test of Sphericity for the usefulness of the factor analysis. Then, the components with an Eigenvalue higher than 1 were selected (leading to two components) and verified with the scree plot to check for a clean drop in the Percentage of Variance after PC2. Variables selected for each component presented a Component Matrix value higher than 0.5. This was repeated for the data in general, and then the data were divided by genotype group. The PCA images were acquired with R, version 3.6.3 (29 February 2020) to include the ellipses.
Table 2 summarizes the methodology and instrumentation for each experimental stage.
Table 2.
Summary of the experimental conditions and instrumentation used in the experiment per stage.
3. Results
3.1. Climatic Variables and Ozone Exposure
Figure 2a shows the mean daily O3 profiles for the different O3 treatments during the months of the experiment. Hourly mean FA values ranged between 20–35 nL L−1, well reproducing the natural background levels currently found in the area during the winter and early fall seasons. NFA represents the common chronic high spring-summer levels of rural areas in the Central Iberian Peninsula, with values at the central hours of the day ranging between 50–60 nL L−1. Fumigated treatments (NFA+ and NFA++) increased the maximum hourly values to around 65 and 90 nL L−1, respectively. NFA values increased from April to June, following the O3-seasonal variability in the area, while the NFA+ and NFA++ values in June decreased and even matched NFA, following the fumigation shutdown on June 8th, when the plants were dry and the grain mature. April average values for the fumigated treatments were also lower due to the start of the fumigation on April 14th; before this date plants were grown under O3-ambient levels.
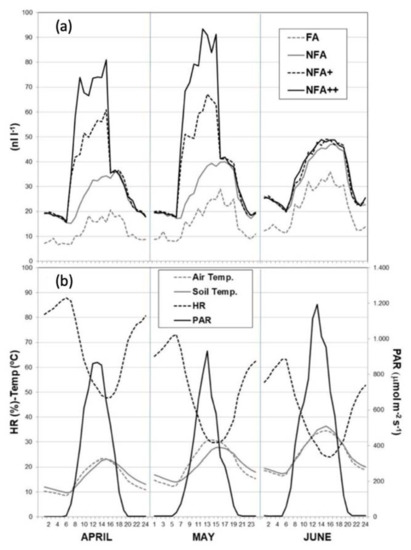
Figure 2.
(a) Mean daily profiles of O3 concentration for the different O3-treatments during the experimental period: FA = charcoal filtered air, NFA = non filtered air, NFA+ = non filtered air supplemented with 20 nL L−1 of O3, NFA++ = non filtered air supplemented with 40 nL L−1 of O3; (b) Mean daily profiles of meteorological parameters during the exposure period inside the OTCs: HR (%,), air and soil temperature (°C) and photosynthetic active radiation (PAR μmol m−2 s−1).
Mean values for the meteorological parameters inside the chambers during the exposure period are represented in Figure 2b. All the parameters followed the seasonal trend of the climatic area at the OTC site. Air and soil temperature increased from April to June, with maximum mean daily values ranging from 22–36 °C for air, as the growth cycle progressed, and 22–34 °C for soil. On the contrary, RH values dropped from 48% to 24% between April and June, reaching the minimum mean daily values at midday (minimum hourly mean values around 24% in June). Photosynthetic active radiation (PAR) also increased throughout the cycle, ranging between 850–1200 μmol m−2 s−1 inside the OTCs, and peaking in June at the end of the experiment.
3.2. Genotype Age-Type Effects
The age-type genotype factor caused clear significant differences in the means of all the parameters assayed: GY and GNY, gs and stable isotopic composition (Table 3, Age-type factor). In general, no significant differences existed between the modern and old CVs, which, in turn, differed from the landraces significantly. More specifically, breeding caused an improvement in the GY of both categories of CVs, which increased by 34% (mean across O3 treatments and cultivars) when compared to the landraces. Regarding HI, it increased by 37% in CVs compared to the landraces. Cultivars exhibited a higher number of grains per ear (by 54%) than the landraces, but at the expense of lower grain size. Thus, single seed size was 14% lower in CVs than landraces; also, breeding caused a decreased straw yield (SY) (38%) and total aboveground biomass (3%) (Appendix A: Table A1).
Table 3.
Ozone and age type effects on yield parameters, gs and isotopic signals: GY, grain yield (g pot−1); HI, Harvest Index; GNY, grain nitrogen yield (g pot−1); gs, stomatal conductance (mmol H2O s−1); δ13C, stable carbon isotope composition (‰) of grains; N, nitrogen concentration (% DW); δ15N, stable nitrogen isotope composition (‰) of grains. FA = charcoal filtered air, NFA = non filtered air, NFA+ = non filtered air supplemented with 20 nl L−1 of O3, NFA++ = non filtered air supplemented with 40 nL L−1 of O3; Mean values ± SE. Different letters indicate statistically significant differences in the mean (p < 0.05).
These improvements on yield parameters, caused by the varietal selection process, have been accompanied by an increment in the gs of the CVs. Post-anthesis measurements of gs were 27% higher in CVs than in landraces.
This same pattern was observed for δ13C, where landraces showed 2.13 ‰ higher (i.e., less negative) values compared with the modern and old CVs. The breeding process decreased grain N concentration by 6%, while enhancing GNY by 32% for the CVs (modern and old) vs. landraces. δ15N signal decreased by 0.96‰ for the cultivars compared with landraces.
3.3. Ozone Effects
Considering the general response across genotypes, O3-exposure affected GY, grain nitrogen yield (GNY) and both isotopic signals (Table 3, Ozone factor). When O3 increased from FA to NFA++, yield parameters decreased: GY by 13% and GNY by 10% (mean values across the three age-type genotypes), with the effect being highly significant for GY (p = 0.003) and a trend near significant (p = 0.062) for GNY. Grain size (p < 0.0001), biomass (p < 0.0001) and Straw Yield SY (also a trend near significant—p = 0.057) also decreased by 11%, 9% and 7%, respectively, when FA increased to NFA++ (Appendix A: Table A1). Neither HI nor number of grains per ear were affected by the pollutant.
The observed δ13C enrichment induced by the pollutant was small; 0.61‰ in NFA++ compared with FA; however, this response was stable and highly significant (p < 0.0001). The significant response of grain δ15N to O3 exposure was not linear: increasing from FA to NFA+ 0.27‰ to then decrease by 0.54‰ from NFA+ to NFA++. Meanwhile, the O3-induced reduction observed for gs was only significant for the CVs.
3.4. Age-Type Genotypes × Ozone Interactions
Modern and old CVs together responded similarly to O3 and contrasted with landraces (Table 3, Age × Ozone). Cultivars subjected to the breeding process, no matter their age, were O3-sensitive. Considering yield parameters, the general response was an O3-induced yield decrease. The percentage of yield loss for the NFA++ treatment compared with FA across CVs were 17% for GY and 11% for GNY. Meanwhile, grain δ13C increased by 0.79‰ (again with a stable and significant response, <0.0001). When only CVs were considered, the O3 effect on gs was also significant (p < 0.05), inducing a strong (37%) reduction in NFA++ treatment when compared to the FA control. Other parameters affected were grain size and biomass, which decreased by 15% and 11%, respectively. The non-linear O3-response pattern observed in the general O3-effect on the grain δ15N signal was softened but maintained within the CVs group: the pollutant first caused an increase from FA to NFA+ by 0.10‰, to then decrease by 0.23‰ from NFA+ to NFA++. CVs also presented a general N% increasing trend of around 7%. Meanwhile, when landraces were analysed alone, they presented no significant response to the O3 exposure to any of the parameters assayed.
Nonetheless, despite their O3-sensitivity, CVs subjected to genetic selection still presented an overall 34% higher GY when compared to Landraces (mean value across cultivars and O3 treatments) and maintained this yield advantage under the highest O3 treatment (26% higher). This breeding improvement under NFA++ exposure also persists when other parameters are considered, such as GNY (30% higher), HI (34% higher) and grain δ13C (1.48‰ lower; 6% more negative); or other parameters, such as seed size (25% lower), number of grains per ear (54% higher), SY (41% lower) and total biomass (8% lower) (Table A1). On the contrary, for gs and nitrogen, the pollutant outweighed the benefits of varietal selection and values between CVs and landraces under NFA++ were similar (without significant differences). For grain δ15N, the increased discrimination by breeding also remained even when exposed to the highest O3 treatment, with CVs values 0.52‰ lower than Landraces.
Intra-variability in the O3-responses within each of the three age categories of genotypes was lower for the δ13C measurements (Figure 3a) than for the gs measurements (Figure 3b). However, some genotypes differed from the average response of their own group. All of the δ13C values for the modern and old CVs, except for Marius, showed a significant response to increasing O3 levels; however, some exhibited a more sensitive response: Berdún, Califa Sur, Arthur Nick and Ablaca suffered the most intense effect under the NFA++ treatment, with increases ranging between 0.87–1.04‰, while Califa Sur, Yecora and Pane 247 were also significantly affected by the lower O3-exposure of the NFA+ treatment (increments from 0.43–0.81‰). This was followed by Pane 247, Yecora and Nogal, which, although less O3-sensitive, had a corresponding increased δ13C signal ranging from 0.56–0.69‰ under NFA++. In contrast, none of the landraces showed significant changes.
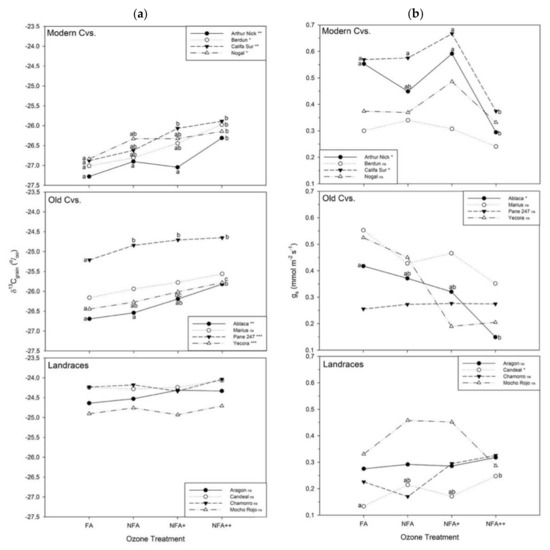
Figure 3.
(a) Stable carbon isotope composition (δ13C; ‰) of mature grains and (b) stomatal conductance (mmol H2O m−2 s−1) for the different O3 treatments: FA = charcoal filtered air, NFA = non filtered air, NFA+ = non filtered air supplemented with 20 nL L−1 of O3, NFA++ = non filtered air supplemented with 40 nL L−1 of O3. Different letters indicate statistically significant differences (*** p < 0.001, ** p < 0.01, p < 0.05, ns: non-significant) between O3 levels for each cultivar under Tukey analysis.
When gs was considered, Califa Sur, Arthur Nick and Ablaca can be considered as the most sensitive; O3 induced a gs decrease in the range 34–64% for these CVs (Figure 2). The other δ13C-affected CVs presented a non-significant gs-reduction pattern. A more surprising behaviour was observed in the landrace group for Candeal de Vellisca, whose gs strongly increased (by 85%) from FA until NFA++.
The same individual analysis per cultivar was done for grain δ15N (Figure 4a) and nitrogen concentration (Figure 4b). Individual patterns of the modern and old CVs showed the overall average trend of the CVs group: grain δ15N presented an increase in NFA+ and a subsequent drop by NFA++. Marius had the only significant differences in O3, decreasing from NFA to NFA++ by 0.56‰. Landraces showed a higher variability, and clear amplification of the quadratic response, especially for Chamorro and Candeal de Vellisca; meanwhile, Mocho Rojo presented a decreasing trend. Regarding grain N values (Figure 4b), increases were significant for Arthur Nick and Yecora; Aragon showed an increase until NFA+ but then decreased by NFA++.
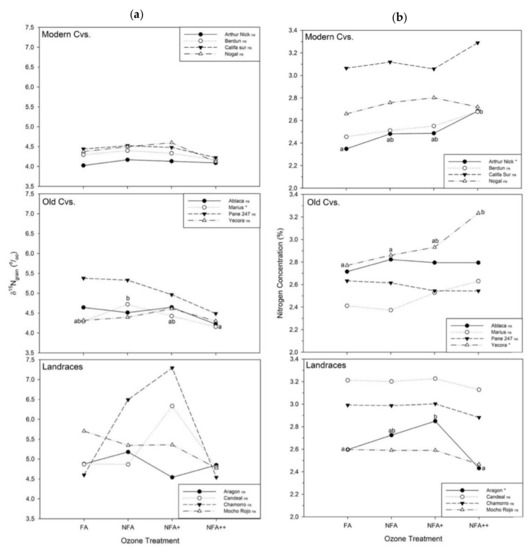
Figure 4.
(a) δ 15Ngrain stable nitrogen isotope composition (‰) and (b) nitrogen concentration (N, % DW) for the different O-treatments: FA = charcoal filtered air, NFA = non filtered air, NFA+ = non filtered air supplemented with 20 nL L−1 of O3, NFA++ = non filtered air supplemented with 40 nL L−1 of O3. Different letters indicate statistically significant differences (* p < 0.05, ns: non-significant) between O3 levels for each cultivar under Tukey analysis.
3.5. Yield and Isotopic Signals Correlations
Following the different O3-sensitivities of the age-type genotypes, grain δ13C of modern and old CVs together showed highly significant (p < 0.001) negative correlations with GY (R2 = 0.60), GNY (R2 = 0.35), total plant biomass (R2 = 0.3) and significant (p < 0.05) negative correlations with HI (R2 = 0.18) and gs (R2 = 0.16) across O3 levels (Table 4).
Table 4.
Regression analysis for grain δ13C (‰) with the assayed yield parameters and gs: GY, grain yield (g pot−1); Total Biomass (straw yield plus ear and grain, g pot−1); HI, Harvest Index; SY, straw yield (g pot−1); Single sw, single seed weight (mg); GNY, grain N yield (g N pot−1); N%, N concentration (% DW); gs, stomatal conductance (mmol H2O m−2 s−1); grain δ15N (‰). *** Correlation significant at p ≤ 0.001, ** p ≤ 0.01 or * p ≤ 0.05. Pane 247—Old CV, not included.
Meanwhile, landraces did not present a significant correlation for δ13C against total biomass or GNY, but a significant (p < 0.05) negative correlation with GY (R2 = 0.27) and highly significant correlation (p < 0.01) with gs (R2 = 0.44). All δ15N and gs correlations for Modern & Old CVs and Landraces were non-significant.
Regarding other traits, the correlation between grain δ13C and HI, though still negative, was stronger for landraces (R2 = 0.44) than for modern and old CVs (p < 0.01; R2 = 0.18); SY, single seed weight (p < 0.05) and grain nitrogen (p < 0.01) only showed correlations under the landraces but not for the CVs, with R2 values of 0.29, 0.24 and 0.52, respectively.
Regression functions for δ13C with total biomass, GY, GNY and gs are shown in Figure 5 specifying the different O3 treatments with different symbols. It can be observed that the higher O3 treatments also presented the lowest δ13C, with some exceptions such as for the tolerant CV Pane 247, which behaves closer to landraces and has not been included in the analysis. No significant correlations were found between grain δ13C and δ15N, or between grain δ15N or gs with any of the assayed parameters for both the CVs and landrace groups.
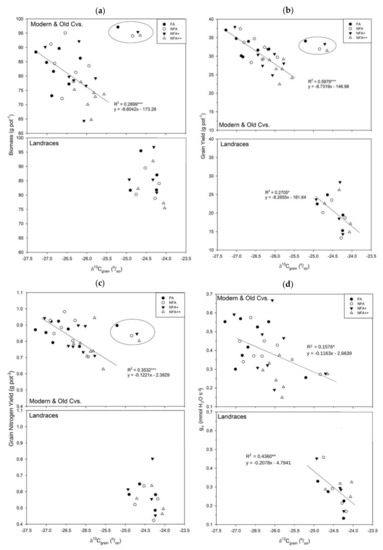
Figure 5.
Regression of δ13C (‰) with: (a) GY (Grain Yield, g pot−1), (b) GNY (Grain N Yield, g pot−1), (c) total biomass (g pot−1) and (d) gs (mmol H2O m−2 s−1) for the different O3-treatments: FA = charcoal filtered air, NFA = non-filtered air, NFA+ = non-filtered air supplemented with 20 nL L−1 of O3, NFA++ = non filtered air supplemented with 40 nL L−1 of O3. Circle encloses Pane 247—Old CV, not included in correlation analyses. *** significant at p ≤ 0.001, ** p ≤ 0.01 or * p ≤ 0.05.
3.6. Principal Component Analysis
The Kaiser–Meyer–Olkin Measure of Sampling Adequacy and Bartlett’s Test of Sphericity deemed the data for each of the three groups of genotypes (general), the modern and old CVs together and the landraces alone as useful for factor analysis (Figure 6a). As harvest index and biomass already correlated strongly with GY and SY, respectively, they were removed to avoid redundancies. Nitrogen concentration was also removed as it had a component matrix under 0.5.
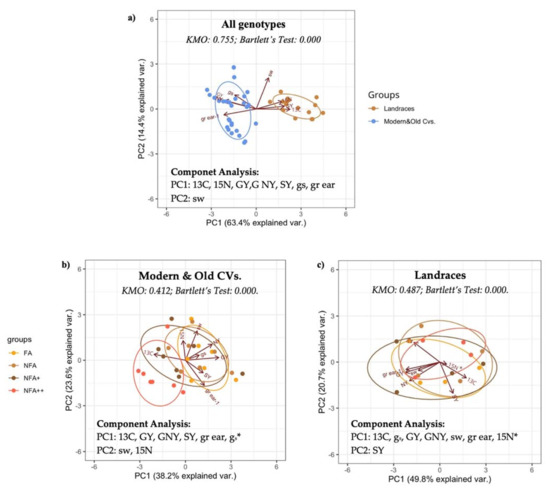
Figure 6.
Principal Component Analysis for: (a) each age-type genotype based on standardized values of 13C, δ13Cgrain (‰); 15N, δ15Ngrain (‰); GY, grain yield (g pot−1); GNY, grain N yield (g N pot−1); SY, straw yield (g pot−1); sw, single seed weight (mg); gs, stomatal conductance (mmol H2O m−2 s−1); and gr ear−1, grains per ear, for eleven (exc. Pane 247) Mediterranean wheat genotypes, (b) Modern & Old CVs and (c) Landraces separated by ozone treatment. * Low Component Matrix value.
On the general biplot (Figure 6a), both components explained 77.8% of the total variance. Strong differences can be seen between the different age-type genotypes as shown by the separate ellipses. GY, GNY and number of grains per ear were associated positively with gs, and negatively with grain δ13C, grain δ15N, single seed weight and SY. The ellipse embracing the CVs is associated with higher yields, and, to a lower extent, a higher gs, while the ellipse embracing the landraces is associated with a higher SY and higher grain δ13C values. Seed weight does not seem to be generally associated with the other variables, only slightly positively with δ13C and SY.
When the response to O3 was considered in the PCA analysis (Figure 6b), modern and old CVs differed from landraces. Landraces showed a great overlap of the ellipses of the different O3 treatments, while modern and old CVs together show a deviation under the NFA++ treatment. For the modern and old CVs together, both components explained 61.8% of the total variance. PC1 showed negative associations between grain δ13C, and GY, GNY, SY and number of grains per ear, whereas grain δ13C was positively associated with increasing ozone concentrations. In PC2, grain δ15N and single seed weight do not seem to be associated with the latter, but correlate positively to each other, though with a short grain δ15N vector.
In the landraces, the two components explained 70.5% of the variance. The PC distribution here mirrors the distribution seen in the general analysis, though SY is less correlated to all the other variables, and seed weight is negatively correlated to the isotopic signals.
For both groups of age-type genotypes, the grain δ15N component matrix values were extremely low, lying almost directly on the component 2 axis and following the lack of correlations seen before.
4. Discussion
Spain has the largest surface dedicated to cereal production in the Mediterranean basin [56]. This mainly rainfed, drought-adapted wheat is located in the middle of the Iberian peninsula, where the recorded O3 values chronically remain high above the protection thresholds for crops and vegetation defined by the European Directive of Air Quality (2008/50/CE) [57]. As hourly O3 frequently reaches and exceeds 60 nL L−1 during early spring [58], which coincides with the non-water limitation period in the area, it allows for maximum physiological activity and gas exchange in the crop and thus, for maximum O3 absorption [17,26], increasing the O3-risk for the wheat despite the characteristic water-deficit later in the season.
During the experiment, the FA O3 values, in the range 20–30 nL L−1, well reproduced the natural background levels currently found in the area during the winter and early fall seasons, which are considered as natural O3 background levels for pre-industrial times [59]; thus, this treatment can be referred to as an adequate control treatment. The NFA treatment represented the daily and seasonal pattern and levels currently registered in the rural areas of the central Iberian Peninsula during spring and summer. It increases from early April until the end of the wheat season, and spans no longer than June, reaching values around 55 nL L−1 at the central hours of the day. Similarly, the O3 levels in the fumigated treatments, NFA and NFA++, reached maximum hourly values of around 90 nL L−1 in May, reproducing the maximum hourly values sporadically achieved during the high O3 episodes in the area [57]. Therefore, the experiment could be considered to adequately represent the poor air quality conditions under which rainfed cereals are growing in the area, and to represent the situation in the Mediterranean basin [60]. This chronic O3-pollution is enough to experimentally induce negative effects on crops such as tomato [61], leafy crops [62], watermelon [63] or durum wheat [36]. The latter is more O3-tolerant than the spring bread wheat assayed in this study [64]; in fact, bread wheat is currently considered the most economically important sensitive crop and is used as a reference crop for O3 risk assessment [9]. Air meteorological conditions during the experiment also resembled the characteristic spring-summer conditions of the Mediterranean wheat fields, with temperatures increasing during the season and reaching maximum monthly mean values of around 35 °C at the central hours of the day in June, towards the end of the assay, along with the lowest HR value of around 25%.
Results showed strong differences between age-type genotypes, where breeding improved both yield and yield components; for CVs, these effects were strongly related to a decreased carbon isotope composition and an increase in gs. Landraces and CVs differed significantly; however, old and modern CVs behaved similarly. These results follow previous works performed under field conditions [30], which compared 12 Spanish varieties of soft and durum wheat under different tillage, also considering the age-type factor. Here, landraces had the lowest GY and behaved rather steadily throughout the trial seasons, while CVs presented a higher yield but depended more on the environmental conditions of the year and their independent growth habit. Winter genotypes, such as Marius, presented a higher GY in the humid years, and spring genotypes such as Califa Sur and Yecora performed comparatively better in the dry years. In the present study, no differences were seen due to growth habit since water availability was not a limiting condition in the experimental design and the date of sowing and transplantation was homogenized for all genotypes; however, CVs presented a 34% higher GY than landraces (across all O3 treatments), which is similar to the 32% observed in Ruiz et al., 2019 [30] across seasons. Nonetheless, differences were seen between genotypes released pre- and post-green revolution (Table 1), particularly displaying the different behaviour Pane-247 had from the other CVs due to its pre-green revolution release. In this experiment, its very high δ13C and low gs fit much better within the landraces group, which was also released pre-green revolution, causing its removal when all genotypes were joined to analyse the general O3 response. Actually, strong increases in GY and HI characterized the green revolution; however, further increases in these traits during the following six decades have been comparatively lower, explaining the lack of clear differences between old and modern CVs.
Achieving a higher GY in modern and old CVs was possibly not only due to a higher HI, but also a higher gs, which favoured photosynthetic activity and caused the more negative δ13C values in the newer genotypes [31,42,65]. Therefore, when compared to the landraces, the higher gs of the post-green revolution cultivars (Table 1) allowed for increased discrimination, favouring the lighter 12C isotope and diminishing the δ13C by 2.13‰. A decrease in the δ13C (or increase in Δ13C) has been reported before for Spanish and Italian modern durum wheat cultivars when compared with old cultivars and landraces [42,65], where the difference in δ13C between some modern genotypes and landraces from the Iberian Peninsula was around 1.2‰.
However, it should be noted that the higher δ13C values seen in the landraces could also be influenced by their longer phenology when compared with the CVs, which exposes them to a more severe terminal (i.e., during grain filling) stress, even under irrigated conditions. The higher gs observed in the more modern genotypes might seem contradictory for the adaptation process required for the characteristic water limited conditions of Mediterranean rainfed wheat; however, an increase in transpiration would not only aid photosynthesis, but would also limit leaf temperature, which is another important stress that affects plant physiological activity in hot and dry areas [66].
The effect of breeding on increasing δ15N and GNY would be associated with the higher assimilation of the more modern varieties, while the observed reduction in grain N% would be related to a grain dilution effect, providing N availability is constant for the plant [28]. In essence, as GY increases with breeding, N% is diluted in the grain when paired with a constant N availability.
The PCA for the combined modern plus old CVs group and the landraces group (Figure 6a) reinforced the aforementioned two very different behaviours. The PCA pattern of the analysed parameters, except for seed weight, which did not correlate well with the others, showed the expected behaviours for the two age-groups, where the yield increase (GY and GNY) linked to breeding selection was positively associated with gs, and negatively associated with the isotopic δ13C and δ15N signals and SY. This behaviour is opposite to that of the landraces.
In terms of O3-response, the effect was age-type dependent; while modern and old CVs presented an O3-induced reduction in yield parameters and gs, as well as an alteration of both isotopic signals (less negative δ13C and lower δ15N), landraces were not affected by O3 exposure, even under the highest levels of the NFA++ treatment. The similarity in the O3 response of the post-green revolution CVs (modern and old CVs without Pane 247 as shown in Table 1) was striking and allowed them to be analysed jointly. Exposure to O3 induced high yield losses, 17% and 11 % for GY and GNY, respectively, as an average value across CVs in the NFA++ treatment. A meta-analysis derived by Feng et al., 2008 [67], considering more than 50 studies, obtained mean GY losses of 29% in modern wheat varieties for O3-exposures based on Accumulated Ozone Exposure (AOT) functions that were slightly higher than the present NFA++ treatment. Meanwhile, in a review for Europe-level O3 effects, similar O3 exposures between 80–100 ppb produced yield reductions that rounded 30% [68]. Compared with these results, the Spanish CVs seem to lie within the O3-sensitivity range observed for modern wheat CVs from other agronomic regions and for Central and North European levels, which do not have the characteristic water limitation of the Mediterranean region.
The O3 effects on yield parameters of the sensitive CVs paralleled those of the gs reduction. The greater sensitivity of modern CVs, compared to traditional genotypes not subjected to a programmed selection process, has been observed in previous works on wheat [28,32]. All of them showed smaller O3-effects on the lower yielding old cultivars, and associated breeding selection for higher yield with an increased gas exchange via higher gs, which led to an unintentional greater O3 absorption and damage. Other studies have defined some of the O3-damage mechanisms that affect modern varieties, which relate the O3 induced lower photosynthetic rates to non-stomatal factors, such as a decreased carboxylation or electronic transport and lower capability of the antioxidative system [69].
Previous studies have concluded that, for wheat, the most O3-sensitive period is anthesis, as O3-effects on previous stages were not statistically significant [37]. Therefore, the present experiment was designed to start fumigation after spike emergence, close to anthesis. Accordingly, the overall negative O3-effects were detected more in grain parameters than in biomass parameters, which follow the observed decrease in HI induced by the pollutant. The GY reduction was caused mainly by smaller grains while maintaining the number of grains per ear, also following results found in previous studies [68].
While this experiment followed many of the yield related O3-effects seen in previous studies, few studies have delved into the effects O3 has on the isotopic signature of wheat [25,40], and none have sought this for Mediterranean wheat. In experimental assays, gas exchange and carbon fixation factors affected by O3 are often measured sporadically, and the results are extrapolated to the entire exposure period; even though these parameters usually present daily and seasonal patterns depending on the plant development stage [28], which might lead to a misinterpretation of the O3 response. As δ13C in plant dry matter depends on both stomata and Rubisco carboxylation [46], if the stomata close or their conductance decreases due to any stress, such as high O3, stomatal discrimination decreases, restricting the CO2 supply to the carboxylation sites and overall increasing δ13C (or decreasing Δ13C) [39,40]. The integrated effect on the physiological activity of the plant throughout its lifespan, for whichever metabolic route the pollutant has affected, can be assessed by considering the isotopic parameters [43].
Results of the present work confirm the starting hypothesis that the δ13C of mature grains becomes less negative (increases) under O3 stress for O3-sensitive CVs, due to the gs reduction induced by the pollutant, which both decreases the capacity of the plant for carbon discrimination and negatively affects photosynthesis, decreasing GY. On the contrary, the landraces O3-tolerance correlates with the non-effect seen in δ13C of mature grains, along with a decrease in gs and yield parameters. This also follows the postulate that, under stress conditions, cultivars use their current photosynthetic activities to produce carbohydrates for grain filling, while landraces rely more on storing carbohydrates in the stem to then redistribute them to the grain [28,29]. This could suggest that if the landraces had been exposed to ozone earlier, when they were storing carbohydrates in the stem, they could have shown a more sensitive behavior in their GY, which could be analyzed with an experiment with chronic ozone exposure beginning before anthesis.
Both the regression functions and the PCA analysis pointed to these results. It should be noted that a negative correlation between δ13C of mature grains and gs was observed within CVs and landraces; however, for the latter there was no direct relationship with the pollutant. The observed results of the PCA for each of the O3 treatments (Figure 6b) reiterate the commented O3-tolerance of the landraces, and the sensitivity of the modern and old CVs, particularly under the NFA++ treatment related to the decreased gs, and hence, in 13C discrimination (and thus higher δ13C), and lower GY, GNY, SY and number of grains per ear. Meanwhile, for both CVs and landraces, this effect is not shown in single seed weight, nor grain δ15N, most possibly due to its more complex isotopic fractionation processes [47].
The general response pattern of the grain N concentration, which increases under increasing O3 levels, was more evident under the sensitive CVs, presenting a 7% increase due to the pollutant. This aligned with previous studies that analysed wheat grown under O3 stress [28,70], and has also been seen with drought [71]. As senescence is accelerated by O3-stress, it would favour N translocation to the reproductive parts, enriching the grain more with protein than starch [72]; moreover, as the individual grain becomes smaller, it further increases the concentration [19]; however, when coupled with a decreasing GY, it actually leads to an overall decrease in GNY.
In general, previous studies on wheat indicate that when there is a positive O3-effect on N grain concentration, there is an approximately equally negative effect on the yield [73]. Therefore, even though grain quality improves, the amount of protein accumulated per unit area, related to GNY, decreases, which can lead to food security and economic problems. In the present study, the effect on GNY was softer than the one observed in yield loss, with a GNY reduction of 11% compared to the 17% found for GY. This could be because O3 exposure began close to anthesis, and even though this period is the most O3-sensitive for wheat [37], it does not match the main period for N absorption, which usually decreases greatly after anthesis and during grain filling [50]. At anthesis, wheat focuses more on N redistribution from the vegetative tissues (e.g., flag leaf) for grain filling [47]. Therefore, a reason for a lack of stronger differences regarding the N-related parameters could be because N uptake from the soil had greatly decreased before the O3 treatment began. Nonetheless, the landraces are characterized by a later phenology, in the sense that heading and anthesis occur later than in CVs; however, in the present study, all the genotypes were homogenized for growing so differences caused by their growth habit would not apply here.
As landraces rely more on ears, which are generally less affected by stress, and on protein degradation from other plant organs during grain filling stages [49,74], the O3- effect on assimilation and redistribution could be particularly detrimental to the sensitive CVs when under stress; since they rely more on the flag leaf for N translocation for grain filling which senesces faster under O3 exposure. At the same time, as active nutrient uptake by the roots occurs at early spring, future experiments designed to begin O3 fumigation at the pre-anthesis stage are needed to take O3 effects on N into consideration, especially for rainfed wheat.
Concerning the δ15N of mature grains, as the plants were grown in pots with artificial substrate and had the same N fertilizer source (with a given δ15N), the starting pattern of assimilation and further fractionation is expected to be very similar for all the plants. δ15N values are largely driven by nitrogen metabolism, including nitrogen assimilation, recycling and redistribution [38,47,48,49]. When N moves from one organ to another, the δ15N signal in the organ increases as it builds up moving upwards towards the grain [47]. Therefore, alterations in plant metabolism and growth can modify δ15N. However, in our study, the assimilated N was accumulated in the flag leaf before the O3 fumigation treatment began [49]. Due to the low levels of N absorption after anthesis [73], this suggests that only processes related to the N translocation from the leaves to the grains during grain filling were responsible for the effect of O3 on δ15N, relating the O3 response of the N parameters, such as δ15N, more with N redistribution.
The general response of δ15N of the grain to the pollutant followed a non-linear pattern, upon which it increased from the control to the NFA+ treatment, to then being decreased by NFA++. Here, the effect of O3 on δ15N of grains was significantly driven by the CVs as opposed to the landraces and could again be related to the higher O3-sensitivity of the CVs as well as on their dependence on N redistribution from organs that are highly affected by O3, such as the flag leaf. Meanwhile, as mentioned, N redistribution from the ears, which is more associated to landraces, works well both with and without stress [49], giving landraces an advantage in redistribution under O3-stress. The negative correlation between δ15N and GY has been observed before [42], although it was not significant in the present assay. An alternative explanation for the decrease in δ15N of the CVs as a response to the more severe O3 treatment might be related to the decrease in gs, which would limit volatilization of the lighter 14N isotope with relation to the heavier 15N [47,49,75], in turn leading to a lower δ15N of mature grains.
It should also be noted that the landraces displayed a large heterogeneity in the δ15N signal compared to the CVs, which could be due to their higher genetic variability [76] coupled with the aforementioned N redistribution from the ears and protein degradation of other plant parts [49]. The importance of the N redistribution mechanisms in the grain N should be considered for future plant breeding programs.
5. Conclusions
Modern and old CVs behaved very similarly under O3 exposure, showing a high O3-sensitivity based on the significant impacts seen on yield parameters, such as GY or GNY, and biomass, and, accordingly, on gs and δ13C and δ15N values. On the contrary, landraces showed a stable and tolerant behaviour under the increasing O3 exposures.
A different behavior was found between genotypes depending on their release date, where pre-green revolution genotypes presented very high δ13C and low gs.
δ13C grain correlated strongly with both stomatal conductance and yield factors such as GY, GNY or total biomass; therefore, δ13Cgrain, which can congregate all the intrinsic mechanisms by which the plant reacts to chronic O3 exposure, and which hinder its yield, could be used as a good indicator of the cumulative effects of O3 at the end of the wheat plant lifespan. Moreover, δ13C values presented a more homogeneous response within each age-type group than other physiological response parameters such as gs, backing its potential use as an indicator for accumulated O3 effects.
Since the O3 exposure period started post-anthesis, δ15Ngrain response was more indicative of alterations caused by the pollutant on N redistribution and N volatilization, and requires a more integrated future analysis due to its dependence on other N-related factors, such as absorption, metabolism and redistribution.
In the present study, the benefits of modern breeding through varietal selection mostly counterbalanced the negative O3 effects on the modern and old CVs; however, the strong differences found in O3-sensitivity between CVs and landraces indicate that there is still a broad genetic base for improving O3-tolerance to enhance productivity and profits in Mediterranean agriculture, and to better adapt Mediterranean wheat to global change factors such as chronic high O3 levels.
Author Contributions
Conceptualization, M.C.-E., I.G.-F., J.L.A. and V.B.-B.; Data Curation, M.C.-E., R.A., I.G.-F. and V.B.-B.; Formal Analysis, M.C.-E.; Funding Acquisition, M.C.-E., J.L.A. and V.B.-B.; Investigation, M.C.-E., I.G.-F., R.A. and V.B.-B.; Methodology, M.C.-E., I.G.-F. and V.B.-B.; Project Administration, I.G.-F. and V.B.-B.; Resources, J.L.A. and V.B.-B.; Supervision, J.L.A. and V.B.-B.; Validation, M.C.-E. and V.B.-B.; Visualization, M.C.-E. and V.B.-B.; Writing—Original Draft, M.C.-E.; Writing—Review & Editing, M.C-.E., J.L.A. and V.B.-B. All authors have read and agreed to the published version of the manuscript.
Funding
Funding was provided by Comunidad de Madrid (Spain) projects AGRISOST-CM (S2018/BAA-4330) and Grupo Operativo OZOCAM (PDR Comunidad de Madrid 2014-2020m MAPAMA/FEADER) and the EU project ERANET/SUSCROP SUSCAP (PCI2019–103521/AEI). M.C-E. and J.L.A. acknowledge the support from PID2019-106650RB-C21, from MICIN, Spain. J.L.A. thanks the support from the ICREA Academia program, Generalitat de Catalunya, (Spain). Finally, the isotopic analyses were supported, in part, by the l’Institut de Recerca de l’Aigua (IdRA) of the University of Barcelona.
Institutional Review Board Statement
Not applicable.
Informed Consent Statement
Not applicable.
Data Availability Statement
Information for the cultivars mentioned in Table 1 can be found at https://genvce.org/productos/fichas/ (accessed on 4 July 2021).
Acknowledgments
The OTC experimental facility located at La Higueruela Research Farm is supported by an agreement between MNCN (CSIC) and CIEMAT. The farm personnel, and especially the valuable work of Jose María Gómez Camacho on plant care and OTC facility maintenance are greatly acknowledged. Thanks are given to S. Elvira, H. Calvete and J. Sanz for their help on the fieldwork.
Conflicts of Interest
The authors declare no conflict of interest.
Appendix A
Table A1.
Ozone and age type effects on yield parameters: SY, straw yield (g pot−1); Single sw., single seed weight (mg); # grains ear−1, number of grains per ear per pot; Biomass, added value of the straw yield and the ears with grains (g pot−1). FA= charcoal filtered air, NFA = non filtered air, NFA+ = non filtered air supplemented with 20 nL L−1 of O3, NFA++ = non filtered air supplemented with 40 nl L−1 of O3; Mean values ± SE. Different letters indicate statistically significant differences (p < 0.05).
| SY (g) | Single sw. (mg) | # Grains Ear−1 | Biomass (g) | ||
|---|---|---|---|---|---|
| Age Type | |||||
| Modern CVs. | 33.61 a ± 0.66 | 31.57 a ± 0.66 | 44.18 c ± 1.07 | 78.42 a ± 1.24 | |
| Old CVs. | 37.77 b ± 1.08 | 38.08 b ± 0.90 | 36.66 b ± 1.08 | 85.16 b ± 1.40 | |
| Landraces | 49.22 c ± 0.63 | 39.61 b ± 0.33 | 18.61 a ± 0.93 | 84.61 b ± 1.05 | |
| p-value | <0.0001 | <0.0001 | <0.0001 | <0.0001 | |
| Ozone | |||||
| FA | 40.94 ± 1.49 | 37.85 b ± 0.93 | 33.55 ± 2.18 | 85.36 b ± 1.31 | |
| NFA | 40.97 ± 1.34 | 37.18 b ± 0.83 | 32.98 ± 2.19 | 84.38 b ± 1.27 | |
| NFA+ | 40.96 ± 1.56 | 36.95 b ± 0.90 | 33.25 ± 2.14 | 83.74 b ± 1.61 | |
| NFA++ | 37.93 ± 1.38 | 33.69 a ± 1.06 | 32.81 ± 2.15 | 77.44 a ± 1.52 | |
| p-value | 0.057 | <0.0001 | 0.975 | <0.0001 | |
| Age × Ozone | |||||
| Cultivars * | FA | 36.18 ± 1.26 | 36.71 b ± 1.33 | 41.18 ± 1.64 | 84.79 b ± 1.67 |
| NFA | 36.80 ± 1.22 | 36.02 b ± 1.13 | 40.76 ± 1.57 | 84.99 b ± 1.66 | |
| NFA+ | 36.41 ± 1.58 | 35.47 ab ± 1.22 | 39.76 ± 1.85 | 82.04 ab ± 2.14 | |
| NFA++ | 33.38 ± 1.19 | 31.10 a ± 1.25 | 39.96 ± 1.79 | 75.34 a ± 1.89 | |
| p-value (CVs) | 0.248 | 0.008 | 0.929 | 0.001 | |
| Landraces | FA | 50.45 ± 1.51 | 40.13 ± 0.48 | 18.31 ± 1.56 | 86.50 ± 2.13 |
| NFA | 49.32 ± 1.17 | 39.52 ± 0.73 | 17.41 ± 1.57 | 83.15 ± 1.93 | |
| NFA+ | 50.06 ± 1.25 | 39.90 ± 0.61 | 20.23 ± 2.56 | 87.13 ± 1.98 | |
| NFA++ | 47.04 ± 0.94 | 38.87± 0.79 | 18.51 ± 1.75 | 81.66 ± 2.17 | |
| p-value (Land.) | 0.219 | 0.558 | 0.764 | 0.193 | |
| p-value (Age × O3) | 0.946 | 0.289 | 0.767 | 0.218 | |
* Cultivars, grouped Modern & Old CVs due to their very similar behavior. Bold highlights statistical significant differences.
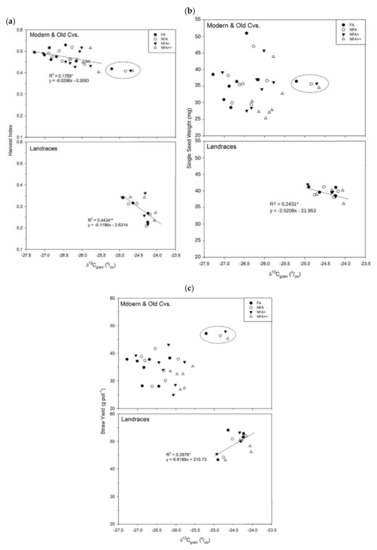
Figure A1.
Regression functions of δ13C (stable C isotope composition, ‰) with: (a) Harvest Index, (b) Single seed weight (mg) and (c) Straw yield (g pot−1) for the different O3-treatments: FA= charcoal filtered air, NFA = non-filtered air, NFA+ = non-filtered air supplemented with 20 nL L−1 of O3, NFA++ = non filtered air supplemented with 40 nL L−1 of O3. Circle encloses Pane 247—Old CV, not considered for correlation analyses. Correlation is significant at ** p ≤ 0.01 or * p ≤ 0.05.
References
- Monks, P.S.; Archibald, A.T.; Colette, A.; Cooper, O.; Coyle, M.; Derwent, R.; Fowler, D.; Granier, C. Tropospheric ozone and its precursors from the urban to the global scale from air quality to short-lived climate forcer. Atmos. Chem. Phys. 2015, 15, 8889–8973. [Google Scholar] [CrossRef] [Green Version]
- European Environment Agency. The European environment—State and Outlook 2020: Knowledge for Transition to a Sustainable Europe; European Environment Agency: Copenhagen, Denmark, 2019. Available online: https://www.eea.europa.eu/publications/soer-2020 (accessed on 4 July 2021). [CrossRef]
- Harmens, H.; Hayes, F.; Mills, G.; Sharps, K.; Osborne, S.; Pleijel, H. Wheat yield responses to stomatal uptake of ozone: Peak vs rising background ozone conditions. Atmos. Environ. 2018, 173, 1–5. [Google Scholar] [CrossRef] [Green Version]
- Cooper, O.R.; Parrish, D.D.; Ziemke, J.; Balashov, N.V.; Cupeiro, M.; Galbally, I.E.; Gilge, S.; Horowitz, L.; Jensen, N.R.; Lamarque, J.-F.; et al. Global distribution and trends of tropospheric ozone: An observation-based review. Elem. Sci. Anthr. 2014, 2, 000029. [Google Scholar] [CrossRef]
- European Environment Agency. Exposure of Europe’s Ecosystems to Ozone-Figure 1; European Environment Agency: Copenhagen, Denmark, 2020. Available online: http://www.eea.europa.eu/data-and-maps/indicators/exposure-of-ecosystems-to-acidification-2/exposure-of-ecosystems-to-acidification-1 (accessed on 4 July 2021).
- Tai, A.P.K.; Martin, M.V.; Heald, C.L. Threat to future global food security from climate change and ozone air pollution. Nat. Clim. Chang. 2014, 4, 817–821. [Google Scholar] [CrossRef] [Green Version]
- European Environment Agency. Air Quality Statistics; European Environment Agency: Copenhagen, Denmark, 2018.
- European Environment Agency. Annual Report on EU Emissions Inventory under the Convention of Long-Range Transboundary Air Pollution (LRTAP); European Environment Agency: Copenhagen, Denmark, 2020. Available online: https://op.europa.eu/en/publication-detail/-/publication/cc5ccc82-dc41-11ea-adf7-01aa75ed71a1/language-en (accessed on 4 July 2021).
- LRTAP Convention. Mapping Critical Levels for Vegetation, Revised Chapter III of the Manual on Methodologies and Criteria for Modelling and Mapping Critical Loads and Levels and Air Pollution Effects, Risks and Trends. Conv. Long Range Transbound. Air Pollut. 2017, 3, 9. [Google Scholar]
- Giorgi, F.; Lionello, P. Climate change projections for the Mediterranean region. Glob. Planet. Change 2008, 63, 90–104. [Google Scholar] [CrossRef]
- Paeth, H.; Vogt, G.; Paxian, A.; Hertig, E.; Seubert, S.; Jacobeit, J. Quantifying the evidence of climate change in the light of uncertainty exemplified by the Mediterranean hot spot region. Glob. Planet. Change 2017, 151, 144–151. [Google Scholar] [CrossRef]
- Lefohn, A.S.; Malley, C.S.; Smith, L.; Wells, B.; Hazucha, M.; Simon, H.; Naik, V.; Mills, G.; Schultz, M.G.; Paoletti, E.; et al. Tropospheric ozone assessment report: Global ozone metrics for climate change, human health, and crop/ecosystem research. Elementa 2018, 6, 27. [Google Scholar] [CrossRef] [Green Version]
- Teixeira, E.; Fischer, G.; van Velthuizen, H.; van Dingenen, R.; Dentener, F.; Mills, G.; Walter, C.; Ewert, F. Limited potential of crop management for mitigating surface ozone impacts on global food supply. Atmos. Environ. 2011, 45, 2569–2576. [Google Scholar] [CrossRef]
- Hoshika, Y.; Katata, G.; Deushi, M.; Watanabe, M.; Koike, T.; Paoletti, E. Ozone-induced stomatal sluggishness changes carbon and water balance of temperate deciduous forests. Sci. Rep. 2015, 5, 1–6. [Google Scholar] [CrossRef]
- Pandey, A.K.; Ghosh, A.; Agrawal, M.; Agrawal, S.B. Ecotoxicology and Environmental Safety E ff ect of elevated ozone and varying levels of soil nitrogen in two wheat (Triticum aestivum L.) cultivars: Growth, gas-exchange, antioxidant status, grain yield and quality. Ecotoxicol. Environ. Saf. 2018, 158, 59–68. [Google Scholar] [CrossRef]
- Gillespie, K.M.; Xu, F.; Richter, K.T.; Mcgrath, J.M.; Markelz, R.J.C.; Ort, D.R.; Leakey, A.D.B.; Ainsworth, E.A. Greater antioxidant and respiratory metabolism in field-grown soybean exposed to elevated O3 under both ambient and elevated CO2. Plant Cell Environ. 2012, 35, 169–184. [Google Scholar] [CrossRef]
- Emberson, L.D.; Pleijel, H.; Ainsworth, E.A.; van den Berg, M.; Ren, W.; Osborne, S.; Mills, G.; Pandey, D.; Dentener, F.; Büker, P.; et al. Ozone effects on crops and consideration in crop models. Eur. J. Agron. 2018, 100, 19–34. [Google Scholar] [CrossRef]
- Sanz, J.; Muntifering, R.B.; Bermejo, V.; Gimeno, B.S.; Elvira, S. Ozone and increased nitrogen supply effects on the yield and nutritive quality of Trifolium subterraneum. Atmos. Environ. 2005, 39, 5899–5907. [Google Scholar] [CrossRef]
- Ainsworth, E.A. Understanding and improving global crop response to ozone pollution. Plant J. 2017, 90, 886–897. [Google Scholar] [CrossRef] [PubMed]
- Sanz, J.; González-Fernández, I.; Calvete-Sogo, H.; Lin, J.S.; Alonso, R.; Muntifering, R.; Bermejo, V. Ozone and nitrogen effects on yield and nutritive quality of the annual legume Trifolium cherleri. Atmos. Environ. 2014, 94, 765–772. [Google Scholar] [CrossRef]
- Mills, G.; Buse, A.; Gimeno, B.; Bermejo, V.; Holland, M.; Emberson, L.; Pleijel, H. A synthesis of AOT40-based response functions and critical levels of ozone for agricultural and horticultural crops. Atmos. Environ. 2007, 41, 2630–2643. [Google Scholar] [CrossRef]
- Wilkinson, S.; Mills, G.; Illidge, R.; Davies, W.J. How is ozone pollution reducing our food supply? J. Exp. Bot. 2012, 63, 527–536. [Google Scholar] [CrossRef]
- Pleijel, H.; Danielsson, H.; Emberson, L.; Ashmore, M.R.; Mills, G. Ozone risk assessment for agricultural crops in Europe: Further development of stomatal flux and flux-response relationships for European wheat and potato. Atmos. Environ. 2007, 41, 3022–3040. [Google Scholar] [CrossRef]
- Pleijel, H.; Broberg, M.C.; Uddling, J.; Mills, G. Current surface ozone concentrations significantly decrease wheat growth, yield and quality. Sci. Total Environ. 2018, 613–614, 687–692. [Google Scholar] [CrossRef]
- Broberg, M.C.; Uddling, J.; Mills, G.; Pleijel, H. Fertilizer efficiency in wheat is reduced by ozone pollution. Sci. Total Environ. 2017, 607–608, 876–880. [Google Scholar] [CrossRef] [PubMed]
- Mills, G.; Frei, M.; Sharps, K.; Simpson, D.; Pleijel, H.; Burkey, K.; Emberson, L.; Uddling, J.; Broberg, M.; Feng, Z.; et al. Closing the global ozone yield gap: Quantification and cobenefits for multistress tolerance. Glob. Chang. Biol. 2018, 24, 4869–4893. [Google Scholar] [CrossRef] [PubMed] [Green Version]
- FAO. The Future of Food and Agriculture: Trends and Challenges; FAO: Rome, Italy, 2017; Available online: http://www.fao.org/3/i6583e/i6583e.pdf (accessed on 4 July 2021)ISBN 978-92-5-109551-5.
- Pleijel, H.; Eriksen, A.B.; Danielsson, H.; Bondesson, N.; Selldén, G. Differential ozone sensitivity in an old and a modern Swedish wheat cultivar—Grain yield and quality, leaf chlorophyll and stomatal conductance. Environ. Exp. Bot. 2006, 56, 63–71. [Google Scholar] [CrossRef]
- Roche, D. Stomatal Conductance Is Essential for Higher Yield Potential of C 3 Crops. CRC Crit. Rev. Plant Sci. 2015, 34, 429–453. [Google Scholar] [CrossRef]
- Ruiz, M.; Zambrana, E.; Fite, R.; Sole, A.; Tenorio, J.L.; Benavente, E. Yield and quality performance of traditional and improved bread and durum wheat varieties under two conservation tillage systems. Sustainability. 2019, 11, 4522. [Google Scholar] [CrossRef] [Green Version]
- Fischer, R.A.; Rees, D.; Sayre, K.D.; Lu, Z.-M.; Condon, A.G.; Saavedra, A.L. Wheat Yield Progress Associated with Higher Stomatal Conductance and Photosynthetic Rate, and Cooler Canopies. Crop. Sci. 1998, 38, 1467–1475. [Google Scholar] [CrossRef]
- Barnes, J.D.; Velissariou, D.; Davison, A.W.; Holevas, C.D. Comparative ozone sensitivity of old and modern Greek cultivars of spring wheat. New Phytol. 1990, 116, 707–714. [Google Scholar] [CrossRef]
- Agrawal, M.; Singh, B.; Rajput, M.; Marshall, F.; Bell, J.N.B. Effect of air pollution on peri-urban agriculture: A case study. Environ. Pollut. 2003, 126, 323–329. [Google Scholar] [CrossRef]
- González-Fernández, I.; Bermejo, V.; Elvira, S.; de la Torre, D.; González, A.; Navarrete, L.; Sanz, J.; Calvete, H.; García-Gómez, H.; López, A.; et al. Modelling ozone stomatal flux of wheat under mediterranean conditions. Atmos. Environ. 2013, 67, 149–160. [Google Scholar] [CrossRef] [Green Version]
- Calvete-Sogo, H.; Elvira, S.; Sanz, J.; González-Fernández, I.; García-Gómez, H.; Sánchez-Martín, L.; Alonso, R.; Bermejo-Bermejo, V. Current ozone levels threaten gross primary production and yield of Mediterranean annual pastures and nitrogen modulates the response. Atmos. Environ. 2014, 95, 197–206. [Google Scholar] [CrossRef] [Green Version]
- Monga, R.; Marzuoli, R.; Alonso, R.; Bermejo, V.; González-Fernández, I.; Faoro, F.; Gerosa, G. Varietal screening of ozone sensitivity in Mediterranean durum wheat (Triticum durum, Desf.). Atmos. Environ. 2015, 110, 18–26. [Google Scholar] [CrossRef]
- Pleijel, H.; Danielsson, H.; Gelang, J.; Sild, E.; Selldén, G. Growth stage dependence of the grain yield response to ozone in spring wheat (Triticum aestivum L.). Agric. Ecosyst. Environ. 1998, 70, 61–68. [Google Scholar] [CrossRef]
- Yousfi, S.; Serret, M.D.; Márquez, A.J.; Voltas, J.; Araus, J.L. Combined use of δ13C, δ18O and δ15N tracks nitrogen metabolism and genotypic adaptation of durum wheat to salinity and water deficit. New Phytol. 2012, 194, 230–244. [Google Scholar] [CrossRef] [PubMed]
- Farquhar, G.D.; Richards, R.A. Isotopic composition of plant carbon correlates with water-use efficiency of wheat genotypes. Aust. J. Plant Physiol. 1984, 11, 539–552. [Google Scholar] [CrossRef]
- Saurer, M.; Fuhrer, J.; Siegenthaler, U. Influence of ozone on the stable carbon isotope composition, δ13C, of leaves and grain of spring wheat (triticum aestivum L.). Plant Physiol. 1991, 97, 313–316. [Google Scholar] [CrossRef] [Green Version]
- Araus, J.L.; Villegas, D.; Aparicio, N.; García del Moral, L.F.; El Hani, S.; Rharrabti, Y.; Ferrio, J.P.; Royo, C. Environmental Factors Determining Carbon Isotope Discrimination and Yield in Durum Wheat under Mediterranean Conditions. Crop. Sci. 2003, 43, 170. [Google Scholar] [CrossRef]
- Araus, J.L.; Cabrera-Bosquet, L.; Serret, M.D.; Bort, J.; Nieto-Taladriz, M.T. Comparative performance of δ13C, δ18O and δ15N for phenotyping durum wheat adaptation to a dryland environment. Funct. Plant Biol. 2013, 40, 595. [Google Scholar] [CrossRef]
- Farquhar, G.D.; Ehleringer, J.R.; Hubick, K.T. Carbon Isotope Discrimination and Photosynthesis. Annu. Rev. Plant Physiol. Plant. Mol. Biol. 1989, 40, 503–537. [Google Scholar] [CrossRef]
- Tcherkez, G.; Mahé, A.; Hodges, M. 12C/13C fractionations in plant primary metabolism. Trends Plant Sci. 2011, 16, 499–506. [Google Scholar] [CrossRef]
- Serret, M.D.; Yousfi, S.; Vicente, R.; Piñero, M.C.; Otálora-Alcón, G.; Del Amor, F.M.; Araus, J.L. Interactive effects of CO2 concentration and water regime on stable isotope signatures, nitrogen assimilation and growth in sweet pepper. Front. Plant Sci. 2018, 8, 2180. [Google Scholar] [CrossRef] [PubMed] [Green Version]
- Jäggi, M.; Saurer, M.; Volk, M.; Fuhrer, J. Effects of elevated ozone on leaf δ 13C and leaf conductance of plant species grown in semi-natural grassland with or without irrigation. Environ. Pollut. 2005, 134, 209–216. [Google Scholar] [CrossRef]
- Cui, J.; Lamade, E.; Fourel, F.; Tcherkez, G. δ15N values in plants are determined by both nitrate assimilation and circulation. New Phytol. 2020, 226, 1696–1707. [Google Scholar] [CrossRef]
- Tcherkez, G. Natural 15N/14N isotope composition in C3 leaves: Are enzymatic isotope effects informative for predicting the 15N-abundance in key metabolites? Funct. Plant Biol. 2011, 38, 1. [Google Scholar] [CrossRef]
- Sanchez-Bragado, R.; Serret, M.D.; Araus, J.L. The nitrogen contribution of different plant parts to wheat grains: Exploring genotype, water, and nitrogen effects. Front. Plant Sci. 2017, 7, 1–12. [Google Scholar] [CrossRef] [PubMed] [Green Version]
- Perez, P.; Martinez-Carrasco, R.; Martín del Molino, M.M.; Rojo, B.; Ulloa, M. Nitrogen Uptake and Accumulation in Grains of Three Winter Wheat Varieties with Altered Source—Sink Ratios. J. Exp. Bot. 1989, 40, 707–710. [Google Scholar] [CrossRef]
- Yousfi, S.; Serret, M.D.; Voltas, J.; Araus, J.L. Effect of salinity and water stress during the reproductive stage on growth, ion concentrations, Δ13C, and δ15N of durum wheat and related amphiploids. J. Exp. Bot. 2010, 61, 3529–3542. [Google Scholar] [CrossRef] [PubMed] [Green Version]
- Peel, M.C.; Finlayson, B.L.; McMahon, T.A. Updated world map of the Köppen-Geiger climate classification. Hydrol. Earth Syst. Sci. 2007, 11, 1633–1644. [Google Scholar] [CrossRef] [Green Version]
- Heagle, A.S.; Philbeck, R.B.; Ferrell, R.E.; Heck, W.W. Design and Performance of a Large, Field Exposure Chamber to Measure Effects of Air Quality on Plants. J. Environ. Qual. 1989, 18, 361–368. [Google Scholar] [CrossRef]
- Calvete-Sogo, H.; González-Fernández, I.; Sanz, J.; Elvira, S.; Alonso, R.; García-Gómez, H.; Ibáñez-Ruiz, M.A.; Bermejo-Bermejo, V. Heterogeneous responses to ozone and nitrogen alter the species composition of Mediterranean annual pastures. Oecologia 2016, 181, 1055–1067. [Google Scholar] [CrossRef] [PubMed]
- Fuhrer, J.; Skärby, L.; Ashmore, M.R. Critical levels for ozone effects on vegetation in Europe. Environ. Pollut. 1997, 97, 91–106. [Google Scholar] [CrossRef]
- Eurostat. Cereals for the Production of Grain (Including Seed) by Area, Production and Humidity. 2021. Available online: https://ec.europa.eu/eurostat/databrowser/view/tag00027/default/table?lang=en (accessed on 2 February 2021).
- Ministerio para la Trasmisión Ecológica. Evaluación de la Calidad del Aire en España Año 2019. MITECO 2019. Available online: https://www.miteco.gob.es/images/es/informeevaluacioncalidadaireespana2019_tcm30-510616.pdf (accessed on 4 July 2021).
- European Environment Agency. Spain Air Pollution Fact Sheet 2014. Eur. Environ. Agency 2014. Available online: https://www.comunidad.madrid/sites/default/files/doc/sanidad/spain_air_pollution_fact_sheet_2014.pdf (accessed on 4 July 2021).
- Horowitz, L.W. Past, present and future concentrations of tropospheric ozone and aerosols: Methodology, ozone evaluation, and sensitivity to aerosol wet removal. J. Geophys. Res. Atmos. 2006, 111, D22211. [Google Scholar] [CrossRef]
- Fagnano, M.; Maggio, A.; Fumagalli, I. Crops’ responses to ozone in Mediterranean environments. Environ. Pollut. 2009, 157, 1438–1444. [Google Scholar] [CrossRef]
- González-Fernández, I.; Calvo, E.; Gerosa, G.; Bermejo, V.; Marzuoli, R.; Calatayud, V.; Alonso, R. Setting ozone critical levels for protecting horticultural Mediterranean crops: Case study of tomato. Environ. Pollut. 2014, 185, 178–187. [Google Scholar] [CrossRef] [PubMed]
- González-Fernández, I.; Elvira, S.; Calatayud, V.; Calvo, E.; Aparicio, P.; Sánchez, M.; Alonso, R.; Bermejo Bermejo, V. Ozone effects on the physiology and marketable biomass of leafy vegetables under Mediterranean conditions: Spinach (Spinacia oleracea L.) and Swiss chard (Beta vulgaris L. var. cycla). Agric. Ecosyst. Environ. 2016, 235, 215–228. [Google Scholar] [CrossRef]
- Gimeno, B.S.; Bermejo, V.; Reinert, R.A.; Zheng, Y.M.; Barnes, J.D. Adverse effects of ambient ozone on watermelon yield and physiology at a rural site in Eastern Spain. New Phytol. 1999, 144, 245–260. [Google Scholar] [CrossRef]
- Reichenauer, T.G. Ozone sensitivity in Triticum durum and T. aestivum with respect to leaf injury, photosynthetic activity and free radical content. Physiol. Plant. 1998, 104, 681–686. [Google Scholar] [CrossRef]
- Royo, C.; Martos, V.; Ramdani, A.; Villegas, D.; Rharrabti, Y.; García del Moral, L.F. Changes in Yield and Carbon Isotope Discrimination of Italian and Spanish Durum Wheat during the 20th Century. Agron. J. 2008, 100, 352–360. [Google Scholar] [CrossRef]
- Medina, S.; Vicente, R.; Nieto-Taladriz, M.T.; Aparicio, N.; Chairi, F.; Vergara-Diaz, O.; Araus, J.L. The Plant-Transpiration Response to Vapor Pressure Deficit (VPD) in Durum Wheat Is Associated with Differential Yield Performance and Specific Expression of Genes Involved in Primary Metabolism and Water Transport. Front. Plant Sci. 2019, 9, 1994. [Google Scholar] [CrossRef] [Green Version]
- Feng, Z.; Kobayashi, K.; Ainsworth, E.A. Impact of elevated ozone concentration on growth, physiology, and yield of wheat (Triticum aestivum L.): A meta-analysis. Glob. Chang. Biol. 2008, 14, 2696–2708. [Google Scholar] [CrossRef]
- Pleijel, H.; Broberg, M.C.; Uddling, J. Ozone impact on wheat in Europe, Asia and North America—A comparison. Sci. Total Environ. 2019, 664, 908–914. [Google Scholar] [CrossRef]
- Feng, Z.; Wang, L.; Pleijel, H.; Zhu, J.; Kobayashi, K. Differential effects of ozone on photosynthesis of winter wheat among cultivars depend on antioxidative enzymes rather than stomatal conductance. Sci. Total Environ. 2016, 572, 404–411. [Google Scholar] [CrossRef]
- Fuhrer, J.; Lehnherr, B.; Moeri, P.B.; Tschannen, W.; Shariat-Madari, H. Effects of ozone on the grain composition of spring wheat grown in open-top field chambers. Environ. Pollut. 1990, 65, 181–192. [Google Scholar] [CrossRef]
- Flagella, Z.; Giuliani, M.M.; Giuzio, L.; Volpi, C.; Masci, S. Influence of water deficit on durum wheat storage protein composition and technological quality. Eur. J. Agron. 2010, 33, 197–207. [Google Scholar] [CrossRef]
- Wang, Y.; Frei, M. Stressed food—The impact of abiotic environmental stresses on crop quality. Agric. Ecosyst. Environ. 2011, 141, 271–286. [Google Scholar] [CrossRef]
- Broberg, M.C.; Feng, Z.; Xin, Y.; Pleijel, H. Ozone effects on wheat grain quality—A summary. Environ. Pollut. 2015, 197, 203–213. [Google Scholar] [CrossRef]
- Simpson, R.J.; Lambers, H.; Dalling, M.J. Nitrogen Redistribution during Grain Growth in Wheat (Triticum aestivum L.). Plant Physiol. 1983, 71, 7–14. [Google Scholar] [CrossRef] [PubMed] [Green Version]
- Evans, R.D. Physiological mechanisms influencing plant nitrogen isotope composition. Trends Plant Sci. 2001, 6, 121–126. [Google Scholar] [CrossRef]
- Van Frank, G.; Rivière, P.; Pin, S.; Baltassat, R.; Berthellot, J.-F.; Caizergues, F.; Dalmasso, C.; Gascuel, J.-S.; Hyacinthe, A.; Mercier, F.; et al. Genetic Diversity and Stability of Performance of Wheat Population Varieties Developed by Participatory Breeding. Sustainability 2020, 12, 384. [Google Scholar] [CrossRef] [Green Version]
Publisher’s Note: MDPI stays neutral with regard to jurisdictional claims in published maps and institutional affiliations. |
© 2021 by the authors. Licensee MDPI, Basel, Switzerland. This article is an open access article distributed under the terms and conditions of the Creative Commons Attribution (CC BY) license (https://creativecommons.org/licenses/by/4.0/).