Article

The European Beech Annual Tree Ring Widths Time Series, Solar–Climatic Relationships and Solar Dynamo Regime Changes

Institute of Astronomy and NAO-Bulgarian Academy of Sciences, 1784 Sofia, Bulgaria
Atmosphere 2021, 12(7), 829; https://doi.org/10.3390/atmos12070829
Submission received: 6 May 2021 / Revised: 25 June 2021 / Accepted: 26 June 2021 / Published: 28 June 2021
(This article belongs to the Special Issue Links between Solar Activity and Atmospheric Circulation)

Abstract

:
In this study, the results from the analysis of annual ring widths (‘Dm’) time series of two “very sensitive” to the climate and solar–climate relationships of long lived European beech (Fagus sylvatica) samples (on age of 209 ± 1 and 245 ± 5 years correspondingly) are discussed. Both series are characterized by very good expressed and relating to the solar magnetic Hale cycle 20–22-year oscillations. A good coincidence between the changes of ‘Dm’ and the growth or fading of the solar magnetic cycle is found. The transition effects at the beginning and ending of the grand Dalton (1793–1833) and Gleissberg minima (1898–1933) are very clearly visible in the annual tree ring width data for the one of beech samples. Some of these effects are also detected in the second sample. The problem for the possible “lost” sunspot cycle at the end of 18th century is also discussed. A prediction for a possible “phase catastrophe” during the future Zurich sunspot cycles 26 and 27 between 2035–2040 AD as well as for general precipitation upward and temperature fall tendencies in Central Bulgaria, more essential after 2030 AD, are brought forth.

1. Introduction

The idea for investigations of solar activity in the past as well as the “Sun–climate” relationships on the basis of tree ring widths measurements was suggested since the beginning of the 20th century by the American astronomer Edward Douglass (1867–1962), the “father” of dendrochronology. He provided the pioneer studies in this field on the basis of long lived tree ring samples mainly from the south-west part of USA [1]. A few decades later, the British scientist Derek Schove partly used dendrochronological data for the reconstruction of solar activity in the past (the so called “Schove’s series”) [2,3]. Later, in 1970s, an extended study of solar–climatic relationships based on dendrochronological data from the west part of USA was made [4]. Relative new dendrochrinological studies, which are oriented to “Sun–climate” problematic have been published by Rasspopov et.al [5], Wang et al. [6] and well as Shumilov et al. [7]. It needs to be especially noted there a large number of studies from the last ~20 years, which relate to the European beech or pinopsida samples and in many of them, in light of “Sun–climate” connection [8,9,10,11,12,13,14].
One of the most interesting and discussed problems in solar and solar-terrestrial physics to the present day relates to the existence and stability of 11 year and 20–22-year solar activity cycles by long duration (periods T ≥ 100 year) [15,16,17,18,19,20,21,22,23,24,25]. First, it touches the theme for solar oscillations with super- centurial duration, such as the bi-centurial (~200 year) and bi-millennial (2200–2400/2500 year, often signed as “Hallstadt”) [18]. A large number of epochs by typical duration from 2–3 to few decades when the sunspot (~11 year) Schwabe–Wolf’s cycles are characterized by relatively low or very low amplitudes (grand sunspot minima). They have been detected during the last ~10,000 years (the postglacial Holocene epoch) on the basis of time series analysis over so called “historical” indirect data sets such as the Schove’s series [2,3], the “cosmogenic” isotopes (mainly 14C and 10Be) series [15,16,17,18,19,20], the naked eye visible giant sunspots, and/or sunspot groups [21], and so forth. They are related according to the viewpoint of many authors, namely to the quasi secular multiplet of oscillations by duration in the range of 50–120 years, where the 80–90 year Gleissberg cycle [22] is only one of them [23,24], the bi-centurial 170–230 year (the Vries/Suess) cycle [16], the 2200–2500 year (Hallstadt) cycle [18], as well as other oscillations in the super centurial or super millennial range. In particular the grand solar minima series after 1000 AD, namely in the 11th, 13th, 15th, 17th, and 19th and signed as Oort, Wolf, Spoerer, Maunder, and Dalton minima, respectively, are related to the sunspot ~200 year cycle minimum phases which occurred during the corresponding epochs [2,3,17,18]. In addition, the Spoerer and Maunder minima are the deepest of them due to their connection with the last Hallstadt cycle minimum [18,19]. That is why the term “Dalton-type” is often used to signal these grand solar minima which are related to top-down or near minimum ~200 year deVries/Suess cycle phases. On the other side, “Maunder-type” minimum relates to the superposition of both of the deVries and Hallstadt cycles’ top-down phases (Maunder-type), while to quasi sub- and centurial solar cycles minima effect events like the Gleissberg minimum (1898–1933 AD) are related.
The term “solar dynamo” is used to signify the complex physical processes in the Sun’s convective zone which are directly related to the observed solar activity centers of sunspots groups’ generation, development, and destruction [26,27,28,29]. The basic moment for the solar dynamo models is the description (qualitative and quantitative) of the transformation of the global Sun’s magnetic (poloidal) field to the (toroidal) magnetic field of the forming active centers and the reverse converting of the toroidal field again in poloidal field, but with the opposite sign to the initial one. The explanation of the mean amplitudes and lengths of the 11 and 22 year solar cycles is one of the most important aims of the solar dynamo models [26,27,28,29]. That is why the large time scale variations of solar activity and grand solar minima related to them could be considered as deviations to the mean solar dynamo regime.
Many authors associate the grand solar minima with epochs of relative climate cooling [18,19,20,23,25]. According to different estimations, the mean planetary Earth climate cooling effect corresponds to 0.5–0.8 °C for the ~200 year solar minima epochs or 1.5–2 °C for the Hallstadt cycle minima—the so-called “little ice epochs”. On the other side, these estimations are disputed, mainly because the observed relative total solar irradiance changes (TSI -index) are too small (≈0.06 to 0.1%) and the corresponding model extrapolations in the past for the Dalton or Maunder minima given much less values (see for example [30]). An alternative explanation could assume that the Sun’s force on the climate has a multi-component physical nature, i.e., except the TSI changes other solar activity phenomena, such as solar proton events (SEP) [31], solar magnetic dipole reverses (the 20–22 year Hale cycle), and the galactic cosmic rays (GCR) modulations by the heliosphere playing important roles as well [32,33].
It is clear that the grand solar minima are a serious call for the “solar dynamo” models. They successfully explain the mean behavior of sunspot activity as well as the periodic alternative sign changes of the Sun’s total magnetic field in relation to these cycles [29]. However, it is almost impossible for these models to explain by what phenomena the grand solar minima quasi-regularity is caused. There are two main viewpoints: 1. The grand solar minima are catastrophic non-regular events [34,35], or 2. They are quasi regular events, affected by outer for the Sun factors (for example Solar system bari-center variations [36] and gravitational–tidal forcing from the planets [37]. Although the “planet hypothesis” is not acceptable by the majority of researchers due to the absence of strong physical arguments, there are many supporting studies during the last two decades where the physical concept is essentially improved (see for example [37,38].
The present epoch (beginning of 21st century) is very interesting and critical for our understanding of both the long time solar activity changes and “Sun–climate” relations as well as for the climate changes as a whole. If the position is taken that the grand solar maxima are regular quasi periodic events, it could be expected that during the first half or middle of the present century, a new super-centurial grand solar minimum of Dalton-type will begin. Taking into account that the last such event (Dalton minimum (1793/98–1830) is the eponym) started on the boundary between 18th and 19th and took a mean period of T ≈ 200–210 years [16,18,19] for the bi-centurial deVries/Suess cycle it is most probable that the new grand minimum should begin close to 2000 AD. On the other hand, if such an event occurs after 2060–2070 AD, the hypothesis for the non-regular nature of grand solar minima will be more appropriate. If the “Sun–climate” relationships are a serious factor for the climate changes in the modern epoch, a possible grand solar minimum approach should reflect on the climate parameter changes as well as on different biosphere parameters, including the tree vegetation processes.
The older trees aged ≥200–220 years, whose living interval contains at least the Dalton minimum or part of it, are very appropriate objects for studies in this course. The corresponding annual tree ring widths series lengths are comparable to the deVries/Suess solar cycle and by about 2 or more times exceed the solar oscillations by the centurial or sub- centurial duration. They will be also essentially longer than the almost all meteorological instrumental data series in the world. (The regular continuous instrumental meteorological observations in Bulgaria have been provided since 1899 AD, i.e., since the national meteorological network was started). Thus, for the studied annual tree ring width data series a meteorological information from near placed meteorological stations for calibration could be used. On this basis, a reconstruction of the climatic conditions and “Sun–climate” relationships in the corresponding region for much longer time as the instrumental series is principally possible. A serious advantage for such a study could be preliminary information about the “Sun–climate” relationships for the region based on meteorological instrumental data series. It helps for a faster and easier choice of the tree samples sites and the preliminary wait regarding the shorter (11 and 22 year) solar modulated cycles in tree rings time series.
However, in many cases there are significant uncertainties relating the tree ring widths data and their analysis in relation to “Sun–climate” connections. They are due to the biological features of the wood samples. The surrounding conditions could play particularly important and even dominant role in many cases. Participating in photosynthesis, the trees consume water and nutrient resources from the surrounding soil, along with a number of growing representatives of the flora-trees, shrubs, and grasses. The latter are competitors in the use of these resources. Therefore, the growth of a tree at its various stages depends, to a certain extent, on the growth rate of the surrounding plants. In this case, additional external factors, such as industrial or sanitary deforestation, windfall, storm erosion of the upper soil layer, the laying of forest roads near the test sample, etc., can play a role. Landscape features, such as the slope of the terrain and the petrochemical composition and physical properties of the soil, also affect the degree of uncertainty in the estimates of the influence of solar activity and climate on tree growth. Trees growing on negative landforms, e.g., in river floodplains, receive abundant water supply from the moisture-saturated soil. Their growth is too inert with respect to atmospheric climatic changes. The effect of precipitation variations in short-time scales for these cases may not be noticeable.
Otherwise, when a tree grows on steep slopes in soils with a small accumulation of water, a more intense influence of solar and climatic factors on the growth of the tree can be expected. In the best case scenario, on the basis of corresponding data some fine effects in solar–climatic relationships evolution can be found, analyzed, and connected with the last one solar dynamo regime changes.
The age of tree is an additional factor that could damage the climate and solar–climate relation effect. Generally, the younger tree samples’ growth is faster than the aged ones. That is why usually in the tree ring, time series general non-linear trends are observed. For the dominant (“conventional”) part of the dendrochronological analysis, these trends are removed by using different mathematical algorithms because they are considered as “stray” signals. However, if the object of the study are to detect and analyze effects caused by long periodic solar–climatic oscillations, it is important to carefully proceed with these trends. That is why the trend could contain information not only for the age effects of growth, but also for the long-term solar cycles’ influences. The objectives of the present research were:
  • The tree rings widths (Dm) time series investigation of a long lived (age 209 ± 1 years; logged in 1983 AD) beech sample (Fagus sylvatica), in the aspect of “Sun–climate” relationship and solar dynamo regime changes during the interval 18th–21st centuries is the first aim of this paper. A specific moment is to search for a possible reaction of ‘Dm’ in transition epochs preceding and during the grand solar minima of Dalton and Gleissberg.
  • The second aim is the climate changes (precipitations and/or temperatures for the vegetation season) reconstruction test during the calendar interval 1780–1900 AD.
  • On the basis of the obtained ‘1’ statistically significant cycles, a kinematic regression model is built for ‘Dm’ regarding the epoch 1780–1982. It is extrapolated for the next 30 years (1982–2012 AD). The extrapolated data for comparison with the real solar activity and regional climate changes are used (“epignosis test”). It helps for the estimation of how the obtained kinematic model is adequate and stable in time. If the epignose test is successful, the above described steps could be used for extrapolation (as turned out to be in realities). The above described procedure (‘1–3’) for an future calendar interval after 2012 AD on the basis of other beech sample data could be used.
  • Another long-lived beech sample (age 245 ± 5years; logged in 2012 AD) time series is used for an additional analysis. The used calendar range of this sample is 1811–2011 AD. The kinematic model extrapolation calendar range is 2012–2045 AD.
Both samples are logged from sites in Central Stara planina (Balkan Mountain Range) and the larger part of the analysis and results concerning solar–climate connections relating to Central Bulgaria.
The present work is a continuation of our cited earlier works [39,40,41]. That is why in a significant degree of it is based on results that are already described in the above mentioned manuscripts. However, a large part of these descriptions are in the Bulgarian language. Other part from the used there results and their analysis, which relates to seven old beech samples (age ≥ 200 years) are presented of compact type in [41] due to volume limit requirements for the manuscript.
An extended discussion of the presented results and their analysis in the light of earlier established our results for “Sun–climate” relationships in Bulgaria and South- East Europe is given in Section 5. There is also a short debate about the physical mechanisms of solar–climatic relationships as well as about the specific features of the grand Dalton-type solar minima and their relation to the Gnevishev-Ohl’s rule violations and the solar 200 year cycle minima. The forecast about new grand super-centurial minimum in 21st century as well as the climate consequences are also discussed.

2. Data

2.1. Tree Samples

This study is based on primary dendrochronological data of 45 tree samples collection from 23 sites of industrial logging on the territory of Bulgaria. This collection contains 44 tree samples which were logged in 2012 and 2013 + the earlier logged in 1983 AD “Gurkovo-01” sample, which was added. The measurement and preliminary data proceedings have been described by Komitov et al. [37,38]. As it is shown in Figure 1 these samples are taken mainly from Central and West Stara Planina (Balkan Mountain range) and a smaller part–from Sredna Gora near to Stara Zagora, East Rodope, Ludogorie (in North-East Bulgaria) as well as the mountains in South-West Bulgaria (Rila, Pirin, Malashevo Mountain and the region of small relatively low and middle mountains near to Sofia in the south and east direction).
The tree samples distribution in collection is as follows: white pine (Pinus sylvestris)-3, spurce (Picea)-1, oak-7 (Quercus petraea-3 + Quercus robur-4); European Beech (Fagus sylvatica)-34.
The youngest sample (“Trojan-01”, beech) is 57 years old, while the oldest (“Rositsa-01”, beech too) is 24 ± 5 years old. The oldest pinopsida sample is spruce (“Govedartsi-01”, age 134 years), while the age of oldest oak sample is 175 years. The sample distribution by age is shown on Figure 2. The mean age of the whole samples collection is 128 years.
All samples are cut about 1–1.2 m over the ground where the trunk form already corresponds approximately to cylinder.

2.2. Instrumental Climatic Data

An essential moment for our studies is the existence of a very detailed preliminary information about the short time climate oscillations (precipitations + temperatures) by instrumental data and the regional and seasonal features of “Sun–climate” relations for the whole territory of Bulgaria during the most part of 20th century (namely 1899–1979 AD). At the beginning a 20–22-year solar modulated cycle in the temperature and precipitations time series for three meteorological stations in Upper Tracian Valley (Plovdiv, Stara Zagora, and Chirpan) for the warm half-year (May–October) has been established [42]. In the second stage a massive study for the whole territory of Bulgaria by using of participations and temperature instrumental data from 73 stations and for the both half-years (cool, November–April and warm, May–October) has been provided. The existence and statistical certainty of 20–22 year climate oscillation both for precipitations and temperatures in the warm half-year for the ¾ of South Bulgaria territory except the West Bulgarian Basign Valleys, as well as in separate stations in North Bulgaria has been confirmed (Figure 3). In contrary, statistically significant 11-year oscillations have been found for November-April season on the whole Bulgarian territory (Gogoshev M and Komitov B., “Analysis of short–periodic climate variations in Bulgaria during the 20th century and their consequences for the national economics”, special preprint to Bulgarian Acadame of Science president acad. A. Balevski, 1983; no official publishing but the main results regarding “Sun–climate” relationships are briefly described in [43]). It was very well expressed in West Bulgarian Basign Valleys, but generally weakens when approaching the Black Sea. It was later extended until to 1994 AD by including of data only for 50 stations, due to changes of the administrative procedures regarding the use of instrumental data from the National Institute of Hydrology and Meteorology.
Thus, these above mentioned studies for Sun–climate relationship and the obtained results given us preliminary information about the short time potential solar-modulated cycles, which could be detected in tree rings widths data series in the separate regions of Bulgaria. This relates for oscillations for which the corresponding period is T ≤ 50–60 year, but mainly for the 11 and 20–22 year ones.

2.3. Preliminary Data Processing and General Trends. The ~200 Year Cycle in the Longest Beech Tree Ring Widths Data Series

In the all studied tree ring time series the first oldest 5 to 40 tree rings near to the center have been removed for eliminating the strong growth effects when the sample is very young as well as in the cases when the near-central structure is particular destroyed due to putrefaction processes. After that, for each tree sample a smoothing procedure of tree rings width over 5 years and for all measured radial directions has been provided. Thus, smoothed tree ring width ‘Dm’ is the parameter which for all further analysis is used.
There is a clear expressed vegetation season for the European beech, which is almost fully coincided with the warm half-year (May–October) in Bulgaria. The last statement was especially tested [39,40]. That is why the climatic calibration of the beech tree widths (‘Dm’) series on the basis of near placed meteorological stations data is very comfortable. In addition, it needs to be noted that in the ‘Dm’ pinopsida samples time series a strong non-linear general trend, related predominantly in our opinion to the age effect exist.
In contrary, such general statistically significant trends by linear or non-linear (polynomial) algebraic type of power degree from 1 to 4 for the beech samples are almost totally absent or are very weakly expressed when the age is in order 150–160 year or less. This is, in our opinion, an indicator that the ‘Dm’ variations are caused mainly from the climate and/or solar–climate connections, while “the age effect” was effectively eliminated due to the preliminary removal of the near-central rings from the analysis. In any case, if in our beech series, which are used for analysis, so far some “age–effect” remains it is too small.
Moreover, significant non-linear general trends, and related to them, “age-effect” were established for all oak samples.
In the 6 oldest beech samples time series a trend of quasi-periodic type with a period 200 ≤ T ≤ 230 year has been established [41]. All they are from sites in Stara Planina. This quasi-periodic (“hyper-cycle”) trend description (see details in Section 3) is better as the fitting is on the basis of any linear or polynomial algebraic minimized function in the power degree from 2 to 4. Besides, the extreme phases of these trend- hyper cycles are closely to the solar 200 year de Vries-Suesscycle extremes like Dalton and Glesissberg minima as well as to the present epoch of relatively low solar activity at the beginning of the 21st century. Consequently, the relation of this 200–230 year cyclic trend to the solar ~200 year cycle and its influence over climate is very probable.
As it was already pointed out, “Gurkovo-01” also belongs to the oldest beech samples (age 209 years). However mainly due to the fact that it was logged in 1983 its ‘Dm’–time series includes Dalton and Gleissberg minima epochs, but not the present epoch, which indeed marks the start of new grand minimum. That is why, in our opinion, no 200 year hyper-cyclic trend is visible in this series and there is no statistically significant general trend at all. On the other hand, the Dalton minimum as well as the damaging effect over 20–22 year cycle during this solar grand minimum epoch is clearly visible (Figure 4, left panel).

2.4. Two Stage Tree Samples Selection Procedure

One of the first tasks in our dendrochronological project in 2013–2014 AD was to check in how many ‘Dm’ time series a statistically significant 20–22 year cycle would be detected. The next task was to check how the coincidence between the regions where 20–22 year cycle in tree rings widths ‘Dm’ series was established and the regions with 20–22 year oscillations in the climate instrumental data series from the earlier studies from the 1980th. The results from corresponding analysis confirm these suggestions [39,40].
In the next stage, the oldest 7 (age > 200 year) beech samples were on the focus of our analysis. Two tasks were solved there: 1 On the basis of obtained oscillations spectra by using of T–R periodogram algorithm (see Section 3) to build kinematic models of the ‘Dm’ series and to use them for extrapolations (forecasting) of ‘Dm’ for the nearest future (~2045 AD); 2. Calibration procedures between the studied ‘Dm’ series and suitable near placed meteorological stations data series for the 1899–1979/94 AD epoch. The extracted calibration functions were used for the extrapolation of climate parameters (temperatures and precipitations) of corresponding regions for the nearest future (until 2045 AD). The corresponding results have been described by Komitov and Kaftan [41].
On the basis of above mentioned results, it can establish that the best models and calibration functions have been derived for two tree ring widths time series—“Gurkovo-01” and “Rositsa-01”.
  • In their T–R spectra, the solar modulated 20–22 year cycle is much better expressed as in the spectra of the remained five.
  • The Dalton minimum includes in both series and its traces are much more clearly visible from the 7 oldest samples.
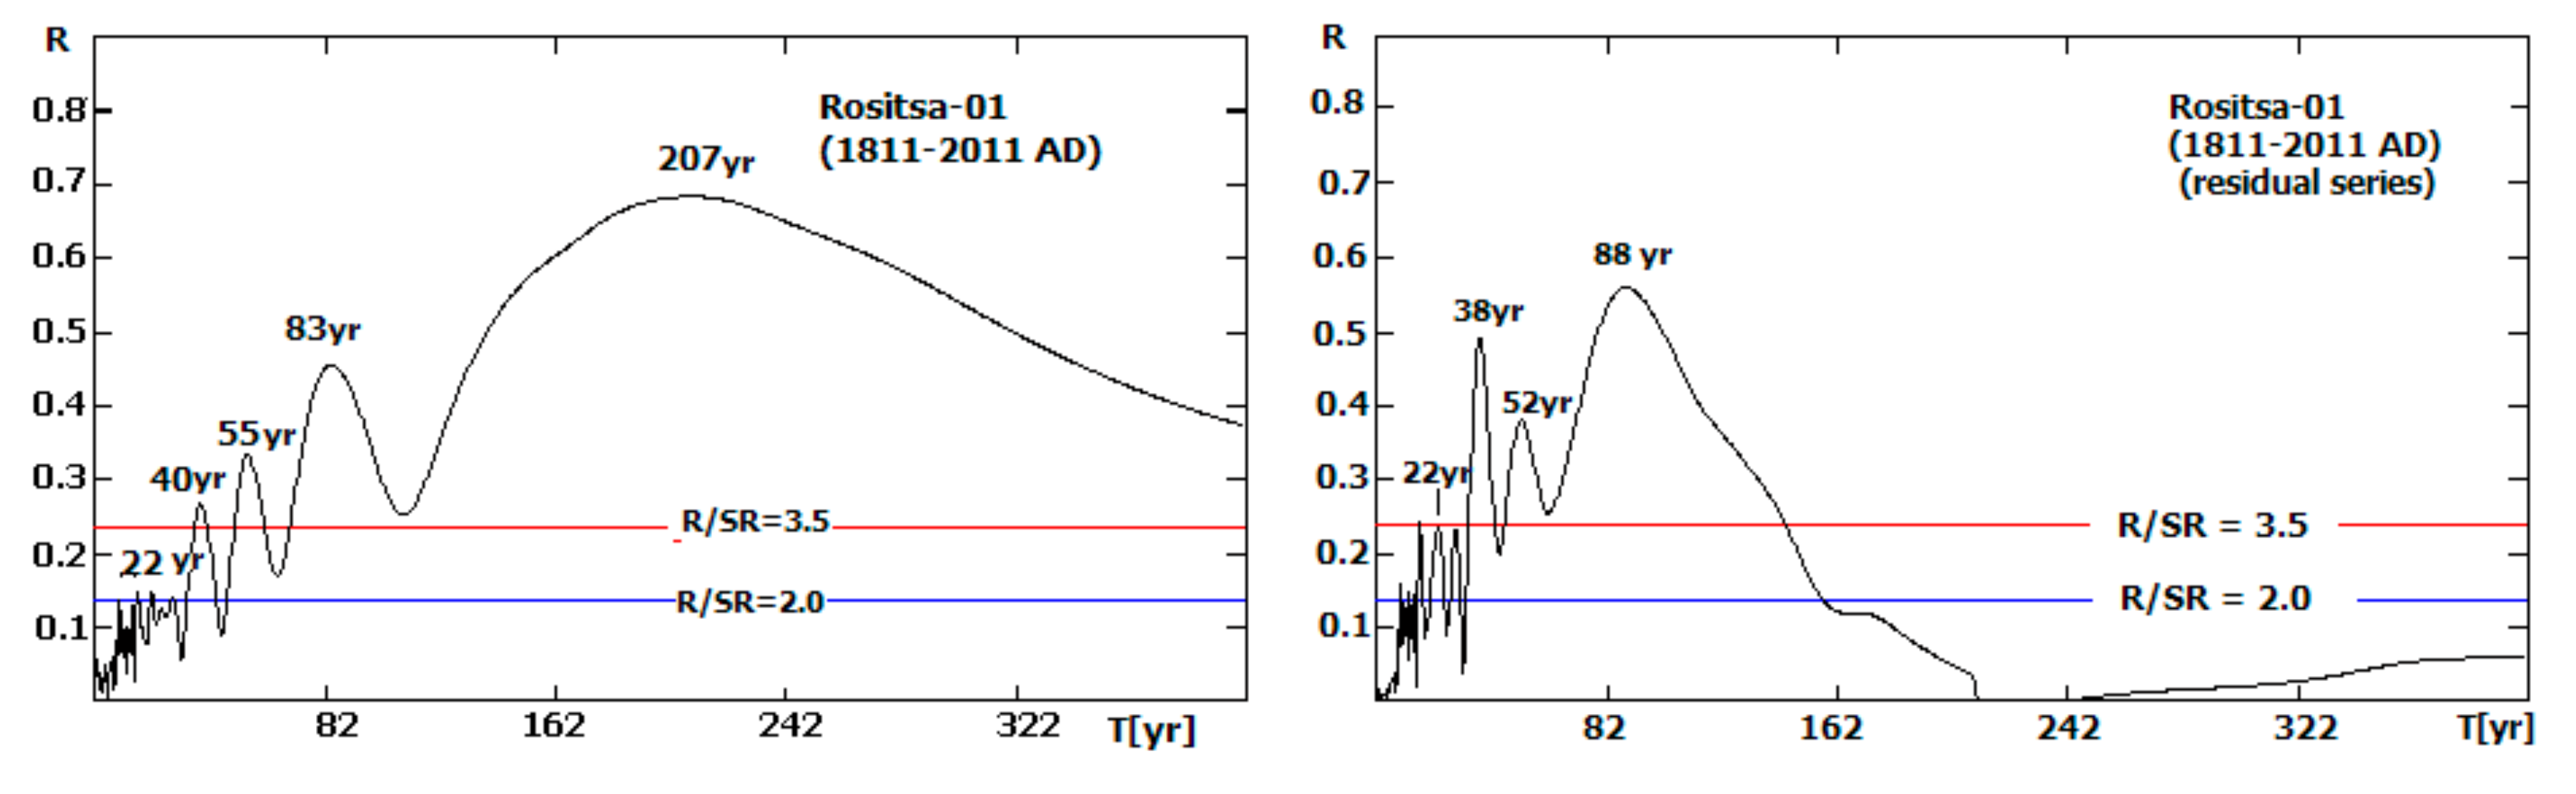
  • The ~200 year periodic type trend is very powerful in “Rositsa-01” series. Its first minimum corresponds to the Dalton minimum, the maximum to the deepest phase of Gleissberg minimum, and the second minimum to the modern epoch of low sunspot activity, which starts after sunspot cycle 22 (SC22) and continues to the present day. This fact supports our suggestion that the 207-year trend hyper-cycle in “Rositsa-01” is predominantly by solar origin and reflects the deVries / Suess cycle forcing over climate in the corresponding region. These features are very important for the main aim of our study, namely the analysis of the solar dynamo regime changes and the influence of the grand solar minima on them.
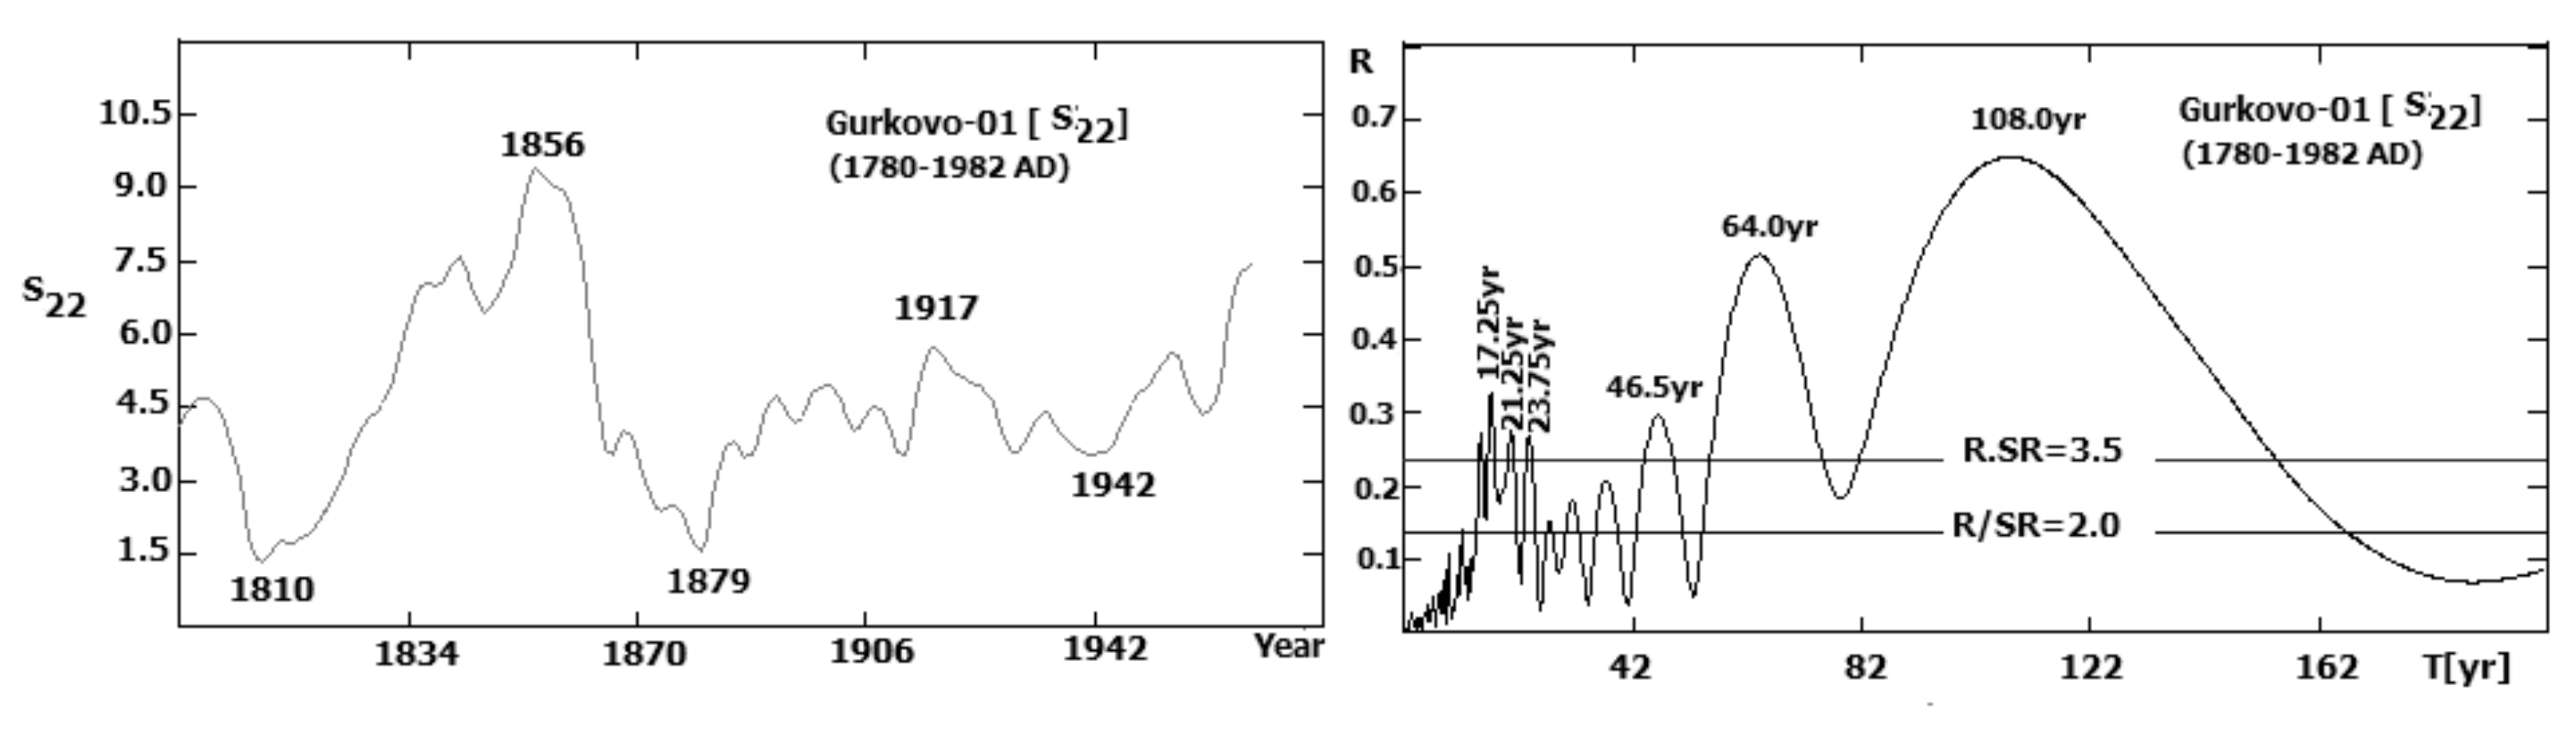
  • Another important circumstance is that unlike the other five time series, the phase shifting (delay) of ‘Dm’ to temperatures and precipitations is negligible for “Gurkovo-01” and “Rositsa-01” (0 to 1 year) [41]. This helps for better and more certain interpretation of the results in relation to climate changes, as well as to “Sun–climate” connection. That is why our present study is based on the “Gurkovo-01” and “Rositsa-01” data series.
Both beech samples have been obtained from the Central Stara Planina (Balkan Mountain Range). “Gurkovo-01” was obtained by the author in 1983 AD by occasional circumstances in almost homogenous beech forest, from a site of industrial logging on the south slope of Stara Planina (in District of Stara Zagora) and ~800 m above sea level. The terrain is sloped (~30–45°) on southwest. It is relatively dry and moderately stony. The accompanied flora was poor—mainly herbs and a few bushes. The beech sample age is 209 ± 1 years. The effective time series length (i.e., the using part after removing of the first 6 near-central tree rings data) is 203 years, which covers the epoch 1780–1982 AD.
The second sample (“Rositsa-01”) was obtained in 2012 AD in an industrial logging site ~50 km west-northwest from the “Gurkovo-01” site on the north slope of Stara Planina (in District of Gabrovo) and ~1020 m above sea level. The surrounding trees are also beech samples. The slope of terrain is ~35°, oriented on west-southwest, relatively rich in water, clay, and sand. The age of this sample is 245 ± 5 years. The effective time series of this sample is 200 years. The first 40 near-central tree rings are removed from the analysis due to bad contrast as well as to eliminate the young tree growth effect.
Stara Planina is a significant climatic boundary. On the north side of mountain range where is the “Rositsa-01” site, the main air transit comes predominantly from North Atlantic, while the air transport from south directions is significant. Over South Bulgaria, the air transition from Mediterranean Sea (and connected with it Mediterranean cyclones) plays an important role.
The terrain of “Rositsa-01” site features significantly higher underground water resources than the “Gurkovo-01” site. Taking into account the above mentioned, related to climate differences between North and South Bulgaria, it could be expected that the “Rositsa-01” tree rings width series is less sensitive to short-time oscillations like 20–22 year solar–climatic cycle as “Gurkovo-01”. The validity of this statement will be demonstrated in Section 4.
As was already pointed in Section 1, the 10–11 and 20–22 year solar cycles are basic phenomena for the solar dynamo theory [26,27,28,29]. However, a statistically significant 11-year cycle signal in the beech samples time series does not exist. This is related in some degree to the fact that the beech vegetation season is between April and October, where the 20–22 year, but not 11 year solar–climatic cycle is significant [43]. That is why our study is focused mainly on the 20–22 year cycle and its amplitude variations in both tree rings time series.

3. Methods

We used two methods to analyze the time series and determine the quasi-periodic oscillations. For quick preliminary diagnostics of the spectral structure of the time series, we used standard wavelet analysis based on a complex Morlet wavelet with a parameter ω 0 = 6 , which was realized in the standard procedure of the Matlab software package [44].
We used TR periodogram analysis [43,45] for a detailed study of the spectrum of quasi cyclic variations identified in the time series. This method approximates the investigated time series Φ(t) as a superposition of periodic functions of the type:
φ ( t ) = Y ( t ) A 0 = A cos ( 2 π t T ) + B sin ( 2 π t T )
where Y(t) are the values of the time series terms for moments t, which are defined by their number, i.e., t = 0, 1, 2 … N − 1, where N is the number of terms in the time series. A0 is the average value of the time series values, i.e., A 0 = t = 0 N 1 Y ( t ) N .
The coefficients A and B are determined by the ordinary least squares method (OLS) for each fixed value of the period T. In the standard version of TR periodogram analysis used in the study, T increases over the interval [T0, Tmax] with a linear step of ∆T. For each of the derived periodic functions (1), we calculated the correlation coefficient R with respect to the time series Y(t). The local maxima of R indicate the probable existence of cycles with lengths close to the corresponding periods T. The statistical significance of these cycles was estimated by the criterion RR ≥ 2, where σR is the standard error of the correlation coefficient, i.e., σ R = 1 R 2 N .
We used this criterion in our first TR periodogram analyses. Later, based on an analysis of 20,000 pseudorandom number series of different lengths N, we introduced a stricter criterion [45], RR ≥ 3.5. The decision of whether a maximum of R for which 2 ≤ RR ≤ 3.5 should be considered statistically significant is taken in each particular case on the basis of additional expert assessment.
It should be noted that our experiments with T–R analysis over pseudo-random number series pointed that the “3.5σR-level” is a good filter for the almost all variations belonging to “white noise” and “red noise” regions. In only ~8% cases from the studied pseudo-random number series cycles for which RR ≥ 3.5 has been found. These percentages stay almost the same and there are no significant changes if RR ≥ 3.5. On the contrary, the relative part of detected cycles significantly increases when RR decreases in the range 2 ≤ RR ≤ 3.5. That is why the viewpoint can be taken that the “3.5σR-level” is the rough lower limit for these peaks in the T–R spectra which are non-typical for the pseudorandom number series by ≥92% probability, i.e., their existence is non-casual.
An important feature of the T–R periodogram is the possibility to detect oscillations, which are comparable or even slightly longer by length to the same studied time series, i.e., general trends of simple-periodic function type (“hyper-cycles”). It is very suitable and useful in cases like in the present study, searching for the existence of very long cycle (~200 year) in time series with the almost same length. In this case a comparison of the correlation coefficient R of the periodic function to the corresponding coefficients R for other fitting function of algebraic polynomial type is recommended for deciding if there a general trend, a hyper-cycle, or if a better description is that it is a polynomial algebraic type.
The described procedure is used to obtain a series of R values depending on the period T. This series is called the “TR correlogram” or a “TR spectrum”. A function Φ(t) is then constructed based on M statistically reliable cycles. It is an approximation of the Y(t) time series (kinematic model) by the OLS with the form:
Φ ( t ) = A 0 + m = 1 M [ A m cos ( 2 π t T m ) + B m sin ( 2 π t T m ) ]
with the correlation coefficient R ( Φ , Y ) between the Y(t) time series and the Φ(t) kinematic model. F is the Fisher–Snedecor parameter whether the constructed model can be used for the purposes of forecasting, i.e.,
F = 1 1 R 2 N 2 M N 1
For each periodic function (1) the corresponding amplitude a ( T ) = A ( T ) 2 + B ( T ) 2 could be calculate. On this basis a transition from T–R spectrum to amplitude ones is possible. On the other hand, the parameter
S = T 1 T 2 a ( T ) d T
signed as “integral power index” [45] is used as an indicator of the overall oscillation amplitude in the range of periods [T1, T2].
The T–R periodogram algorithm software is also applied to be used in power step scanning regime (i.e., Tk = T0pk, where p > 1, but recommended p ≤ 1.05 and k = 0, 1, 2, 3…). A building of “scalograms” as in the wavelet analysis is also possible [x].
The climate calibration was based on the precipitation and temperature data from Pleven (for “Rositsa-01” sample) and Stara Zagora (for “Gurkovo-01”). These stations were selected based on two criteria: 1. their relative proximity to the areas in which the samples were retrieved (~35 km between Stara Zagora and “Gurkovo-01” site and ~45 km between Pleven and “Rositsa-01 one) and 2. the availability of sufficiently long series of meteorological data on precipitation and temperatures (70–80 years and more). The precipitation and temperature data were selected for the months associated with the active vegetation season of beech trees (BVS; from April to November, when the yield of both first and last month is almost negligible).

4. Results

4.1. Solar Related Oscillations in the Beech Annual Tree Ring Widths Series: The 20–22 Year Cycle

The smoothed by 5 years tree rings width time series of both samples are shown in Figure 4.
Some of the most impressive features in “Gurkovo-01” time series (left panel) are the clearly visible solar modulated quasi-cyclic oscillations by duration of ~20 years during the larger part of investigated period–since 1830 AD. The local minima of quasi 20-year oscillations of Dm correspond to maxima of even numbered in the Zurich series sunspot cycles, while the Dm maxima occur predominantly near to odd Zurich sunspot cycles maxima. This agrees with our earlier results, based on instrumental data for 20th century about tendency for drier and warmer “summer” half-year seasons (May–October) in South Bulgaria during the even numbered Schwabe–Wolf’s sunspot cycles maxima and wetter and colder ones near to even numbered sunspot cycles maxima [42,43]. The statistically significant negative coefficient of linear correlation (r = −0.69) between “summer” half-year precipitation (L) in Stara Zagora meteorological station (in Central South Bulgaria) and Dm of “Gurkovo-01” beech sample tree widths series during the epoch (1926–1982 AD) supported this statement. On the other side the statistically significance of correlation coefficient between the mean “summer” half-year temperatures θ and Dm is even higher (r = −0.71). Our analysis points out that leading factor for Dm changes is the temperature, while the relationship between precipitations and Dm is just effect of a strong anticorrelation between the precipitations and temperatures.
Our analysis also shows that not statistically significant non-linear effects in “Dm -> θ” and “Dm -> L” relationships are here, i.e., the best fitting function approximations are of the linear type. This conclusion is valid for the “Rositsa-01” sample too. Besides here are no significant phase shifting in the above mentioned relationships. The time delaying of Dm to θ is +1 year for “Rositsa-01”, while for “Gurkovo-01” it is zero [41].
The second important feature in the left panel on Figure 4 is the serious drop of 20–22-year cycle amplitude during the epoch 1790–1830 AD, which corresponds to the solar grand Dalton minimum.
On the right panel of Figure 4 the smoothed by 5 years Dm time series of “Rositsa-01” cycles are shown. There are weak 20–22 year oscillations which are superimposed over a quasi-periodic trend by duration of T = 207 years. The both minima of this bi-centurial “hyper-cycle” (also by solar origin [39,40]) are during the Dalton minimum and the present epoch of low solar activity. On the contrary, as it was already pointed out, the bi-centurial oscillation in “Gurkovo-01” series is not visible. Perhaps it is caused by the fact that this series is ended in 1982 AD, when the new long term solar minimum had not yet started.
This comparison is useful because it demonstrates the significance of a large number of conditions, which are strongly necessary to taken into account a more precise analysis of the “Sun–climate” relationships and interesting events in solar dynamo regime changes in the past. “Gurkovo-01” is essentially better for studying the much more shorter time scale effects due to the better manifestation of the solar 22 year magnetic cycle.
It has been established in our previous studies that the statistically significant quasi periodic oscillations in “Gurkovo-01” time series by duration of 17.25, 20.75, 23.75, 46.5, 64.0, and 108.0 year are well detectable. They all have analogs in solar and geomagnetic activity, except the 46.5 year one, whose origin is in our opinion unclear on this stage. The 64.0 and 108.0 year are the most featured from all oscillations. Their peak correlation coefficients R are 0.515 and 0.649 respectively. There are also few weaker expressed cycles by duration of 12, 15.25, 27.25, 31.25, and 37.25 years. The 31.25 year cycle is equal to ~3 Schwabe–Wolf’s sunspot cycles and could be also considered as resonance connected to the 64-year cycle.
The “Rositsa-01” T–R spectra contains statistically significant oscillations by durations of 38.5, 54.5, 83 and 207 years [40,41]. The first one has analog in geomagnetic activity, while the other three have both geomagnetic and sunspot activity. The 207 year oscillation (hyper-cycle) in this series corresponds to the bi-centurial solar deVries/Suess cycle. The last one is also well expressed in other dendrochronological series (as an example for Juniperus turkestanica, see [5,46]) As it has been pointed out above, the quasi-decadal oscillations (~20 year) in “Rositsa-01” are very weak and it is also shown on the T–R correlogram (Figure 5 left panel). That is why the “Rositsa-01” time series variations are a good indicator for the long-term solar dynamo changes and long solar –climate tendencies, but essentially less sensitive in short time scales. However, the 17, 22.5, and 30 year oscillations are very well expressed in “residual” series, i.e., if a demodulation procedure over the 207 year trend-hyper-cycle is provided (Figure 5 right panel).
As it is shown on the right panel of Figure 5 an 88 year cycle, which is analog of the solar 88 year Gleissberg cycle is the best expressed oscillation in the residual series. In second place, there is the 38 year oscillation, which could be taken as an analog of the hydrological so called “Buchner cycle” [47], as well as the 52 year (solar modulated [2,3]) and the all three oscillations by 17, 22, and 30 years.
A more detailed analysis for the 20–22 year oscillation changes in “Gurkovo-01” series has been made by calculating of the integral power index S22 (Figure 6). For the aims of the present study, the possible interval of solar magnetic (Hale) cycle and corresponding to him climate and tree ring widths were chosen to be 18–24 years. The time series of S22 is shown in Figure 6 (left panel), while the corresponding T–R spectra is shown on the right panel. The sharp fading of S22 during the Dalton minimum was follows by epoch of significant higher mean level in the middle of 19th century. Since approximately 1860 AD (i.e., the sunspot cycle No 10 (SC10) maximum) a sharp downward tendency begin, which reach his minimum at ~ 1910–1912 AD. S22 is going up after that up to 1927–28 AD. There is a shallow minimum near to 1940 AD. The epoch since 1940 and up to 1980 (Zurich solar cycles No 17–21 (SC17–21)) is featured by a general increase of 20–22 year cycle amplitude. As it could be seen in the T–R correlogram (Figure 2, right) the 20–22 year cycle amplitude is modulated mainly by the 108.0 year cycle and in second place by the 64.0 year one. The third important cycle is by duration of 32.5 years and most probably it is in a resonance relationship with the 64 year one.
Quasi 60 year oscillations are detected in many phenomena in space and Earth climate. A ~62 year cycle has been obtained in middle latitude aurora (MLA) historical time series and “cosmogenic” isotope 10Be abundances in Greenland continental ice core “Dye-3” [48,49]. These facts lead with a very high probability to a hypothesis that the ~60 year cycles have a solar origin. The problem is very intriguing of taking into account that there is no strong manifestation of cyclic variability by length of 5 or 6 sunspot cycles in sunspot indexes or they are weak if they exist.
It needs to be specially noted that a cyclic tendency of ~60–65 years follows from the results in study of Georgieva [50] concerning the possible origin of the Schwabe–Wolf’s cycle double peaked structure and the Gnevishev’s gap between them. Based on sunspot activity data for 20th century, she suggests that the both peaks of the ~11 year sunspot cycle are caused by two types of plasma transport in Sun’s convective zone-advective and diffusive. Every one of these two types gives its separate part in sunspot activity, which maxima are shifted meanly on 1.5–2 years each from other. They correspond to both main peaks of sunspot activity in Schwabe–Wolf’s cycle. In our opinion, there is an oscillation variable regime of both types of plasma transport by length of ~ 6 Schwabe–Wolf’s cycles, i.e., ~60–70 years. The order reverse of the both sunspot peaks (“advecive –diffusive” to “diffusive -advective” and on the contrary) occurs meanly on 3 sunspot cycles, i.e., approximately 30–35 years. Thus the ~60–65 year cycle could exist in solar dynamo regime changes without any strong manifestation in sunspot activity indexes. On the other hand, this phenomenon seems to play role in manifestations of solar flares, coronal mass ejections (CME) as well as the solar wind parameters, geomagnetic storms, and aurora activity [51].
We find that the detected the “Gurkovo-01” sample series main local extrema of S22 are in good coincidence with the double types of plasma transport scheme since the beginning of 20th century, thereafter, enough certain corresponding data from the sunspot observations are extracted. Due to this 60 year cycle there is an interleaving of 20–22 year cycles by high, moderate and weak cycle magnitude in the tree ring widths data, which is very well expressed in “Gurkovo-01” beech sample.
A 60–70 year cycles are detected in many Earth climate parameters–for example in the Northern hemisphere temperatures [52]. Quasi 60 year variations have been detected in North Atlantic Oscillation behavior [53].
It needs to be noted that a solar cycle by duration is slightly more than a century (~110–120 year) and its relationship to differential solar rotation was discussed by Javaraiah [54]. That is why the 108 year cycle in S22 time series could be considered the analog of the last one.
Similar procedures for investigation of S22 parameter behavior for “Rositsa-01” sample have been provided (Figure 7, left panel). As shown on the right panel of Figure 7, the 20–22 year oscillations in this time series are modulated mainly by 86 year and 33 year cycles. The first of them is very close to the solar quasi centurial Gleissberg- cycle (80–90 years, 7–8 sunspot Schwabe–Wolf’s cycles), while the second one (3 sunspot cycles) is a second resonance of the ~60 year. It is interesting that all main local S22 minima for the “Rositsa-01” sample closely coincidence by time with 11 year sunspots minima (1843 AD–to the minimum of SC9, 1856 AD–to SC10, 1879 AD–to SC12, 1923 AD–to SC16, 1944AD–to SC18, 1954–to SC19, and 1976–to SC21). The deepest from all these minima is in 1923, i.e., during the Gleissberg’s grand solar mimima. However, it is obvious that there is a significant difference between S22 dynamics between “Gurkovo-01” and “Rositsa-01”, which by authors opinion reflects the different features of atmospheric transport between both sides of the Stara Planina.
Unlike the “Gurkovo-01” series there is no well-expressed minimum of S22 parameter during the Dalton minimum in “Rositsa-01” series. There is a simple explanation for this—the “Rositsa-01” series starts in 1811AD, i.e., on 31 years further as “Gurkovo-01”. By this one the deepest part of the Dalton minimum between 173/94 and 1810 AD is not included in this series.

4.2. The Beech Tree Rings Widths, Dalton Minimum and the Problem about the “Lost” Sunspot Cycle at the End of 18th Century

In our opinion, the relative high sensitivity of “Gurkovo-01” to the short scale solar activity oscillations like 20–22 year Hale cycle opens a possibility for more detailed study of the solar activity long term changes effects such as the transitions from high solar activity epochs to grand solar minima. In the “Gurkovo-01” time series such phenomena could be observed in the end of 18th century–the very long transition epoch between sunspot cycle No 4 (SC4) and the weak next SC5. According almost all researchers it marks the beginning of grand Dalton minimum (1798–1830 AD). An exclusion of this “consensual” scenario is the suggestion for an additional weak and short “lost” sunspot cycle after SC4 [55]. This weak sunspot cycle (SC4’) should be started in 1793 AD and ends approximately in 1799/1800 AD. This hypothesis was very popular in 2000th, but finally it was not appropriated. However, all researchers agree that there was occurs an unusual sunspot activity behavior in 1790th, which indicates for a serious corruption of Schwabe–Wolf’s cycle during this time.
In Figure 1, the mean calendar moments of even numbered sunspot cycles maxima are signed by black circles, while the odd numbered sunspot maxima are signed by gray circles. The possible calendar moment (~1796 AD) of the hypothetical “lost” sunspot cycle SC4’ maximum is signed by “⊗”. As it shown the maximum of the even SC4 sunspot cycle coincided with an inflection on the graphics of Dm, while the smoothed moments of the remained even sunspot maxima correspond to Dm minima, i.e., local temperature maxima and precipitation minima. The “inflection” near to SC4 is very short and it was followed not by increasing but by an unexpected and even more strong and continuous decline. The smoothed maximum of the next odd numbered SC5 corresponds to weak Dm maximum. Thus, a serious damaging of 22 year solar cycle influence over tree ring widths growth during the last decade of 18th century is shown. The “critical” moment is 1793 AD where in our opinion occurs the real start of Dalton minimum. The typical declining phase of sunspots in SC4 was break near to this calendar year, as it seems suddenly by some new phenomena, which forced the sunspot activity fall. Such phenomena potentially could be the Sun’s tachocline region sinking. As it is shown on the same panel SC5 maximum corresponds to a weak, but clearly visible Dm maximum. This fact indicates that there is no change in “Dm-22 year solar cycle phase” relationship between SC4 and SC5 maxima. Consequently, there is no indication for some additional Schwabe–Wolf’s cycle at the beginning of Dalton minimum.
There is an indication about one significant “surplus” Dm minimum near the end of the19th century (~1898/1899 AD, see Figure 1 left panel). It is not in coincidence with even numbered sunspot cycle maximum, but with the minimum of the even SC14. This calendar moment is also estimated as a start of the grand Gleissberg sunspot minimum (1898–1923 AD). Most probable a sinking of Sun’s convective zone lower boundary (tachocline) also occurs. This phenomenon is not clearly visible in the “Rositsa-01” time series particular due to the low sensitivity of this beech sample to the 20–22 year oscillations.

4.3. The Kinematic Models and Their Extrapolations

4.3.1. “Epignosis Test”: Gurkovo-01

The TR correlogram of the “Gurkovo-01” sample smoothed series was used to construct a kinematic model with extrapolation into the future from 1982 until 2012 AD [41]. The model and its extrapolation are shown in Figure 8 (left panel). The correlation coefficient between the model and the data was found to be R(Ф,Y) = 0.83. The corresponding Snedekor–Fisher’s parameter is F = 3.12, which is significantly above the critical threshold F = 1.53 with a 95% confidence level. Since the model was derived from a time series which ends in 1982 AD, i.e., about ~38 years ago, the extrapolation after the last calendar year can be used for an epignosis test of the assumption on the degree to which kinematic models of this type can serve the purposes of forecasting.
These results led to the conclusion that the extrapolation of the kinematic model in Figure 8 (left panel) predicts a low increase of ‘Dm’ for the “Gurkovo-01” beech sample and, simultaneously, the onset of a generally hot and arid climate in central Bulgaria after ~1980 AD and until the 2010s. Conversely, this extrapolation gives indirect evidence to support the assumption of the onset of a new Dalton-type solar minimum.
In the first years from 1982 to the maximum of cycle 22 (SC22), the decrease in the annual tree ring widths Dm fits into the usual drought-and-warming tendency within the quasi-20-year variation. However, the forecast predicts that the subsequent growth within the cycle should soon stop, and the tendency should return to lower Dm and the onset of arid and hot conditions in the second half of the 1990s. In line with the above, as shown in Figure 8 (left panel), the “regular” maximum of Dm in SC23 around the year 2000 should in fact be very weak.
The forecasts predict that the epoch of weak growth of the “Gurkovo-01” tree sample and, hence, of an arid and hot climate will last until the maximum of cycle 24 (SC24), i.e., until about 2012–2014.
The actual behavior of the climate in central Bulgaria proved to be very consistent with the forecast segment in Figure 8 (left panel). From 1983 to 1990, there was a series of mostly hot and arid agricultural vegetation seasons (April–November). After 1990 AD, one could observe a weak tendency for higher precipitation and lower temperatures until 1996 AD, and the vegetation seasons were mostly arid and hot for the next 15 years. Extremely arid and hot seasons occurred in 2000 and 2007 AD.
Comparing the left and right parts of Figure 8 (left panel), it can be seen that they are largely similar. Thus, we can state that the “Gurkovo-01” kinematic model successfully served as an epignosis test with respect to the onset of a new Dalton-type grand solar minimum at the turn of the 21st century. The onset of an epoch of a long decrease in the magnetic flux and sunspot activity has been an indisputable observational fact starting from cycle 23 [56]. A more thorough analysis showed that the main event associated with the start of a new lasting grand solar minimum should be attributed to a time point 2–3 years after the maximum of cycle 22, i.e., around 1992–1993 [57].
One should also bear in mind that the kinematic model, which was successfully used for epignosis, and the corresponding conclusions were obtained based on data from an interval not much longer than 200 years. As a result, it appears that the onset of a hot and arid epoch between 1982 and 2012 in Central South Bulgaria can be well explained by the established cyclic variations of the last ~200 years, without allowance for any additional causes. The unaccounted contribution by its nature weak general trend dD/dt = −0.0053 mm/year has no significant effect on the overall picture.

4.3.2. “Rositsa-01”

The “Rositsa-01” sample, which was obtained on the northern slope of the Central Stara planina, exhibits an almost complete absence of a phase shift for the Dm parameter (annual tree ring width) with respect to the precipitation L and temperature θ in Pleven station for the 1903–1994 AD epoch The coefficient of linear correlation between Dm and θ is r ≈ −0.67 and F = 1.81, while with L it is r = +0.44. As in the case of “Gurkovo-01” the best fitting function is between Dm and θ and it is linear, this sample shows a good consistency of the local minima of Dm with the near-maximum phases of even numbered Zurich solar cycles. Thus, the behavior of the “Rositsa-01” time series roughly resembles that of the “Gurkovo-01”. Thus, the presence of these 20-year cycles makes it possible to extrapolate the “Rositsa-01” kinematic model not only as an indirect indicator of the local climate, but also as an indicator of solar activity until 2045 AD.
The kinematic model (continuous line) and the smoothed data until 2009 are shown in the right part of Figure 8 The extrapolation after 2009 AD is shown. The black circle symbols indicate the approximate calendar times of the near-maximum phases in cycles 24, 25, and 26 (SC24, SC25, and SC26).
The actual pattern of Dm behavior for the Rositsa-01 sample in 1980–2009 AD fits into the general tendency of an arid and hot climate in Central North Bulgaria, which is also consistent with the general decline in solar flare activity. Since the 1970s, there has been a downward trend in the frequency of X-ray averages and powerful class-M and class-X solar flares and in the frequency of radio flares. After the maximum of cycle 22, i.e., in the early 1990s, a significant, long-term, downward trend began in almost all the observed solar indices and in the geomagnetic Aa index [57]. A downward trend in the Ap index that had been tracked since the end of cycle 19 was characterized a few years earlier [58].
The galactic cosmic ray (GCR) flux in the Earth’s atmosphere exhibits an inverse relationship with the sunspot activity. Conversely, generally high GCR flux values stimulate the formation of aerosols and clouds and, hence, lead to climate cooling [32,33,59]. However, there are some additional details that make the description of the above mentioned processes more complicate. The last ones will be discussed in Section 5.
In the modern epoch, the long-term upward trend of the GCR flux began after the extremely deep minimum in 1991, which corresponds to the beginning of the general long-term decline in solar-wind parameters and sunspot and geomagnetic activity in the Aa index. This growth manifests itself more vividly in a decrease in the depth of the minima in the near-maximum phases of SC23 and SC24 than in the growth of the corresponding minima [57].
Based on the extrapolation of the kinematic model for the “Rositsa-01” sample, Dm begins to grow slowly around 2008/2009, i.e., around the solar minimum between cycles 23 and 24. This growth manifests itself in a weak positive trend for precipitation L and a fall in average temperatures. This trend is superimposed by weak variations, including a minimum that coincides well with the maximum of SC24 and a maximum that is likely associated with that of the next SC25.
In our opinion, the very small amplitude of these variations is indirect evidence that the amplitude of the 22-year magnetic solar cycle, including cycles 24 and 25 of the Zurich series, will be small. Hence, it follows that if this forecast is correct, then the Zurich cycles 24 and 25 (SC24 and SC25), in relation to sunspot activity, should be expected to be weak with almost similar amplitudes. As of today (March 2021), this indirect forecast for cycle 24 can be considered successful. Its average annual maximum, which is manifested in the classical index Ri ≈ 80 in the new system introduced on 1 July 2015 [60], corresponds to Sn ≈ 120. It represents the weakest Schwabe–Wolf cycle, at least after cycle 14 (SC14; 1902–1913) and, very likely, after cycle 6 (SC6; 1810–1823) during the Dalton Minimum. As for cycle 25, most of the existing forecasts show that it will be close to cycle 24 or slightly more powerful [30], but some forecasts also predict that cycle 25 will be weaker [61].
The model extrapolation in Figure 8 (right panel) shows a change in Dm growth from a slow rate to a much faster one near 2030, when one should expect a minimum between SC25 and SC26. This steep upward trend continues up to the end of the forecasting interval, i.e., until 2045. Interestingly, the local Dm minimum, which would correspond to the maximum of the even SC26, does not stand out. A possible explanation is that either the amplitude of cycle 26 will be very weak, or it will be suppressed by the next, more powerful cycle 27.

4.3.3. The Sunspot Zurich Series Kinematic Models and Their Extrapolations

To test this assumption for suppression of SC26 from the next SC27, we conducted a TR periodogram analysis of the monthly average indices of the Zurich series (1749–2014 AD) in the previous, classical version of the Ri index. Based on the T–R correlogram, we constructed a kinematic model and extrapolated it up to solar cycle 30. The resulting kinematic model and extrapolation are presented in Left of Figure 9 (upper panel). The forecast data for cycles 24–27 show good agreement with the previous findings. The results confirm the preliminary assumption that the weak SC26 will be suppressed by the next, more powerful SC27. Forecasts predict a very shallow minimum between these cycles around 2038–2040 AD. Therefore, in the epoch of the minimum between SC26 and SC27, the simultaneous existence of many active centers belonging to both cycles is expected.
The above mentioned conclusion about the “attenuated” SC26 by the next SC27 is almost fully confirmed again in a new model test. It was provided on this time on the basis of the new Zurich series version by using the new International Sunspot Index (SN_v2), which replaces the “classical” Ri in 2015 [56]. On Figure 9 (lower panel) the kinematic model of the monthly mean SN_v2 values for the Jan. 1749-March 2021 AD epoch and its extrapolation until 2045 AD is shown. The shallow minimum between weaker SC26 and higher SC27 is visible again. In both extrapolations on Figure 9 a continuous epoch of relatively weak sunspot cycles is well shown at least until ~2080 AD. It is clearly separating on two stages–the first one between SC23 and SC27 and the second one after that. According to the both plots the violation of “amplitude” G-O rule for the pair even-odd numbered cycles SC24–SC25 (weaker SC25 than SC24) is a very probable event. A second G-O rule violation for the pair cycles SC28-SC29 is too possible.
From the perspective of the solar dynamo theory, the shallow minimum between SC26 and SC27 could correspond to the mixing of matter flows associated with both cycles in the Sun’s convective zone. It is possible that a similar process could lead to the rapid attenuation of the convection from the weaker SC26. Other authors reached similar conclusions about cycle 26. A forecast for the weak cycle 26 is also given by Javaraiah [61] as well as by Zharkova et al. [62]. The last one is based on mixed (empirical + theoretical) solar dynamo model type. It is very interesting that according to this forecast the weak SC26 is followed by an relative higher SC27 and after that an general decreasing of sunspot Schwabe–Wolf’s cycle amplitude until to SC30. It is generally in very good agreement with our extrapolations on Figure 9 and a serious support of them.
It is the suppression of SC26 that could explain the absence of a local minimum in the behavior of the Dm parameter around 2035. This, in turn, leads to the conclusion of the onset of a very cold and humid climate in the Central Balkan Mountain Range and correspondingly Central North Bulgaria in 2030–2045. It is in agreement with our more generalized results based on kinematic models of the seventh oldest beech samples aged over 200 years [41].
It should be noted that forecasts of an epoch of low Schwabe–Wolf solar cycles, which as an epoch very similar to the Dalton or Maunder minima were obtained as early as 15–20 years ago by several authors [63,64,65,66]. As it pointed out in Section 1, cooling of the Earth’s climate in general or in separate large regions is examined in connection with these solar epochs in many studies. It could also add to them the mentioned above work of Zharkova et al. [62].

5. Discussion

Evidence about successful using of some tree ring data series for “Sun–climate” relationships and solar dynamo regime investigations on the basis of the results and their analysis are given in this study. Such data series, obtained from long lived (age ≥ 200 year) could be a good indicator for the reconstruction both of terrestrial and space climate in pre-instrumental era. The last statement is strong valid for the beech (Fagus sylvatica) samples because the typical lifespan of this species is ~300–400 years in Bulgarian mountains. In some separate cases the lifespan exceeds 500 years, which could be made the solar–climatic relationships study during the Spoerer (15th century) and Maunder (17th century) grand solar minima also possible. A serious advance regarding the beech samples from territory of Bulgaria is the almost full absence of significant general trends in ‘Dm’ time series, caused by the “age-effect”. This statement is not valid for pinopsida (pine and spruce) and oak, for which significant trends, caused by “age effect” were detected in the course of our studies [39,40].
However, in the present moment this possibility is rather theoretical than real. It is due to the fact that during the last 3–4 decades a significant part of the oldest beech samples have been already logged. An additional problem is the circumstance that the largest part of all aged trees on territory of Bulgaria are with a safe status. That is why obtaining beech samples older than 240–250 years is very difficult.
As it has been already pointed at the beginning of the paper, there is a high statistical noise in the annual tree ring time series and it is very high for the dominating part of the samples due to the mentioned in Section 1 reasons. Solar modulated cycles by duration of 20–22 year and statistical probability >95% are detected in significant part (~60%) of all studied 45 tree samples [39,40]. However, on the other hand by author’s opinion only in ≤10% of all cases these oscillations are so clear detected and without essential phase delay to the solar magnetic field changes as in “Gurkovo-01” and “Rositsa-01” probes if the tree samples choice provides on wholly casual principle. That is why the tree samples selection in accordance with the described in Section 1 requirements should be provided. Besides, the climatic calibration and data analysis should proceed for every tree sample separately. All generalizations concerning climate and solar–climatic relationships should be made only on the basis of the final results for the separate samples. In our opinion, any preliminary procedures as Dm data averaging for the all tree samples from different terrains and many other environmental conditions and the further analysis over the so obtained “super-sample” data set are principally incorrect.
The presented results and their analysis indicate for the multi-component physical nature of “Sun–climate” relationship during the last ~200–250 years. It is very complicate and cannot explain the observed annual tree ring widths variations and the corresponding temperature and/or precipitation quantities changes based only on solar electromagnetic flux (TSI-index; TSI-Total Solar Irradiance) changes effects. This is proved by the low presence or total absence of statistically significant quasi 10–11 year oscillations in the whole our collection of dendrochronological data from Bulgaria, i.e., the all 45 tree samples. The last ones are the strongest quasi periodic feature of TSI–variations according to the satellite observations since 1978 as well the long term extrapolations for the last ~400 years (see Lean et al., [67], Krivova et al., [30]). On the other hand, according these as well as other authors too, some large time scale effects should be exist. In our case they could have some participation in detected there sub-, quasi- or bi-centurial oscillations.
According to the most of authors the quasi bi-centurial solar related temperature oscillations are in coincidence with the phase of quasi bi centurial deVries/Suess cycle [5,6,59]. This is valid for large continental regions in North America, West and North Europe, Central Asia, Siberia, East and South-East Asia, India, North and Central Australia, South Africa, Patagonia, the Pacific Seaside of Central and South America and the Atlantic Seaside of Africa as well as for the tropical and equatorial parts of Indian ocean and the most west and most east parts of Pacific according to the results of Wang et al. [68].
However, from other hand according to the same study there are also few relative smaller total area regions where the 200-year solar cycle is in opposite phase to the corresponding bi-centurial climate oscillations. Such territories are the south -west region of USA, Mexico, the north part of Caribbean Sea, West Greenland, the sub-tropical regions of South America, the region of Balkan peninsula + Black Sea + Anatolia + Levant + Egypt as well as Kamchatka Peninsula). In our option, it is complicated in this stage to determine is there any general reason for the origin of all such regions, but some tendencies could be noted. For example, the above mentioned regions in North and South America as well as the region of Balkans and Near East are placed mainly in corresponding sub-tropical zones or directly adjacent to them from the higher latitudes side.
The typical short solar-modulated climatic oscillations for these regions during the warmer part of year or the whole year is by duration of ~20–22 years, i.e., it corresponds to the magnetic solar (Hale) cycle [4,43,69]. It was already point in Section 2.1 that the climate in South Bulgaria is significantly connected to the Mediterranean cyclone activity. The origin of the last ones is related to the Iceland baric center activity and the manifestation of interaction between meridional and zonal atmospheric transport over Europe. It has been noticed by row of researchers else in the middle of 20th century the 20–22 year oscillation is a well-expressed feature in the Iceland baric minimum activity [69,70,71]. Rubashev [70] point out that the epochs of strong zonal atmospheric transport over North Atlantic and Europe is significantly related to the even numbered Zurich sunspot cycles, while the meridional atmospheric transport forcing–to the odd numbered ones. This statement well corresponds to the so called “Brown effect”- a tendency of shifting the cyclones trajectories over North Atlantic on south during the epochs of high solar activity [72].
It is interesting also to note in this course that the reverse correlation between the beech samples tree ring widths (Dm-parameter) and temperatures in Central and South Bulgaria corresponds well to similar relationship between temperature and beeches tree rings widths for Sicily (Italy), which was described by Simunek et al. [12]. It is an additional support for our conclusions for the Mediterranean origin of 20–22 year cycle in climate of Bulgaria and its connection to the Mediterranean cyclone activity.
It should be noted in this course that the “amplitude” Gnevishev-Ohl’ s rule [73] according to which the amplitudes of even numbered solar cycles is weaker as the followed them odd numbered ones is valid in the whole period of sunspot cycles SC10-SC21, i.e., between 1856–1986 AD. On the other hand, the integral sunspot activity during the even numbered cycles is smaller as in the followed odd numbered ones (the “classical” Gnevishev-Ohl’s rule [74]) for the whole period 1810–1986 AD, i.e., since SC5. The 20–22 year cycle the existence in atmospheric circulation (and “Brown effect”) over North Atlantic and Europe during the 19th and 20th centuries is probably caused in high degree by the Gnevishev-Ohl’s rule effect. For its part, the last one reflects over the Mediterranean cyclones generation and as a final result, over the temperatures and precipitations in the southern and central parts of Balkan peninsula (Greece, Albania, North Macedonia and South and Central Bulgaria). In our opinion that is why the 20–22 year cycle effect is well expressed in instrumental meteorological and dendrochronological data from Bulgaria during the last two centuries.
A significant role could be also played by the dipole magnetic field sign reverse, due the corpuscular nature of the 20–22 year solar–climatic cycle phenomena (see below). This reverse lied to alternative interaction (coupling) condition changes between the magnetic lines of the Earth’s magnetosphere and interplanetary (i.e., Sun’s) magnetic field.
There are many studies since the middle of 20th century concerning the problem of the physical mechanisms of the “solar activity–atmospheric circulation” relationship. A good overview of interesting works until ~1975 AD is given in the monograph of Vitinsky et al. [71]. According to this overview as well as from many other studies (for example Schuurmans and Oort [31]) very important role in dynamics of baric structures in North and Middle Atlantic plays the high energetic solar protons by energy E ≥ 10 MeV, i.e., the so called “solar energetic particles” (SEP) or solar cosmic rays. The primary sources of SEP are the solar proton eruptions (SPE). The last ones are generated very often during the moderate and strong solar flares (X-ray power class M or X). A significant part of SEP is generated also by shock waves on the top of the interplanetary coronal mass ejections (ICME).
It is interesting that according to the corresponding modeling results the dynamical effect over the atmospheric baric structures from the penetrating to the boundary “stratosphere–troposphere” SEP depends more on energy (~E3) than the time of exposition. In this model the dependence (from the time) is linear [71]. The last one opens the possibility that relative short phenomena as SPE could to affect seriously the statement of large baric structures like Iceland baric minimum and Bermuda-Azores High (Anticyclone). Atmospheric circulation effects (including also meridional air mass carryng) over significant parts of Northern hemisphere could be observed as a result from these processes. These processes could affect more efficiently the temperatures and precipitations in the periphery of Atlantic cyclones action (for example South-East Europe, Anatolia, Black Sea), but not over tropics or inner parts of Eurasia, where the effective SEP penetration in lower atmosphere is small or absent or in the inner parts of Eurasia, which are too far from the Iceland baric center. The above described effects over temperatures and precipitations should be also less or non-remarkable if the corresponding regions are too close to the Iceland baric center, which are continuously under action of the last one.
If the G-O rule is valid the flare and SEP activity during the odd numbered solar cycle should expect to be higher in relation to the corresponding even numbered one in even-odd numbered pair. Taking into account the above described role of SEP events this is an argument for the corpuscular nature of the observed during the last ~200 years climatic 20–22 year cycle.
As it has been pointed by the author [48,51], the primary sources of ~60 year temperature oscillations are related most probably to the SPE phenomena, which are in close relationship to the solar flare activity. The modulation of 20–22 year oscillations from the ~60 year cycle in our dendrochronological data has been already described in Section 4.1.
As follows from the above described possible role of SEP the manifestation of 20–22 year solar climatic cycle should be decreased during the epochs of grand solar Dalton-type minima. The last one is confirmed by the present analysis of dendrochronological data and their instrumental data calibration. This statement is supported by the analysis of the corresponding data from the USA which has been provided in 1970th [4].
The galactic cosmic rays (GCR) variations are another primary extraterrestrial source which could affect the atmospheric circulation due to mechanisms, similar to the described above. The mean energy of coming to the upper Earth’s atmosphere GCR fux is essentially higher than SEP flux during the SPE events. That is why they could efficiently penetrate to the troposphere not only over middle and high latitudes, but over the tropical zones too. The problems about GCR effects over the atmospheric circulation are studied by Tinsley [72]. The GCR flux is maximal during the solar sunspot minima epochs due to the reduction of the general screen effect by the heliosphere (one of the so called “Forbush effects”). If it takes also into account the aerosol and clouds generation forcing [32,33], it follows the overall effects of cooling, atmospheric instability, and precipitations increasing over large parts of Earth surface during the grand solar minima epochs. The exceptions are separate regions like Balkan peninsula, South Brazil/North Argentina, or southwest USA.
However, the above mentioned mechanism for “GCR flux–climate” relationship seems too rough and it works well only in large time scales and long time epochs like the grand minima. In time scales that are less than century there are a number of additional phenomena which could destroy the general reversed “sunspot activity- GCR flux” and “GCR flux–mean Earth temperature” relationships. In our opinion, there are at least two natural phenomena, which have a potential for this one:
  • The solar flare + SEP activity, as was already described above, relates to the quasi 60 year climatic oscillation, which is detectable in Greenland ice (“Dye-3 core) 10Be concentrations data series, and aurora activity [48] as well as for the mean annual North hemisphere temperatures and World Ocean temperatures [51]. It is interesting also to note some extremely powerful SEP events in the past (most probably near to 11 year sunspot maxima epochs), which seriously affected the GCR –flux during the corresponding calendar epochs (in 665–663 BC, 775 AD, and 993 AD). They are detected on the basis of high precise mass-spectrometric measurements of 14C tree rings concentrations [75,76,77].
  • The volcanic activity is the other important factor. The GCR influence over atmosphere is realized due to interaction between cosmic particles and atmospheric water vapor, but the aerosol production process is much more effective when the concentrations of volcanic materials (acid gases and dust) is high. Thus, the current volcanic activity depends on how effective be the “GCR –aerosol + clouds generation” mechanism will be. On other hand there are evidence that the powerful volcanic eruption phenomena, the corresponding eruptive index VEI ≥ 4 are modulated by solar activity on the basis of “trigger effect” (Komitov and Kaftan [78]). The effect is important during the near sunspot activity extremes phases, which makes the overall “Sun–climate” relationship much more complicated.
Thus, finally it could be concluded that the general observed picture of “Sun–climate” relationship and over Balkan peninsula in particular is in much better agreement with the SEP/GCR mechanisms as with these based on solar electromagnetic changes effects. The role of TSI-index variability in our opinion is relatively small.
The prediction of Dalton-type grand minimum in 21st century is closely connected to the questions: What are the basic features of these solar phenomena? How continuous and how deep must they be to be marked as “grand minima’? This is an important moment, due to the fact that some authors suggested that Dalton minimum is a specific intermediate solar dynamo state between grand minimum and ordinary activity [29].
In our opnion, there are two phenomena, which could be used as a criteria to determine if there a grand (super-centurial) solar minima or not.
The first one is that the corresponding epoch is superimposed over the downward or near-minimum phase of the ~200 year de Vries/Suess oscillation. This could be tested by using many of the available time series analysis, including the T–R periodogram algorithm. According to the last one there was a 200 year cycle minima that occurred in 1856 AD [65]. The epoch 1793/98–1830 (Dalton minimum) is superimposed over the downward phase of this cycle.
The second feature is the existence of G-O rule violations during the downward phase of a 200 year cycle. The last one is an indicator for significant long time change in the solar dynamo regime and is a precursor for super-centurial Dalton-type or Maunder-type grand solar minima [66]. This requirement is valid for Dalton minimum as well–there is a very serious G-O violation for the pair sunspot cycles with Zurich numbers 4 and 5 (SC4 and SC5). That is why we conclude that the Dalton minimum is a real super centurial grand minimum, like those of Oort or Wolf.
According to this determination the new epoch of low sunspot activity in 21st century will be super–centurial (Dalton type minimum) too. (Next 200 year minimum in 2060–2070 AD [60]; the violation of G-O rule is a fact for the pair SC22-SC23 [61] and may will be for the pair sunspot cycles SC24-SC25 [49] (see also Figure 9).

6. Conclusions

On the basis of the presented results in this study and their analysis, the following conclusions can be made:
  • It is possible to use some tree ring widths data series (Dm) of specially selected long lived samples not only for the detection of solar modulated climatic cycles, but for searching fine effects of solar–climatic relationships as well as for solar dynamo regime changes. It is shown in “Gurkovo-01” as well as in “Rositsa-01” beech samples tree ring widths data series. However, the relative part of suitable for such precise analysis tree samples is too small (<10% by our rough estimation). A serious limitation of this method is the age of used tree samples, because finding suitable tree samples older than 250 years in Bulgaria is very difficult.
  • The data series demonstrates that there are no significant additional force factors over the climate of Central Bulgaria at least until 2010–2012 AD except these ones, which acted through the period 1780–1982 AD. An indirect additional support for this part of study is the successful to the present moment prediction about the start of a forthcoming new prolonged epoch of low solar activity (Dalton-type minimum) at the end of 20th and the beginning of 21st centuries.
  • The forecast about a forthcoming new grand solar minimum was confirmed on the basis of the second studied sample (“Rositsa-01”) time series kinematic model. Its extrapolation up to 2045 indicates for a low SC26 between 2030–2040 AD. The last one will be seriously damaged by the higher next SC27. This event could be determined as a “phase catastrophe” in the long-term behavior of solar activity. This will coincide with an epoch of Central Bulgaria climate cooling more essential after 2030 AD and at least up to 2045 AD (the end of model extrapolation).
  • According to the 2nd and 3rd conclusions, we could assume that predicting human caused global warming as well as regional warming effects is overestimated. On other hand if it stays on the position of pure solar forcing on the climate it is non-realistic to expect an event like the “Little Ice Age” in 15th–17th centuries. That is why such events are related to the “Maunder-type” solar minima and 2200–2500 year Hallstadt cycle. The started new grand solar minimum is “Dalton-type” and relates to the 200 year de Vries/Suess cycle. The planetary cooling effect relating to these grand solar minima is about 0.5–0.8 °C vs. 1.5–2 °C for Maunder-type minima and “little ice age”. Thus, any extreme climatic (“very warm” or “very cold”) scenarios could be excluded.
  • The presented kinematic models of tree rings widths time series and the obtained results by their extrapolations are in support of the suggestion that the grand solar minima are better expressed as quasi regular than stochastic events.
  • The general trends in many of tree rings widths data series could have much more complex nature as it usually takes for them. Except the “age-effect”, which is commonly considered as the main or even the single one reason for the general trends there could also be a damaging effect of the long term solar activity variations. In relative non-large part of tree ring widths data series, for which the “age-effect” is small or even negligible due to specific circumstances, the long-term solar cycles influences could be a main reason for forming of the general trends. That is why in some tree rings widths data series the general trends as a quasi-periodic “hyper wave” by periods closely to the ~200 year solar de Vries/Suess cycle or to some components of the solar (50–120 year) multiplet. This circumstance could be taken into account for improving of the dendrochronological primary data processing as well as for a better understanding of the solar influence on the climate and biosphere.

Funding

The study was carried within a research project agreement signed in 2012 between the Ministry of Agriculture, Food and Forestry of Bulgaria and the Institute of Astronomy and National Astronomical Observatory, Bulgarian Academy of Sciences. Its main part was provided in 2013 and the rest in 2014 AD.

Institutional Review Board Statement

Not applicable.

Informed Consent Statement

Not applicable.

Data Availability Statement

Not applicable.

Acknowledgments

The author is thankful to M.E. Ivan Nedkov–ex-director of North–Central Forestry Industrial Company in Gabrovo for his help in obtaining the “Rositsa-01” sample in 2013 AD, to the MATLAB team (www.mathworks.com, accessed on 28 June 2021), regarding the possibility for using of their wavelet analysis software module, and to the unknown woodsmen crew who provided the “Gurkovo-01” sample in the distant 1983 AD.

Conflicts of Interest

The author declares that he has no conflict of interest.

References

  1. Frittz, H.G. Tree Rings and Climate; Academic Press: Cambridge, MA, USA, 1976. [Google Scholar]
  2. Schove, D.J. The Sunspot Cycle 649 BC to AD 2000. J. Geophys. Res. 1955, 60, 127. [Google Scholar] [CrossRef] [Green Version]
  3. Schove, D.J. Sunspot Cycles; Stroudsburg: Hutchinson Ross, PA, USA, 1983. [Google Scholar]
  4. Mitchell, J.M., Jr.; Stockton, C.W.; Meko, D.M. Evidence of a 22-Year Rhythm of Drought in the Western United Related to the Hale Solar Cycle since the 17th Century; McCormac, B.M., Seliga, T.A., Reidal, D., Eds.; Solar-Terrestrial Influences on Weather and Climate: Tolouse, France, 1980; pp. 125–144. [Google Scholar]
  5. Raspopov, O.; Dergachev, V.; Kozyreva, O.; Kolström, T. Climate response to the deVries solar cycles: Evidence of Juniperus turkestanica tree rings in Central Asia. Mem. Soc. Astron. Ital. 2005, 76 (Suppl. S244), 760–765. [Google Scholar]
  6. Wang, X.; Zhang, Q.B. Evidence of solar signals in tree rings of Smith fir from Sygera Mountain in southeast Tibet. J. Atmos. Sol. Terr. Phys. 2011, 73, 1959–1966. [Google Scholar] [CrossRef]
  7. Shumilov, O.I.; Kasatkina, E.A.; Mielikainen, K.; Timonen, M.; Kanatjev, A.G. Palaeovolcanos, Solar activity and pine tree-rings from the Kola Peninsula (northwestern Russia) over the last 560 years Palaeovolcanos. Int. J. Environ. Res. 2011, 5, 855–864. [Google Scholar]
  8. Králíček, I.; Vacek, Z.; Vacek, S.; Remeš, J.; Bulušek, D.; Král, J.; Štefančík, I.; Putalová, T. Dynamics and structure of mountain autochthonous spruce-beech forests: Impact of hilltop phenomenon, air pollutants and climate. Dendrobiology 2017, 77, 119–137. [Google Scholar] [CrossRef]
  9. Rigozo, N.R.; Nordemann, D.J.R.; Echer, E.; Zanandrea, A.; Gonzalez, W.D. Solar variability effects studied by tree-ring data wavelet analysis. Adv. Space Res. 2002, 29, 1985–1988. [Google Scholar] [CrossRef]
  10. Dorotovič, I.; Louzada, J.L.; Rodrigues, J.C.; Karlovský, V. Impact of solar activity on the growth of pine trees: Case study. Eur. J. For. Res. 2014, 133, 639–648. [Google Scholar] [CrossRef]
  11. Kasatkina, E.A.; Shumilov, O.I.; Timonen, M. Solar activity imprints in tree ring-data from northwestern Russia. J. Atmos Sol. Terr. Phys. 2019, 193, 105075. [Google Scholar] [CrossRef]
  12. Šimůnek, V.; Vacek, Z.; Vacek, S.; Ripullone, F.; Hájek, V.; D’Andrea, G. Tree rings of european beech (Fagus sylvatica l.) indicate the relationship with solar cycles during climate change in central and southern europe. Forests 2021, 12, 259. [Google Scholar] [CrossRef]
  13. Vacek, Z.; Prokůpková, A.; Vacek, S.; Bulušek, D.; Šimůnek, V.; Hájek, V.; Králíček, I. Mixed vs. monospecific mountain forests in response to climate change: Structural and growth 4 perspectives of Norway spruce and European beech. For. Ecol. Manag. 2021, 488, 119019. [Google Scholar] [CrossRef]
  14. Šimůnek, V.; Sharma, R.P.; Vacek, Z.; Vacek, S.; Hůnová, I. Sunspot area as unexplored trend inside radial growth of European beech in Krkonoše Mountains: A forest science from different perspective. Eur. J. For. Res. 2020, 139, 999–1013. [Google Scholar] [CrossRef]
  15. Eddy, J.A. The Maunder Minimum. Science 1976, 192, 1189–1202. [Google Scholar] [CrossRef] [Green Version]
  16. Suess, H. The radiocarbon record in tree rings of the last 8000 years. Radiocarbon 1980, 22, 200–209. [Google Scholar] [CrossRef] [Green Version]
  17. Stuiver, M.; Quay, P.D. Changes in Atmospheric Carbon-14 Attributed to a Variable Sun. Science 1980, 207, 11–19. [Google Scholar] [CrossRef] [PubMed] [Green Version]
  18. Damon, P.E.; Sonett, C.P. The Sun in Time; Sonett, C.P., Giampapa, M.S., Eds.; University of Arizona Press: Tucson, Arizona, USA, 1991. [Google Scholar]
  19. Dergachev, V.C. 200–210 and 2400 yr Solar Cycles and Climate Variations. 1993. Available online: https://www.fticonsulting.com/insights/articles/longest-junkiest-bull-markeT–Record (accessed on 28 June 2021).
  20. Dergachev, V.A. Manifestation of Long Term Solar Activity in Climate Archives over 10 Millenia, Proc IAU Symposium 223’Multi-Wavelength Investigations of the Solar Activity; Stepanov, A.V., Benevolenskaya, E.E., Kosovichev, A.G., Eds.; Cambridge University Press: Cambridge, UK, 2004; pp. 699–704. [Google Scholar]
  21. Wittman, A.D.; Xu, Z.D. A catalogue of sunspot observations from 165 BC to AD 1684, Astron. Astrophys. Suppl. Ser. 1987, 70, 83–94. [Google Scholar]
  22. Gleissberg, W. A table of secular variations of the solar cycle. Terr. Magn. Atm. Electr. 1944, 49, 243–244. [Google Scholar] [CrossRef]
  23. Dergachev, V.A.; Vasiliev, S.S.; Raspopov, O.M.; Jungner, H. Impact of the geomagnetic field and solar radiation on climate change, Geomagn. Aeron. Engl. Transl. 2012, 52, 959–976. [Google Scholar]
  24. Komitov, B.; Sello, S.; Duchlev, P.; Dechev, M.; Penev, P.; Koleva, K. Sub- and Quasi-Centurial Cycles in Solar and Geomagnetic Activity Data Series. Bulg. Astron. J. 2016, 25, 78–103. [Google Scholar]
  25. Soon, W.W.-H.; Yaskell, S.H. Maunder Minimum and the Variable Sun-Earth Connection; World Scientific Publishing Co. Pte. Ltd.: London, UK, 2003. [Google Scholar]
  26. Parker, E.N. The formation of sunspots from the solar toroidal field. Astrophys. J. 1955, 120, 491. [Google Scholar] [CrossRef]
  27. Babcock, H.W. The Topology of the Sun’s Magnetic Field and the 22-Year Cycle. Astrophys. J. 1961, 133, 572. [Google Scholar] [CrossRef]
  28. Leighton, R. A Magneto-Kinematic Model of the Solar Cycle. Astrophys. J. 1969, 133, 572. [Google Scholar] [CrossRef]
  29. Choudhuri, A.R. An Elementary Introduction to Solar Dynamo Theory. In Proceedings of the AIP Conference Proceedings, Sanibel Island, FL, USA, 23–27 July 2007; Volume 49, p. 919. Available online: https://aip.scitation.org/doi/10.1063/1.2756783 (accessed on 28 June 2021).
  30. Krivova, N.; Balmaceda, L.; Solanki, S. Reconstruction of solar total irradiance since 1700 from the surface magnetic flux. Astron. Astrophys. 2007, 467, 335–346. [Google Scholar] [CrossRef] [Green Version]
  31. Schuurmans, C.J.; Oort, A.H. A Statistical Study of Pressure Changes in the Troposphere and Lower Stratosphere after Strong Solar Flares. Pure Appl.Geophys. 1969, 75, 233–246. [Google Scholar] [CrossRef]
  32. Svensmark, H.; Friiz-Christensen, E. Variation of cosmic ray flux and global cloud coverage—A missing link in solar-climate relationships. J. Atmos. Sol. Terr. Phys. 1997, 59, 1225–1232. [Google Scholar] [CrossRef]
  33. Yu, F. Altitude variations of cosmic ray induced production of aerosols: Implications for global cloudiness and climate. Geophys. Res. Lett. 2002, 107, SIA8-1–SIA8-10. [Google Scholar] [CrossRef] [Green Version]
  34. Solanki, S.K.; Usoskin, I.G.; Kromer, B.; Schussler, M.; Beer, J. Unusual activity of the Sun during recent decades compared to the previous 11,000 years. Nature 2004, 431, 1084–1087. [Google Scholar] [CrossRef] [Green Version]
  35. Usoskin, I.G. A History of Solar Activity over Millennia. arXiv 2013, arXiv:0810.3972v3. [Google Scholar] [CrossRef] [Green Version]
  36. Jose, P.D. Sun’s motion and sunspots. Astron J. 1965, 70, 193–200. [Google Scholar]
  37. Scafetta, N. Does the Sun work as a nuclear fusion amplifier of planetary ti dal forcing? A proposal for a physical mechanism based on the mass-lumino sity relation. J. Atmos. Sol. Terr. Phys. 2012, 81–82, 27–40. [Google Scholar] [CrossRef] [Green Version]
  38. Scafetta, N. The Complex Planetary Synchronization Structure of the Solar System. 2014. Available online: https://emmind.net/temp/cosmos/Files/(601)%201405.0193.pdf (accessed on 28 June 2021).
  39. Komitov, B.; Duchlev, P.; Bjandov, G.; Kirilova, D. Trees Annual Rings and “Sun-Climate” Connection. Bulg. Astron. J. 2013, 19, 72. [Google Scholar]
  40. Komitov, B.; Duchlev, P.; Kirilova, D.; Bjandov, G.; Kiskinova, N. Vruzkata “Slance-klimat” v Godishnite Prasteni na Darvetata. Parvi Rezultati ot Izsledvane na 44 Darvesni probi (The “Sun-climate” Relationship in the Tree Ring Widths. First Results of 44 Tree Samples Study); Alpha Vizia: Stara Zagora, Bulgaria, 2014; (In Bulgarian). ISBN 978-954-9483-28-4. [Google Scholar]
  41. Komitov, B.; Kaftan, V. Annual Beech (Fagus sylvatica) Growth Rings and Solar-Related Climate Variations in the Central and Western Balkans in the 18th to 20st Centuries. Geomagn. Aeron. 2019, 59, 926–934. [Google Scholar] [CrossRef]
  42. Komitov, B. Varhu Edna Vazmojnost za Dalgosrochno Prognozirane na Agroclimatichnite Usloviya v Gorno-Trakiiskata Nizina s Pomosta na Bazata na 22-Godishniya Slancev cical (in Bulgarian) (On the Possibility for a Long-Time Prediction of the Agro-climatic Conditions in Upper Tracian Valley on the Bas of 22yr Solar Cycle), Paper. In Proceedings of the 2nd National Conference for Space-Terrestrial Technological Transphere, Stara Zagora, Bulgaria, 8–10 October 1981. [Google Scholar]
  43. Possible Influence of Solar Activity on the Climate in Bulgaria. Available online: https://ui.adsabs.harvard.edu/abs/1986BSolD198673K/abstract (accessed on 28 June 2021).
  44. Torrence, C.; Compo, G.P. A Practical Guide to Wavelet Analysis. Bull. Am. Meteorol. Soc. 1998, 79, 61–78. [Google Scholar] [CrossRef] [Green Version]
  45. Komitov, B. The Schove’s series. Centural and Supercentural variations of the solar activity. Relationships between adjacent 11-year cycles. Bulg. Geoph. J. 1997, 23, 74–82. [Google Scholar]
  46. Rasspopov, O.M.; Dergachev, V.A.; Esper, J.; Kozyreva, O.; Frank, D.; Ogurtsov, M.; Kplstrom, T.; Shao, X. The influence of the de Vries (~200 year) solar cycle on climate variations: Results from Central Asia Mountains and their global link. Paleogeogr. Paleoclimatol. Paleoecol. 2008, 259, 16. [Google Scholar] [CrossRef]
  47. Loginov, F.N. Harakter Solnechno–Atmosfernich Svyazej (In Russian) (The Nature of Solar-Atnospheric Relationships); Gidrometeoizdat: Leningrad, Russia, 1973. [Google Scholar]
  48. Komitov, B. The “Sun-climate” relationship: II. The “cosmogenic” beryllium and the middle latitude aurora. Bulg. Astron. J. 2009, 12, 75. [Google Scholar]
  49. Komitov, B.P.; Kaftan, V.I. The Sunspot Activity in the Last Two Millenia on te Base of Indirect and Instrumental Indexes. Time Serieses Models and Their Extrapolations for the 21st Century. In IAUS 223 ‘Multi-Wavelength Investigations of the Solar Activity’; Stepanov, A.V., Benevolenskaya, E.E., Kosovichev, A.G., Eds.; Cambridge University Press: Cambridge, UK, 2004; pp. 115–116. [Google Scholar]
  50. Georgieva, K. Why the sunspot cycle is double peaked? ISRN Astron. Astrophys. 2011, 437818. [Google Scholar] [CrossRef] [Green Version]
  51. Komitov, B. “Sun--climate” relationship. III. Solar eruptions, north-south sunspot area asymmetry and earth climate. Bulg. Astron. J. 2010, 13, 82–100. [Google Scholar]
  52. Thompson, D. Dependence of global temperatures on atmospheric CO2 and solar irradiance. Proc. Nat. Acad. Sci. USA 1997, 94, 8370–8377. [Google Scholar] [CrossRef] [Green Version]
  53. Mazzarella, A.; Scafetta, N. Evidences for a quasi 60-year North Atlantic Oscillation since 1700 and its meaning for global climate change. Theor. Appl. Climatol. 2012, 107, 599–609. [Google Scholar] [CrossRef] [Green Version]
  54. Javaraiah, J. Long-Term Variations in the Solar Differential Rotation. Solar Phys. 2003, 212, 23–49. [Google Scholar] [CrossRef]
  55. Usoskin, I.; Mursula, K.; Kovaltsov, G. Was one sunspot cycle lost in the late XVIII century? Astron. Astrophys. 2001, 370, L31–L34. [Google Scholar] [CrossRef] [Green Version]
  56. De Toma, J.; White, O. Solar cycle 23: An anomalous cycle? Astrophys. J. 2004, 609, 1140–1152. [Google Scholar] [CrossRef] [Green Version]
  57. Komitov, B. The 24th solar cycle: Prelyminary analysis and generalizations. Bulg. Astron. J. 2019, 30, 1–41. [Google Scholar]
  58. Gvishiani, A.D.; Starostenko, V.I.; Sumaruk, Y.U.P.; Soloviev, A.A.; Legostaeva, O.V. A decrease in solar and geomagnetic activity from cycle 19 to cycle 24, Geomagn. Aeron. Engl. Transl. 2015, 55, 299–306. [Google Scholar]
  59. Clette, F.; Lefevre, L. The new Sunspot Number: Assembling all corrections. Sol. Phys. 2016, 291, 2629–2651. [Google Scholar] [CrossRef] [Green Version]
  60. Javaraiah, J. Will solar cycles 25 and 26 be weaker than cycle 24? Sol. Phys. 2017, 292, 172. [Google Scholar] [CrossRef] [Green Version]
  61. Zharkova, V.V.; Sheperd, S.J.; Popova, E.; Zharkov, S.I. Heartbeat of the Sun from Principal Component Analysis and prediction of solar activity on a millennium timescale. Nat. Sci. Rep. 2015, 5, 15689. [Google Scholar] [CrossRef] [PubMed] [Green Version]
  62. Ogurtsov, M. On the possibility of forecasting the Sun’s activity using radiocarbon solar proxy. Sol. Phys. 2005, 231, 167–176. [Google Scholar] [CrossRef]
  63. Schatten, K.H.; Tobiska, K. Solar Activity Heading for a Maunder Minimum? 2003. Available online: https://ui.adsabs.harvard.edu/abs/2003SPD....34.0603S/abstract (accessed on 28 June 2021).
  64. Komitov, B.; Kaftan, V. Solar activity variations for the last millenia. Will the next long-period solar minimum be formed? Int. J. Geomagn. Aeron. 2003, 43, 553–561. [Google Scholar]
  65. Komitov, B.; Bonev, B. Amplitude Variations of the 11-year Solat Cycle and the Current Maximum 23. Astrophys. J. Lett. 2001, 554, L119–L122. [Google Scholar] [CrossRef]
  66. Lean, J.L.; Wang, Y.-M.; Scheeley, N.R., Jr. The effect of increasing solar activity on the Sun’s total and open magnetic flux during multiple cycles: Implications for solar forcing of climate. Geophys. Res. Lett. 2002, 29, 77-1–77-2. [Google Scholar] [CrossRef] [Green Version]
  67. Wang, Y.; Cheng, H.; Edwards, R.L.; He, Y.; Kong, X.; An, Z.; Wu, J.; Kelly, M.J.; Dykoski, C.A.; Li, X. The Holocene Asian monsoon: Links to solar changes and North Atlantic climate. Science 2005, 308, 854–857. [Google Scholar] [CrossRef]
  68. Herman, J.R.; Goldberg, R. Sun, Weather and Climate; NASA Sci an Technology Inf. Branch: Washington, DC, USA, 1978. [Google Scholar]
  69. Rubashev, B. Problemi solnechnoi aktivnosti (The Problems of Solar Activity); Nauka: Moscow, Russia, 1964. (In Russian) [Google Scholar]
  70. Vitinsky, Y.I.; Ohl, A.I.; Sazonov, A. Solnce I Atmosfera Zemli, (The Sun and Earth’s Atmosphere); Gidrometeoizdat: Leningrad, Russia, 1976. (In Russian) [Google Scholar]
  71. Tinsley, B.A. Influence of Solar Wind on the Global Electric Circuit and Inferred Effects on Cloud Microphysics, Temperature and Dynamics in the Troposphere. Space Sci. Rev. 2000, 94, 231–258. [Google Scholar] [CrossRef]
  72. Kopecky, M. Cycle de 22 ans de l’activit’e solaire. Bull. Astron. Inst. Czechoslov. 1950, 2, 14. [Google Scholar]
  73. Gnevishev, M.; Ohl, A. 22 yr cycle in solar activity. Astron. J. 1948, 38, 18–22. (In Russian) [Google Scholar]
  74. Scifo, A.; Kuitems, M.; Neocleous, A. Radiocarbon Production Events and their Potential Relationship with the Schwabe Cycle. Sci. Rep. 2019, 9, 17056. [Google Scholar] [CrossRef]
  75. Sakurai, H.; Tokanai, F.; Miyake, F.; Horiuchi, K.; Masuda, K.; Miyahara, H.; Ohyama, M.; Sakamoto, M.; Mitsutani, T.; Moriya, T. Prolonged production of 14C during the ~660 BCE solar proton event from Japanese tree rings. Sci. Rep. 2020, 10, 660. [Google Scholar] [CrossRef] [Green Version]
  76. Brehm, N.; Bayliss, A.; Christl, M.; Synal, H.A.; Adolphi, F.; Beer, J.; Kromer, B.; Muscheler, R.; Solanki, S.K.; Usoskin, I.; et al. Eleven-year solar cycles over the last millennium revealed by radiocarbon in tree rings. Nat. Geosci. 2021, 14, 10–15. [Google Scholar] [CrossRef]
  77. Komitov, B.; Kaftan, V. The Volcanic and Solar Activity Relationship During the Last ~460 Years. Could a Significant Part of the “Sun-Climate” Relationship Goes Through Lithosphere? In Proceedings of the Twelfth Workshop “Solar Influences on the Magnetosphere, Ionosphere and Atmosphere” September, Bulgaria, Ptimorsko, 3–7 June 2020; pp. 135–140. [Google Scholar] [CrossRef]
  78. ASP Conference Series. Available online: http://www.aspbooks.org/a/volumes (accessed on 28 June 2021).
Figure 1. The tree samples locations on the territory of Bulgaria (the whole collection).
Atmosphere 12 00829 g001
Figure 2. The tree samples distribution by age.
Atmosphere 12 00829 g002
Figure 3. The 20–22 year solar–climatic cycle manifestation in the warm half-year precipitation sums on the territory of Bulgaria (1899–1979 AD). The meteorological station locations where the 20–22 year cycle is statistically significant are signed by black filled circles, the other ones- by empty circles; The “Gurkovo-01” and “Rositsa-01” beech samples locations are signed by red triangles.
Atmosphere 12 00829 g003
Figure 4. The smoothed 5-year beech annual ring widths series (left: “Gurkovo-01”; right: “Rositsa-01”). The odd numbered Zurich sunspot cycles maxima are marked by gray circles, the even numbered ones–by dark circles; the hypothetic “lost” cycle SC4’ is signed by “⊗” (see Section 4.2) The Zurich sunspot cycles are signed by “SC” + the corresponding number.
Atmosphere 12 00829 g004
Figure 5. Left: The “Rositsa-01” T–R correlogram (original series); right: The T–R correlogram of “residual” series, after demodulation of the 207 year cycle.
Atmosphere 12 00829 g005
Figure 6. Left: The amplitude index S22 of “Gurkovo-01” beech sample Dm-series. The moving window width is equal to 30 years; right: the corresponding T–R correlogram.
Atmosphere 12 00829 g006
Figure 7. Left: The amplitude index S22 of “Gurkovo-01” beech sample Dm-series. The moving window width is equal to 30 years; right: the corresponding T–R correlogram.
Atmosphere 12 00829 g007
Figure 8. Left: Kinematic model of the time series of Dm [mm] for the Gurkovo-01 sample and its extrapolation through 2010 AD; right: Kinematic model of the time series of D for the Rositsa-01 sample and its extrapolation through 2045 AD [39].
Atmosphere 12 00829 g008
Figure 9. Kinematic model of Zurich sunspot series (old version (upper panel): January 1749–December 2014) on the basis of T–R periodogramm analysis and its extrapolation up to SC30 maximum (~2080 AD); (the new version (lower panel): January 1749–March 2021).
Atmosphere 12 00829 g009
Publisher’s Note: MDPI stays neutral with regard to jurisdictional claims in published maps and institutional affiliations.

