Abstract
Accurate, reliable estimates of tropical cyclone (TC) intensity are a crucial element in the warning and forecast process worldwide, and for the better part of 50 years, estimates made from geostationary satellite observations have been indispensable to forecasters for this purpose. One such method, the Advanced Dvorak Technique (ADT), was used to develop analog ensemble (AnEn) techniques that provide more precise estimates of TC intensity with instant access to information on the reliability of the estimate. The resulting methods, ADT-AnEn and ADT-based Error Analog Ensemble (ADTE-AnEn), were trained and tested using seventeen years of historical ADT intensity estimates using k-fold cross-validation with 10 folds. Using only two predictors, ADT-estimated current intensity (maximum wind speed) and TC center latitude, both AnEn techniques produced significant reductions in mean absolute error and bias for all TC intensity classes in the North Atlantic and for most intensity classes in the Eastern Pacific. The ADTE-AnEn performed better for extreme intensities in both basins (significantly so in the Eastern Pacific) and will be incorporated in the University of Wisconsin’s Cooperative Institute for Meteorological Satellite Studies (UW-CIMSS) workflow for further testing during operations in 2021.
1. Introduction
Tropical Cyclones (TC) often pose significant threats to marine interests operating in the tropical and subtropical oceans of the world, and these threats frequently extend to the adjacent land areas as well. Accurate estimates of the current TC intensity (commonly defined as the maximum sustained 1 min wind at 10 m above the surface) are crucial for forecasters working in operational centers in their preparation of forecast and warning products. TC intensity estimates have also been used to improve initializations of the TC vortex in numerical weather prediction (NWP) models, another crucial tool forecasters use in creating operational products. While intensity estimates extracted from in situ observations (e.g., reconnaissance aircraft or ships) are occasionally available, logistical concerns necessitate that they are often sparse. Intensity analyses conducted using geostationary satellite imagery, on the other hand, are available at regular intervals for the entire globe. Indeed, since the pioneering efforts of Dvorak [1,2], satellite-based estimates have been the mainstay of TC intensity estimation for nearly fifty years and will likely continue to be so for the foreseeable future.
A state-of-the-art satellite-based method employed to estimate TC intensity is the Advanced Dvorak Technique (ADT), developed first as the Objective Dvorak Technique (ODT) [3] and then updated and refined with increasing sophistication in subsequent years [4,5]. The ADT is currently used by operational centers worldwide as an automated method for ingesting geostationary satellite observations and rapidly rendering an estimate of TC intensity.
Despite its proven track record, one shortcoming of the ADT is that, as currently formulated, it is unable to provide supplementary reliability information along with the current intensity estimates. Current trends in the field suggest that the probabilistic nature of analysis and forecast products will be of increasing significance as time goes by. Forecasters will examine various analyses and guidance and weigh them according to their accuracy and reliability. At the same time, recent developments in the application of ensemble methods to NWP model output have made it clear that further benefit can be extracted from forecasts by post-processing. One such method designed for this purpose, the analog ensemble (AnEn) [6], is especially promising in its ability to both reduce model error (i.e., bias, mean errors) and provide reliable measures of model error (i.e., spread-skill). In an effort to further reduce ADT intensity estimation errors and to provide real-time access to analysis error estimates, we develop AnEn techniques for application to the ADTin the North Atlantic and Eastern Pacific basins
The remainder of the paper is organized as follows: Section 2 provides an overview of both the ADT and the AnEn methods as well as a description of the datasets used; Section 3 presents the results of the ADT-AnEn training (including predictor selection) and validation; finally, Section 4 discusses the results and outlines potential avenues of future investigation.
2. Data and Methods
2.1. The Advanced Dvorak Technique (ADT)
The ADT is a sophisticated algorithm that has traditionally produced fully-automated and objective estimates of TC intensity from geostationary satellite observations of infrared brightness temperature. These brightness temperature observations serve as inputs to multiple regression equations that then provide an estimate of intensity based upon the scene type (e.g., spiral band pattern, eye pattern, etc.). More recently, in versions 8 and 9 of the algorithm [5], 85–89 GHz microwave brightness temperature observations from polar-orbiting satellites have been used to supplement the analysis when the TC displays a central dense overcast (CDO). The precise details of the full set of equations and the rules governing their application under differing scene types is too complex to present here, but the reader is referred to the seminal papers [3,4,5] for additional information.
One characteristic of the ADT that particularly lends itself to the development of a complementary analog technique is the considerable historical database of satellite imagery and resulting ADT intensity estimates that exist from the early 2000s onward. For the purposes of training an analog ensemble (described in the subsequent two sections), version 9 of the ADT was used to produce intensity analyses of all TCs in the Atlantic and Eastern Pacific basins for the period 2004–2020. These data are available from the University of Wisconsin’s (UW) Cooperative Institute for Meteorological Satellite Studies (CIMSS) TC site on the world wide web (http://tropic.ssec.wisc.edu/misc/adt/info.html (accessed on 28 June 2021).
2.2. The Analog Ensemble (AnEn) Method
A technique capable of exploiting models (or, in this case, estimation algorithms) with large historical databases of output is the Analog Ensemble (AnEn) [6]. Originally developed in the context of boundary layer forecasts, the fundamental premise is this: estimate the probability density function (pdf) of a metric of interest by matching model outputs with their corresponding real-world observations. This differs from traditional analog methods in a key way. Instead of relying on the model outputs themselves (which can be biased and not necessarily representative of the true system dynamics and its attendant, often parameterized complexities), the analog is composed of observations which correspond to the dates and times of the model outputs. The AnEn is thus fully representative of the system dynamics and implicitly retains all complexity.
To apply the AnEn to a forecast or estimation problem, it is first necessary to have a database of historical forecasts or analyses with k entries which reasonably sample the phenomenon of interest. Model forecasts or analyses at the current time are then matched to elements in the database based on how closely they resemble the features of the historical forecasts or analysis. This is done by identifying a set of predictors based on the model output and generating an analog by minimizing the following expression:
where C (A) is the current (historical) forecast/estimated analog of the predictor, N is the number of predictors, wi is the weight of each predictor, and σi is the standard deviation of the predictor in the historical database. To form an M member ensemble, the M best analogs are chosen as those with the M smallest norms as defined by (1). If we define xk as the observation that corresponds to Ak, then the ensemble can be used to compute sample statistics for the metric of interest, i.e., the ensemble mean and standard deviation can be immediately computed as estimators of the metric and its associated error:
A schematic of the AnEn’s construction and operation is shown in Figure 1.
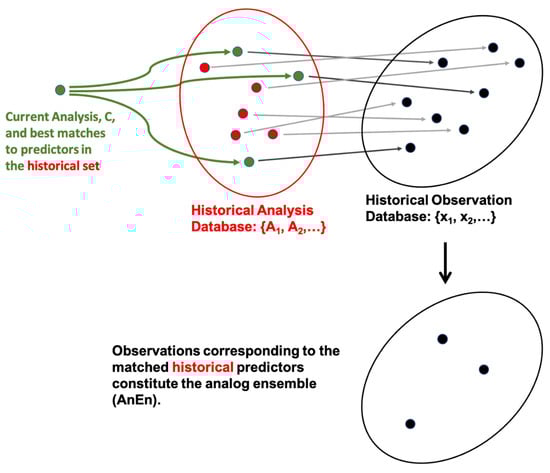
Figure 1.
Illustration of the construction and operation of the Analog Ensemble (AnEn). A historical database of model analyses over a period of years contains predictor outputs that are in one-to-one correspondence with a set of historical observations covering the same period of time. A current analysis produces predictor output that is used to select M (in this simplified illustration M = 3) matches from the historical predictor database. The M observations that correspond to the M predictors constitute the AnEn and are used to compute 1st and 2nd moment estimators of the desired metric. For purposes of clarity, this schematic illustrates the case of a small ensemble using a single predictor, but the extension to larger ensembles and multiple predictors is straightforward (as shown in Equation (1)).
Recently, the AnEn method has been successfully extended to TC applications. Alessandrini et al. [7] constructed an AnEn from a database of Hurricane Weather Research and Forecast (HWRF) model forecasts and demonstrated that the forecasts of maximum sustained wind could be improved using a set of 6–8 predictors. Lewis et al. [8] extended this work and derived an AnEn for the more specialized application of predicting TC rapid intensity change (RI-AnEn), illustrating its effectiveness during a real-time test of the 2017 and 2018 Atlantic and Eastern Pacific hurricane seasons. In this spirit, we develop an AnEn suitable for application to TC intensity output from the ADT.
2.3. The Advanced Dvorak Technique Analog Ensemble (ADT-AnEn)
To produce a version of an AnEn suitable for application to ADT output, ADT-AnEn, it is necessary to pair the aforementioned ADT database (2004–2020) with an observational database of TC intensity. The National Hurricane Center (NHC) maintains such a database, HURDAT [9] (https://www.nhc.noaa.gov/data/#hurdat (accessed on 28 June 2021), with estimates of TC intensity available at the standard synoptic times (00, 06, 12, and 18 UTC) for all Atlantic and Eastern Pacific TCs during the period of interest in this study.
The remaining task is to train the AnEn using the available predictors. In the case of the ADT, the predictor set is considerably smaller than that of a full-physics numerical model and so the training process is straightforward. The ADT inputs/outputs that we tested come from the ADT history file output and include TC center latitude and longitude, ADT-estimated maximum sustained wind, and a number of others. The full list of predictors, as well as a description of the training process, are detailed in the next section.
Finally, an alternative formulation of the ADT-AnEn was developed to deal with intensities that lie on the upper extreme of the distribution. The reasoning is that an ensemble mean, as defined in (2), will necessarily produce an estimate that is too smooth, since the phenomenon being sampled is by definition extreme and therefore has fewer representations in the historical database, leading to undersampling and ultimately negatively biased estimates. Alessandrini et al. [10] addressed the issue of prediction in the tail of the distribution using a linear regression technique developed using the difference of the current forecast and the mean of the historical analog forecasts. Here we adopt a different approach. If we define yk as the observed error, i.e., the difference between the ADT-estimated intensity, vk, in the database and the observed historical intensity xk:
A new analog ensemble, ADTE-AnEn (ADT-based Error Analog Ensemble) is then formed by centering the yk around the current ADT-estimated intensity, v
This recentered ensemble than can then be used in Equations (2) and (3) to compute estimators as before. Note that the ADTE-AnEn and ADT-AnEn will have the same error estimates as computed by (3).
3. Results
3.1. Training
Training for the North Atlantic and Eastern Pacific basins involved a historical database (ADT + HURDAT) containing 5524 and 5619 entries, respectively. The databases cover the years 2004–2020, and comprise storms covering the full range of intensities from tropical depression (Vmax < 34 kt) to category five hurricane (Vmax > 136 kt). A set of 13 parameters output by ADT were evaluated for their utility as AnEn predictors using the following method. First, each predictor was tested in isolation with its weight set to 1 and all other weights set to 0. Using k-fold cross validation with k = 10 and an ensemble size of M = 100, the entire dataset was evaluated in each basin and, in each case, the predictor that minimized the Vmax RMSE was the ADT Vmax. The next phase of training involved retaining ADT Vmax as the leading predictor (with its weight varying from 0.5 to 0.9) and then testing all other predictors with weights given as the residual of 1 minus the ADT Vmax weight. In each basin, storm center latitude resulted in the lowest RMSE values, and so it was chosen as the second predictor. A third phase of training, which added subsequent predictors and evaluated them in like manner, failed to achieve any further reduction in RMSE. The list of predictors tested, as well as their final (i.e., optimized) weights, is given in Table 1. The greater weight given to latitude in the Eastern Pacific is very likely due to the strong east-west oriented gradient of sea-surface temperature (SST) in that basin related to the southern extent of the California current.

Table 1.
List of ADT predictors evaluated as part of training the AnEn models presented in this study as well as the final (i.e., optimized) predictor weights. The training period covers the years 2004–2020, and the NHC HURDAT is used for the validation data. Note that the weights for the ADT-AnEn and ADTE-AnEn are the same within each basin.
3.2. Validation
Validation results for the North Atlantic are summarized in Table 2. Over the entire sample, both ADT-AnEn and ADTE-AnEn result in significant mean absolute error (MAE) and bias reductions relative to ADT. When the results are examined in subsets defined by quintile (the ADT-estimated Vmax are sorted from lowest to highest and divided into 5 equal sets), it becomes clear that the largest impact occurs for the weakest (and most well-sampled) subset of TCs with significant reductions in MAE and bias for both ADT-AnEn and ADTE-AnEn as determined by application of Welch’s t-test [11]. Significantly positive results are also seen for each of the other quintiles. Of particular interest is the 5th quintile, which represents the most intense 20% of the TCs analyzed. The ADTE-AnEn is designed specifically to improve analyses of extreme events and it improves upon the MAE and bias of TCs in this class. Notably, the ADTE-AnEn produces lower MAE and bias than ADT-AnEn for the most intense storms, as expected. These differences are not significant, however.
Table 2.
Training results (intensity estimate MAE and (bias), in kts) for the Atlantic Basin segregated by ADT intensity. Neg. bias indicates method estimates are weaker than verifying analyses. Differences between ADT and AnEn analyses which are significant at the 95% confidence level (as determined using Welch’s t-test) are indicated in bold. The training period covers the years 2004–2020, and the NHC HURDAT is used for the validation data.
Validation results for the Eastern Pacific basin are presented in Table 3. The baseline ADT errors are smaller than for the North Atlantic, primarily due to the absence of subtropical and hybrid type systems. The sample size is slightly larger (5619) than for the North Atlantic, and the results are a significant improvement in MAE bias for all intensity classes with exception of quintiles 2 through 4, for which the improvements in MAE are not significant. Noteworthy here are the differences between ADT-AnEn and ADTE-AnEn for the 1st and 5th quintiles. ADTE-AnEn produces a MAE in the 1st quintile and MAE and bias in the 5th quintile that are significantly better than ADT-AnEn.
Table 3.
Training results (MAE and (bias), in kts) for the Eastern Pacific Basin segregated by ADT intensity. Neg. bias indicates method estimates are weaker than verifying analyses. Differences between ADT and AnEn analyses which are significant at the 95% confidence level (as determined using Welch’s t-test) are indicated in bold. Differences between the ADT-AnEN and ADTE-AnEn which are significant at the 95% confidence level are italicized. The training period covers the years 2004–2020, and the NHC HURDAT is used for the validation data.
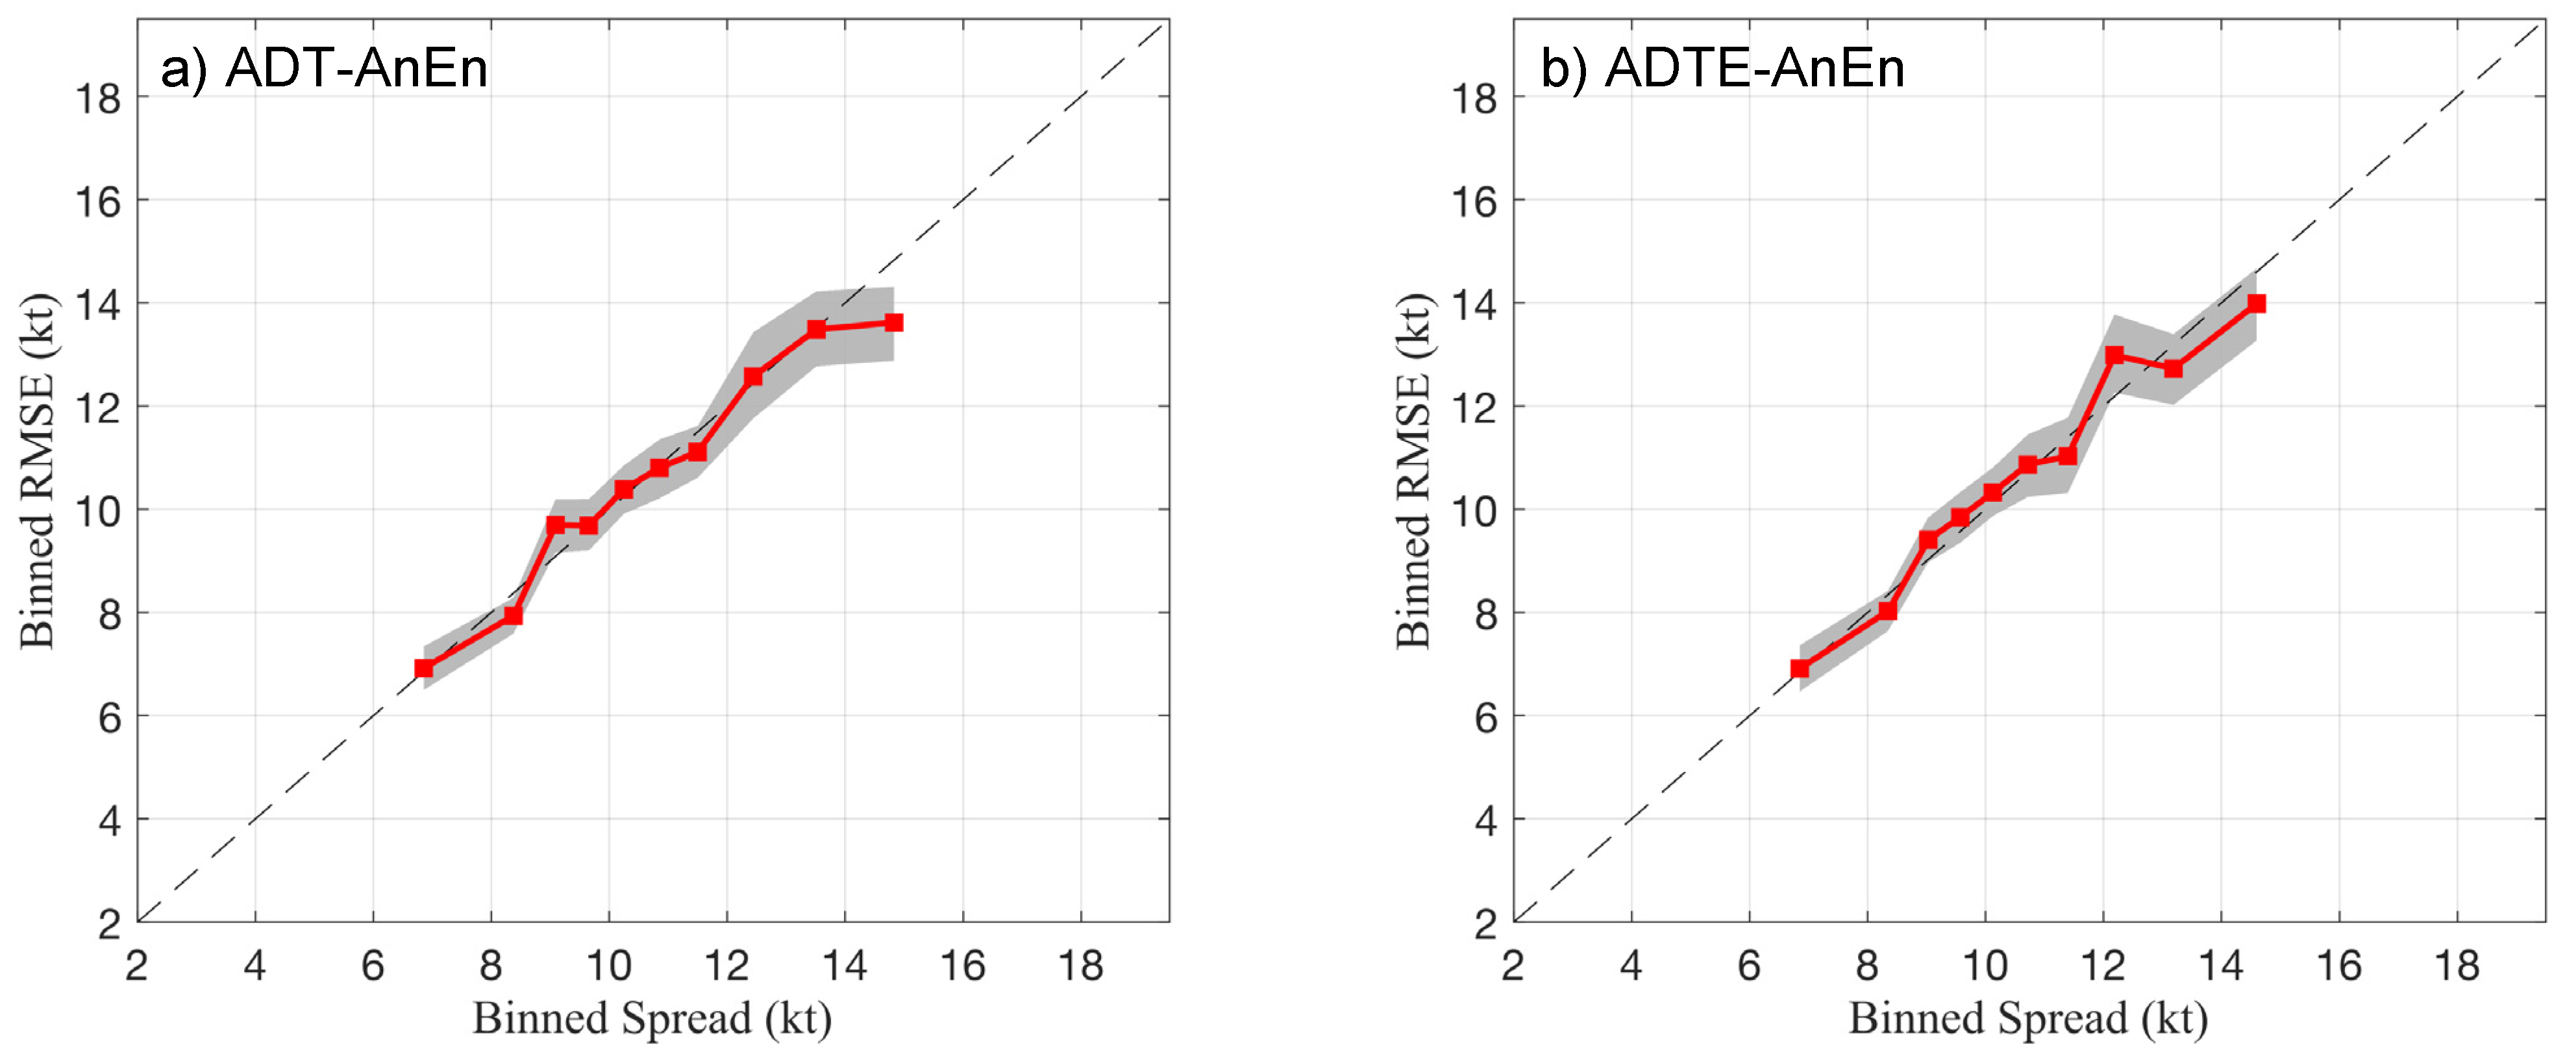
In addition to improving MAE and bias statistics, another primary objective of developing both ADT-AnEn and ADTE-AnEn is to generate reliable estimates of the associated ADT Vmax error. To this end, we compute binned spread-skill diagrams which depict the relationship between the ADT-AnEn and ADTE-AnEn estimated error (as represented by the ensemble spread) and the observed ADT Vmax error (as measured by the root mean square error, RMSE). To do this, the ensemble spread was first sorted into 10 equally represented bins and the mean ensemble spread for each bin was computed. The ADT Vmax RMSE were sorted into corresponding bins and the results are shown for the North Atlantic Basin in Figure 2. Both ADT-AnEn and ADTE-AnEn have excellent spread-skill characteristics for the full range of spread and RMSE values. This means that the standard deviation of the analog ensemble (as computed from three) generally agrees well with the associated Vmax estimation error. Only ADT-AnEn, for the highest spread/RMSE pair, fails to match the 1:1 line with 95% confidence.
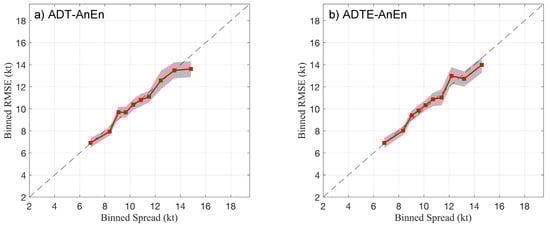
Figure 2.
Binned spread-skill plots for the North Atlantic training set computed for (a) ADT-AnEn Vmax estimates; (b) ADTE-AnEn Vmax estimates. The 95% confidence intervals (shown in gray) are computed using bootstrap sampling with 1000 replicates.
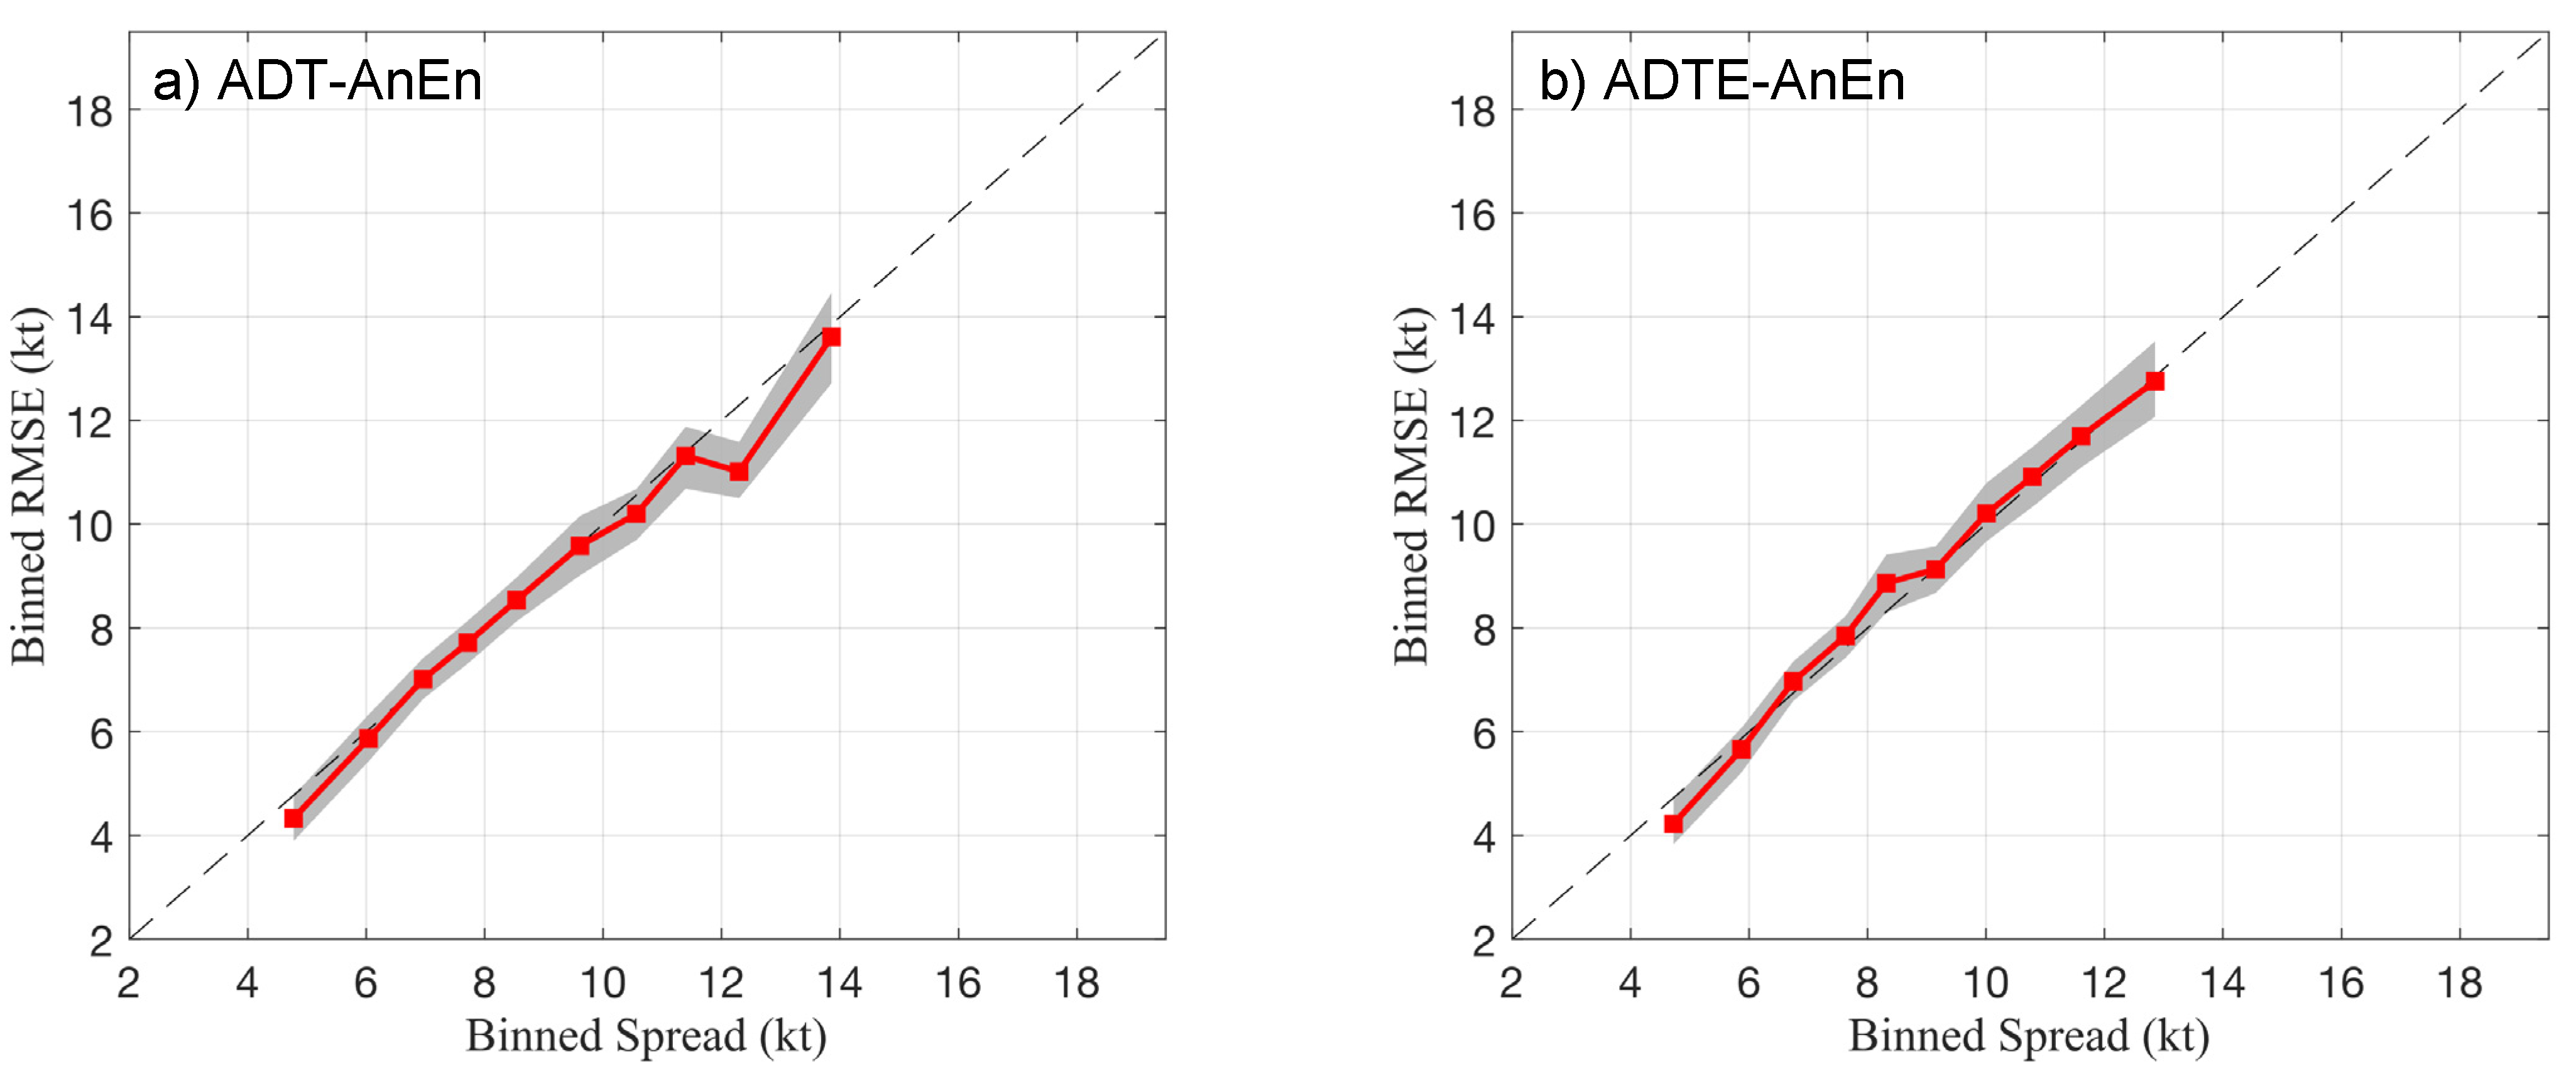
Spread-skill plots for the Eastern Pacific basin sample are depicted in Figure 3. The results here are generally good as well, but the superiority of the ADTE-AnEn method, hinted at in Figure 2, is now evident. ADT-AnEn spread tends to overestimate the error for large spread values, while the ADTE-AnEn is more reliable.
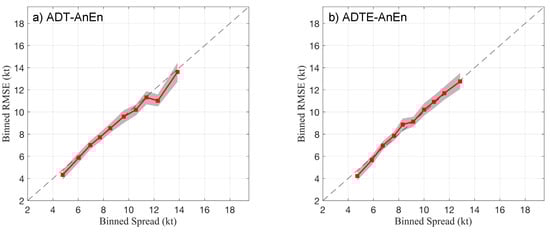
Figure 3.
Binned spread-skill plots for the Eastern Pacific training set computed for (a) ADT-AnEn Vmax estimates; (b) ADTE-AnEn Vmax estimates. The 95% confidence intervals (shown in gray) are computed using bootstrap sampling with 1000 replicates.
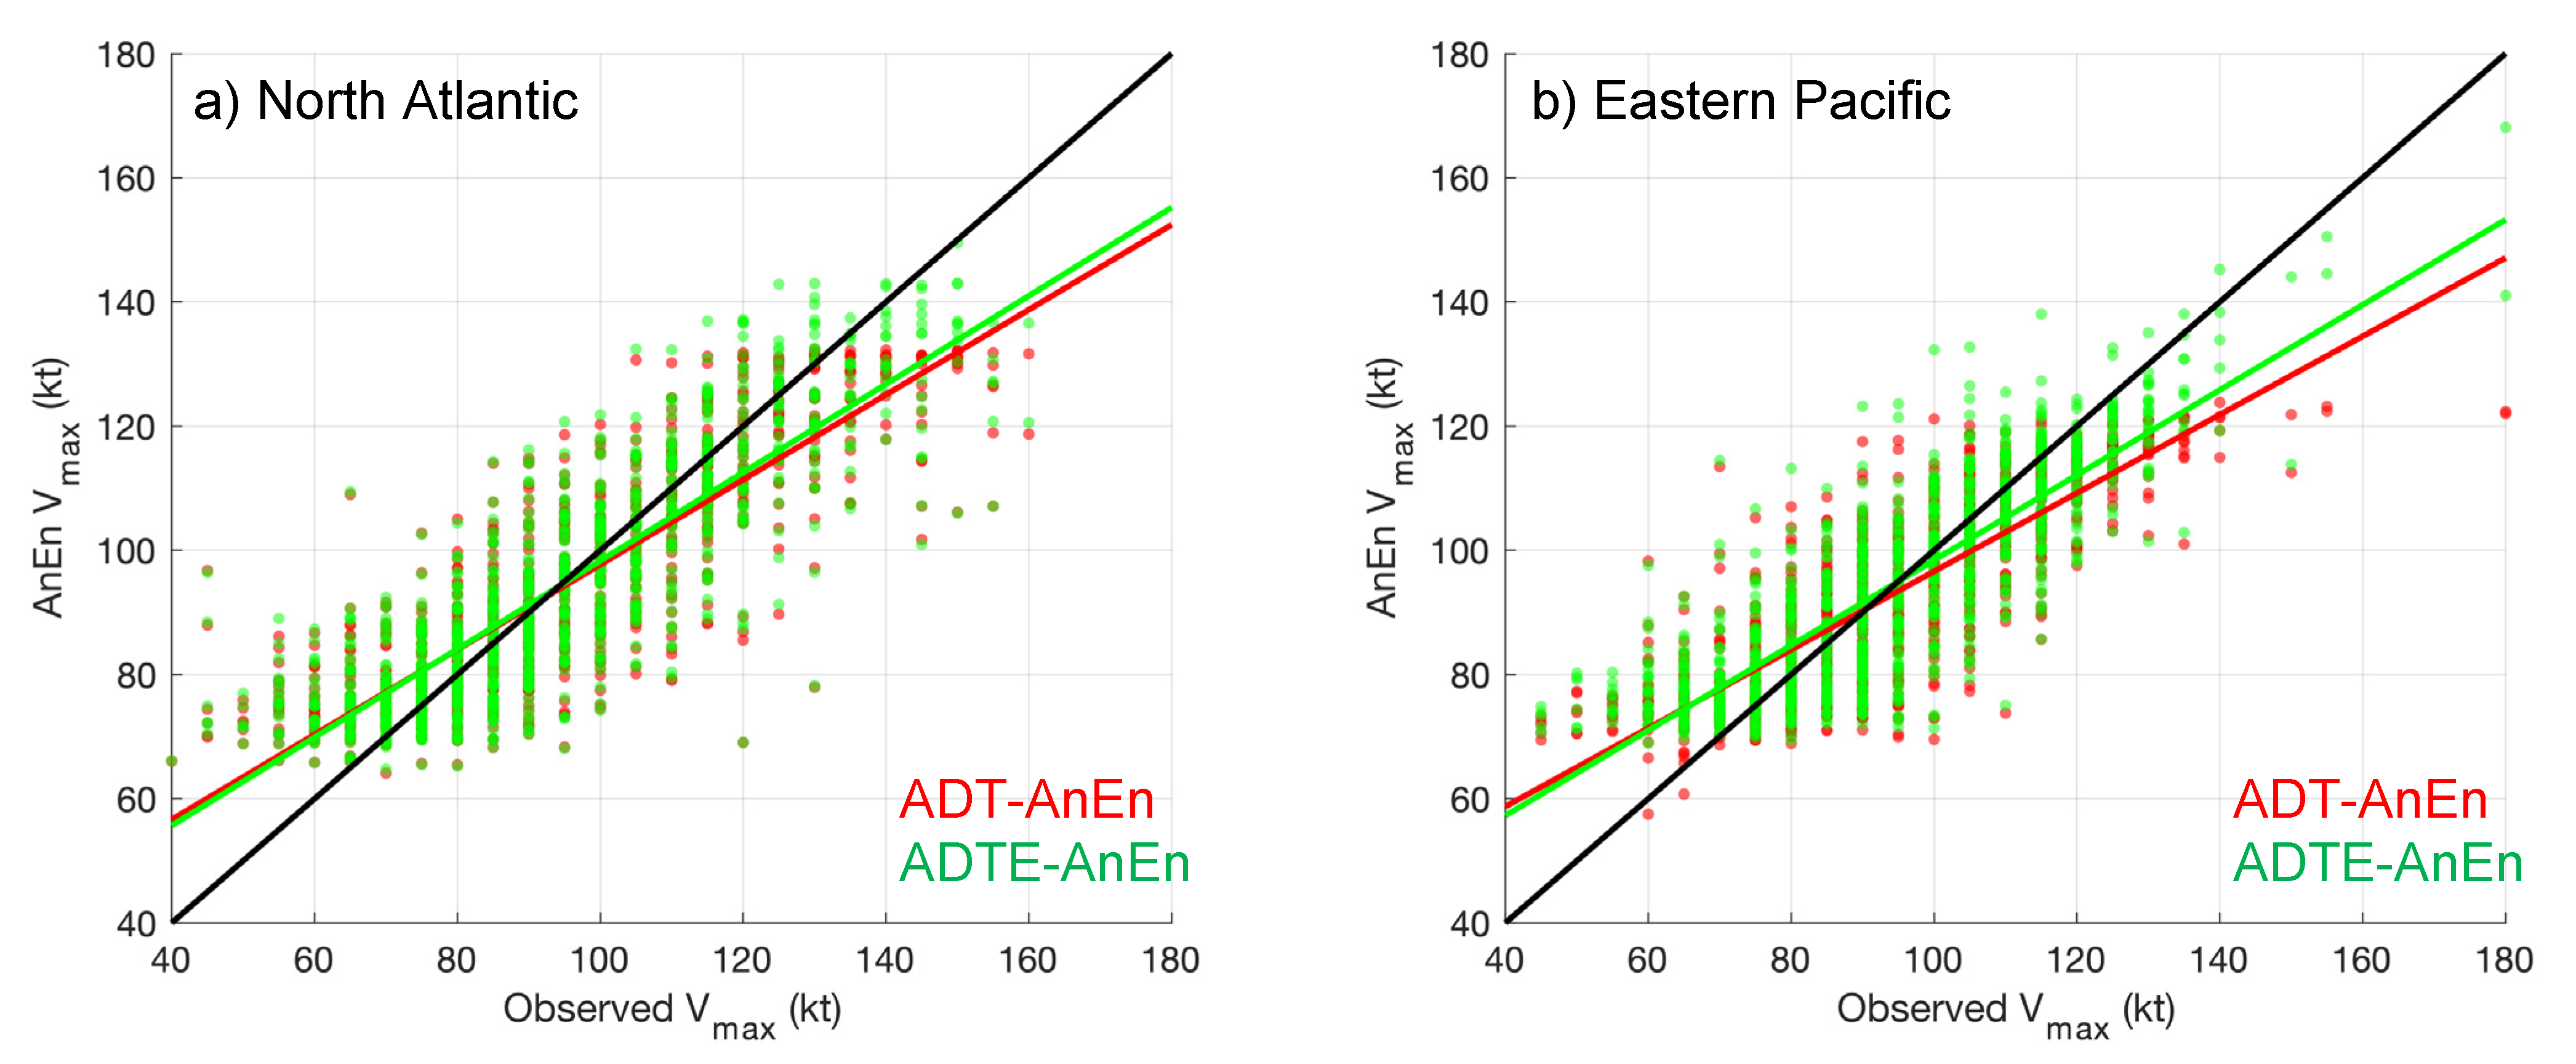
Finally, to examine the relative impact of ADTE-AnEn for the most intense TCs, the 5th quintile of the AnEn Vmax analyses were plotted against the observed Vmax values for both the North Atlantic (Figure 4a) and Eastern Pacific (Figure 4b). In both basins, the ADTE-AnEn clearly shifts the highest intensities upward as compared to the ADT-AnEn. The effect is most notable in the Eastern Pacific, which has a larger number of extremely intense TCs than does the Atlantic. This agrees with the results presented in Table 3, namely that ADTE-AnEn performs better than ADT-AnEn for the 5th quintile of intensity.
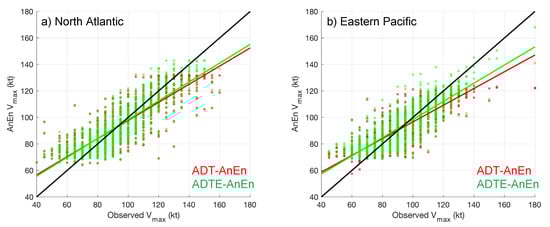
Figure 4.
Scatter plots of 5th quintile AnEn intensity analyses vs. observed intensities for (a) the North Atlantic basin and (b) the Eastern Pacific basin. Best-fit linear regression lines are added to highlight the differences between the ADT and ADTE analyses, namely that the latter fit the observed Vmax values better at the extreme margin of the intensity distribution.
4. Discussion
In this research, the authors have developed analog ensemble (AnEn) methods for application to satellite-based TC intensity estimates (Vmax) computed using the ADT algorithm. The satellite-based AnEn (ADT-AnEn) adapts the original AnEn methodology for application to output from the ADT, and the satellite-based error AnEn (ADTE-AnEn) further extends this method using a novel approach to sampling the observed estimation error.
Training and validation results indicate that broad improvements in ADT TC intensity estimates (MAE and bias) are achievable using both the original ADT-AnEn and ADTE-AnEn in postprocessing. The latter was motivated by the consideration that the traditional AnEn formulation might lead to underestimates of Vmax when applied to cases sampled from the tails of the intensity distribution. This hypothesis is verified as ADTE-AnEn MAE and bias performance are both better than ADT-AnEn for the 5th quintile of the intensity distribution. In the Eastern Pacific, these improvements are significant.
Looking forward, an expanded set of predictors will be examined and their impact on performance statistics will be evaluated. This includes categorical predictors such as ADT scene type (i.e., spiral-banding-type, eye-type, etc.) as well as numerical data from other sources, such as the SHIPS predictor database [12] which would permit the representation of environmental parameters, such as vertical wind shear and moisture.
Author Contributions
Individual contributions are as follows: Conceptualization, W.E.L., C.R., and S.A.; methodology, W.E.L.; software, W.E.L. and T.L.O.; validation, W.E.L., T.L.O. and C.S.V.; formal analysis, W.E.L., T.L.O. and C.S.V.; investigation, W.E.L.; resources, W.E.L.; data curation, W.E.L. and T.L.O.; writing—original draft preparation, W.E.L.; writing—review and editing, W.E.L., T.L.O., C.S.V., C.R. and S.A.; visualization, W.E.L.; supervision, W.E.L.; project administration, W.E.L.; funding acquisition, W.E.L. All authors have read and agreed to the published version of the manuscript.
Funding
This research received no external funding; however, we gratefully acknowledge the SSEC2022 Initiative for providing support for this study.
Institutional Review Board Statement
Not applicable.
Informed Consent Statement
Not applicable.
Data Availability Statement
Not applicable.
Acknowledgments
The authors with to thank three anonymous reviewers for their insightful comments, each of which has served to improve the quality of this manuscript. We also acknowledge NOAA/NESDIS and the UW-SSEC data center for providing the satellite imagery to test our concepts. Gratitude is extended to the NHC for providing HURDAT validation data.
Conflicts of Interest
The authors declare no conflict of interest.
References
- Dvorak, V. Tropical cyclone intensity analysis and forecasting from satellite imagery. Mon. Weather Rev. 1975, 103, 420–430. [Google Scholar] [CrossRef]
- Dvorak, V. Tropical Cyclone Intensity Analysis Using Satellite Data; NOAA Technical Report: Washington, DC, USA, 1984; Volume 47. [Google Scholar]
- Velden, C.S.; Olander, T.L.; Zehr, R.M. Development of an objective scheme to estimate tropical cyclone intensity from digital geostationary satellite infrared imagery. Weather Forecast. 1998, 13, 172–186. [Google Scholar] [CrossRef] [Green Version]
- Olander, T.L.; Velden, C.S. The advanced Dvorak technique: Continued development of an objective scheme to estimate tropical cyclone intensity using geostationary infrared satellite imagery. Weather Forecast. 2007, 22, 287–298. [Google Scholar] [CrossRef]
- Olander, T.L.; Velden, C.S. The Advanced Dvorak Technique (ADT) for Estimating Tropical Cyclone Intensity: Update and New Capabilities. Weather Forecast. 2019, 34, 905–922. [Google Scholar] [CrossRef]
- Delle Monache, L.; Eckel, F.A.; Rife, D.L.; Nagarajan, B.; Searight, K. Probabilistic weather prediction with an analog ensemble. Mon. Weather Rev. 2013, 141, 3498–3516. [Google Scholar] [CrossRef] [Green Version]
- Alessandrini, S.; Monache, L.D.; Rozoff, C.M.; Lewis, W.E. Probabilistic prediction of tropical cyclone intensity with an analog ensemble. Mon. Weather Rev. 2018, 146, 1723–1744. [Google Scholar] [CrossRef]
- Lewis, W.E.; Rozoff, C.; Alessandrini, S.; Delle Monache, L. Performance of the HWRF Rapid Intensification Analog Ensemble (HWRF RI-AnEn) during the 2017 and 2018 HFIP Real-Time Demonstrations. Weather Forecast. 2020, 35, 841–856. [Google Scholar] [CrossRef]
- Landsea, C.W.; Franklin, J.L. Atlantic Hurricane Database Uncertainty and Presentation of a New Database Format. Mon. Weather Rev. 2013, 141, 3576–3592. [Google Scholar] [CrossRef]
- Alessandrini, S.S.; Sperati, L. Delle Monache. Improving the analog ensemble wind speed forecasts for rare events. Mon. Weather Rev. 2019, 147, 2677–2692. [Google Scholar] [CrossRef]
- Welch, B.L. The generalization of “Student’s” problem when several different population variances are involved. Biometrika 1947, 34, 28–35. [Google Scholar] [CrossRef] [PubMed]
- DeMaria, M.; Kaplan, J. A statistical hurricane intensity prediction scheme (SHIPS) for the Atlantic basin. Weather Forecast. 1994, 9, 209–220. [Google Scholar] [CrossRef]

Publisher’s Note: MDPI stays neutral with regard to jurisdictional claims in published maps and institutional affiliations. |
© 2021 by the authors. Licensee MDPI, Basel, Switzerland. This article is an open access article distributed under the terms and conditions of the Creative Commons Attribution (CC BY) license (https://creativecommons.org/licenses/by/4.0/).