Article

Spatial–Temporal Assessment of Historical and Future Meteorological Droughts in China

1
School of Water Resources and Environment, China University of Geosciences (Beijing), Beijing 100083, China
2
MOE Key Laboratory of Groundwater Circulation and Environmental Evolution, China University of Geosciences (Beijing), Beijing 100083, China
3
College of Water Sciences, Beijing Normal University, Beijing 100875, China
*
Authors to whom correspondence should be addressed.
Atmosphere 2021, 12(6), 787; https://doi.org/10.3390/atmos12060787
Submission received: 30 April 2021 / Revised: 13 June 2021 / Accepted: 16 June 2021 / Published: 18 June 2021
(This article belongs to the Special Issue Advances in Drought Monitoring, Simulation and Prediction)

Abstract

:
Drought is a natural phenomenon in which the natural amount of water in an area is below the normal level. It has negative impacts on production in numerous industries and people’s lives, especially in the context of climate change. Investigating the spatial–temporal variation of drought is of great importance in water resource allocation and management. For a better understanding of how drought has changed in China from 1961 to 2020 and will change in the future period of this century (2021–2100), a spatial–temporal assessment of drought based on the standardized precipitation evapotranspiration index (SPEI) was carried out. The trends and characteristics (number, duration, and severity) of historical and future droughts in China were evaluated based on 12-month SPEI by employing the Mann–Kendall test, Sen’s slope and run theory. The similarities, differences, and spatial–temporal evolution of droughts in these two periods were analyzed. The results showed that in the historical period the number of droughts decreased gradually from the south of China to the north. Less frequent drought but with longer duration and stronger severity occurred in the northeast and the northern areas. In the future period, most parts of China are projected to suffer more severe droughts with longer duration, especially for Northeast China, North China, Qinghai–Tibetan Plateau, and Southwest China. The likely increasing severity and duration of droughts in most areas of China in the future makes it very necessary to formulate the corresponding drought prevention and relief strategies to reduce the possible losses caused by droughts.

1. Introduction

Drought is one of the natural disasters usually with large losses and far-reaching impacts, and thus has attracted much attention from hydrologists, meteorologists, environmentalists, ecologists, and agricultural scientists, etc. [1,2]. Severe droughts not only cause water and food shortages but also have great effects on the health of the population, which may increase morbidity and result in death. According to the World Meteorological Organization (WMO), the severe African droughts of 1975, 1983 and 1984 caused almost 680,000 deaths [3]. In China, from 2000 to 2012, droughts led to 24.75 million people and 16.62 million livestock having difficulties in drinking water and hit 22.29 million hectares (18% of cultivated land) of cropland annually, resulting in grain losses up to 30.83 billion kilograms (6% of gross production) [4]. With global warming, the assessment and prediction of droughts have become increasingly important issues for many countries.
Generally speaking, there are four types of droughts: meteorological, hydrological, agricultural and socio-economic droughts [5]. They are closely related and interact with each other. Meteorological droughts are usually regarded as advanced risk signals for upcoming agricultural and hydrological droughts which are often accompanied by economic and social losses [6,7]. Therefore, it is of great importance to understand the characteristics of meteorological droughts and predict upcoming meteorological droughts.
In the past few decades, many studies have been conducted on meteorological droughts, either on global or on national and regional scales. For example, Spinoni et al. [8] found that Amazonia, southern South America, the Mediterranean region, most of Africa, and northeastern China stood out as meteorological drought hotspots during the period 1951–2016, and North America, central Europe, central Asia and Australia experienced more frequent and severe droughts due to the progressive temperature increase outbalancing the precipitation increase. Sharafati et al. [9] detected an increasing tendency of meteorological drought features in the western regions of Iran and the droughts in Iran were more sensitive to precipitation than potential evapotranspiration. As for the future drought projections, Spinoni et al. [10] investigated the global meteorological drought hot spots by using the Coordinated Regional Climate Downscaling Experiment data and concluded that southern South America, the Mediterranean region, southern Africa, southeastern China, Japan, and southern Australia were projected to experience more frequent and severe droughts in the future, especially under the high-concentration emission scenario, while for high latitudes in the Northern Hemisphere and Southeast Asia, a decrease in drought was projected. Campozano et al. [11] evaluated meteorological droughts in Ecuador during 2041–2070 and found that a slightly decreasing trend was projected for future droughts for the whole country. Jincy Rose and Chithra [12] concluded that the Bharathapuzha river basin of Kerala in India was projected to become severely drought-prone during 2026–2040. Nuri Balov and Altunkaynak [13] found that the drought duration and intensity over two major watersheds in Turkey were projected to increase during the 21st century.
In China, there were also many studies which were focused on the assessment of meteorological droughts, especially at the regional and basin scales. For example, a series of earlier studies found that the southwest of China experienced severe droughts during 2009–2010 owing to the combination of low precipitation and high temperatures [14,15,16]. Northeastern China from Heilongjiang to the border of Xinjiang and Gansu provinces had significant (5% significance level) drying trends from 1950 to 2006, while most of Xinjiang, Qinghai, part of Tibet, and small areas over south China had wetting trends [17]. In southwest China, there was a slight increase in drought during 1962–2013, while in the Yunnan–Guizhou Plateau and Chongqing–Hubei Province, there was a significant increase in drought since 2003 [18]. Another regional study showed that the meteorological drought in southwest China has increased in both frequency and intensity during 1960–2010, and the main reason was the significant decrease in precipitation over this region, together with the simultaneous increase in temperature [19]. Future drought (2016–2100) conditions were expected to be more serious than historical drought (1960–2015) in the Pearl River Basin of southern China [20]. The west Guangxi and South Guizhou provinces were projected to exhibit the highest increment in drought severity under the three representative concentration pathway (RCP) scenarios [20]. A continuing tendency to more dry conditions was projected along a dryness band stretching from the southwest to the northeast of China for the period 2016–2050 under RCP4.5 [21]. Overall, there are abundant studies on meteorological droughts at regional scales in China; however, due to the differences of time series and drought index, the comparability of research results becomes a little poor. In addition, the assessments of historical and future meteorological droughts at the national scale were quite limited [22]. Since there are great spatial differences of droughts in China, it is more meaningful to study droughts across the whole of China.
Therefore, the main purpose of this study is to assess the droughts over China in the context of global warming both in the past and in the future. Specifically, the following issues will be focused on: (1) to assess the trends and characteristics (number, duration, and severity) of historical droughts from 1961 to 2020 in China by using the standardized precipitation evapotranspiration index (SPEI) drought index; (2) to project and evaluate future droughts from 2021 to 2100 based on the outputs of the general circulation model (GCM); (3) to analyze the variations of droughts in different sub-regions and different periods.

2. Study Area and Data
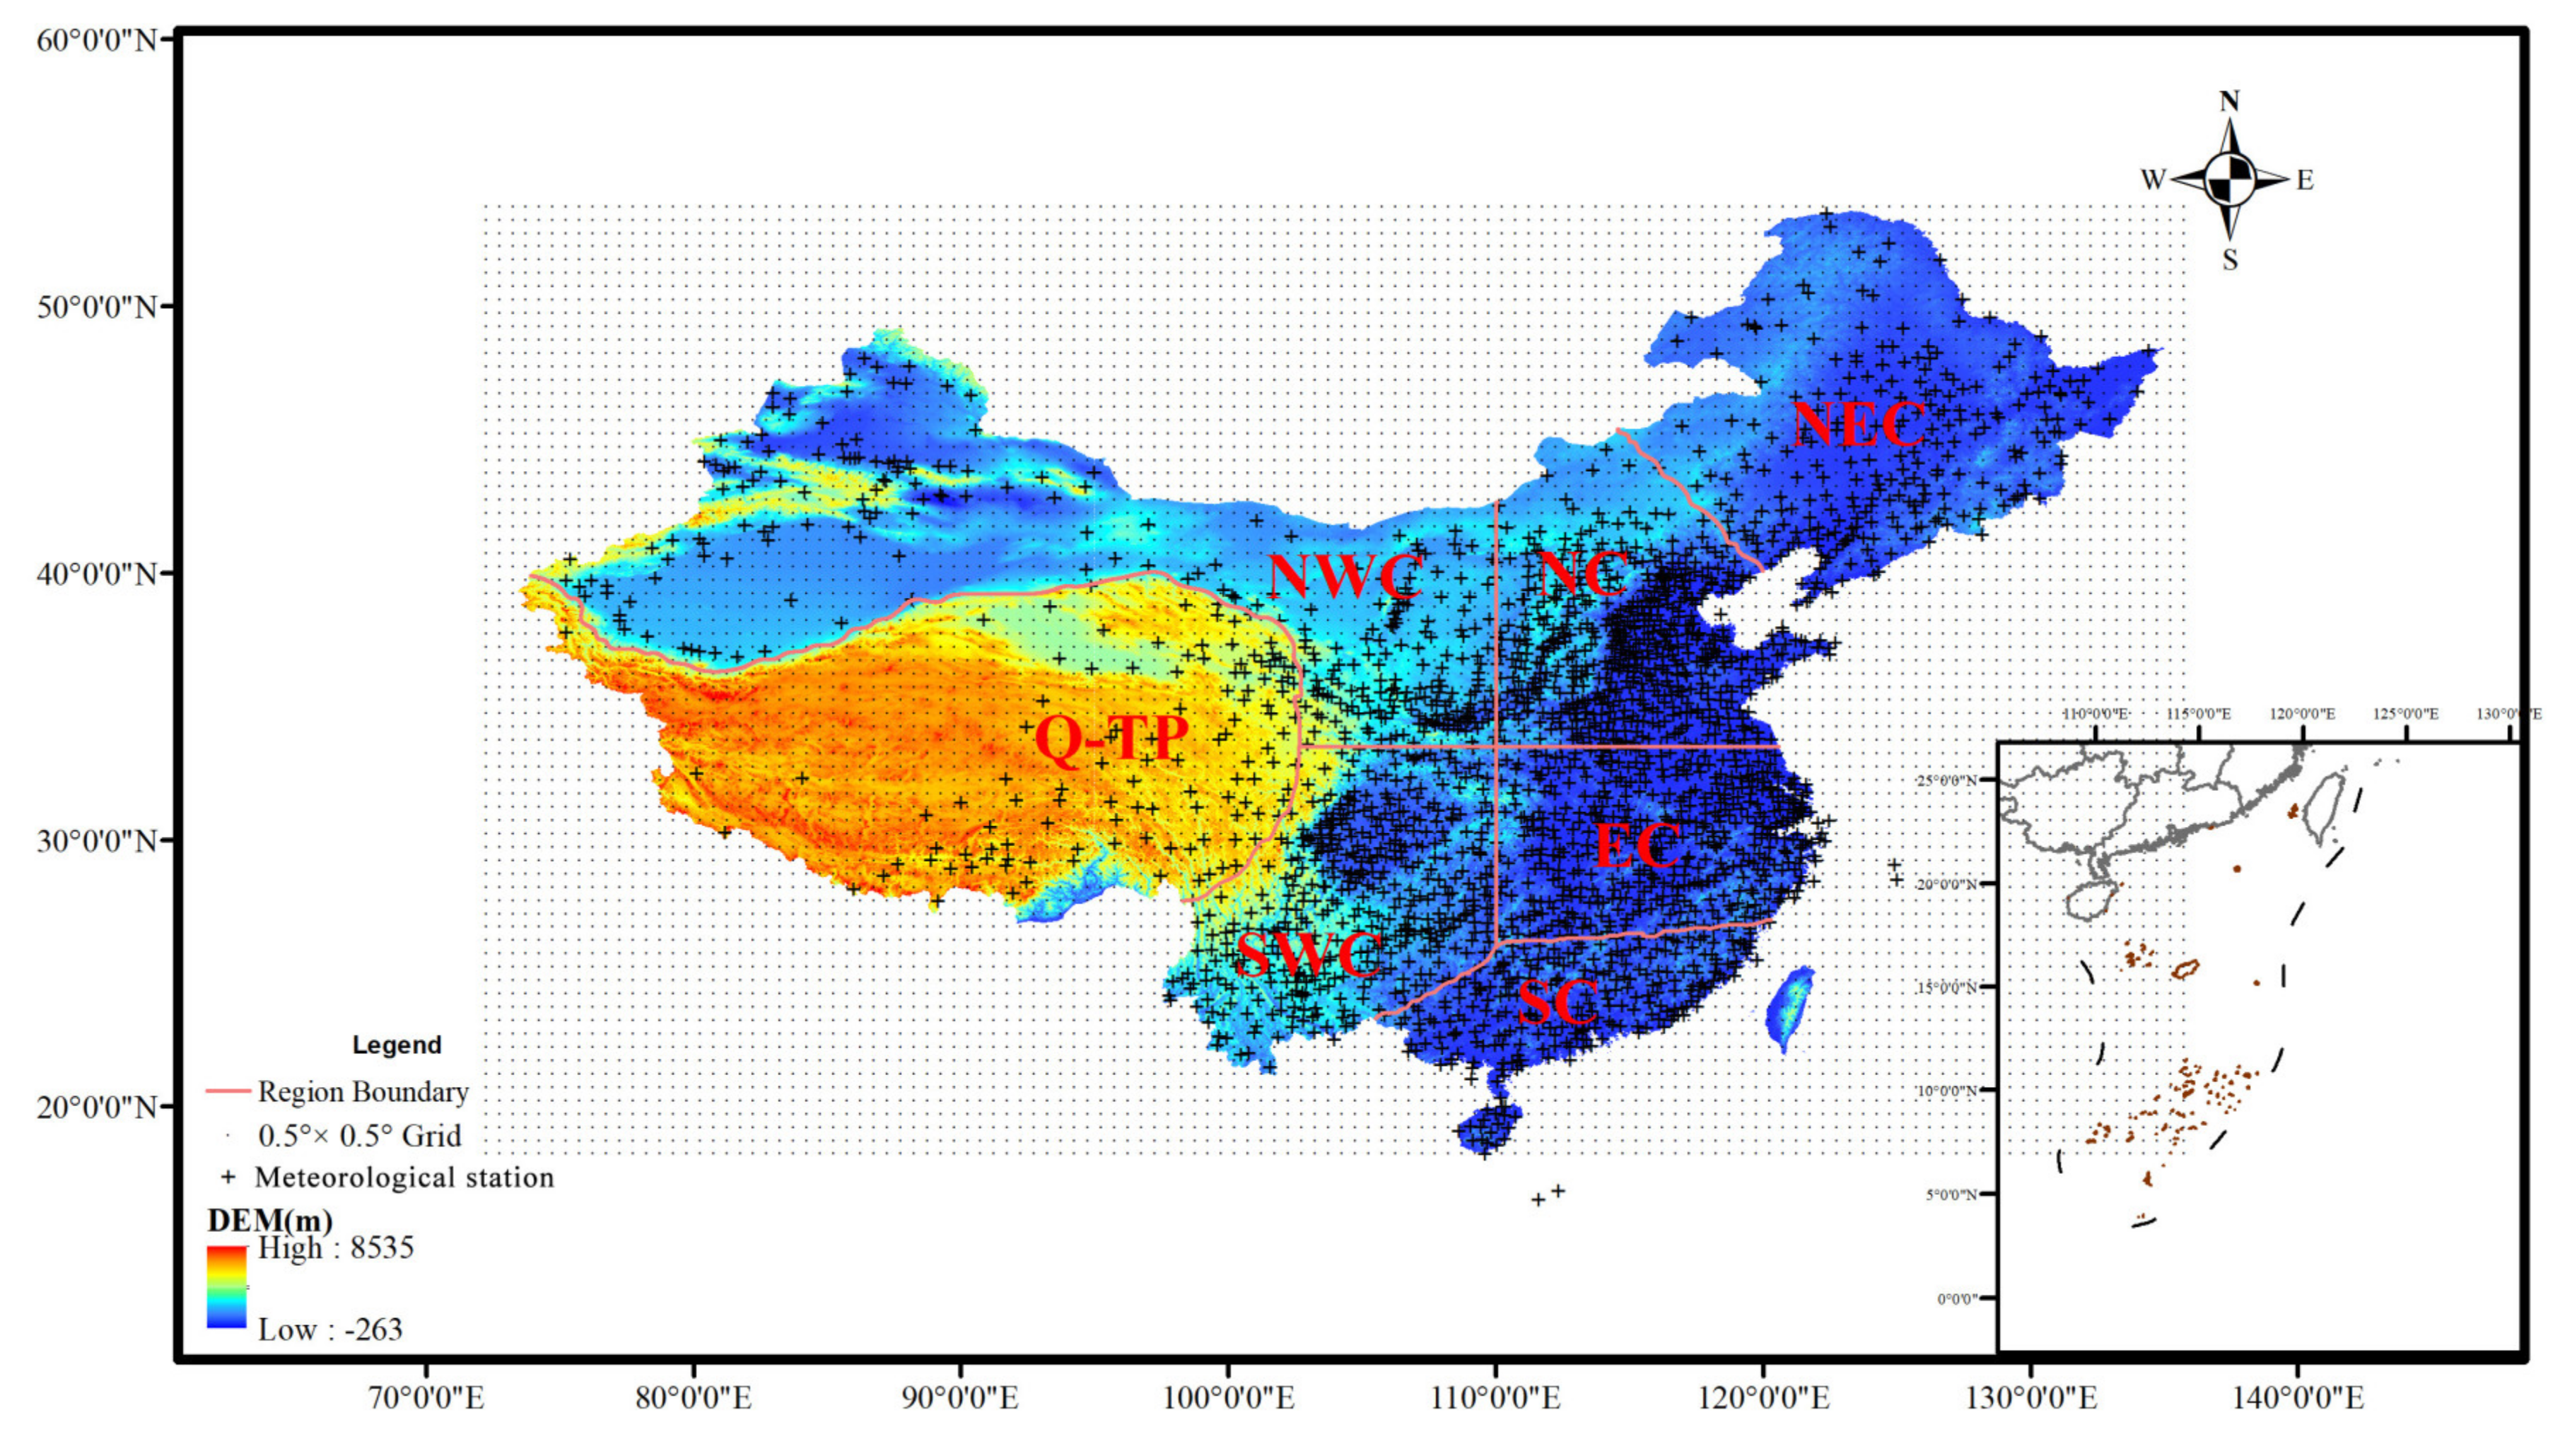
2.1. Study Area

Since the climate in China is diverse due to its vast territory (between latitudes 18° and 54° N, and longitudes 73° and 135° E) and complex topography, following the work of Wang and Chen [23] and Tian et al. [24], the study area is divided into seven sub-regions according to the regional climate features, administrative divisions and the Digital Elevation Model (DEM). The result is shown in Figure 1. The sub-regions are the Qinghai–Tibetan Plateau (Q-TP), Northwest China (NWC), Southwest China (SWC), Northeast China (NEC), North China (NC), East China (EC), and South China (SC), respectively. The country covers an area of more than 9.6 million km2. Q-TP and NWC account for the largest area in the whole country, reaching about 2.41 million km2 and 2.36 million km2, respectively, followed by NEC and SWC, reaching approximately 1.54 million km2 and 1.02 km2 million; NC, EC and SC are less than 1 million km2.
NEC is mainly dominated by the temperate monsoon climate, and the climate is extremely cold when northerly winds prevail in winter because it is also affected markedly by the high latitude and continental monsoon. NC and NWC are both mainly dominated by the temperate monsoon climate and the temperate continental climate, and the difference is that NC belongs to the sub-humid zone, while NWC belongs to the arid and semi-arid zone. Q-TP is the largest and the highest plateau in the world and has a mean elevation of about 4500 m. The climate is unique due to the influence of its special terrain features, such as high elevation, mountains, glaciers, snow cover, and high altitude lakes. SWC has the most complicated terrain and includes plateaus, mountainous regions, hilly land, basins, plains, etc.; it is influenced not only by the East Asian monsoon and the Indian monsoon but also the circulation system of the Qinghai–Tibetan Plateau. SC is influenced mainly by the synoptic system of the tropics/subtropics monsoon climate and EC is influenced mainly by the subtropical monsoon climate and the temperate monsoon climate, so unlike the inland regions, they are generally warm and damp [25].
More detailed information on the area and meteorological stations of each sub-region is listed in Table 1. Such a division was commonly used in the related research since the correlation of long-term meteorological variables (including precipitation, temperature, etc.) in the same sub-region reaches a good level [23,24,25].

2.2. Historical and Future Precipitation and Temperature Data

There are two kinds of climate data used to explore historical and future droughts over China. One is the historical observed climate data, and the other is the future projected climate data from GCMs. The historical monthly gridded precipitation and temperature data from 1961 to 2020 with a resolution of 0.5° × 0.5° were obtained from the China Meteorological Data Sharing Service System (http://data.cma.cn/, accessed on 16 June 2021), and the dataset was reanalyzed from over 2400 meteorological stations and evaluated and verified by the national meteorological department.
The future projected climate data come from the corrected outputs of GCMs under the RCP4.5 scenario which were downloaded from the Centre for Environment Data Analysis, a United Kingdom organization (http://www.ceda.ac.uk, accessed on 16 June 2021), covering the period of 2021–2100. There are 18 GCMs in total, and they are ACCESS1.0, BCC-CSM1.1, BNU-ESM, CanESM2, CCSM4, CNRM-CM5, CSIRO-Mk3.6.0, FGOALS-g2, GFDL-CM3, GISS-E2-H, GISS-E2-R, HadGEM2-ES, INMCM4, IPSL-CM5A-LR, MIROC5, MPI-ESM-LR, MRI-CGCM3 and NorESM1-M, respectively. The optimal GCM for each sub-region was selected by using the entropy-weighted TOPSIS method, and the output precipitation and temperature from the optimal GCM were bias corrected by using the delta-change method. Detailed information about the GCMs and the two methods mentioned above can be found in the reference of Li et al. [26].
In terms of the entropy-weighted TOPSIS method, for precipitation, the optimal model is CSIROMk-3.6.0 for EC and NC, MIROC5 for SC and SWC, CanESM2 for Q-TP and NEC, and GISS-E2-H for NWC, and for temperature, INMCM4 shows the best for EC, SWC, NWC and NC, FGOALS-g2 for SC, ACCESS1.0 for Q-TP, and CNRM-CM5 for NEC. The effects before and after bias correction of GCMs are shown in Table 2. Statistical indicators, normalized root mean square error (NRMSE), mean absolute error (MAE) and variance (Var) are selected to illustrate the necessity of bias correction. It can be seen that NRMSE, MAE and Var are obviously reduced after bias correction, meaning that the bias correction mainly reduced the systematic error between the GCM and the observed data. Thus, these data are optimally selected and bias-corrected to ensure that they are best suited to describe each sub-region.
Table 1 shows the average annual precipitation and temperature during the historical and future periods. Compared with the historical period (1961–2020), EC, SWC, Q-TP, and NWC are projected to experience higher precipitation in the future, among which Q-TP increased most, by about 32%, followed by NWC and SWC, which increased by about 17–18%, while SC, NC and NEC are projected to experience lower precipitation—0.2–3% less than those in the historical periods. In terms of the temperature projections under the RCP4.5 scenario, all the sub-regions are projected to have a warmer future climate—a 0.5–2.9 °C increase as a whole. Among them, Q-TP is projected to present obvious warming. The second sub-region with likely obvious warming is NEC. These results are consistent with the findings of Gao et al. [27], in which the increase in temperature was projected to be fast in the northern regions, and constantly accelerated on the Qinghai–Tibetan Plateau. The likely rise in future temperature is one of the major factors leading to droughts.

3. Methodology

3.1. Standardized Precipitation Evapotranspiration Index and Run Theory

The standardized precipitation evapotranspiration index (SPEI), developed by Vicente-Serrano et al. [28] based on the standardized precipitation index (SPI), is one of the most widely used drought indices in monitoring and quantifying meteorological droughts, especially under global climate change, since it considers the influence of temperature on droughts. SPEI uses the monthly difference between precipitation and potential evapotranspiration (PET) [28]. Thus, the PET has to be calculated first, in which the Thornthwaite method [29] is suggested by Vicente-Serrano et al., then the difference series (D series) between monthly precipitation and potential evapotranspiration can be obtained, and next the log-logistic distribution is used for fitting the D series. The specific procedures for calculating SPEI can be found in the studies of Mahmoudi et al. [30] and Pei et al. [31]. SPEI can better reflect the climatic water balance, owing to its combination of precipitation and potential evapotranspiration [32]. It can be calculated at various timescales, such as 1-, 3-, 6-, 12-, 24- and 48-month. SPEI series with different timescales represent the cumulative water balance over the previous n (n = 1, 3, 6, 12, 24 and 48, etc.) months [33]. Positive values of SPEI indicate wet conditions, while negative values indicate dry conditions [34].
After calculating the SPEI values, drought characteristics, such as drought number, duration and severity, can be derived from the run theory, which is the most frequently used method to identify drought characteristics in many previous studies [31,35]. According to this method, a drought event is a process when the drought index is below the threshold level. Drought number means the sum of all drought events that are extracted by the theory. Drought duration is defined as the total months that a drought event lasts for, in other words, it is the period between the onset and termination of a drought event. Drought severity indicates a cumulative deficiency of the drought index during a drought event [1].

3.2. Mann–Kendall Test and Sen’s Slope

The Mann–Kendall trend test is widely used in hydrological research for trend analysis [36]. In this study, the Mann–Kendall test was employed to detect temporal trends in the time series of the drought index. The statistic Z c is an important indicator. Positive values of Z c indicate increasing trends, while negative values show decreasing trends. In our study, the significance of the trends was tested at the α = 0.05 significance level. The null hypothesis of no trend is rejected if | Z c | > 1.96.
Sen’s slope method is a non-parametric test, which allows the data to have missing values and does not require the data to conform to a specific probability distribution [34]. If a linear trend is present in a time series, then the true slope (change per unit time) can be estimated by using a simple nonparametric procedure developed by Sen. The detailed procedures for the Mann–Kendall test and Sen’s slope method can be found in such studies as Zhou et al. [36] and Duan et al. [37].

4. Results

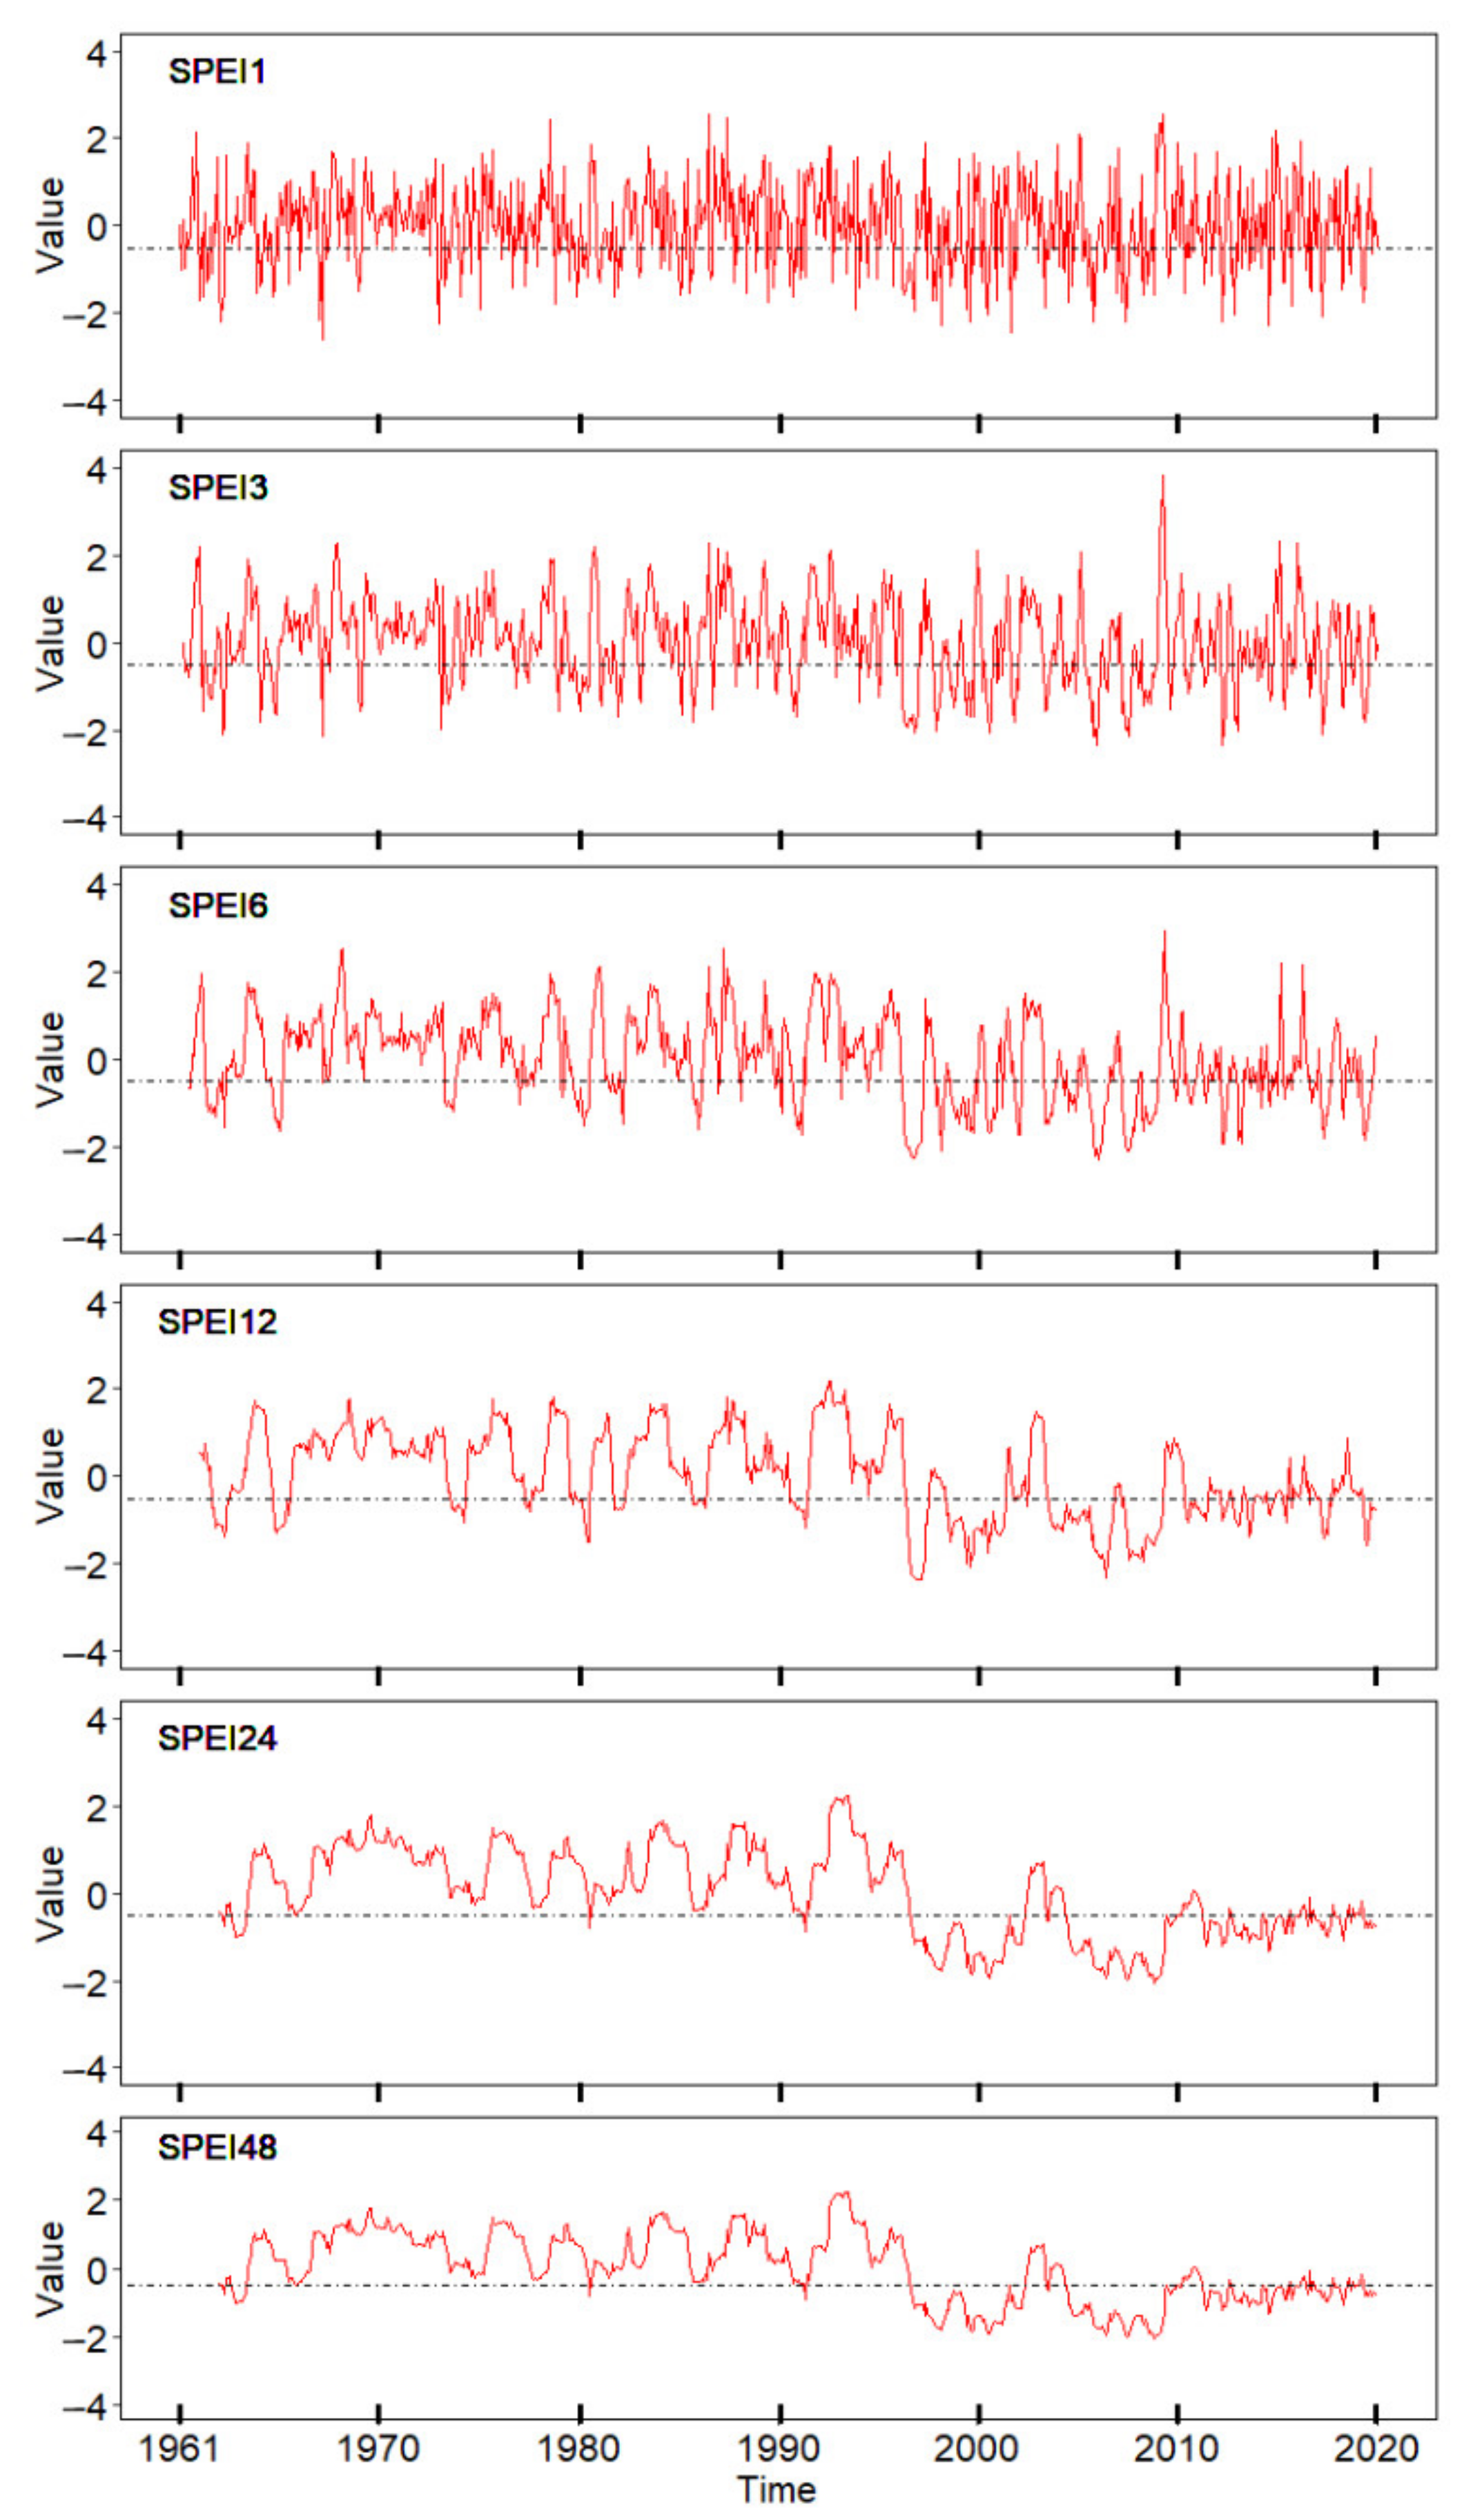
4.1. The Determination of Timescale for SPEI Calculation

We calculated the SPEI for different timescales (including 1-, 3-, 6-, 12-, 24-, and 48-month) during the historical period (1961–2020). Taking one of the most drought-prone sub-regions, NWC, as an example, Figure 2 shows the corresponding curves of SPEI with different timescales. It can be found that shorter timescales (1-, 3-, and 6-month SPEI) could reflect the details of droughts better and are more sensitive to extreme droughts, while as shown in Table 3, when the timescale is too short (1, 3 and 6 months), the extracted drought events are severely overestimated and tend to last only 1 to 2 months, making it difficult to analyze drought from a longer time perspective. Longer timescales (24-month and 48-month SPEI) can reflect the drought trends, while the extracted drought events are severely underestimated and some more detailed information about droughts is smoothed out and lost (Table 3). Twelve-month SPEI could not only reflect the long-term trend but also maintain interannual drought changes and have a low susceptibility to extreme events [38]. Thus, 12-month SPEI was finally chosen for the trend test and further study.

4.2. The Assessment of Historical Droughts

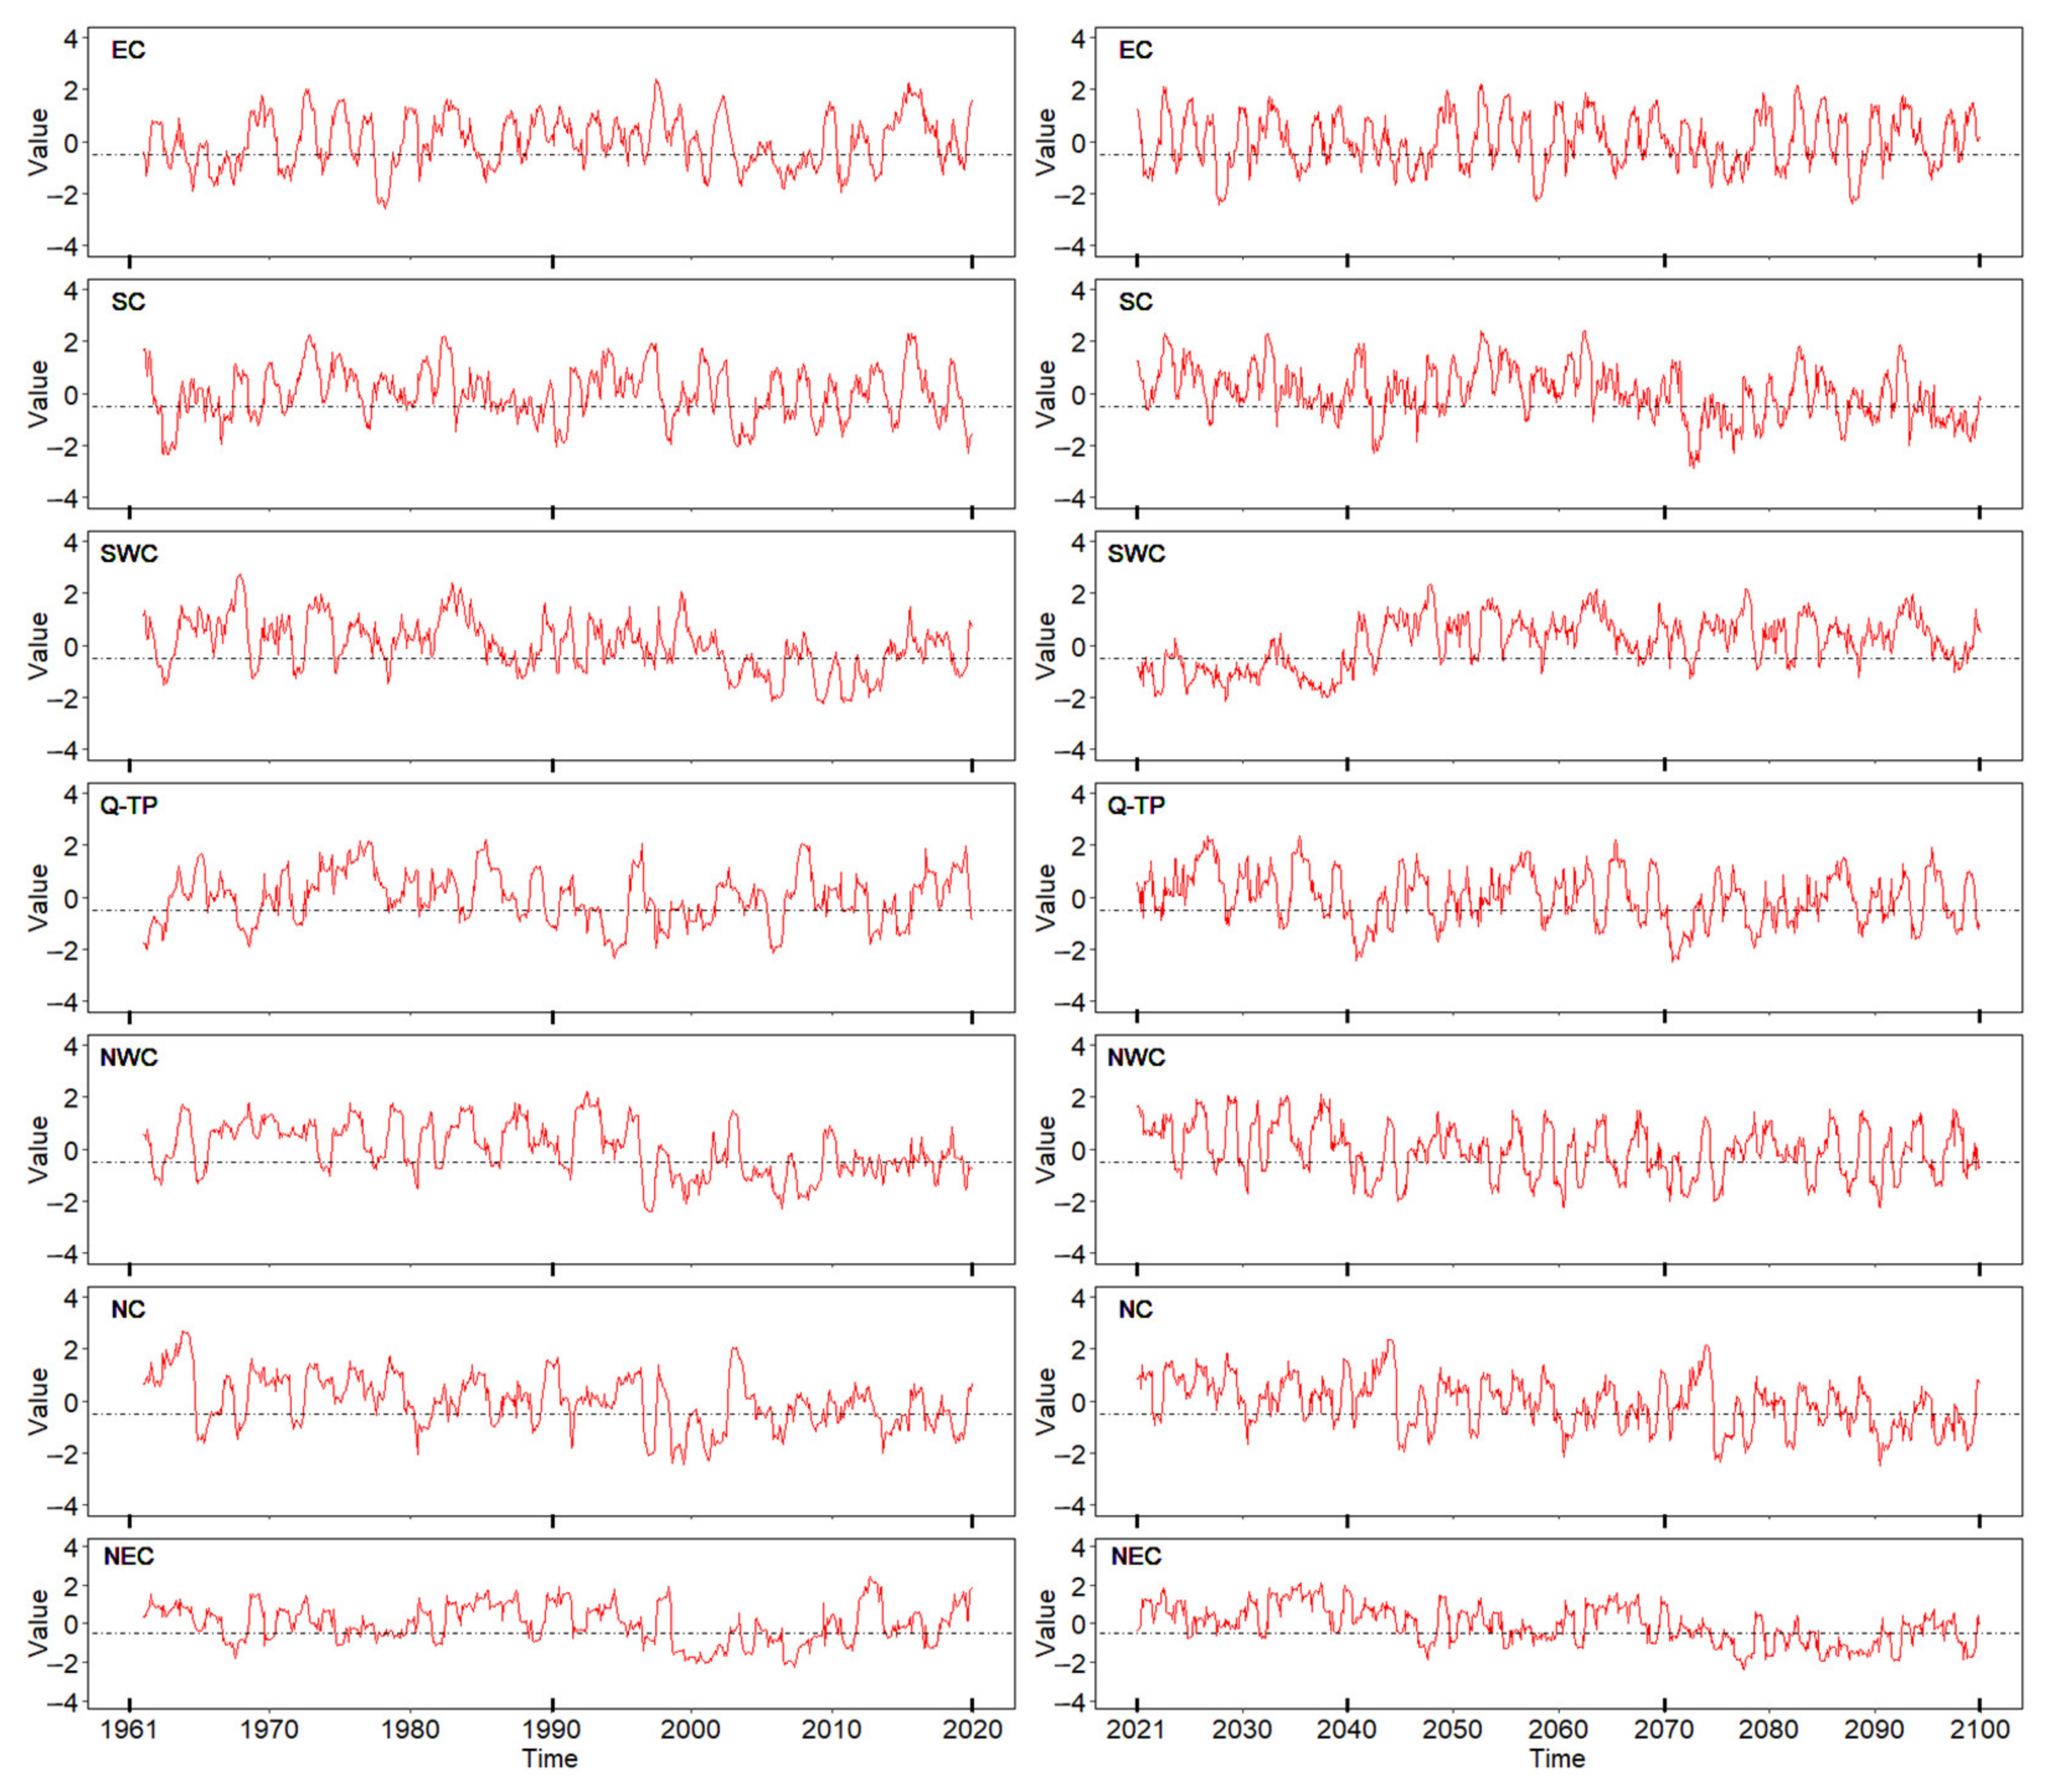
4.2.1. Trends of Historical Droughts

Based on the historical observed climate data, the 12-month SPEI in the seven sub-regions was calculated and is illustrated in Figure 3. The dotted line parallel to the x-axis in the figure means the threshold level of −0.5. Below this threshold level indicates a drought event occurring.
To explore the temporal variations of historical droughts, the Mann–Kendall test [39,40] and Sen’s slope method [41] were employed, and the results are shown in Table 4. It can be found that SWC, NWC, NC and NEC showed significant decreasing trends, with a rate of 0.264/10a, 0.256/10a, 0.254/10a and 0.105/10a, respectively, indicating that these sub-regions experienced drying trends in the historical period.

4.2.2. Characteristics of Historical Droughts

For better understanding the droughts in detail, the number, duration and severity of drought events were further derived from the 12-month SPEI series based on the run theory. Table 5 shows the number of drought events during the two periods. As shown, 34 drought events occurred during the historical period across the whole study area on average. Specific to each sub-region, Q-TP experienced the highest number of droughts; 40 events occurred from 1961 to 2020. The next are EC, SC and SWC, with more drought event numbers than the average level. NC and NEC experienced few droughts comparatively, below the average level of the whole study area.
In general, from 1961 to 2020, the drought numbers were found to decrease gradually from the south (35–37 times) to the north (29–31 times). This is similar to the studies of Ma et al. [42], in which they found that from 1961 to 2017, the frequency of drought events decreased from southeast to northwest, with high-value areas concentrated in the south.
Table 6 summarizes the drought durations during the two periods. It shows that, in any sub-region, the drought duration accounts for more than 30% of the total duration (60 years), which means that about one-third of the historical period experienced droughts. Among all the sub-regions, EC experienced the longest droughts, up to 244 months, accounting for 34.4% of the total duration of the historical period, followed by NWC, 240 months, accounting for 33.9% of the total duration. Q-TP and SWC experienced shorter droughts, 214 and 218 months, respectively; 5–7% shorter than the average level of the whole study area.
However, from the perspective of the average duration of each drought event, the conclusion shows something a little different. For example, EC experienced the longest drought duration (244 months), but it did not experience the longest duration per drought event (6.6 months) due to higher drought numbers (37 times). The duration per drought event is related to both total duration and drought numbers. NEC and NC experienced the same drought duration (235 months), but they experienced a different duration per drought event (8.1 months and 7.3 months) due to different drought numbers (29 times and 32 times). The longer the duration per drought event, the more serious the disaster it may cause, and therefore more attention should be paid to those sub-regions. Such sub-regions include NEC, NWC and NC, with 7–19% longer than the average level of the whole study area. EC, SC and SWC experienced a shorter duration per drought event, and Q-TP experienced the shortest, with more than 20% shorter than the average level of the whole study area. To sum up, the northeast (NEC) and the northern parts of China (NC and NWC) experienced a longer duration per drought event, while the western (Q-TP), the southwest (SWC) and the southeast parts of China (EC and SC) experienced a shorter duration per drought event.
The severity of drought is also usually related closely to the loss it caused. The more serious the drought is, the greater the losses are likely to be. Table 7 shows the drought severity during the two periods. EC experienced the most serious droughts across the historical period, followed by NEC and NWC, with 2–3% higher than the average level of the whole study area. Q-TP, SC and SWC experienced less serious droughts comparatively, and the severity is 2–3% lower than the average level. According to the average severity per drought event, NEC experienced the highest severity, nearly 20% higher than the average level, followed by NWC and NC. Q-TP experienced the least serious average severity; 18% lower than the average level. Combined with the drought number and drought duration mentioned above, it can be concluded that the northeast and the northern parts of China (NWC, NC and NEC) experienced less frequent droughts, yet with longer duration and stronger severity per drought event in the historical period, and the western, the southwest and the southeast parts of China (EC, SC, SWC, Q-TP) experienced more frequent droughts yet with shorter duration and weaker severity per drought event, comparatively.
Figure 4 illustrates the spatial map of drought characteristics in the historical period. It intuitively shows the spatial information of the meteorological drought characteristics mentioned above. In short, in terms of the drought numbers, Q-TP is the largest in the historical period, which indicates that this sub-region suffers the most frequent droughts. Concerning the drought duration, EC and NWC experienced the longest total durations, and NEC and NWC experienced the longest durations per drought event. As for total severity, EC is the largest; while considering the average severity per drought event, however, NEC is the largest among all the sub-regions.

4.3. The Assessment of Future Droughts

4.3.1. Trends of Future Droughts

Based on the corrected GCM output data, we further calculated the 12-month SPEI in each sub-region during the future period of 2021–2100, as illustrated in Figure 3. It can be intuitively seen that SC, Q-TP, NWC, NC and NEC all have obvious decreasing trends; on the contrary, SWC shows an obvious increasing trend.
Similarly, the trend test of the 12-month SPEI series was carried out to explore the temporal variations of droughts in the future more clearly, and the results are also shown in Table 4. It shows that most of the sub-regions, including NEC, NC, SC, NWC and Q-TP, showed significant decreasing trends, with a rate of 0.239/10a, 0.180/10a, 0.158/10a, 0.111/10a and 0.089/10a, respectively, indicating that these sub-regions are expected to experience drying trends in the future. The other two sub-regions, SWC and EC, show increasing trends with a rate of 0.186/10a and 0.016/10a. Such an increasing trend is significant for SWC at a 0.01 significance level.
To sum up, the future drought trends show great spatial variabilities across different sub-regions. NEC is expected to have the strongest drying trend, followed by NC, SC, NWC and Q-TP in turn. SWC is expected to have the strongest wetting trend.

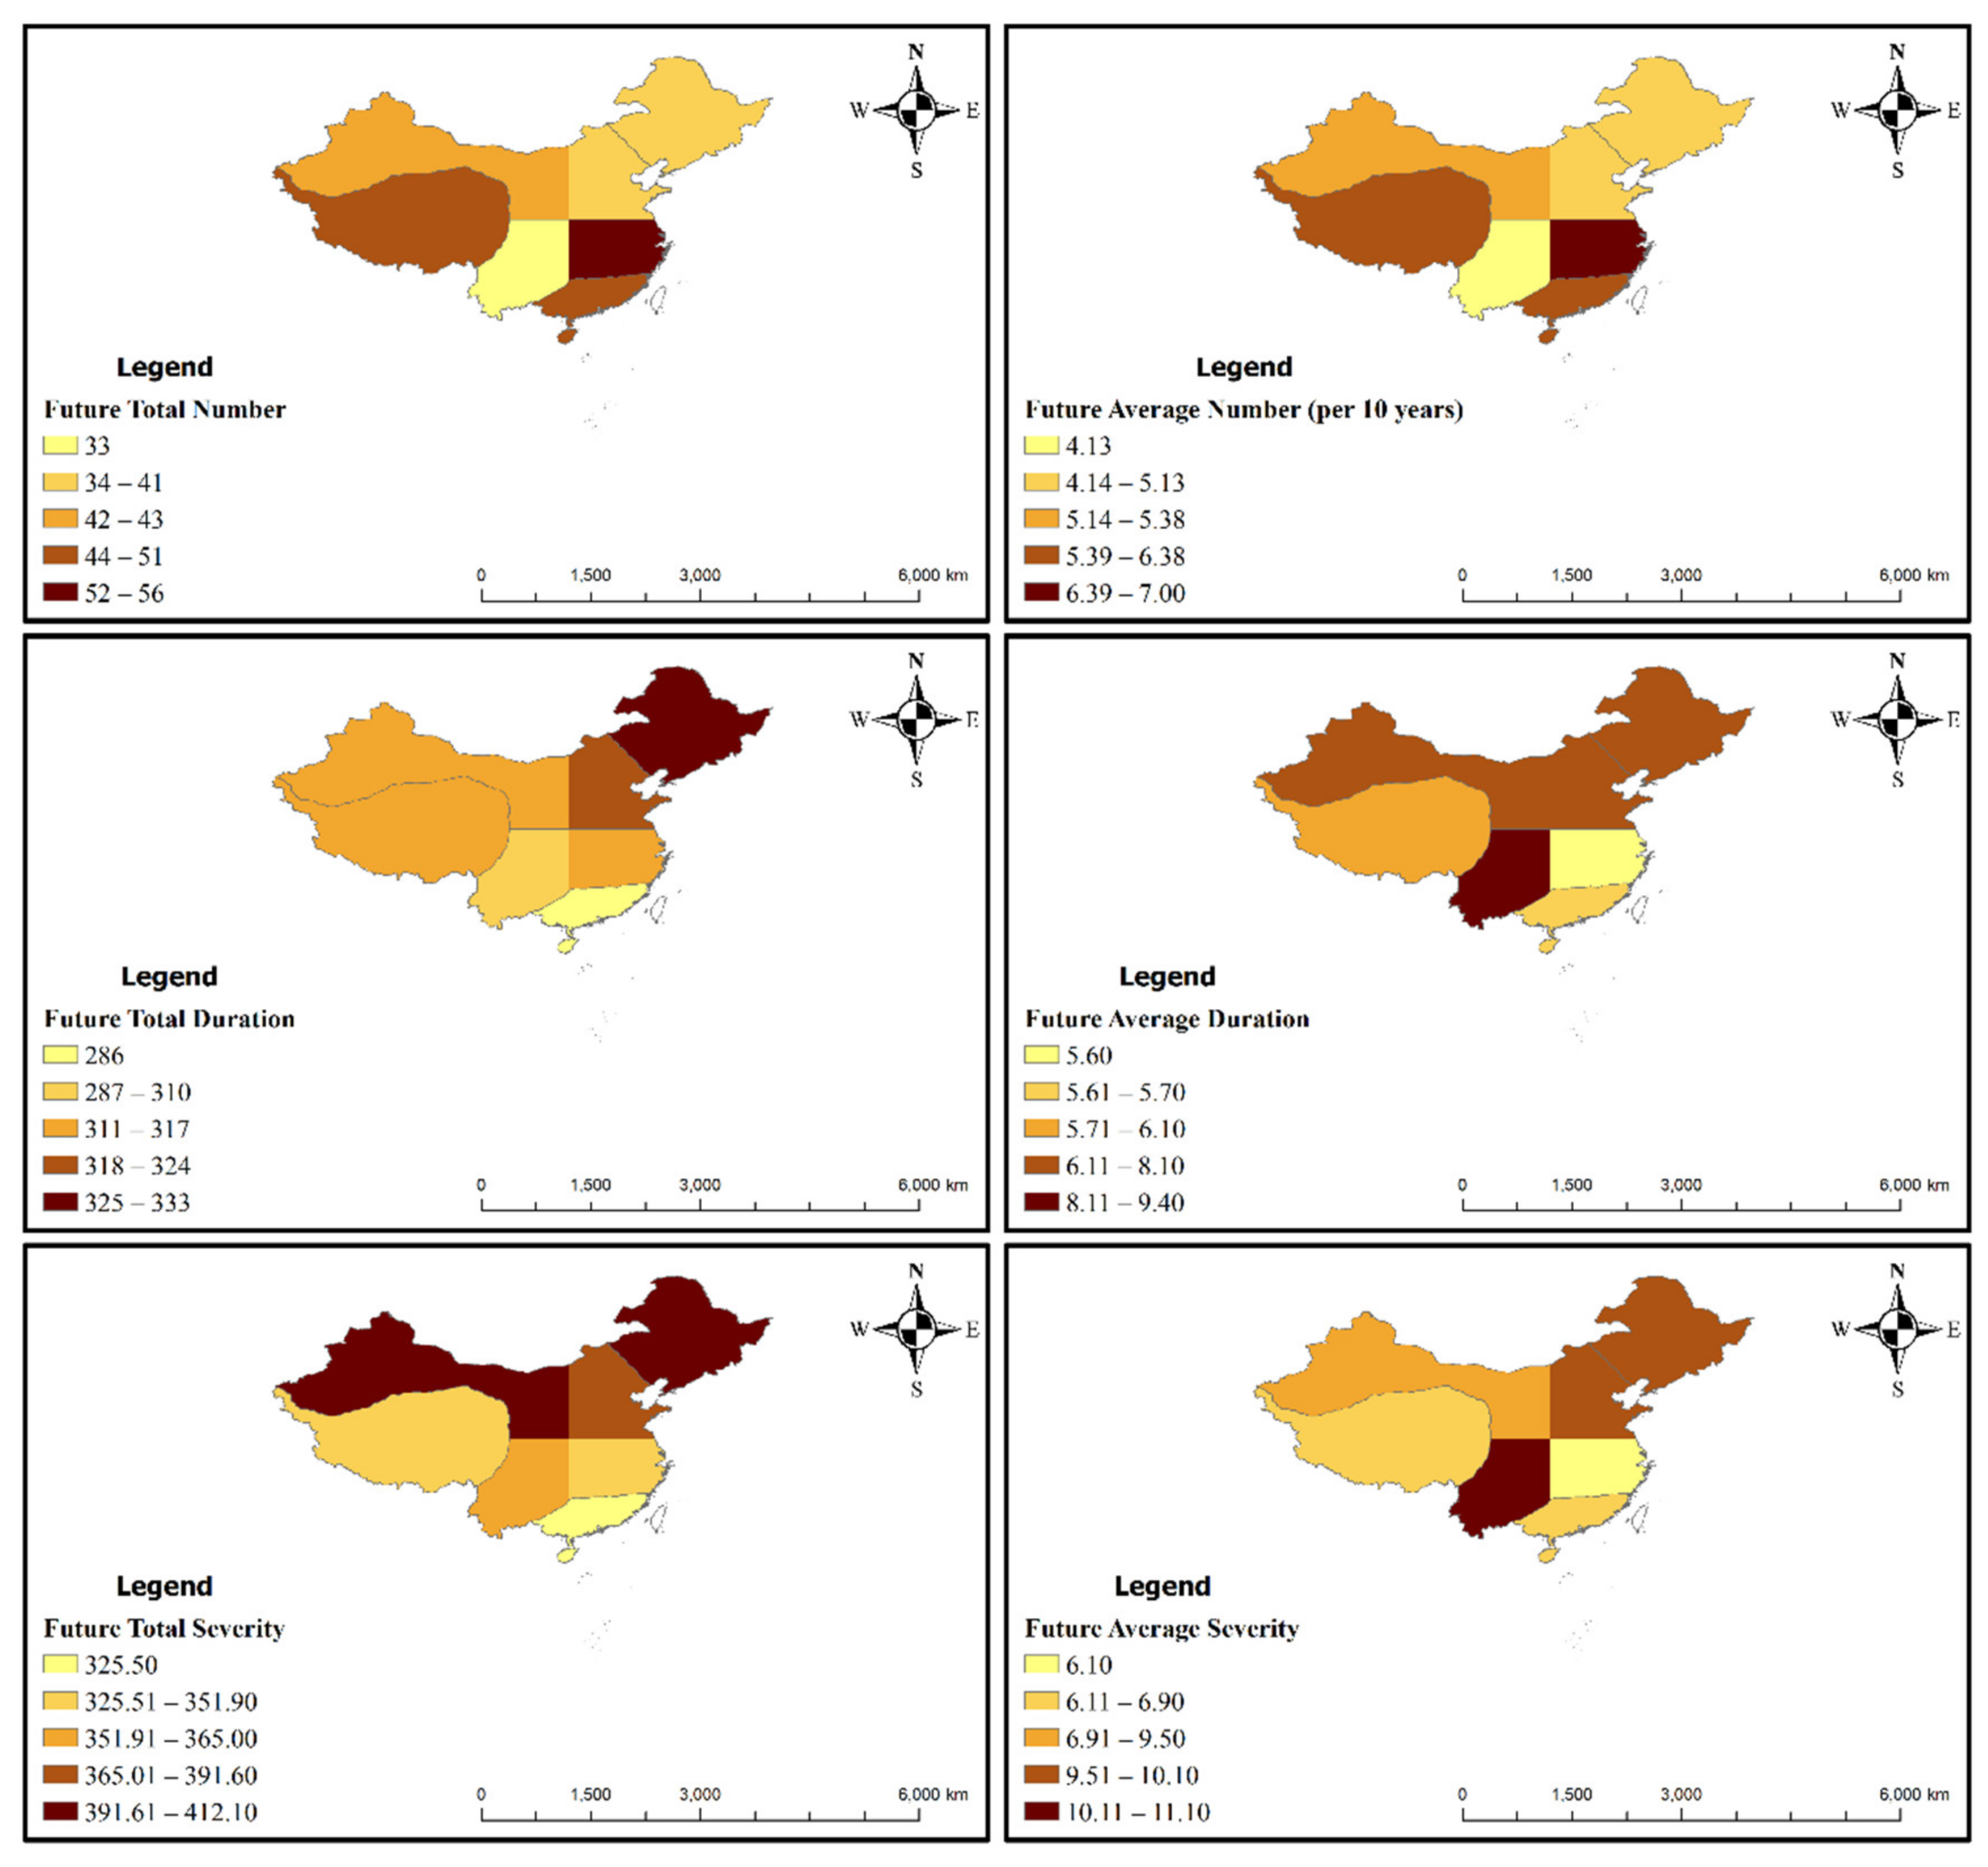
4.3.2. Characteristics of Future Droughts

As shown in Table 5, 45 drought events are projected to occur in the future across the whole study area on average, with 5.63 times per 10 years. Specific to each sub-region, EC is projected to experience the most frequent droughts (56 times) in the period of 2021–2100, with 7 times per 10 years, followed by Q-TP and SC, with 51 and 50 times in total and 6.38 and 6.25 times per 10 years. NWC, NC and NEC are projected to experience less frequent droughts, with 40–43 times in total, below the average level of the whole study area. SWC is projected to experience the least frequent droughts in the future, with only 33 times in total and 4.13 times per 10 years, about 27% lower than the average level.
As shown in Table 6, the drought duration in any sub-region accounts for more than 30% of the total duration (80 years) in the future, meaning that about one-third of the future period is expected to experience droughts, which is similar to the historical period. Among the sub-regions, NEC is projected to experience the longest droughts, up to 333 months, accounting for 35.1% of the total duration, followed by NC and NWC. SC is projected to experience the shortest droughts, up to 286 months, 9% shorter than the average level of the whole study area. From the perspective of average duration per drought event, a slightly different conclusion can be drawn. SWC, rather than NEC (with the longest total drought duration), is projected to experience the longest duration per drought event (up to 9.4 months), 31% longer than the average level of the whole study area. It is followed by NEC, NC and NWC, with 7.4–8.1 months for each drought event on average. Q-TP, SC and EC are projected to experience a shorter duration per drought event, 15–22% lower than the average level. To sum up, the northeast, the northern parts and the southwest of China (NWC, NC, NEC and SWC) are projected to experience a longer duration per drought event, and the western and southeast parts of China (Q-TP, EC and SC) are projected to experience a shorter duration per drought event.
NEC is projected to experience the most serious droughts in the future according to Table 7, followed by NWC and NC, with 6–11% higher than the average level. The other four sub-regions, SC, EC, Q-TP and SWC, are projected to experience less serious droughts comparatively, and the severity is 2–12% lower than the average level. As to the average severity per drought event, SWC is projected to experience the highest severity, about 29% higher than the average level, although the total severity for this sub-region is not serious. It means that SWC may be prone to suffer more severe single droughts in the future. EC is projected to experience the least serious severity per drought event; 29% lower than the average level.
Combined with the future drought number and drought duration, it can be concluded that the northeast (NEC), the northern parts (NWC and NC) and the southwest of China (SWC) are projected to experience less frequent droughts, yet with longer duration and stronger severity per drought event in the future, and the western (Q-TP) and southeast parts of China (EC and SC) are projected to experience more frequent droughts, yet with shorter duration and weaker severity per drought event, comparatively.
Figure 5 shows the spatial map of drought characteristics in the future period. A comparison with Figure 4 shows that, relative to other sub-regions, the number of droughts in Q-TP is projected to decline in the future, with a reduction in duration and severity. The frequency of droughts in EC and SC is projected to be significantly higher than those in other sub-regions, but the duration and severity of droughts in these two regions are projected to be relatively shorter and less severe. SWC, on the other hand, is expected to have the fewest drought occurrences, but with a longer average duration and a more severe average severity. In addition, the northern part of the country will continue to face severe challenges from drought in the future.

5. Discussion

The preceding sections assessed droughts for the historical (1961–2020) and the future periods (2021–2100), respectively. It was found that SWC, NWC, NC, NEC, Q-TP and SC experienced drying trends in the historical period. Xu et al. [43] also discussed the drought trends in China during the historical period and found that the western part of the North China Plain, Loess Plateau, Sichuan Basin and Yunnan–Guizhou Plateau had a significant drying trend, which was similar to our findings, while as for the Tibetan Plateau, they found that there was a wetting trend [43], a little different from our results. Such a difference may be related to the span of the time series (from 1961 to 2020 in our study and from 1961 to 2012 in their study) and the range of this sub-region. The Tibetan Plateau in their study does not correspond exactly to Q-TP in our study, but to the south of Q-TP.
Compared with the historical period, most areas of China (all the other sub-regions except for SWC) in the future are expected to show the same trends as those in the historical period. The drying trends in the northeast, the south and the western parts of China (NEC, SC and Q-TP) are projected to be even more serious in the future. This can be explained by the changes in temperature and precipitation shown in Table 2. The average annual precipitation of NEC and SC in the future is predicted to be decreased by 3.3% and 1.5% on average compared with the historical period, and the temperature is predicted to be increased by 1.3 °C and 1.7 °C. The decreased precipitation and the increased temperature would aggravate the drying trends of these sub-regions. As for Q-TP, it is inferred that the higher warming (2.9 °C) may offset the increase in precipitation and thus lead to the drying trend intensifying. Some studies have shown that the temperature is the decisive factor in the northwest of China [44,45,46], and the impacts of increased temperature and the resulting increased evapotranspiration on future drought in these regions are great [47,48,49]. SWC is the only sub-region with a quite opposite trend, changing from drying in the historical period to wetting in the future. This may be due to the increased 16.8% precipitation in the future, since precipitation is the decisive factor for future drought prediction in the southern part of China [50].
Concerning the specific drought characteristics, the drought numbers are projected to remain unchanged as a whole, while the duration is projected to be longer and the severity is projected to be more severe in the future for the whole study area. Meanwhile, such characteristics show great spatial differences. Specifically, compared to the historical period, the northeast and parts of the north in China (NEC and NWC) are projected to experience more frequent droughts with stronger severity, which is also confirmed by other studies, for example, Ke et al. [51] concluded that the drought days and drought intensity were projected to increase over northeast China during the 21st century. The result of Khan et al. [52] also indicated that the drought intensity in the sub-region of northeast China was projected to increase during the 21st century. The southeast of China (EC and SC) is projected to experience more frequent droughts with shorter duration and weaker severity, in which EC has the most obvious increase in drought number and also the most obvious decrease in duration and severity. In the study of Spinoni et al. [10], they also predicted that southeastern China would experience more frequent droughts in the future, which is consistent with our results, while there are also some differences between the findings, which is that severe droughts were projected to happen over southeastern China according to their study while less severity is projected to occur according to ours. One of the reasons for the difference is that their conclusion was drawn through the spatial comparisons at a global scale, while our conclusion was drawn through both the spatial and the temporal comparisons at a national scale. That is, compared to both the other sub-regions and the historical period, the southeast of China is projected to experience droughts with less severity in the future. The west (Q-TP), the southwest (SWC) and parts of north China (NC) are projected to experience less frequent droughts with longer duration and stronger severity, in which SWC has the most obvious decrease in drought number yet the most obvious increase in duration and severity per event. The result that SWC is projected to experience more severe droughts in the future is consistent with the findings of Huang et al. [21], Wang and Chen [23] and Wang et al. [53], in which they also found that southwest China was projected to become considerably drier and may experience more severe droughts in this century based on SPEI.
In general, the droughts in most areas of China (especially for NEC, NC, Q-TP and SWC) in the future are projected to be more severe and the drought duration is projected to be longer than those in the historical period, which may lead to greater destruction, and also the water shortage and uneven distribution in these sub-regions may even become worse in the future. Thus, it reminds us that specific drought adaptation and water resource management strategies should be systematically and carefully considered by stakeholders in the face of climate change. The droughts in the southeast of China (EC and SC) are projected to be more frequent, whereas the severity is projected to be lightened and the duration is projected to be shortened.
The results and discussion of this study can be used to initiate and strengthen drought adaptation measures at a regional and national scale, especially in the western parts of China (SWC and Q-TP). As for the drought in northern parts of China (NWC, NC and NEC), although some studies suggested that it will abate in the future [21], our work indicates that the future drought in these regions still deserves more attention.

6. Conclusions and Limitations

In order to better understand how droughts have changed in China during the historical period (1961–2020) and will change in the future (2021–2100), a spatial–temporal assessment of drought based on SPEI was carried out from a climatic perspective. The main findings are summarized as follows.
  • Twelve-month SPEI could not only reflect the long-term trend but also maintain interannual drought changes and have low susceptibility to extreme events. It is more suitable for assessing meteorological drought over a long time span.
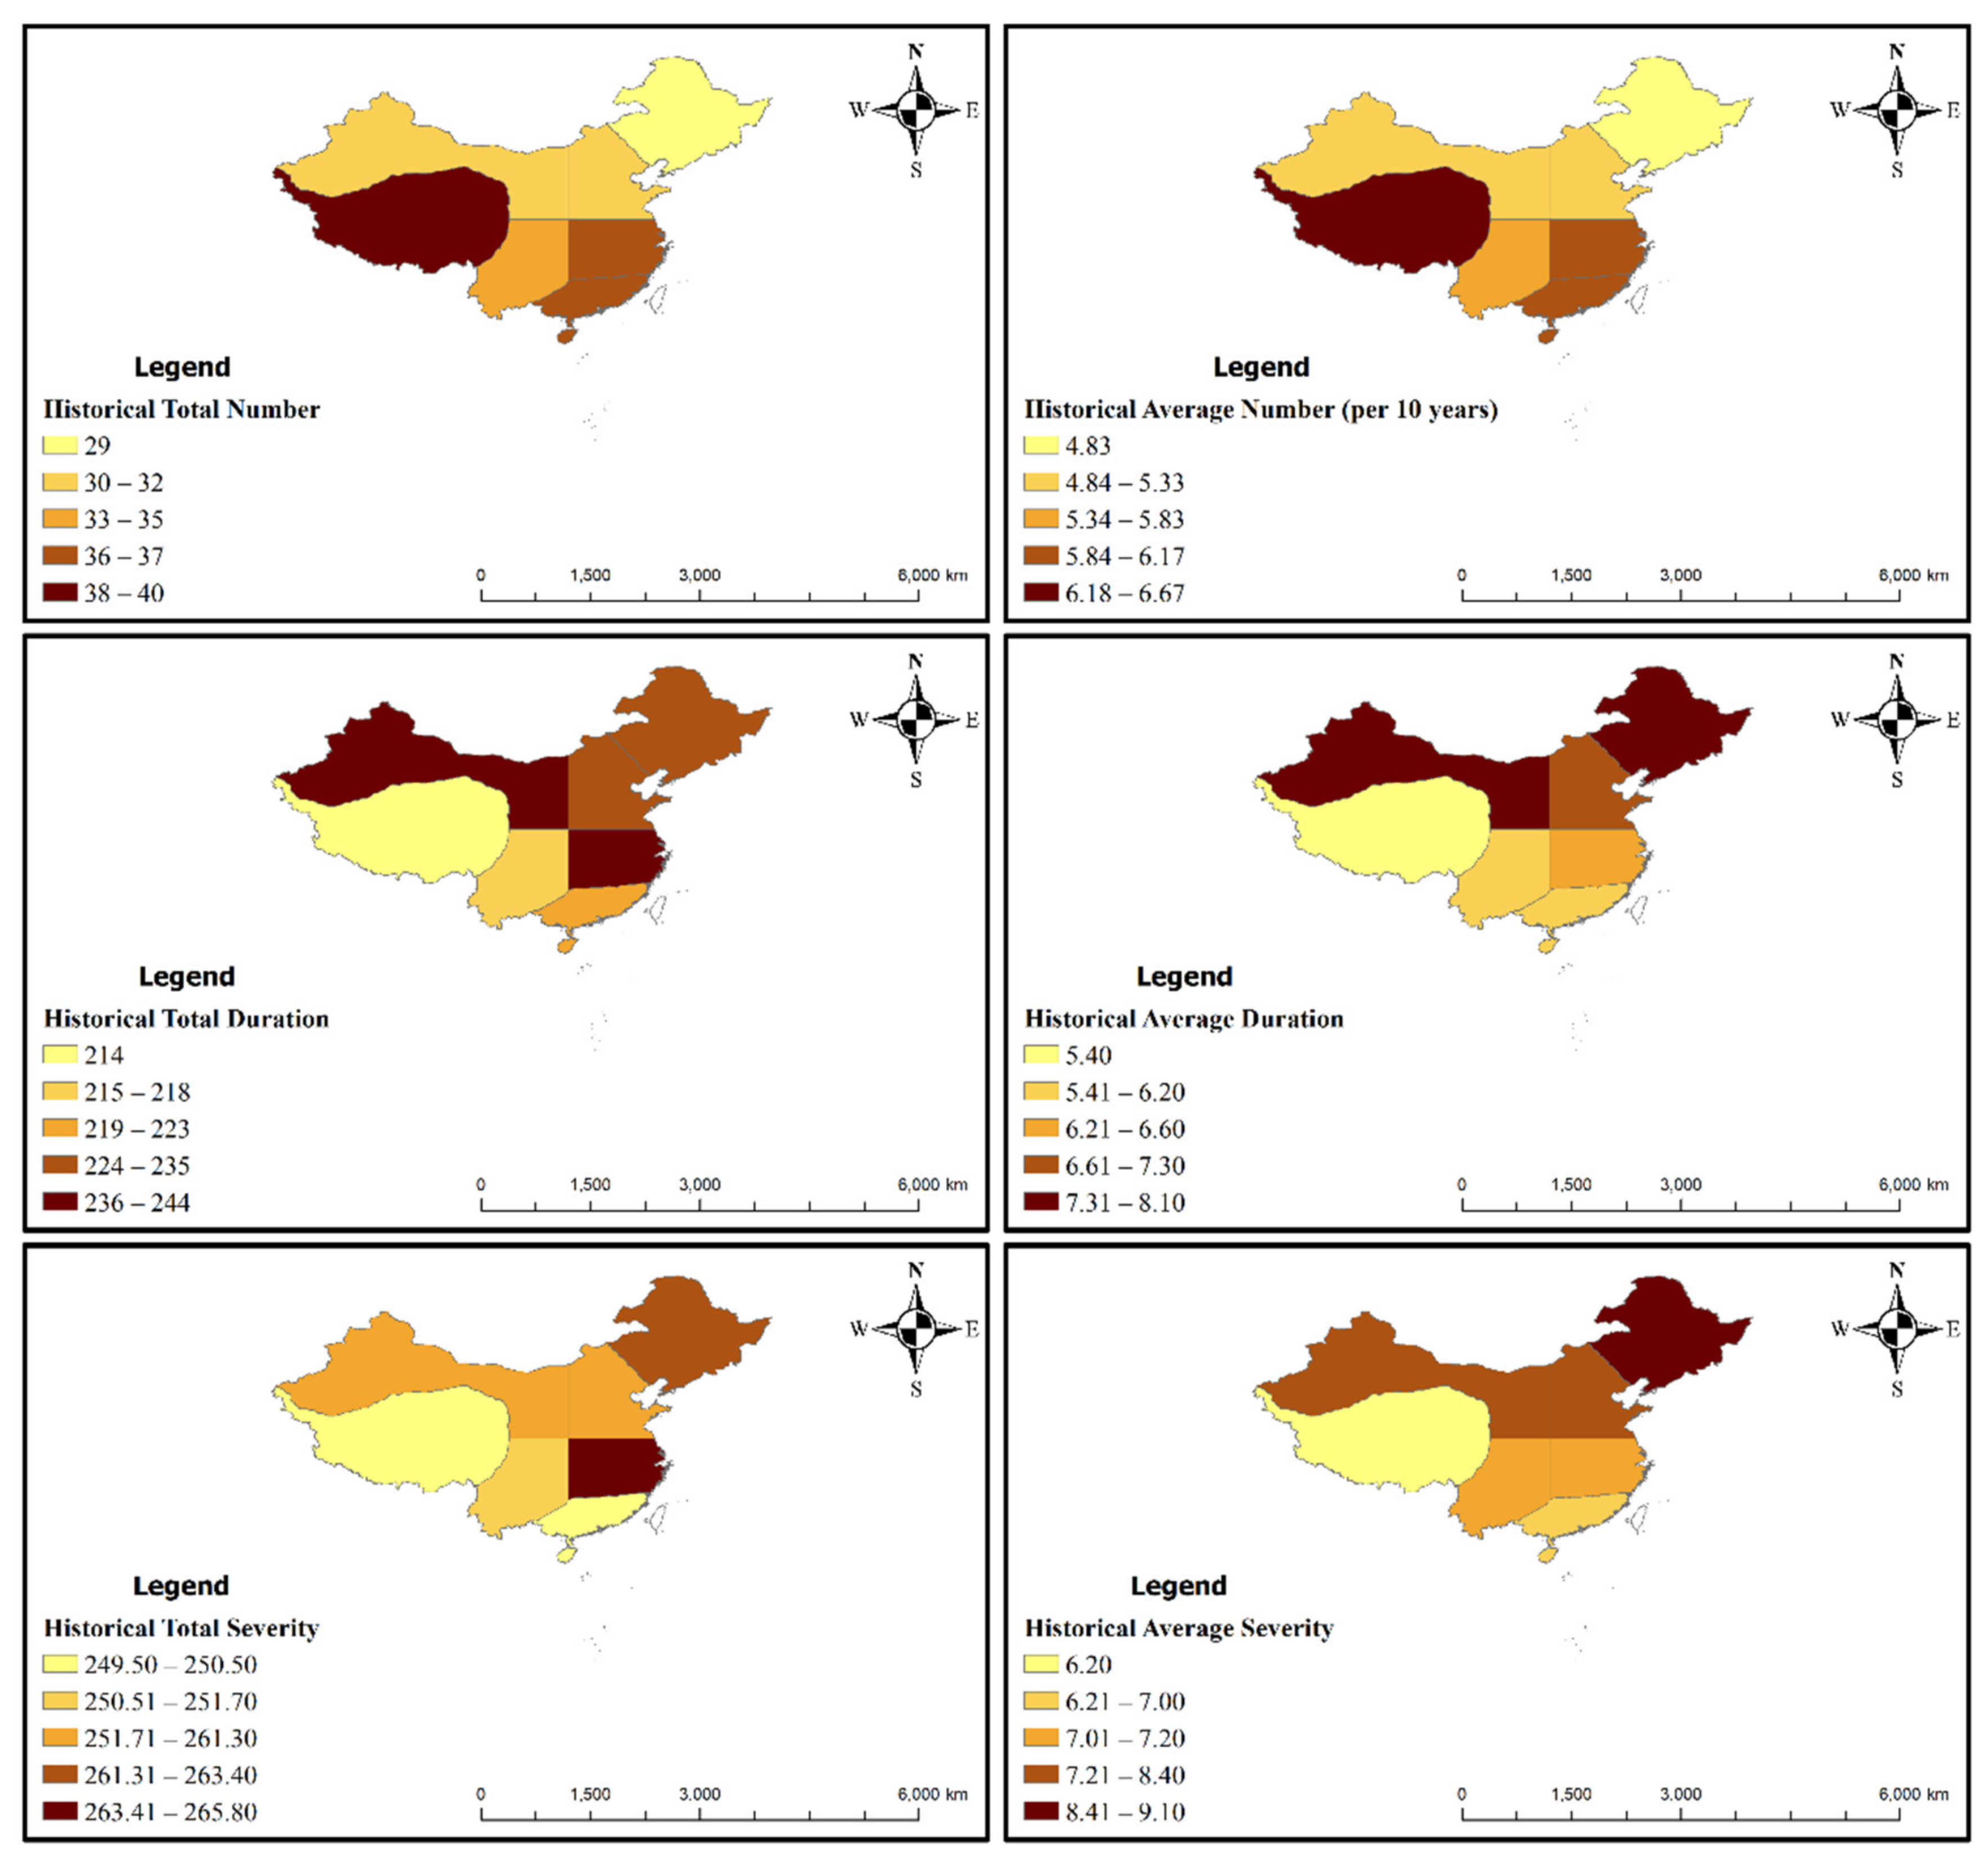
  • In the historical period of 1961–2020, the number of droughts decreased gradually from the south of China to the north. The northeast and the northern areas of China (NWC, NC and NEC) experienced less frequent droughts, yet with a longer duration and stronger severity per drought event, and the western, the southwest and the southeast areas of China (EC, SC, SWC, and Q-TP) experienced more frequent droughts, yet with a shorter duration and weaker severity per drought event.
  • In the future period of 2021–2100, most areas of China (especially for NEC, NC, Q-TP and SWC) are projected to suffer more severe droughts with longer duration. Specific to sub-regions, more frequent drought was predicted in EC, SC and Q-TP with relatively shorter duration and weaker severity. Less frequent drought but with longer duration and stronger severity was predicted in the northern areas of China (NWC, NC and NEC), indicating that these areas may still be more vulnerable to droughts. SWC may suffer more severe single droughts with longer duration in the future, meaning that this area is projected to be greatly affected by droughts during 2021–2100.
Relevant findings may be helpful in developing strategies for coping with future droughts and water resource risk management in the context of climate change and global warming.
However, a few limitations remain in the current study. Although the division of sub-regions in this paper is according to the meteorological administrative department of the long-term research and practice, it is still difficult to finely reflect spatial variabilities of historical and future drought conditions, especially in the high-altitude area. This aspect is worth further study to improve the sub-regions to a finer level. It is also possible to study each pixel based on grid data, but this method is computationally expensive. Furthermore, it is necessary to point out that SPEI cannot reflect the variation in water availability, which is of great concern to water resource management, particularly during drought episodes. Additionally, only one future scenario (RCP4.5) and the optimal GCMs for each sub-region were used in this study to analyze the possibility of drought over China in the future. Although our findings are helpful to develop effective measures to deal with climate change, there are still some uncertainty issues when only using a single RCP and a single GCM. In a future study, we will further consider the uncertainties caused by various RCPs and GCMs.

Author Contributions

Conceptualization, R.H. and Z.L. (Zhanling Li); methodology, R.H.; software, R.H.; formal analysis, R.H. and Y.H.; data curation, R.H. and Y.H.; writing—original draft preparation, R.H.; writing—review and editing, Z.L. (Zhanling Li) and Z.L. (Zhanjie Li); supervision, Z.L. (Zhanling Li); funding acquisition, Z.L. (Zhanjie Li). All authors have read and agreed to the published version of the manuscript.

Funding

This study is supported by NSFC (No. 51779007).

Institutional Review Board Statement

Not applicable.

Informed Consent Statement

Not applicable.

Data Availability Statement

The historical climate data are available at the China Meteorological Data Sharing Service System (http://data.cma.cn/, accessed on 16 June 2021). The future projected climate data are available at the Centre for Environment Data Analysis, a United Kingdom organization (http://www.ceda.ac.uk, accessed on 16 June 2021).

Acknowledgments

The authors thank the anonymous referees for their comments and suggestions.

Conflicts of Interest

The authors declare no conflict of interest.

References

  1. Mishra, A.K.; Singh, V.P. A review of drought concepts. J. Hydrol. 2010, 391, 202–216. [Google Scholar] [CrossRef]
  2. Piao, S.; Ciais, P.; Huang, Y.; Shen, Z.; Peng, S.; Li, J.; Zhou, L.; Liu, H.; Ma, Y.; Ding, Y.; et al. The impacts of climate change on water resources and agriculture in China. Nature 2010, 467, 43–51. [Google Scholar] [CrossRef] [PubMed]
  3. Atlas of Mortality and Economic Losses from Weather, Climate and Water Extremes. Available online: https://public.wmo.int/en/our-mandate/water/drought (accessed on 5 June 2021).
  4. Drought Conditions and Management Strategies in China. Available online: http://www.droughtmanagement.info/literature/UNW-DPC_NDMP_Country_Report_China_2014.pdf (accessed on 5 June 2021).
  5. Ashrafi, S.M.; Gholami, H.; Najafi, M.R. Uncertainties in runoff projection and hydrological drought assessment over Gharesu basin under CMIP5 RCP scenarios. J. Water Clim. 2020, 11, 145–163. [Google Scholar] [CrossRef]
  6. Adib, A.; Mirsalari, S.B.; Ashrafi, S.M. Prediction of meteorological and hydrological phenomena by different climatic scenarios in the Karkheh watershed (south west of Iran). Sci. Iran. 2020, 27, 1814–1825. [Google Scholar] [CrossRef] [Green Version]
  7. Sung, J.H.; Park, J.; Jeon, J.-J.; Seo, S.B. Assessment of Inter-Model Variability in Meteorological Drought Characteristics Using CMIP5 GCMs over South Korea. KSCE J. Civ. Eng. 2020, 24, 2824–2834. [Google Scholar] [CrossRef]
  8. Spinoni, J.; Barbosa, P.; De Jager, A.; McCormick, N.; Naumann, G.; Vogt, J.V.; Magni, D.; Masante, D.; Mazzeschi, M. A new global database of meteorological drought events from 1951 to 2016. J. Hydrol. Reg. Stud. 2019, 22, 100593. [Google Scholar] [CrossRef]
  9. Sharafati, A.; Nabaei, S.; Shahid, S. Spatial assessment of meteorological drought features over different climate regions in Iran. Int. J. Climatol. 2019, 40, 1864–1884. [Google Scholar] [CrossRef]
  10. Spinoni, J.; Barbosa, P.; Bucchignani, E.; Cassano, J.; Cavazos, T.; Christensen, J.H.; Christensen, O.B.; Coppola, E.; Evans, J.; Geyer, B.; et al. Future Global Meteorological Drought Hot Spots: A Study Based on CORDEX Data. J. Clim. 2020, 33, 3635–3661. [Google Scholar] [CrossRef]
  11. Campozano, L.; Ballari, D.; Montenegro, M.; Avilés, A. Future Meteorological Droughts in Ecuador: Decreasing Trends and Associated Spatio-Temporal Features Derived from CMIP5 Models. Front. Earth Sci. 2020, 8. [Google Scholar] [CrossRef]
  12. Jincy Rose, M.A.; Chithra, N.R. Evaluation of temporal drought variation and projection in a tropical river basin of Kerala. J. Water Clim. Chang. 2020, 11, 115–132. [Google Scholar] [CrossRef]
  13. Nuri Balov, M.; Altunkaynak, A. Spatio-temporal evaluation of various global circulation models in terms of projection of different meteorological drought indices. Environ. Earth Sci. 2020, 79, 126. [Google Scholar] [CrossRef]
  14. Lu, E.; Luo, Y.; Zhang, R.; Wu, Q.; Liu, L. Regional atmospheric anomalies responsible for the 2009–2010 severe drought in China. J. Geophys. Res. Atmos. 2011, 116. [Google Scholar] [CrossRef]
  15. Zhang, L.; Xiao, J.; Li, J.; Wang, K.; Lei, L.; Guo, H. The 2010 spring drought reduced primary productivity in southwestern China. Environ. Res. Lett. 2012, 7, 045706. [Google Scholar] [CrossRef] [Green Version]
  16. Zhao, C.; Deng, X.; Yuan, Y.; Yan, H.; Liang, H. Prediction of Drought Risk Based on the WRF Model in Yunnan Province of China. Adv. Meteorol. 2013, 2013, 295856. [Google Scholar] [CrossRef]
  17. Wang, A.; Lettenmaier, D.P.; Sheffield, J. Soil Moisture Drought in China, 1950–2006. J. Clim. 2011, 24, 3257–3271. [Google Scholar] [CrossRef]
  18. Wang, P.; Wu, X.; Hao, Y.; Wu, C.; Zhang, J. Is Southwest China drying or wetting? Spatiotemporal patterns and potential causes. Theor. Appl. Climatol. 2019, 139, 1–15. [Google Scholar] [CrossRef]
  19. Li, Y.; Ren, F.; Li, Y.; Wang, P.; Yan, H. Characteristics of the regional meteorological drought events in Southwest China during 1960–2010. J. Meteorol. Res. 2014, 28, 381–392. [Google Scholar] [CrossRef]
  20. Wang, Z.; Zhong, R.; Lai, C.; Zeng, Z.; Lian, Y.; Bai, X. Climate change enhances the severity and variability of drought in the Pearl River Basin in South China in the 21st century. Agric. For. Meteorol. 2018, 249, 149–162. [Google Scholar] [CrossRef]
  21. Huang, J.; Zhai, J.; Jiang, T.; Wang, Y.; Li, X.; Wang, R.; Xiong, M.; Su, B.; Fischer, T. Analysis of future drought characteristics in China using the regional climate model CCLM. Clim. Dyn. 2017, 50, 507–525. [Google Scholar] [CrossRef]
  22. Li, L.; She, D.; Zheng, H.; Lin, P.; Yang, Z.-L. Elucidating Diverse Drought Characteristics from Two Meteorological Drought Indices (SPI and SPEI) in China. J. Hydrometeorol. 2020, 21, 1513–1530. [Google Scholar] [CrossRef]
  23. Wang, L.; Chen, W. A CMIP5 multimodel projection of future temperature, precipitation, and climatological drought in China. Int. J. Climatol. 2013, 34, 2059–2078. [Google Scholar] [CrossRef]
  24. Tian, D.; Guo, Y.; Dong, W. Future changes and uncertainties in temperature and precipitation over China based on CMIP5 models. Adv. Atmos. Sci. 2015, 32, 487–496. [Google Scholar] [CrossRef]
  25. Wang, S.; Li, W. Climate of China; China Meteorological Press: Beijing, China, 2007. [Google Scholar]
  26. Li, Z.; Li, Q.; Wang, J.; Feng, Y.; Shao, Q. Impacts of projected climate change on runoff in upper reach of Heihe River basin using climate elasticity method and GCMs. Sci. Total Environ. 2020, 716, 137072. [Google Scholar] [CrossRef] [PubMed]
  27. Gao, J.; Liu, L.; Wu, S. Hazards of extreme events in China under different global warming targets. Big Earth Data 2020, 4, 153–174. [Google Scholar] [CrossRef]
  28. Vicente-Serrano, S.M.; Beguería, S.; López-Moreno, J.I. A Multiscalar Drought Index Sensitive to Global Warming: The Standardized Precipitation Evapotranspiration Index. J. Clim. 2010, 23, 1696–1718. [Google Scholar] [CrossRef] [Green Version]
  29. Thornthwaite, C.W. An Approach toward a Rational Classification of Climate. Geogr. Rev. 1948, 38, 55–94. [Google Scholar] [CrossRef]
  30. Mahmoudi, P.; Rigi, A.; Miri Kamak, M. Evaluating the sensitivity of precipitation-based drought indices to different lengths of record. J. Hydrol. 2019, 579, 124181. [Google Scholar] [CrossRef]
  31. Pei, Z.; Fang, S.; Wang, L.; Yang, W. Comparative Analysis of Drought Indicated by the SPI and SPEI at Various Timescales in Inner Mongolia, China. Water 2020, 12, 1925. [Google Scholar] [CrossRef]
  32. Zhao, H.; Gao, G.; An, W.; Zou, X.; Li, H.; Hou, M. Timescale differences between SC-PDSI and SPEI for drought monitoring in China. Phys. Chem. Earth 2017, 102, 48–58. [Google Scholar] [CrossRef]
  33. Potop, V.; Boroneanţ, C.; Možný, M.; Štěpánek, P.; Skalák, P. Observed spatiotemporal characteristics of drought on various time scales over the Czech Republic. Theor. Appl. Climatol. 2013, 115, 563–581. [Google Scholar] [CrossRef]
  34. Jin, X.; Qiang, H.; Zhao, L.; Jiang, S.; Cui, N.; Cao, Y.; Feng, Y. SPEI-based analysis of spatio-temporal variation characteristics for annual and seasonal drought in the Zoige Wetland, Southwest China from 1961 to 2016. Theor. Appl. Climatol. 2019, 139, 711–725. [Google Scholar] [CrossRef]
  35. Liu, X.; Wang, S.; Zhou, Y.; Wang, F.; Li, W.; Liu, W. Regionalization and Spatiotemporal Variation of Drought in China Based on Standardized Precipitation Evapotranspiration Index (1961–2013). Adv. Meteorol. 2015, 2015, 950262. [Google Scholar] [CrossRef] [Green Version]
  36. Zhou, Z.; Shi, H.; Fu, Q.; Li, T.; Gan, T.Y.; Liu, S.; Liu, K. Is the cold region in Northeast China still getting warmer under climate change impact? Atmos. Res. 2020, 237, 104864. [Google Scholar] [CrossRef]
  37. Duan, X.; Gu, Z.; Li, Y.; Xu, H. The spatiotemporal patterns of rainfall erosivity in Yunnan Province, southwest China: An analysis of empirical orthogonal functions. Glob. Planet Chang. 2016, 144, 82–93. [Google Scholar] [CrossRef]
  38. Liu, Y.; Chen, J.; Pan, T. Spatial and temporal patterns of drought hazard for China under different RCP scenarios in the 21st century. Int. J. Disaster Risk Reduct. 2021, 52, 101948. [Google Scholar] [CrossRef]
  39. Mann, H.B. Nonparametric Tests against Trend. Econometrica 1945, 13, 245–259. [Google Scholar] [CrossRef]
  40. Kendall, M.G. Rank Correlation Methods. Available online: https://psycnet.apa.org/record/1948-15040-000 (accessed on 13 March 2021).
  41. Sen, P.K. Estimates of the Regression Coefficient Based on Kendall’s Tau. J. Am. Stat. Assoc. 1968, 63, 1379–1389. [Google Scholar] [CrossRef]
  42. Ma, B.; Zhang, B.; Jia, L.; Huang, H. Conditional distribution selection for SPEI-daily and its revealed meteorological drought characteristics in China from 1961 to 2017. Atmos. Res. 2020, 246, 105108. [Google Scholar] [CrossRef]
  43. Xu, K.; Yang, D.; Yang, H.; Li, Z.; Qin, Y.; Shen, Y. Spatio-temporal variation of drought in China during 1961–2012: A climatic perspective. J. Hydrol. 2015, 526, 253–264. [Google Scholar] [CrossRef]
  44. Chen, H.; Sun, J. Changes in Drought Characteristics over China Using the Standardized Precipitation Evapotranspiration Index. J. Clim. 2015, 28, 5430–5447. [Google Scholar] [CrossRef]
  45. Chen, H.; Sun, J. Anthropogenic warming has caused hot droughts more frequently in China. J. Hydrol. 2017, 544, 306–318. [Google Scholar] [CrossRef]
  46. Zhou, B.; Xu, Y.; Wu, J.; Dong, S.; Shi, Y. Changes in temperature and precipitation extreme indices over China: Analysis of a high-resolution grid dataset. Int. J. Climatol. 2015, 36, 1051–1066. [Google Scholar] [CrossRef]
  47. Dong, Q.; Wang, W.; Shao, Q.; Xing, W.; Ding, Y.; Fu, J. The response of reference evapotranspiration to climate change in Xinjiang, China: Historical changes, driving forces, and future projections. Int. J. Climatol. 2019, 40, 235–254. [Google Scholar] [CrossRef]
  48. Li, S.-Y.; Miao, L.-J.; Jiang, Z.-H.; Wang, G.-J.; Gnyawali, K.R.; Zhang, J.; Zhang, H.; Fang, K.; He, Y.; Li, C. Projected drought conditions in Northwest China with CMIP6 models under combined SSPs and RCPs for 2015–2099. Adv. Clim. Chang. Res. 2020, 11, 210–217. [Google Scholar] [CrossRef]
  49. Jian, D.; Ma, Z.; Chen, L.; Duan, J.; Mitchell, D.; Zheng, Z.; Lv, M.; Zhang, H. Effects of 1.5 °C and 2 °C of warming on regional reference evapotranspiration and drying: A case study of the Yellow River Basin, China. Int. J. Climatol. 2020, 41, 791–810. [Google Scholar] [CrossRef]
  50. Yao, N.; Li, L.; Feng, P.; Feng, H.; Liu, D.L.; Liu, Y.; Jiang, K.; Hu, X.; Li, Y. Projections of drought characteristics in China based on a standardized precipitation and evapotranspiration index and multiple GCMs. Sci. Total Environ. 2020, 704, 135245. [Google Scholar] [CrossRef]
  51. Ke, L.; Da-Bang, J.; Jian-Yong, M. Drought over China in the 21st Century: Results of RegCM3. Atmos. Ocean. Sci. Lett. 2012, 5, 509–513. [Google Scholar] [CrossRef] [Green Version]
  52. Khan, M.I.; Liu, D.; Fu, Q.; Saddique, Q.; Faiz, M.A.; Li, T.; Qamar, M.U.; Cui, S.; Cheng, C. Projected Changes of Future Extreme Drought Events under Numerous Drought Indices in the Heilongjiang Province of China. Water Resour. Manag. 2017, 31, 3921–3937. [Google Scholar] [CrossRef]
  53. Wang, L.; Chen, W.; Zhou, W. Assessment of future drought in Southwest China based on CMIP5 multimodel projections. Adv. Atmos. Sci. 2014, 31, 1035–1050. [Google Scholar] [CrossRef]
Figure 1. Digital elevation model of China and its distribution of seven sub-regions.
Atmosphere 12 00787 g001
Figure 2. Different timescales of SPEI (1-, 3-, 6-, 12-, 24-, 48-month) for NWC during the historical period (1961–2020). The dotted line is the threshold level of −0.5.
Atmosphere 12 00787 g002
Figure 3. SPEI for different sub-regions during the historical and future periods. The dotted line is the threshold level of −0.5.
Atmosphere 12 00787 g003
Figure 4. Spatial map of meteorological drought characteristics in the historical period.
Atmosphere 12 00787 g004
Figure 5. Spatial map of drought characteristics in the future period.
Atmosphere 12 00787 g005
Table 1. The average annual precipitation (mm) and temperature (°C) during the historical (1961–2020) and the future (2021–2100) periods for each sub-region, together with the information of the area (million km2) and meteorological station numbers.
VariableSub-RegionArea (Million km2)Meteorological Station NumberHistorical
(mm/°C)
Future
(mm/°C)
Changes
(%/°C)
PrecipitationEC0.79480137113760.4
SC0.5032516781653−1.5
SWC1.024361156135016.8
Q-TP2.4111735546731.5
NWC2.3629419623117.8
NC0.98568524523−0.2
NEC1.54252515498−3.3
TemperatureEC0.7948015.916.50.6
SC0.5032520.021.31.3
SWC1.0243613.714.50.8
Q-TP2.41117−1.91.02.9
NWC2.362947.48.30.9
NC0.985689.09.50.5
NEC1.542522.34.01.7
Table 2. The effect before and after correction of GCMs in historical period.
Variable Sub-RegionNRMSEMAEVar (*100)
BeforeAfterBeforeAfterBeforeAfter
PrecipitationEC0.990.8849.5943.1953.6042.00
SC1.440.7194.1152.23305.0091.50
SWC1.000.4356.7622.99115.0055.10
Q-TP1.080.4125.307.7018.008.44
NWC2.440.6327.295.896.631.79
NC0.650.6121.0319.6622.7022.20
NEC0.500.4415.4612.8028.3022.30
TemperatureEC0.500.273.531.830.860.71
SC0.350.301.641.330.450.35
SWC0.700.233.311.020.640.36
Q-TP0.450.193.061.141.150.63
NWC0.470.175.071.401.321.36
NC0.330.163.011.301.531.25
NEC0.250.152.701.632.522.06
* means the multiplication.
Table 3. Drought characteristics of NWC derived from SPEI at different timescales.
Timescale1-Month3-Month6-Month12-Month24-Month48-Month
Number139796131207
Total Duration225220224240239277
Average Duration 1.62.83.77.712.039.6
Total Severity258.1255.7256.4261.3263.2295.8
Average Severity 1.93.24.28.413.242.3
Table 4. The results of the Mann–Kendall test and Sen’s slope for SPEI in each sub-region during the historical (1961–2020) and future (2021–2100) periods.
Sub-RegionHistoricalFuture
EC0.0290.016
SC−0.026−0.158 **
SWC−0.264 **0.186 **
Q-TP−0.045−0.089 **
NWC−0.256 **−0.111 **
NC−0.254 **−0.180 **
NEC−0.105 **−0.239 **
**/** means that there is a significant increasing/decreasing trend in the SEPI series at a 0.01 confidence level.
Table 5. Drought numbers in each sub-region during the historical period (1961–2020) and the future period (2021–2100).
Sub-RegionHistoricalFuture
TotalAverage/10 YearTotalAverage/10 Year
EC376.17567.00
SC366.00506.25
SWC355.83334.13
Q-TP406.67516.38
NWC315.17435.38
NC325.33405.00
NEC294.83415.13
Average345.67455.63
Table 6. Drought duration in each sub-region during the historical period (1961–2020) and the future period (2021–2100).
Sub-RegionHistoricalFuture
Total DurationAverage Duration (Per Drought Event)Total DurationAverage Duration (Per Drought Event)
EC244(34.4%)6.6313(33.0%)5.6
SC223(31.5%)6.2286(30.1%)5.7
SWC218(30.8%)6.2310(32.7%)9.4
Q-TP214(30.2%)5.4313(33.0%)6.1
NWC240(33.9%)7.7317(33.4%)7.4
NC235(33.2%)7.3324(34.1%)8.1
NEC235(33.2%)8.1333(35.1%)8.1
Average230(32.4%)6.8314(33.1%)7.2
Table 7. Drought severity in each sub-region during the historical period (1961–2020) and the future period (2021–2100).
Sub-RegionHistoricalFuture
Total SeverityAverage Severity (Per Drought Event)Total SeverityAverage Severity (Per Drought Event)
EC265.87.2342.76.1
SC250.57.0325.56.5
SWC251.77.2365.011.1
Q-TP249.56.2351.96.9
NWC261.38.4408.59.5
NC259.88.1391.69.8
NEC263.49.1412.110.1
Average257.47.6371.08.6
Publisher’s Note: MDPI stays neutral with regard to jurisdictional claims in published maps and institutional affiliations.

