Abstract
This study analyzed the diurnal variations of summer deep convective precipitation (DCP) over the Qinghai-Tibet Plateau (QTP) and its southern region. The results show that DCP is the main type of precipitation over the QTP. The precipitation intensity of DCP is less than 3 mm/h over the QTP, which is much lower than the precipitation intensity in non-plateau regions. DCP over non-plateau regions is related to the convergence of surface wind, but that over the QTP are not. The mean maximum echo of DCP is less than 26 dBZ over the QTP, less than in non-plateau regions. The mean altitude of maximum echo decreases from about 7.5 km in the western plateau to 6 km in the eastern plateau, while it reaches only 4.5–5 km in the non-plateau region. The DCP frequency peak occurs in the afternoon in the major area of the QTP including valley region. The peak time of DCP frequency is different from its intensity, and the former is 1 to 2 h earlier. Study also indicates strong diurnal variations in frequency, intensity, and the maximum echo over the QTP, which is consistent with diurnal changes of geopotential height fields of 500 hPa and 200 hPa.
1. Introduction
It is well known that the diurnal variation of atmospheric parameters in the troposphere is a common phenomenon. For example, Haurwitz and Cowley [1] pointed out the existence of diurnal oscillation of surface pressure, Bonner et al. [2] indicated strong diurnal variations of maximum wind in frequency in the low atmosphere, and Short and Wallace [3] revealed the variations of cloud cover during day and night. The diurnal variation of atmospheric parameters essentially reflects the dynamical nature of the atmosphere.
It is important to explain the precipitation regularity of diurnal variation because it is significantly helpful to understand the formation mechanism of precipitation associated with the characteristics of the water cycle [4,5,6,7,8]. Yang and Slingo [9] revealed that the intensity of continental deep convection generally reaches its peak in the evening, but there are differences in peak time over regions under the influence of sea-land breeze, mountain valley breeze, and the life cycle of the mesoscale convective system. Dai [10] found significant seasonal features of diurnal variation of precipitation in most regions of the globe, particularly over the land. Usually, weak precipitation occurs over land and ocean in the early morning, showers and thunderstorms frequently appear over land late in the afternoon, contrary to oceanic thunderstorms, which happen at midnight. Yu et al. [11] pointed out that the precipitation peak in south China and northeast China appears in the evening, while the precipitation over the region between the Yellow River and the Yangtze River basin has double peaks in the forenoon and evening. Based on the time-division statistics of the observation data in mainland China, Dai et al. [12] found that there was a large regional difference in the percentage of precipitation in daily total, and some regions had periods of precipitation concentration. Due to the complex underlying surface environment, the surface thermal and dynamic parameters of the Qinghai-Tibet Plateau (QTP) are complex and changeable, and the diurnal variation of atmospheric parameters on the plateau is also common. For example, the surface albedo on the QTP has significant diurnal variations, and the ranges of variation in summer and autumn are also large [13]. The surface temperature on the QTP retrieved by satellite infrared signal shows the strongest daily variation range compared with that of typical surfaces of several types in China, which indicates that the radiation budget of the QTP has a great variation [14]. These diurnal changes are not only related to the plateau surface characteristics but are also related to the turbulence exchange mode of thermal power on the surface [15,16].
Although the systematical investigations on the diurnal variation characteristics of cloud and precipitation over the QTP were limited, scholars still made use of the limited ground observation data to conduct studies and found that clouds with convective activity are vigorous over the QTP in summer. The most common type of precipitation over the area is convective precipitation, with significant diurnal variation based on limited ground based radar observations [17,18,19,20,21,22,23]. In order to find out the reasons for the diurnal variation of such precipitation, Jian et al. [24] analyzed the variation of atmospheric heat and water vapor at a large-scale over the QTP, and pointed out that the diurnal variation of both heat source and moisture sinks in the same phase may be one of the reasons for the diurnal variation of precipitation.
With increasing effective observations from satellite-borne precipitation radar, the deficiency of being short of precipitation observations from ground instruments in this region is compensated by satellite data. Scholars have made a detailed analysis of precipitation with these data. Fu et al. [25] studied the multi-year observations of precipitation measured by Precipitation Radar (PR) onboard the Tropical Rainfall Measuring Mission (TRMM) satellite, and pointed out that the climatically averaged vertical structure of summer precipitation over the QTP is like a tower that extends to the middle and upper troposphere in Asia. The maximum echo of precipitation over the QTP usually appears in the middle of the troposphere, at an altitude of about 6 km, which results in a huge heating source in the middle troposphere over the QTP. Compared with the adjacent areas, there are more isolated rain cells over the QTP, and the diurnal variation range of precipitation intensity and frequency is the strongest in the centric part of the QTP. The diurnal peak of precipitation intensity and frequency appear around 16:00 (local time, LT), which can be interpreted as the effect of the strong short-wave heating of the sun and the small thermal capacity of the surface on the plateau.
Subsequent studies by Zheng et al. [26] and Bai et al. [27] confirmed the conclusion above. Liu et al. [28] analyzed the data generated from ground-based precipitation radar and cloud radar, together with observations by other instruments, and confirmed the characteristics of diurnal variation of precipitation obtained previously by TRMM PR over the QTP. They also found that solar shortwave radiation heating promotes the development of convective systems in the afternoon and induces a very deep vertical structure of the systems, and there are synchronously ascending and descending air flows within different parts in these convective systems.
Fu and Liu [29] revealed that the TRMM PR identified a lot of stratiform precipitation in summer over the QTP, which is inconsistent with previous results issued by ground observations in scientific experiments of the QTP. To find the reason for these differences, they collocated the precipitation profile data of PR measurement with atmospheric temperature profile data of radiosonde observation in Lhasa and Naqu, together with geographic information data, and found that the bright band that PR used to identify stratiform precipitation is the strong echo of QTP surface reflection, which results in a large number of weak convective precipitation misjudged as stratiform precipitation. Therefore, Fu et al. [30] developed a new classification of precipitation types over the QTP after analyzing characteristics of its precipitation profile and atmospheric temperature profile. Precipitation systems are divided mainly into two categories: deep convective precipitation (DCP) and shallow precipitation. The criterion for such differentiation is whether the echo top altitude of precipitation is higher than 7.5 km. The criterion was confirmed that, in the case of precipitation over the QTP, the difference between atmospheric temperature and dew point temperature from near-surface to the altitude of 7.5 km is less than or about 2 degrees; that is, the atmosphere below the altitude of 7.5 km is nearly saturated [31].
Based on the criterion, the statistics show that DCP is the dominated precipitation type over the QTP; its ratio is about 73.6%, which contributes to 81.5% of the total rainfall. The study also found that weak DCP is a dominant precipitation type among DCP; a ratio of up to 67.8%. The second most dominant is shallow precipitation, at about 26.4%, while strong DCP only takes up the lowest ratio, about 5.8% [31].
Following previous studies, this study aims to find out more details about the characteristics of precipitation diurnal variation over the QTP and its southern region using precipitation data issued by TRMM PR observations in the summer, from 1998 to 2012. The spatial and temporal distributions of precipitation frequency, precipitation intensity, the maximum echo, its top altitude, and so on, were analyzed, including the diurnal variations over the QTP and its southern regions. Their regional differences were also compared; hereafter the possible reasons for these differences were analyzed.
2. Datasets and Methods
Currently, although GPM (Global Precipitation Measurement) DPR (Dual-frequency Precipitation Radar) provides up-to-date precipitation data, TRMM PR’s precipitation data have been used for longer and are more reliable in statistical calculations. So, for the purpose of this study, one Level 2 product, 2A25, issued by NASA (National Aeronautics and Space Administration) GSFC (Goddard Space Flight Center), based on TRMM PR observations in summer, from 1998 to 2012, was used. The 2A25 product includes profiles of both PR reflectivity factor and rain rate. The latter was retrieved from the echo reflectivity factor through the Z-R relationship, and corrected by observations of ground-based precipitation radar [32]. The 2A25 product also supplies precipitation types: stratiform precipitation, convective precipitation, and others, based on algorithms studied by Awaka et al., Kummerow et al., and Iguchi et al. [32,33,34,35]. According to the technical property of PR, it has about 4.3 km horizontal resolution before TRMM boost and 5.0 km after the boost, and 250 m vertical resolution. Profiles range from sea level to 20 km altitude. The sensitivity of PR is 17 dBZ, which corresponds to about 0.4 mm/h rain rate [36].
Considering the small ratio of strong DCP in precipitation over the QTP, in this study, both weak and strong DCPs were put together to become a single DCP type. To compare with precipitation outside of the QTP, the definition was also used in our study domain, within the ranges of north latitude (20°, 40°) and east longitude (70°, 105°). The concept of echo top altitude is defined as the height of the first 17 dBZ that was observed by PR from 20 km to near surface in each echo profile, which has been adopted by many scholars [7,37,38,39].
Because 2A25 product is orbital level data, in order to facilitate the mapping and display the spatial distribution of parameters, such as rain rate, echo top, and precipitation frequency, and so on, as also shown in previous researches [7,40,41], the long-time orbital data were statistically calculated in a 0.5° × 0.5° grid. Figure 1 shows the distribution of the total samples, rainy samples, and DCP samples in summer over the QTP and its southern regions, based on observations from TRMM PR from 1998 to 2012. The black solid line in each panel presents the altitude contour at 3000 m. Capital letters A, B, C, and D in Figure 1a represent, respectively, the central region, the eastern region, the Yarlung Zangbo River Valley (YZRV) of the QTP, and the region between the foot of the Himalayas and north India where the non-plateau area is.
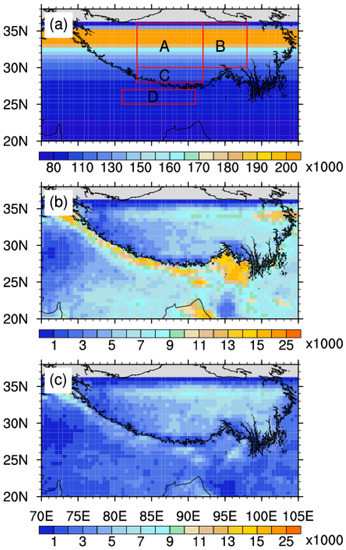
Figure 1.
The distribution of (a) total sample, (b) rainy sample, and (c) deep convective precipitation (DCP) sample in summer over the Qinghai-Tibet Plateau (QTP) and its southern regions based on observations of TRMM PR from 1998 to 2012. These samples were statistical calculated within each 0.5° grid. The black solid line in each panel presents the altitude contour at 3000 m. Capital letters A, B, C, and D represent, respectively, the central QTP, the eastern QTP, the Yarlung Zangbo River Valley (YZRV), and the region adjacent to the southern Himalayas (RASH), where the non-plateau area is.
Figure 1 shows that the total sample distribution of PR measurements is non-uniform from south to north. The higher the latitude, the more PR samples in the grids, such as the total number in the north of 32° N is up to 200,000, and in the south of 30° N it falls to 120,000; this PR sample difference between high latitudes and low latitudes is caused by the TRMM operation mode of low-inclination satellites. The spatial distribution of precipitation samples shown in Figure 1b displays the abundant precipitation samples in the eastern part of the QTP, at the foot of the Himalayas, and in the area of trumpet-shaped terrain in the southeast of the QTP, which is consistent with previous results [31,39,41].
Following the previous definition in the literature [40], the summer precipitation frequency is namely the ratio of rainy samples to the total samples in each grid, while the summer precipitation intensity is defined as the averaged rain rates in each grid. Similarly, in each grid, the precipitation frequency of DCP is the ratio of DCP samples to the total samples, and the precipitation intensity of DCP is the mean of DCP rain rate. The parameters of the largest precipitation echo intensity and its corresponding altitude are named as the maximum reflectivity and its height at each reflectivity profile measured by PR. The mean maximum echo intensity in each grid is the average value of the corresponding maximum echo intensity of samples in the grid. The mean altitude of the maximum echo in each grid can be obtained by similar calculations.
Furthermore, this study also analyses the difference between the echo top altitude and the altitude of the maximum echo, which indirectly reflects the intensity of the convective cloud system. In a strong convective cloud system, because of prevailing intensive vertical movement inside it, large particles should be carried to the upper levels, so the altitude of the maximum echo top is higher, which results in the reduction of the height difference. Generally, the smaller the altitude difference, the stronger the convective cloud system should be.
In order to show the diurnal variations of precipitation parameters, a day was divided into six-time periods, as in previous studies [42]. Usually, 12 o’clock local time is when the sun is at its zenith. Subsequently, the six-time periods are defined as early morning (02–06 LT), forenoon (06–10 LT), noon (10–14 LT), afternoon (14–18 LT), evening (18–22 LT), and midnight (22–02 LT). Additionally, ECMWF (European Centre for Medium-Range Weather Forecasts) reanalysis data, ERA5, which can be downloaded from https://cds.climate.copernicus.eu/cdsapp#!/dataset/reanalysis-era5-pressure-levels-monthly-means?tab=form (accessed on 30 September 2020), was used in our study. In order to show the diurnal variation of reanalysis data, temporal and spatial transformation methods were used to extract the local temporal characteristics of atmospheric parameters in ERA5.
3. Results
3.1. Horizontal Distribution of Summer DCP over the QTP
Firstly, the average characteristics of summer DCP over the QTP using data from TRMM PR from 1998 to 2012 are analyzed. Figure 2 shows the frequency distributions of precipitation and DCP over the QTP and its southern regions. The corresponding surface wind field, calculated by using reanalysis data, is superimposed over the figure. Figure 2 illustrates that the surface wind field in the summer over the QTP is a weak convergence area, with a widely distributed convergence center over the centric and eastern part of the QTP. There is also a convergence center located in a narrow region and extending to the south around the foot of the Himalayas. The air inflow comes from the Arabian Sea and the Bay of Bengal. Another convergence of the wind field is located at the area of trumpet-shaped terrain over the southeastern part of the QTP, whose inflow mainly comes from the Bay of Bengal. According to atmospheric dynamics theory, the convergence of the wind field at the low layer of the atmosphere (direction or speed convergence) leads to the concentration of water vapor, which is favorable for precipitation generation [43].
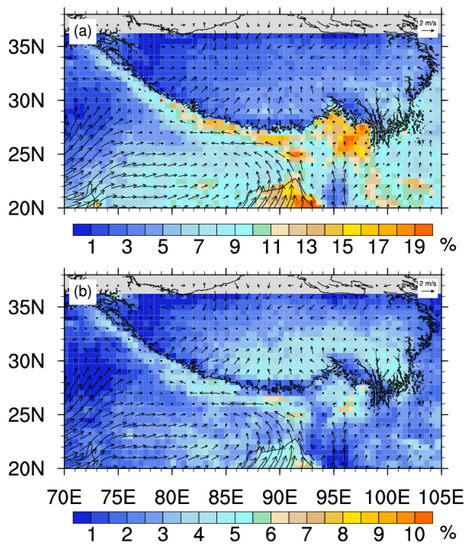
Figure 2.
The distribution of (a) precipitation frequency and (b) DCP frequency in summer over the QTP and its southern regions based on observations of TRMM PR from 1998 to 2012. The surface winds were drawn in each panel calculated by using ERA5 monthly reanalysis data.
Comparing with the distribution of surface wind presented in Figure 2, it shows that regions with high precipitation frequency correspond well with the convergence of surface wind field, such as from north India to the Himalayan foot, where the frequency is up to 12%. Especially at the northern Bay of Bengal and the trumpet-shaped terrain area in the southeast of the QTP, the maximum frequency reaches up to 20%. These results are basically consistent with previous research [30]. Fu et al. [41] found that the highest precipitation frequency occurs at the mountainside of the Himalayas, whose frequency is up to 8%, which is consistent with this study. However, over the plateau, precipitation frequency is less than 9% and in most regions it less than 5%; the distribution also shows an obvious east-west difference. The precipitation frequency is about 5% in the middle of the plateau and ~8% in the eastern part of the QTP.
Generally, the frequency distribution of DCP is similar to that of precipitation. Figure 2b shows that the area with a high frequency of DCP is usually associated with a high precipitation frequency. The frequency of DCP up to 5% is located in the central and southeastern QTP, including south of 30° N and the YZRV. However, the area with high DCP frequency over the QTP is larger than that over the non-plateau shown in Figure 2b, which indicates that the summer DCP is the main kind of precipitation over the QTP. This may be one of the main characteristics of precipitation over the QTP that differentiates precipitation in other regions. Furthermore, areas with a high frequency of DCP are usually discordant with the convergence of surface wind field over the QTP, which indicates that the thermodynamic processes of underlying surface play an important role in generating summer DCP over the QTP. Outside the plateau, such as the Himalayan foot and the trumpet-shaped terrain area in the southeast of the QTP, the frequency of DCP ranges from 4–7%, but is usually less than 5% in most areas. These DCPs over non-plateau regions are related to the convergence of surface wind.
The distribution of average intensity of precipitation and DCP over the QTP and its southern region in summer are shown in Figure 3 (overlapped with the reanalysis data of 500-hPa and 200-hPa geopotential height fields). At the isopiestic level of 500 hPa, there is an area with low pressure from the north-central region of the QTP to the Taklamakan Desert. It is obviously related to the surface heating atmosphere caused by the underlying surface condition (sandstone surface). In South Asia, from northern India to the Bay of Bengal, there is also an area of low pressure, known as the monsoon low pressure. There is a ridge of high pressure from the northwest Indochina Peninsula to the trumpet-shaped area in the southeast QTP. The eastern part of the QTP is controlled by the west-northeast sub-high pressure ridge. At the isopiestic level of 200 hPa, a vast area centered in the central Himalayas is controlled by the South Asia high that is not located over the main body of the QTP. Therefore, the divergence center of 200 hPa is not over the main body of the QTP. The above information is critically important for understanding the difference between precipitation over the QTP and precipitation in the southern region of the QTP.
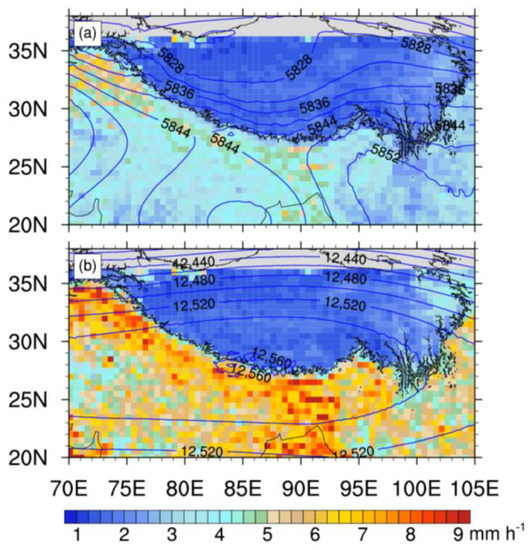
Figure 3.
The distribution of mean rain rate of (a) total precipitation and (b) DCP in summer over the QTP and its southern regions based on observations of TRMM PR from 1998 to 2012. The blue lines were drawn for the mean geopotential height at (a) 500 hPa and (b) 200 hPa, calculated by using ERA5 monthly reanalysis data.
Under the control of the South Asia high, ascending motion usually predominates in the troposphere over the QTP and its southern region. Consequently, excluded to QTP, Figure 3a indicates that heavy rainfall is mainly located in summer in South Asia, and the average precipitation intensity is above 3.5 mm/h. The maximum average precipitation intensity occurs in the foot area close to the Himalayas and the trumpet-shaped terrain area in Kashmir, where the average precipitation intensity is above 4 mm/h and the maximum is over 7 mm/h. These are mainly due to the strong convergence of air flows in these areas [41]. In contrast, the average precipitation intensity on the QTP is less than 3 mm/h. The average precipitation intensity in the eastern QTP is slightly higher than that in the central and western QTP, which can be greater than 3 mm/h. This is due to the lack of water vapor on the plateau. Fu et al. [41] pointed out that, when the warm and wet monsoon airflow climbed over the Himalayas, most of the moisture converted into precipitation at the foot of the mountains, and the residual moisture continued to be lost over the mountainside. Therefore, the airflow became relatively dry when it reached the QTP, so the precipitation intensity on the QTP was low.
Figure 3b shows that the distribution of the average intensity for DCP is similar to that of the average intensity of the precipitation. A large area of DCP, with intensity ranging from 7 mm/h to 10 mm/h, is mainly located in South Asia outside of the QTP, from the trumpet-shaped area in Kashmir, along the Himalayan foothills, to the trumpet-shaped area in the southeast of the QTP. Over the QTP, the average intensity of DCP is less than 5 mm/h, and is less than 3 mm/h in most areas. The information generated from both Figure 2 and Figure 3 imply that DCP over the QTP has a high frequency, but its average intensity is low. Meanwhile, in the non-plateau South Asia, including the foot of the Himalayas, the DCP frequency is less than that of the plateau, but the average intensity is one or two times more than that of the plateau.
According to the working principle of meteorological radar, the relationship between radar echo intensity and precipitation rate is established under the assumption of particle size and distribution [44,45]. Therefore, the relationship between precipitation rate and radar echo intensity varies with the change in precipitation cloud particle size and particle spectrum, and is also closely related to the phase state and shape of the particles [46]. The maximum echo in the precipitation profiles cloud usually indicates large precipitation particle size or high particle concentrations. The altitude of maximum echo also represents the height of such particles in the precipitation cloud. Obviously, this height also reflects the dynamic structure in the precipitation cloud to some extent. For example, if the rising flow is strong, the large particles are carried to a high position in the cloud body, and the height of maximum echo is high. On the contrary, if the ascending motion in the cloud body is weak, the height of large particles will be low, and the height of the maximum echo will be low. In this sense, the maximum echo and its corresponding height can be used to study the states of convective activity in the precipitation system. So, the maximum echo and corresponding altitude of summer DCP over the QTP and its southern region were analyzed, as shown in Figure 4.
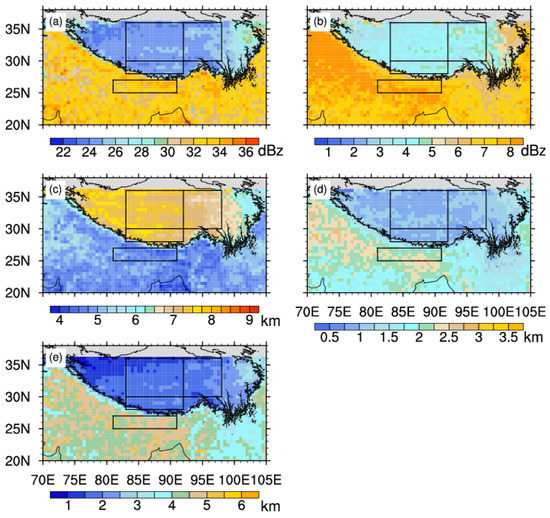
Figure 4.
The distribution of (a) mean maximum echo and its (b) standard deviation, (c) mean altitude of the maximum echo and its (d) standard deviation, and (e) the height difference between the altitude of the echo top and the altitude of the maximum echo for DCP in summer over the QTP and its southern regions calculated from observations of TRMM PR from 1998 to 2012. The black boxes marked in each panel are seen in Figure 1.
Figure 4a shows that the distribution of the maximum echo of DCP ranges from 24 dBZ to 26 dBZ over the QTP, while that of 33 dBZ to 35 dBZ, distributed from the northern India to the south of the Himalayas, is consistent with the distribution pattern of DCP intensity in Figure 3b. Over the QTP, the mean value of the maximum echo in the east is obviously higher than that in the central and western regions. At the foot of the Himalayas, including the eastern and western part of the area of trumpet-shaped terrain, the mean value of maximum echo intensity here is also larger than that of other areas, which illustrates that the deep convective activity in the regions from South Asia to the foot of the Himalayas is stronger than in the QTP. The standard deviation distribution of maximum echo shown in Figure 4b is also clearly different over the QTP and non-plateau area. It is uniformly distributed over the QTP, and the most standard deviation over the QTP is about 4 dBZ, only slightly larger in the easternmost part of the plateau, about 6 dBZ, while in the vast area from the foot of the Himalayas to the north of India, the standard deviation of the maximum echo is over 6 dBZ, and its maximum standard deviation is up to 8 dBZ, which can be understood as the variation range of the maximum echo of the DCP systems over the plateau being smaller than that over South Asia, and the local differences of the maximum echo of these DCP systems in their respective regions are small.
The mean and standard deviation distribution of the altitude of the maximum echo of DCP is shown in Figure 4c,d. It indicates that the mean altitude of the maximum echo over the QTP is significantly higher than that in the Himalayan foot and the region of north India, which may be caused by the high altitude of the QTP and sandy vegetation over most of the QTP’s surface [47]. The average altitude of maximum echo of DCP over the QTP gradually decreases from about 7.5 km in the west of the plateau to 6 km in the east of the plateau. This change is consistent with the feature that the altitude of summer precipitation echo top over the QTP decreases from west to east, as pointed out by Fu et al. [39]. Considering that the average topographic altitude difference over the easternmost, central, and western parts of the QTP is about 1 km, it can be inferred that the height of maximum echo of DCP over the QTP from west to east is basically the same as the height of the ground, which is nearly 2 km from the ground. In the south of the Himalayan foot, the mean altitude of maximum echo of DCP is mostly distributed between 4.5–5 km, and the mean altitude to the west of 80° E is slightly higher. The surface altitude of this region is less than 1 km, so the height of maximum echo of DCP in this region is above 3.5 km from the surface. Therefore, it can be concluded that the altitude of the maximum echo of DCP over the QTP is relatively close to the surface. The reason for this may be that the air column over the QTP is compressed by the topography while the tropopause height of the QTP is not increased due to topographic uplift [48]. The standard deviation distribution of the altitude of the DCP maximum echo (Figure 4d) shows that the standard deviation in the plateau region is smaller than that in the region south of the Himalayan foot, indicating that the air rising movement and undulation inside DCP cloud over the QTP is less than that over the region south of the Himalayan foot. Usually, the standard deviation over the plateau region is less than 2 km, in which it is less than 2 km over the eastern part of the plateau, and less than 1.5 km over the central and western parts of the plateau, which indicates significant variations of air rising motion inside DCP cloud over the plateau.
The height of the precipitation echo top also reflects the strength of the upward movement of the airflow in the cloud. When the upward movement is strong, the particles will be carried to a higher altitude by the airflow, so the height of the precipitation echo top is high, similar to the height of the maximum echo, as mentioned above. For this reason, Figure 4e shows the distribution of the mean altitude difference between the echo top and the maximum echo. It shows that the mean altitude difference of DCP over the QTP is smaller than that in the region locating in the south of the foot of the Himalayas, the mean altitude difference between the central and western plateau is less than 2.5 km, and that between the eastern and central plateau is less than 3 km, while that in the south of the foot of the Himalayas is mostly 4–5 km. This indicates that the effect of the large topography of the QTP causes the small height difference between echo top and maximum echo, but there is a relatively greater difference in non-plateau areas. The above results indicate that the topography of the QTP makes the DCP systems thin in the vertical direction, which needs to be simulated by the numerical model to find mechanisms in details.
3.2. The Diurnal Variation of DCP
Because a large area over the QTP is covered with limited ground observation stations, it is the most effective method to observe the diurnal variation characteristics of cloud and precipitation with measurements of satellite instruments. The previous analysis of cloud-top brightness body temperature (TBB) and atmospheric top outgoing long-wave radiation (OLR) shows that the convective cloud system over the QTP in summer is weakest from 00:00 to 05:00 LT and strongest from 15:00 to 17:10 LT [18]. By analyzing the observations of PR and VIRS (Visible Infrared Sensor), Pan and Fu [31] directly obtained the peak occurrence time of convective precipitation frequency and intensity over the main region of the QTP. Here, the more detailed diurnal variations of precipitation parameters in summer over the QTP were systematically analyzed.
Based on the calculations from the orbital data observed by PR from 1998 to 2012, Figure 5 shows that most DCP occurs in the afternoon over the QTP; only in the central region A is there a large area with a DCP frequency peak at noon; in the eastern plateau (including region B) and valley region (region C), most DCP also occurs in the afternoon and some in the evening. The frequency peak of DCP closely along the Himalayan foot is in the middle of the night. In the south region of the foot, there is an obvious and wide band of DCP that occurs in the early morning, and in the south of the band, the frequency peak mainly appears in the afternoon or evening.
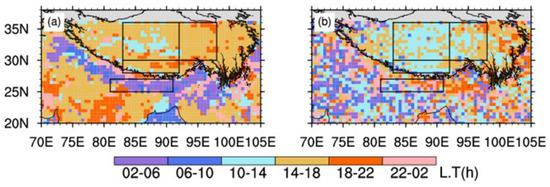
Figure 5.
The distribution of time peak for (a) frequency and (b) rain rate of DCP in summer over the QTP and its southern regions calculated from observations of TRMM PR from 1998 to 2012. The black boxes marked in each panel are seen in Figure 1. Note: (1) the measurement time of PR was converted to local time (LT). (2) A day was divided into six periods: early morning (02:00–06:00 L.T), forenoon (06:00–10:00 L.T), noon (10:00–14:00 L.T), afternoon (14:00–18:00 L.T), evening (18:00–22:00 L.T), and midnight (22:00–02:00 L.T).
Compared with the distribution of DCP frequency peaks, the distribution of the DCP intensity peak over the QTP is relatively clear against disordered distribution in the region south of the foot of the Himalayas. In the western QTP, the DCP intensity peak in most area appears from noon to afternoon (frequency peak appears in the afternoon). In the central plateau region (region A), including region YZRV, the DCP intensity peak appears in the midday (frequency peak appears at noon or afternoon). From the eastern plateau region (region B) to its eastward region, the DCP intensity peaks from noon gradually into the evening (frequency peak in the afternoon). This shows that the time when DCP is most likely to occur over the central to eastern QTP shifts from noon to afternoon, indicating the characteristic of eastward dissemination of intensity, which is consistent with the results of Pan and Fu [31].
Generally, in the foot region of the Himalayas, the intensity peak of DCP mostly occurs in the evening or at midnight. In the western part of the foot region (west of 85° E), the intensity peak shows from the early morning to forenoon, while in the eastern part (east of 85° E), the peak intensity shows in the afternoon to evening. In the region of north India, the peak intensity appears from the forenoon to noon. Figure 5 exhibits the relative uniform distributions of the DCP frequency and intensity over the QTP, which illustrates the effect of the QTP altitude and topographic surface on the homogeneous distribution of precipitation over there. The time lag of the intensity peak of DCP from the central plateau to the eastern plateau may reflect the effect of large topographic uplift and westerly belt on precipitation. The mechanism of these phenomena remains to be revealed by theoretical research and numerical model research.
The more detailed characteristics of the diurnal variations of DCP are shown in Figure 6, which displays the time peak distribution of the maximum echo, its corresponding altitude, and the height difference between storm top and the height of the maximum echo for DCP in summer over the QTP and its southern regions. It indicates some similar time peak distributions between the maximum echo (Figure 6a) and the rain rate (Figure 5b), which is not hard to understand because the precipitation intensity is proportional to the maximum echo. Figure 6b shows that the maximum echo of DCP is about 45~50 dBZ in the central part of the QTP (region A and region YZRV) and the western part, while that in the eastern part, including region B, is about 50~55 dBZ, which is consistent with the high intensity of precipitation in the eastern part of the QTP. Due to strong air flows uplifted by the forcing effect of mountain topography in the region south of the Himalayas, especially near the foot of the Himalayas, the maximum echo of DCP is distributed between 50 and 60 dBZ. Fu et al. [41] (2018) pointed out that the precipitation intensity in the region near the Himalayan foot is higher than that in the steep mountainside region of the Himalayas and the northern plain region of India. The spatial distribution of the altitude of DCP maximum echo is shown in Figure 6c, which indicates that it is mostly 7~8 km in the western and central part (region A and region YZRV) of the QTP, while in the eastern part (region B and its east) it gradually decreases from 7 km to nearly 5 km. The altitude of DCP maximum echo along the foot of the Himalayas is 2~3 km, and the height variation in the south of the foot ranges from 3~5 km.
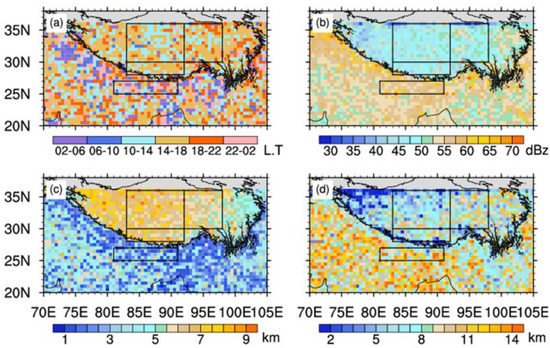
Figure 6.
The spatial distribution of time peak of (a) the maximum echo, (b) the maximum echo and (c) its altitude, and (d) the height difference between the altitude of echo top and the altitude of the maximum echo for DCP in summer over the QTP and its southern regions calculated from observations of TRMM PR from 1998 to 2012. The black boxes marked in each panel are seen in Figure 1.
The spatial distribution of the height difference between the echo top altitude and the altitude of DCP maximum echo shows that such difference is less than 8 km in the western and central parts of the QTP, and it changes between 8 and 11 km in the eastern part (Figure 6d). The height difference outside the plateau is more than 10 km, and it can even be up to 14 km. For example, in the region south of the Himalayan foot, the height difference can reach 14 km, while in the mountainside region of the Himalayan it is less than 8 km. In short, although there exists random spatial distribution differences for the time peak of the maximum echo of DCP in Figure 6a, there are obvious spatial differences in the QTP and outside the QTP for the maximum echo (Figure 6b) and its corresponding altitude (Figure 6c) and the height difference between the echo top altitude and maximum echo altitude of the DCP (Figure 6d), which again illustrates the unique role of the QTP.
Based on diurnal peak variations of the parameters shown in anterior figures, Figure 7 shows the diurnal circular curves of precipitation frequency, precipitation intensity, the maximum echo and its altitude, echo top altitude, and the height difference between the echo top and the maximum echo of DCP in the typical representative of region A, region B, and region C of the QTP, and region D in the south of the Himalayan foot, which was calculated with pixel data observed by TRMM PR. In general, the precipitation frequency (Figure 7a), intensity (Figure 7b), maximum echo (Figure 7c), and echo top altitude (Figure 7e) in the three typical representative regions on the QTP all have obvious daily variation; they all start growing after sunrise, get to the peaks in the afternoon, and then fall to the minimum in the early morning. The echo top altitude of precipitation has the strongest diurnal variation from its amplitude, which indicates that deep convective precipitation has a strong response in the vertical direction over the plateau due to the thermal forcing of the underlying surface. Although the maximum echo of precipitation in the three representative regions over the QTP has strong diurnal variations (the average maximum is close to 30 dBZ, as shown in Figure 7c), its corresponding altitude is not significantly diurnal. That is to say, the maximum echo over the QTP keeps to a certain altitude; the mean altitude of the maximum echo is about 6.5~7.5 km (Figure 7d).
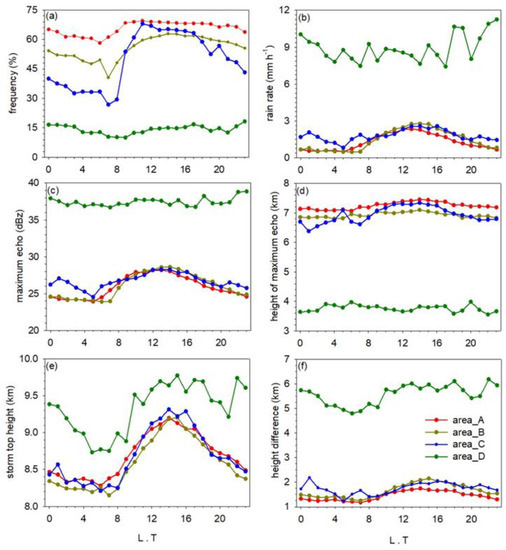
Figure 7.
Diurnal variation curves of (a) precipitation frequency, (b) rain rate, (c) the maximum echo, (d) the altitude of maximum echo, (e) the storm top altitude, and (f) the height difference between the storm top and the altitude of the maximum echo for DCP in region A–D marked in Figure 1. The calculations were based on pixel data measured by TRMM PR in summer from 1998 to 2012.
Additionally, except for the diurnal variation of the altitude of the precipitation echo top, other precipitation parameters almost have no obvious diurnal variations in region D. In this region, the echo top of the precipitation is also highest in the afternoon and the lowest in the early morning, which is in accordance with the characteristics of summer convective precipitation in south Asia, where the atmosphere is the most unstable in the afternoon. Generally, Figure 7 tells us that DCP in summer over the QTP is characterized by significant diurnal variation compared with that in the region of the southern Indian mainland. Many previous studies have analyzed the phenomena using ground-based station observations, but for the whole QTP, our studies by analyzing precipitation data issued from the measurements of precipitation radar on board satellites are more representative.
Although Figure 2 implied the spatial distribution of the intensity and frequency of DCP over many years in summer, and Figure 5 also reveals the time peak of both parameters, it is still necessary to show the spatial distribution of both parameters in more detail. Therefore, the spatial distribution of DCP frequency are calculated for six different time intervals of a day. Figure 8 shows the spatial distribution of DCP frequency overlapped with geopotential altitude at 500 hPa (synchronized by local time). It indicates that the spatial distribution of DCP frequency varies from the central plateau, including YZRV, to the east of the plateau, especially the southeast. The DCP frequency in these regions ranges from 4–7% (Figure 8c). In the afternoon, the frequency (up to more than 10%) reaches the peak in these regions, and the spatial distribution is wide, especially the high frequency occurring in the regions of YZRV and southeast of the plateau (Figure 8d). Obviously, there are no details shown in Figure 2a similar to those in Figure 8d. The DCP frequency begins to decrease from nightfall in most regions of the QTP (Figure 8e) and almost disappear in the early morning (Figure 8a). On the other hand, DCP along the foot of the Himalayas is mainly characterized by night rain; that is, the high DCP frequency occurs from midnight (Figure 8f) to early morning (Figure 8a), while DCP in the northeast of India mainly occurs from afternoon (Figure 8d) to evening (Figure 8e). Moreover, there exists a diurnal variation of the 500-hPa potential height, corresponding to the DCP diurnal variation. Figure 8 shows that the ridge of high potential height in the east of 90° E over the QTP extends northwestward from the Bell Mouth area, while the trough in the west of 90° E extends southeastward and the sun rising until noon. From evening to night, the low pressure stays in the west of 90° E over the QTP, and the ridge retreats to the south in the east of 90° E. The diurnal characteristics of the DCP frequency over the QTP are estimated to be closely related to the diurnal variation of the thermal state of the underlying surface of the QTP.
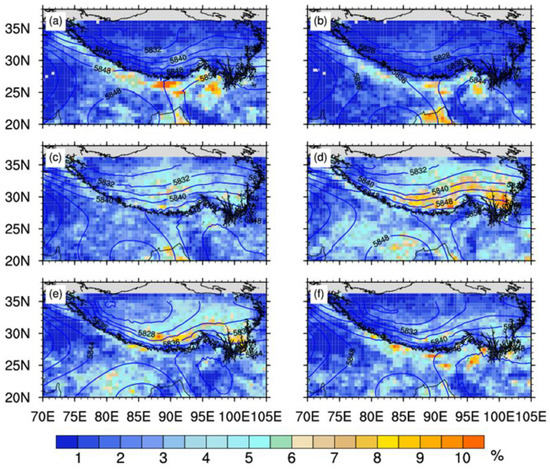
Figure 8.
The distribution of precipitation frequency for DCP in (a) early morning, (b) forenoon, (c) noon, (d) afternoon, (e) evening, and (f) midnight in summer over the QTP and its southern regions calculated from observations of TRMM PR from 1998 to 2012. The overlapped contours are geopotential height at 500 hPa in each time period. Note: This is the same as in Figure 6.
Under the condition of the sandstone surface in most QTP regions, especially in the central and western QTP, the atmospheric instability is the greatest from afternoon to evening [49]. In the region along the foot of the Himalayas, the high DCP frequency is possibly related to a grain wind effect associated with slope cooling at night. Such an effect is a trigger for the DCP activity in front of the foot. Details will be elaborated in the follow-up study.
The spatial distribution of mean intensity of DCP are also calculated in six different time intervals, as shown in Figure 9, which indicates that the mean intensity of DCP is lower over the QTP than in the non-plateau region at any period. In the plateau, DCP has a large rain rate (greater than 2.5 mm/h) from noon to afternoon, with a wide distribution area. However, the eastern part of the plateau (east of 100° E) still has a greater intensity (greater than 2.5 mm/h) from evening to midnight. In the region south of the Himalayan foot, the distribution of the mean rain rate in each period of a day remains almost the same, varying between 3~12 mm/h. Basically, heavy precipitation in the noon period has a large distribution area, and most of them occur in the region south of the Himalayan foot in each period. In addition, as can be seen from Figure 8 and Figure 9, the distribution of frequency and intensity of DCP in the same region shows different phases. For example, at noon in northern India, the frequency is low (Figure 8c), but the mean rain rate in this region is high (Figure 9c). For another example, in the afternoon, northeast India has the highest frequency, up to 5~7% (Figure 8d), but the mean rain rate in this region is not the strongest, about 3.5~6.5 mm/h (Figure 9d). All these reflect the regional climate characteristics of precipitation.
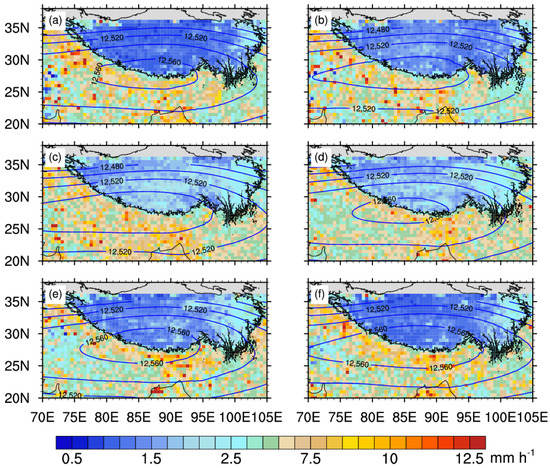
Figure 9.
The distribution of mean rain rate for DCP in (a) early morning, (b) forenoon, (c) noon, (d) afternoon, (e) evening, and (f) midnight in summer over the QTP and its southern regions calculated from observations of TRMM PR from 1998 to 2012. The overlapped contours are geopotential height at 200 hPa in each time period. Note: This is the same as in Figure 6.
Similar to the diurnal variation of the 500-hPa geopotential height shown in Figure 8, Figure 9 displays the 200-hPa geopotential height field. There are obvious diurnal variations. Although the central region of South Asia high in the 200-hPa geopotential height field is stably located over the south slope of the Himalayas (not over the main body of the QTP), the central area, surrounded by a contour of 12,540 geopotential meters, shows clear diurnal variation, i.e., the area is expanding from forenoon to midnight, and contracts in the early morning. The reason for this, apart from the thermal forcing produced by the underlying surface, is the dynamic forcing generated by the southern slope of the Himalayas, which is responsible for the diurnal variation of the South Asia high, which may be used to explain the phenomenon that the center of the South Asia high is not located in the main body of the QTP.
Based on Figure 6a, which shows the spatial distribution of the time peak for the maximum echo of DCP, Figure 10 and Figure 11 display the distribution of the maximum echo and its altitude in the six time periods of the day. Figure 10 indicates that, in the QTP west of 100° E, the average maximum echo of DCP is the weakest in the early morning, begins to strengthen in the forenoon (about 25 dBZ), reaches the peak at noon (above 27 dBZ), then begins to weaken at midnight. This change is consistent with the rain rate of DCP over the QTP shown in Figure 9. In the QTP east of 100° E, there exists an area with a maximum echo greater than 30 dBZ from afternoon to midnight, which is also consistent with the large rain rate in the corresponding area in Figure 9. In the region south of the Himalayan foot, the mean of maximum echo shows that it is relatively small from afternoon to evening (about 33 dBZ), while in the other four time periods it is relatively large (larger than 35 dBZ). The latter is not shown in the mean rain rate of each time period in Figure 9, but the former shows in Figure 8 that the DCP frequency in this region is relatively large in these two time periods.
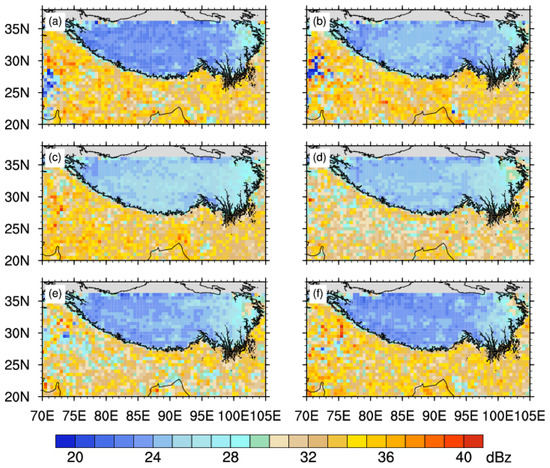
Figure 10.
The distribution of the maximum echo for DCP in (a) early morning, (b) forenoon, (c) noon, (d) afternoon, (e) evening, and (f) midnight in summer over the QTP and its southern regions calculated from observations of TRMM PR from 1998 to 2012. Note: This is the same as in Figure 6.
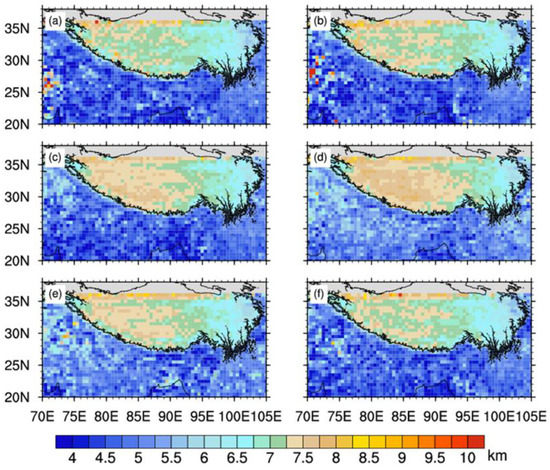
Figure 11.
The distribution of the altitude of maximum echo for DCP in (a) early morning, (b) forenoon, (c) noon, (d) afternoon, (e) evening, and (f) midnight in summer over the QTP and its southern regions calculated from observations of TRMM PR from 1998 to 2012. Note: This is the same as in Figure 6.
Figure 11 shows that the altitude distribution of the maximum echo for DCP increases in the QTP west of 95° E from forenoon to afternoon (Figure 11b–d), in which the altitude rises to about 7.5 km from the western plateau to the central. In the afternoon, the altitude of the maximum echo reaches the highest altitude (about 8 km, Figure 11d), in the evening it begins to reduce (Figure 11e), at midnight it reaches the minimum (Figure 11f). In the QTP east of 95° E, the altitude of the maximum echo also reaches its highest altitude (~6.5 km) in the afternoon and gets to the minimum at midnight. In general, the altitude of the maximum echo of DCP over the QTP in each time period shows the characteristic of "higher in the west part and lower in the east part of the plateau", which is consistent with results pointed out by Fu et al. [39].
In the region south of the Himalayan foot, Figure 11d,e shows that the altitude of the maximum echo of DCP is higher from afternoon to evening than that of other time periods. From afternoon to evening, most of the altitude here is 5.5~6.5 km, which corresponds to the weak maximum echo in these areas from afternoon to evening, as shown in Figure 10d,e. The altitude of maximum echo in other time periods is 4~5.5 km, which corresponds to relative strong maximum echo in these areas shown in Figure 10a–c,f. This conforms to the basic principle of radar meteorology; that is, strong (weak) precipitation echo corresponds to large (small) precipitation particles; large (small) precipitation particles are heavy (light), so they appear at different altitudes in the same vertical airflow in the cloud. Therefore, the above results to some extent reflect the microphysics and dynamics characteristics of DCP clouds in the QTP and its south. Detailed studies about this are on the way.
4. Conclusions
Deep convective precipitation (DCP) is the main type of precipitation in summer over the QTP. Based on TRMM PR observations over 15 years, the diurnal variation characteristics of DCP are analyzed in terms of the frequency, intensity, and maximum echo and its altitude, as well as the altitude of echo top, in order to improve the cognition of precipitation natures over the QTP. The results of the study indicate that DCP over the QTP has a high frequency (up to 5%), but its average intensity is small (less than 3 mm/h in most areas) over the QTP. In the non-plateau of South Asia, including the Himalayan foot, the DCP frequency is less than that of the plateau, but the average intensity (varying from 7 mm/h to 10 mm/h) is one or two times than that over the plateau. It is an important fact that the regions with a high frequency of DCP are usually disaccorded with the convergence of surface wind field over the QTP, and in consideration of relatively dry air over the QTP compared with air over the non-plateau, which may be a revelation that thermodynamic processes of underlying surface play an important role in generating summer DCP over the QTP.
Studies show that the maximum echo of DCP ranges from 24 dBZ to 26 dBZ over the QTP, while that of 33 dBZ to 35 dBZ is distributed from northern India to the south of the Himalayas. Over the QTP, the mean maximum echo in the east is obviously higher than that in the central and western plateau, and the average altitude of maximum echo gradually decreases from about 7.5 km in the western plateau to 6 km in the eastern plateau. In the Himalayan foot region, including the eastern and western part of the trumpet-shaped terrain, the mean value of maximum echo intensity is larger than that in other regions, which can be explained by the large terrain block effect of the Himalayas. The effect of the large topography of the QTP also leads to the close distance between the altitude of echo top and the altitude of the maximum echo, which means the DCP system is thin in the vertical direction over the QTP. The echo top altitude of DCP has the strongest diurnal variation from its amplitude, which indicates that DCP has a strong response in the vertical direction over the plateau due to the thermal forcing of the underlying surface.
DCP is most likely to occur over the central to eastern QTP from noon to afternoon, while DCP closely along the Himalayan foot is more likely to occur at midnight. Results show that the distributions of time peak for frequency and rain rate of DCP over the QTP are relatively uniform, which illustrates the effect of the QTP altitude and surface influence on the homogeneous distribution of precipitation over there. The time lag of the intensity peak of DCP from the central plateau to the eastern plateau may reflect the effect of large topographic uplift and the westerly belt on precipitation.
Finally, the spatial distribution of frequency, intensity, and the maximum echo of DCP in different time intervals of a day indicate that they all have strong diurnal variations over the QTP against almost no diurnal variation outside the QTP. DCP frequency varies from the central plateau, including YZRV, to the east of the plateau, especially the southeast ranges from 4–7% before afternoon, and reaches up to more than 10% in the afternoon. The DCP intensity also gets a large rain rate (greater than 2.5 mm/h) from noon to afternoon. Specially, there exists a diurnal variation of the 500-hPa potential height, corresponding to the DCP diurnal variation over the QTP; for example, the trough in the west of 90° E extends southeastward with the sun rising to noon. Similarly, geopotential height of 200 hPa also shows obvious diurnal variation over South Asia, and the central region of the South Asia high in the 200-hPa geopotential height field is stably located over the south slope of the Himalayas. The above may be closely related to the thermal forcing produced by the underlying surface, and the dynamic forcing generated by the southern slope of the Himalayas.
Author Contributions
This research work was mainly conducted by J.L. at the University of Science and Technology of China. He also compiled the manuscript. J.Z., L.Z. and C.Z. contributed with results analysis. Y.F. was the designer of this study, revised the manuscript, and responded to reviewers. All authors have read and agreed to the published version of the manuscript.
Funding
This research was funded by the National Natural Science Foundation of China (NSFC Grant 91837310) and the Second Tibetan Plateau Scientific Expedition and Research (STEP) program (grant no. 2019QZKK0104).
Institutional Review Board Statement
Not applicable.
Informed Consent Statement
Not applicable.
Data Availability Statement
Data set available on request to corresponding authors.
Acknowledgments
The authors would like to thank the Goddard Space Flight Center for providing PR 2A25 and VIRS 1B01 datasets, and the European Centre for Medium Range Weather Forecasts for issuing the ERA5 datasets.
Conflicts of Interest
The authors declare no conflict of interest.
References
- Haurwitz, B.; Cowley, A.D. Diurnal and semidiurnal barometric oscillations, global distribution and annual variation. Pure Appl. Geophys. 1973, 102, 193–222. [Google Scholar] [CrossRef]
- Bonner, W.D.; Paegle, J. Diurnal variations in boundary layer winds over south-central united-states in summer. Mon. Weather Rev. 1970, 98, 735. [Google Scholar] [CrossRef]
- Short, D.A.; Wallace, J.M. Satellite-inferred morning-to-evening cloudiness changes. Mon. Weather Rev. 1980, 108, 1160–1169. [Google Scholar] [CrossRef][Green Version]
- Randall, D.A.; Ardhan, H. Diurnal variability of the hydrologic-cycle in a general-circulation model. J. Atmos. Sci. 1991, 48, 40–62. [Google Scholar] [CrossRef]
- Xu, X.D.; Tao, S.Y.; Wang, J.Z. The relationship between water vapor transport features of Tibetan Plateau-Monsoon “Large triangle” affecting region and drought-flood abnormality of China. Acta Meteorol. Sin. 2002, 60, 257–266. (In Chinese) [Google Scholar]
- Yang, S.; Smith, E.A. Mechanisms for diurnal variability of global tropical rainfall observed from TRMM. J. Clim. 2006, 19, 5190–5226. [Google Scholar] [CrossRef]
- Liu, P.; Li, C.Y.; Wang, Y.; Fu, Y.F. Climatic characteristics of convective and stratiform precipitation over the Tropical and Subtropical areas as derived from TRMM PR. Sci. China Earth Sci. 2013, 56, 375–385. [Google Scholar] [CrossRef]
- Xu, X.D.; Zhao, T.L.; Lu, C.G.; Shi, X.H. Characteristics of the water cycle in the atmosphere over the Tibetan Plateau. Acta Meteorol. Sin. 2014, 72, 1079–1095. (In Chinese) [Google Scholar]
- Yang, G.Y.; Slingo, J. The diurnal cycle in the Tropics. Mon. Weather Rev. 2000, 129, 784–801. [Google Scholar] [CrossRef]
- Dai, A. Global precipitation and thunderstorm frequencies. Part II: Diurnal variations. J. Clim. 2001, 14, 1112–1128. [Google Scholar] [CrossRef]
- Yu, R.C.; Zhou, T.J.; Xiong, A.Y.; Zhu, Y.J. Diurnal variations of summer precipitation over contiguous China. Geophy. Res. Lett. 2007, 34, L01704. [Google Scholar] [CrossRef]
- Dai, Z.J.; Yu, R.C.; Li, J.; Chen, H.M. The Characteristics of Summer Precipitation Diurnal Variations in Three Reanalysis Datasets over China. Meteor. Mon. 2011, 37, 21–30. (In Chinese) [Google Scholar]
- Li, Y.; Hu, Z.Y. A Preliminary Study on Land-Surface Albedo in Northern Tibetan Plateau. Plateau Meteorol. 2006, 25, 1034–1041. (In Chinese) [Google Scholar]
- Wang, Y.; Lv, D.R. Diurnal and seasonal variation of clear sky land surface temperature of several representative land surface types in china retrieved by GMS 5. Acta Meteorol. Sin. 2005, 63, 957–968. (In Chinese) [Google Scholar]
- Mao, J.Y.; Wu, G.X. Diurnal variations of summer precipitation over the Asian monsoon region as revealed by TRMM satellite data. Sci. China Earth Sci. 2012, 55, 554–556. [Google Scholar] [CrossRef]
- Feng, L.; Zhong, L.; Ma, Y.M.; Fu, Y.F.; Zou, M.J. Estimation of soil heat flux over the northern Qinghai-Xizang Plateau based on insitu soil temperature and moisture data. Plateau Meteorol. 2016, 35, 297–308. (In Chinese) [Google Scholar]
- Ye, D.Z.; Gao, Y.X. Some characteristics of atmospheric circulation over Qinghai-Tibet Plateau and its adjacent areas in summer. Chin. J. Atmos. Sci. 1977, 4, 289–299. (In Chinese) [Google Scholar]
- Chen, L.X.; Song, Y.K.; Liu, J.P.; Wang, W. On the diurnal variation of convection over Qinghai-Xizang plateau during summer as revealed from meteorological satellite data. Acta Meteorol. Sin. 1999, 57, 549–560. (In Chinese) [Google Scholar]
- Uyeda, H.; Yamada, H.; Horikomi, J.; Shirooka, R.; Koike, T. Characteristics of convective clouds observed by a Doppler radar at Naqu on Tibetan Plateau during the GAME-Tibet IOP. J. Meteorol. Soc. Jpn. 2001, 79, 463–474. [Google Scholar] [CrossRef]
- Liu, L.P.; Feng, J.M.; Chu, R.Z. The diurnal variation of precipitation in monsoon season in the Tibetan Plateau. Adv. Atmos. Sci. 2002, 19, 365–378. [Google Scholar]
- Jiang, J.X.; Fan, M.Z. Convective Clouds and Mesoscale Convective Systems over the Tibetan Plateau in Summer. Chin. J. Atmos. Sci. 2002, 26, 263–270. (In Chinese) [Google Scholar]
- Fujinami, H.; Nomura, S.; Yasunari, T. Characteristics of Diurnal Variations in Convection and Precipitation over the Southern Tibetan Plateau during Summer. Sola 2005, 1, 49–52. [Google Scholar] [CrossRef]
- Gao, W.; Liu, L.; Li, J. The Microphysical Properties of Convective Precipitation Over the Tibetan Plateau by a Subkilometer Resolution Cloud-Resolving Simulation. J. Geophys. Res. 2018, 123, 3212–3227. [Google Scholar] [CrossRef]
- Jian, M.Q.; Luo, H.B. Daily variation of heat sources over the eastern Qinghai-Xizang plateau and surrounding areas and their relationship to the circulation over the Tibetan plateau. Plateau Meteorol. 2002, 21, 25–30. (In Chinese) [Google Scholar]
- Fu, Y.F.; Liu, G.S.; Wu, G.X.; Yu, R.C.; Xu, Y.P.; Wang, Y.; Li, R.; Liu, Q. Tower mast of precipitation over the central Tibetan Plateau summer. Geophy. Res. Lett. 2006, 33, L05802. [Google Scholar] [CrossRef]
- Zheng, Y.G.; Chen, D. Distribution of mesoscale convective systems and its diurnal variation characteristics within China and adjacent area in summer. Chin. Sci. Bull. 2008, 53, 471–481. (In Chinese) [Google Scholar]
- Bai, A.J.; Liu, C.H.; Liu, X.D. Diurnal variation of summer rainfall over the Tibetan Plateau and its neighboring regions revealed by TRMM Multi-satellite Precipitation Analysis. Chin. J. Geophys. 2008, 51, 704–714. (In Chinese) [Google Scholar] [CrossRef]
- Liu, L.P.; Zheng, J.F.; Ruan, Z.; Cui, Z.H.; Hu, Z.Q. The preliminary analyses of the cloud properties over the Tibetan Plateau from the field experiments in clouds precipitation with the various radars. Acta Meteorol. Sin. 2015, 73, 635–647. (In Chinese) [Google Scholar]
- Fu, Y.F.; Liu, G.S. Possible misidentification of rain type by TRMM PR over Tibetan plateau. J. Appl. Meteorol. Climatol. 2007, 46, 667–672. [Google Scholar] [CrossRef]
- Fu, Y.F.; Liu, Q.; Zi, Y.; Feng, S.; Li, Y.Q.; Liu, G.S. Summer precipitation and latent heating over the Tibetan Plateau based on TRMM measurements. Plateau Mt. Meteorol. Res. 2008, 28, 8–18. (In Chinese) [Google Scholar]
- Pan, X.; Fu, Y.F. Analysis on climatological characteristics of deep and shallow precipitation cloud in summer over Qinghai-Xizang plateau. Plateau Meteorol. 2015, 34, 1191–1203. (In Chinese) [Google Scholar]
- Iguchi, T.; Kozu, T.; Meneghini, R.; Awaka, J.; Okamoto, K. Rain-profiling algorithm for the TRMM precipitation radar. J. Appl. Meteorol. 2000, 39, 2038–2052. [Google Scholar] [CrossRef]
- Awaka, J.; Iguchi, T.; Kumagai, H. Rain type classification algorithm for TRMM precipitation radar. In Proceedings of the 1997 IEEE International Geoscience and Remote Sensing Symposium Proceedings Remote Sensing—A Scientific Vision for Sustainable Development, Singapore, 3–8 August 1997. [Google Scholar]
- Kummerow, C.; Barnes, W.; Kouzu, T. The Tropical Rainfall Measuring Mission (TRMM) sensor package. J. Atmos. Ocean. Technol. 1998, 15, 809–817. [Google Scholar] [CrossRef]
- Kummerow, C.; Simpson, J.; Thiele, O. The status of the Tropical Rainfall Measuring Mission (TRMM) after two years in orbit. J. Appl. Meteorol. 2000, 39, 1965–1982. [Google Scholar] [CrossRef]
- Kozu, T.; Kawanishi, T.; Kuroiwa, H.; Kojima, M.; Oikawa, K. Development of precipitation radar onboard the Tropical Rainfall Measuring Mission (TRMM) satellite. IEEE Trans. Geosci. Remote Sens. 2001, 39, 102–116. [Google Scholar] [CrossRef]
- Fu, Y.F.; Cao, A.Q.; Cao, A.Q.; Feng, S.; Zheng, Y.Y.; Liu, Y.; Zhang, A.M. Climatic characteristics of the storm top altitude for the convective and stratiform precipitation in summer Asia based on measurements of the TRMM Precipitation Radar. Acta Meteorol. Sin. 2012, 70, 436–451. (In Chinese) [Google Scholar]
- Chen, F.J.; Fu, Y.F.; Liu, P.; Yang, Y.J. Seasonal variability of storm top altitudes in the tropics and subtropics observed by TRMM PR. Atmos. Res. 2016, 169, 113–126. [Google Scholar] [CrossRef]
- Fu, Y.F.; Pan, X.; Liu, G.S.; Li, R.; Zhong, L. Characteristics of precipitation based on cloud brightness temperatures and storm tops in summer Tibetan Plateau. Chin. J. Atmos. Sci. 2016, 40, 102–120. (In Chinese) [Google Scholar]
- Fu, Y.F.; Zhang, A.M.; Liu, Y.; Zheng, Y.Y.; Hu, Y.F.; Feng, S.; Cao, A.Q. Characteristics of seasonal scale convective and stratiform precipitation in Asia based on measurements by TRMM Precipitation Radar. Acta Meteorol. Sin. 2008, 66, 730–746. (In Chinese) [Google Scholar]
- Fu, Y.F.; Pan, X.; Xian, T.; Liu, G.S.; Zhong, L.; Liu, Q. Precipitation characteristics over the steep slope of the Himalayas in rainy season observed by TRMM PR and VIRS. Clim. Dyn. 2018, 51, 1971–1989. [Google Scholar] [CrossRef]
- Liu, P.; Fu, Y.F. Climatic Characteristics of Summer Convective and Stratiform Precipitation in Southern China Based on Measurements by TRMM Precipitation Radar. Chin. J. Atmos. Sci. 2010, 34, 802–814. (In Chinese) [Google Scholar]
- Tao, S.Y.; Zhu, W.M. Inter annual variability of Meiyu rainfalls. Chin. J. Atmos. Sci. 1988, 12, 13–21. (In Chinese) [Google Scholar]
- Zhang, P.C.; Du, B.Y. Radar Meteorology, 2nd ed.; China Meteorological Press: Beijing, China, 2001; pp. 171–190. [Google Scholar]
- Masunaga, H.; Iguchi, T.; Oki, R.; Kachi, M. Comparison of rainfall products derived from TRMM microwave imager and precipitation radar. J. Appl. Meteorol. 2002, 41, 849–862. [Google Scholar] [CrossRef]
- Iguchi, T.; Kozu, T.; Kwiatkowski, J.; Meneghini, R.; Awaka, J. Uncertainties in the Rain Profiling Algorithm for the TRMM Precipitation Radar. J. Meteorol. Soc. Jpn. 2009, 87A, 1–30. [Google Scholar] [CrossRef]
- Fu, Y.F.; Ma, Y.M.; Zhong, L.; Yang, Y.J.; Guo, X.L.; Wang, C.H.; Xu, X.F.; Yang, K.; Xu, X.D.; Liu, L.P. Land-surface processes and summer-cloud-precipitation characteristics in the Tibetan Plateau and their effects on downstream weather: A review and perspective. Natl. Sci. Rev. 2020, 7, 500–515. [Google Scholar] [CrossRef]
- Feng, S.; Fu, Y.F.; Xiao, Q.N. Is the tropopause higher over the Tibetan Plateau? Observational evidence from Constellation Observing System for Meteorology, Ionosphere, and Climate (COSMIC) data. J. Geophys. Res. 2011, 116, D21. [Google Scholar] [CrossRef]
- Luan, L.; Meng, X.; Lyu, S.H.; Han, B. Simulation on afternoon convective precipitation triggered by soil moisture over the Qinghai-Xizang Plateau. Plateau Meteorol. 2018, 37, 873–885. (In Chinese) [Google Scholar]
Publisher’s Note: MDPI stays neutral with regard to jurisdictional claims in published maps and institutional affiliations. |
© 2021 by the authors. Licensee MDPI, Basel, Switzerland. This article is an open access article distributed under the terms and conditions of the Creative Commons Attribution (CC BY) license (https://creativecommons.org/licenses/by/4.0/).