Article

Assessment of Air Pollution before, during and after the COVID-19 Pandemic Lockdown in Nanjing, China

1
Key Laboratory of Virtual Geographic Environment, Ministry of Education, Nanjing Normal University, Nanjing 210023, China
2
School of Geography, Nanjing Normal University, Nanjing 210023, China
3
Jiangsu Center for Collaborative Innovation in Geographical Information, Resource Development and Application, Nanjing 210023, China
4
Department of Chemistry, COMSATS University Islamabad, Islamabad 45550, Pakistan
5
Department of Geography, Bahauddin Zakariya University, Multan, Punjab 60000, Pakistan
*
Authors to whom correspondence should be addressed.
Atmosphere 2021, 12(6), 743; https://doi.org/10.3390/atmos12060743
Submission received: 26 April 2021 / Revised: 24 May 2021 / Accepted: 1 June 2021 / Published: 9 June 2021
(This article belongs to the Section Air Quality)

Abstract

:
A unique illness, the coronavirus disease 2019 (COVID-19), emerged in Wuhan, People’s Republic of China, in December 2019. To reduce the spread of the virus, strict lockdown policies and control measures were put in place all over the world. Due to these enforced limitations, a drastic drop in air pollution and an improvement in air quality were observed. The present study used six air pollutants (PM10, PM2.5, SO2, NO2, CO and O3) to observe trends before, during and after the COVID-19 lockdown period in Nanjing, China. The data were divided into six phases: P1–P3, pre-lockdown (1 October–31 December 2019), lockdown (1 January–31 March 2020), after lockdown (1 April–30 June 2020), P4–P6: the same dates as the lockdown but during 2017, 2018 and 2019. The results indicate that compared with the pre-lockdown phase, the PM10 and PM2.5 average concentrations decreased by –27.71% and –5.09%. Compared with the previous three years, 2017–2019, the reductions in PM10 and PM2.5 were –37.99% and –33.56%, respectively. Among other pollutants, concentrations of SO2 (–32.90%), NO2 (–34.66%) and CO (–16.85%) also decreased during the lockdown, while the concentration of O3 increased by approximately 25.45%. Moreover, compared with the pre- and during lockdown phases, PM10, PM2.5 and NO2 showed decreasing trends while SO2, CO and O3 concentrations increased. These findings present a road map for upcoming studies and provide a new path for policymakers to create policies to improve air quality.

1. Introduction

A new type of virus, a novel coronavirus disease, was first identified at the end of December 2019 in the capital city of China’s Hubei Province, Wuhan. The World Health Organization (WHO) officially called it the coronavirus disease 2019 (COVID-19) [1]. The initial symptoms of COVID-19 are similar to those of SARS and MERS [2]. After the first confirmed case, the number of infected people increased rapidly all over the country, and within just a few days, due to the spread of COVID-19, it turned into a national disaster [3,4]. At the end of June 2020, in 215 countries around the world, more than 10.6 million people had been infected and 514,315 people had died as a result of the spread of COVID-19. The WHO confirmed COVID-19 as worldwide public health emergency due to its large-scale spread and contagious effects [2]. The prevention and treatment of the virus’ infection has become a significant task [5]. By early August 2020, more than 19.46 million confirmed cases of COVID-19 were observed in over 200 countries and territories around the world, according to the WHO [4].
To prevent the large-scale spread of COVID-19, the government of China imposed strict prevention and control policies such as social distancing, self-quarantine, traffic restrictions, community limitations and lockdowns for public health [6]. A lockdown was implemented in Wuhan and nearby affected areas, with travel limitations and restrictions on non-essential movement. Within a few days, in January 2020, the lockdown was in effect all over the country. This type of shutdown and strict policies have affected every aspect of life including the environment. These control measures and restrictions on human activity led to a reduction in local transport in cities and a considerable decline in industrial processes, contributing to a decrease in air pollution [3]. Compared to normal conditions, most cities have experienced a remarkable change and reduction in air pollution [7,8]. Many scholars have found a positive association between the reduction in air pollution and regular social activities during the COVID-19 pandemic in different regions and territories in China [9,10,11,12]. Owing to similar lockdown and control measures, the air quality has also improved in many countries and territories around the world [13]. A high number of deaths and an increasing number of cases of respiratory illness due to poor air quality have been reported [14]. Each year, 4.6 million people die from diseases and ailments related to poor air quality, according to the World Health Organization [15], with poor air quality resulting in more deaths compared to other environmental problems [16].
Overall, all around the world, an improvement in air quality has been observed due to the implementation of lockdown and shutdown policies [17,18]. For instance, according to Hanaoka and Masui (2020) [19], CO emissions decreased by 25% and by 6% in China and worldwide, respectively. In 366 urban areas across China, the concentrations of PM10, PM2.5, SO2, NO2 and CO were reduced, while O3 showed increasing rates [20]. According to NASA [21], NO2 emissions decreased by 30% in Central China. In the USA, a study using air quality data from 2017 to 2020 found that the concentrations of PM2.5 and NO2 decreased during the COVID-19 period. The study found a remarkable reduction in PM2.5 and NO2 by 11% and 26%, respectively [22]. Furthermore, in the USA, concentrations of PM2.5, NO2 and CO decreased by 19%, 37% and 1.1%, respectively, while in China, concentrations of PM10, PM2.5, SO2, CO and NO2 were reduced by 27%, 39%, 18%, 18% and 38%, respectively [23]. Agarwal et al. [24] reported that nationwide lockdown and shutdown policies in India and China resulted in a significant improvement in air quality status. The results demonstrate that in India and China, concentrations of PM2.5 and NO2 decreased by 65% and 66%, and 45% and 37%, respectively. Compared with the same window of time in 2019, the surface and tropospheric NO2 declined by 20–30% in China [25]. According to Urrego and Urrego (2020) [26], fine particulate matter showed a declining trend in the 50 most polluted cities worldwide. In another study, Zambrano-Monserrate and Ruano (2020) [27] found that just after the implementation of lockdown, PM2.5 and NO2 concentrations were reduced. However, during the COVID-19 period in North China, due to unfavorable atmospheric circumstances, the status of the 24 h average concentration of PM2.5 exceeded 200 mg/m3 [28,29].
Satellite data and ground-based observations were used to determine the effect of different pollutants in Wuhan during China’s Spring Festival in 2020 [30]. The authors of this study noticed a sudden decrease in different pollutants during the COVID-19 period compared with the pre-lockdown period. Griffin et al. [31] found similar results for NO2, i.e., a reduction during COVID-19 in Ontario, Canada, by using the Tropospheric Monitoring Instrument (TROPOMI). Bauwens et al. [32] recorded a 40% decrease in NO2 during the COVID-19 period from January 2020 to April 2020 in China, South Korea, Western Europe, and the USA using TROPOMI onboard Sentinel-5 Precursor and OMI on Aura. Lorente et al. [33] revealed that the concentration of NO2 was highest during cold weekdays in February 2018 and lowest during Spring 2018 using satellite data. Solberg et al. [34] developed a generalized additive model (GAM) to find the relationships between various meteorological parameters and temporal metrics in different countries. The study observed a decrease in NO2 concentrations in Eastern countries (Poland and Hungary) from April to June 2020. Wang et al. [35] studied the impact of lockdown on air pollutants using a satellite data set. The authors found a significant decrease in the concentrations of the air pollutants during the lockdown. Goldberg et al. [36] reported that meteorological patterns have a major impact on air pollutants and observed a decrease in air pollutants in spring 2020 due to these meteorological variations. Li et al. [37] developed a regression model for predicting the mortality rate during COVID-19 and studied the impact of air quality on the mortality rate during COVID-19.
The present study estimated the levels of six air pollutants (i.e., PM10, PM2.5, SO2, NO2, CO and O3) in Nanjing, the capital city of Jiangsu Province, using data obtained from nine ground-based monitoring stations. This study determined the impact of the lockdown during COVID-19 on air pollution in Nanjing and compared the results with the previous 3 years to discover significant changes in air pollution. However, recent studies have shown that especially in urban areas and regions, forced limitations and lockdown measures contribute to improvements in air quality for limited time periods (e.g., [38]). Most of the studies used only a few air pollutants to assess the impacts of the COVID-19 lockdown on air quality [39]. Thus, studies assessing the impact of the COVID-19 lockdown on all six air pollutants before, during and after the lockdown period as well as a comparison of these air pollutants with the previous three years (2017–2019) for a deeper analysis, are lacking. Therefore, our study provides a more comprehensive analysis of this scenario, and the results show a remarkable decline in the selected pollutants during the lockdown period in comparison to the previous three years. The objectives of this study were (1) to examine the air pollutant concentrations before, during and after the lockdown period in Nanjing; (2) to explore and quantify the air-quality status due to the nationwide lockdown and strict limitations amid the lockdown phase; (3) to explore the air pollutant concentrations during the same window of time in the last three years. The current study provides credible and useful outcomes, and insights for the scientific community and policymakers on the impact of nationwide lockdowns on air pollution. Further, the study provides a roadmap for upgrading and improving Nanjing’s air quality in the future.

2. Materials and Methods

2.1. Study Area

Nanjing, with its 2000 years of history, is the capital of Jiangsu Province and the economic hub of the Yangtze River Delta. Nanjing is one of the most important and rapidly developing cities in China, with a large population and well-developed industry and manufacturing sectors [40]. In recent years, Nanjing has been faced with extreme and severe air pollution owing to its rapid economic growth and non-stop energy consumption [41]. Nanjing lies between the geo-coordinates 31°14′ to 32°37′ and 118°22′ to 119°14′, and occupies an area of approximately 6596 km2 with 11 districts that can be classified into three regions: urban, suburban and rural. Geographically, the city is located within the Yangtze River Delta. As of 2019, the population of Nanjing was approximately 8.34 million with a density of 8500 people/km2 in the central area. The city experiences a subtropical monsoon climate with four distinct seasons. The annual average temperature ranges between 16 °C and 38 °C in the summer and is −8 °C in the winter, and the annual precipitation is approximately 1090 mm [42]. In China, Nanjing is one of four garden cities with a per capita green area of 13.7 km2, although there are many large areas of industry and enterprise. The leading industries in Nanjing are electronics, automobiles, petrochemicals, and steel smelting. To improve and rectify these polluting sites and enterprises, the administration has taken a number of measures. Additionally, the city is bordered by highlands and mountains on three sides and by water on the other, which can result in the accumulation of air pollutants in urban areas.
Presently in Nanjing, there are nine monitoring stations operating and recording air pollutants. The locations of these stations are shown in Figure 1.

2.2. Environmental Data and Study Period

In order to investigate air quality in Nanjing, data on the daily average concentration for the six air pollutants, including particulate matter with a diameter of ≤10 µm (PM10), particulate matter with a diameter of ≤2.5 µm (PM2.5), sulfur dioxide (SO2), nitrogen dioxide (NO2), carbon monoxide (CO) and ozone (O3), were obtained from the Nanjing Environmental Monitoring Center, after being collected from the nine monitoring stations. The data for all concentrations had at least 347 daily values, which meets the annual concentration calculation criteria of the Ambient Air Quality Standards of China, which is 324 daily values. These nine monitoring stations were designed to signify areas with different characteristics and features according to the Technical Regulation for Selection of Ambient Air Quality Monitoring Stations of China. Among these nine national stations, Xianlin represents a cultural area, Pukou represents a suburban area, Caochangmen is an instructive and educational area, Xuanwuhu covers an environmental and ecological park area, Ruijinlu is connected with a residential and housing area, Zhonghuamen represents a transportation and traffic area, Maigaoqiao covers a commercial and industrial area, Aotizhongxin represents a built-up and new city area, and Shanxilu represents a commercial and market area. The Nanjing Environmental Monitoring Center provided the geographical location information for these monitoring sites. To assess the effect of the lockdown before, during and after the COVID-19 period, the data were divided into six periods in 2017–2020: P1–P3, before lockdown (1 October–31 December 2019), lockdown (1 January–31 March 2020), after lockdown (1 April–30 June 2020), and P4–P6, which include the same dates as the lockdown but in the previous three years (2017–2019).

2.3. Statistical Analysis and Data Visualization

Summary statistics were performed for different variables during the study period. The current study reports variations in pollutant concentrations before, during and after the lockdown phases and compares the previous three years (2017–2019) with the same time frame as that of the lockdown. The net difference and percentage change in concentrations of the selected pollutants were also investigated. To better understand the impact of the nationwide lockdown on air pollution, this work also reports the temporal evolution in daily average concentrations of the pollutants before, during and after the lockdown periods. Meanwhile, violin plots were generated to represent the concentrations of selected air pollutants during the study period. To assess the relationships among air pollutants, linear regression analysis was performed for different air pollutants during the lockdown period. The current study area map was created with ArcGIS 10.2.2, while other plots were created with Python.

3. Results and Discussion

3.1. Changes in Different Pollutants before, during and after the Lockdown Phases

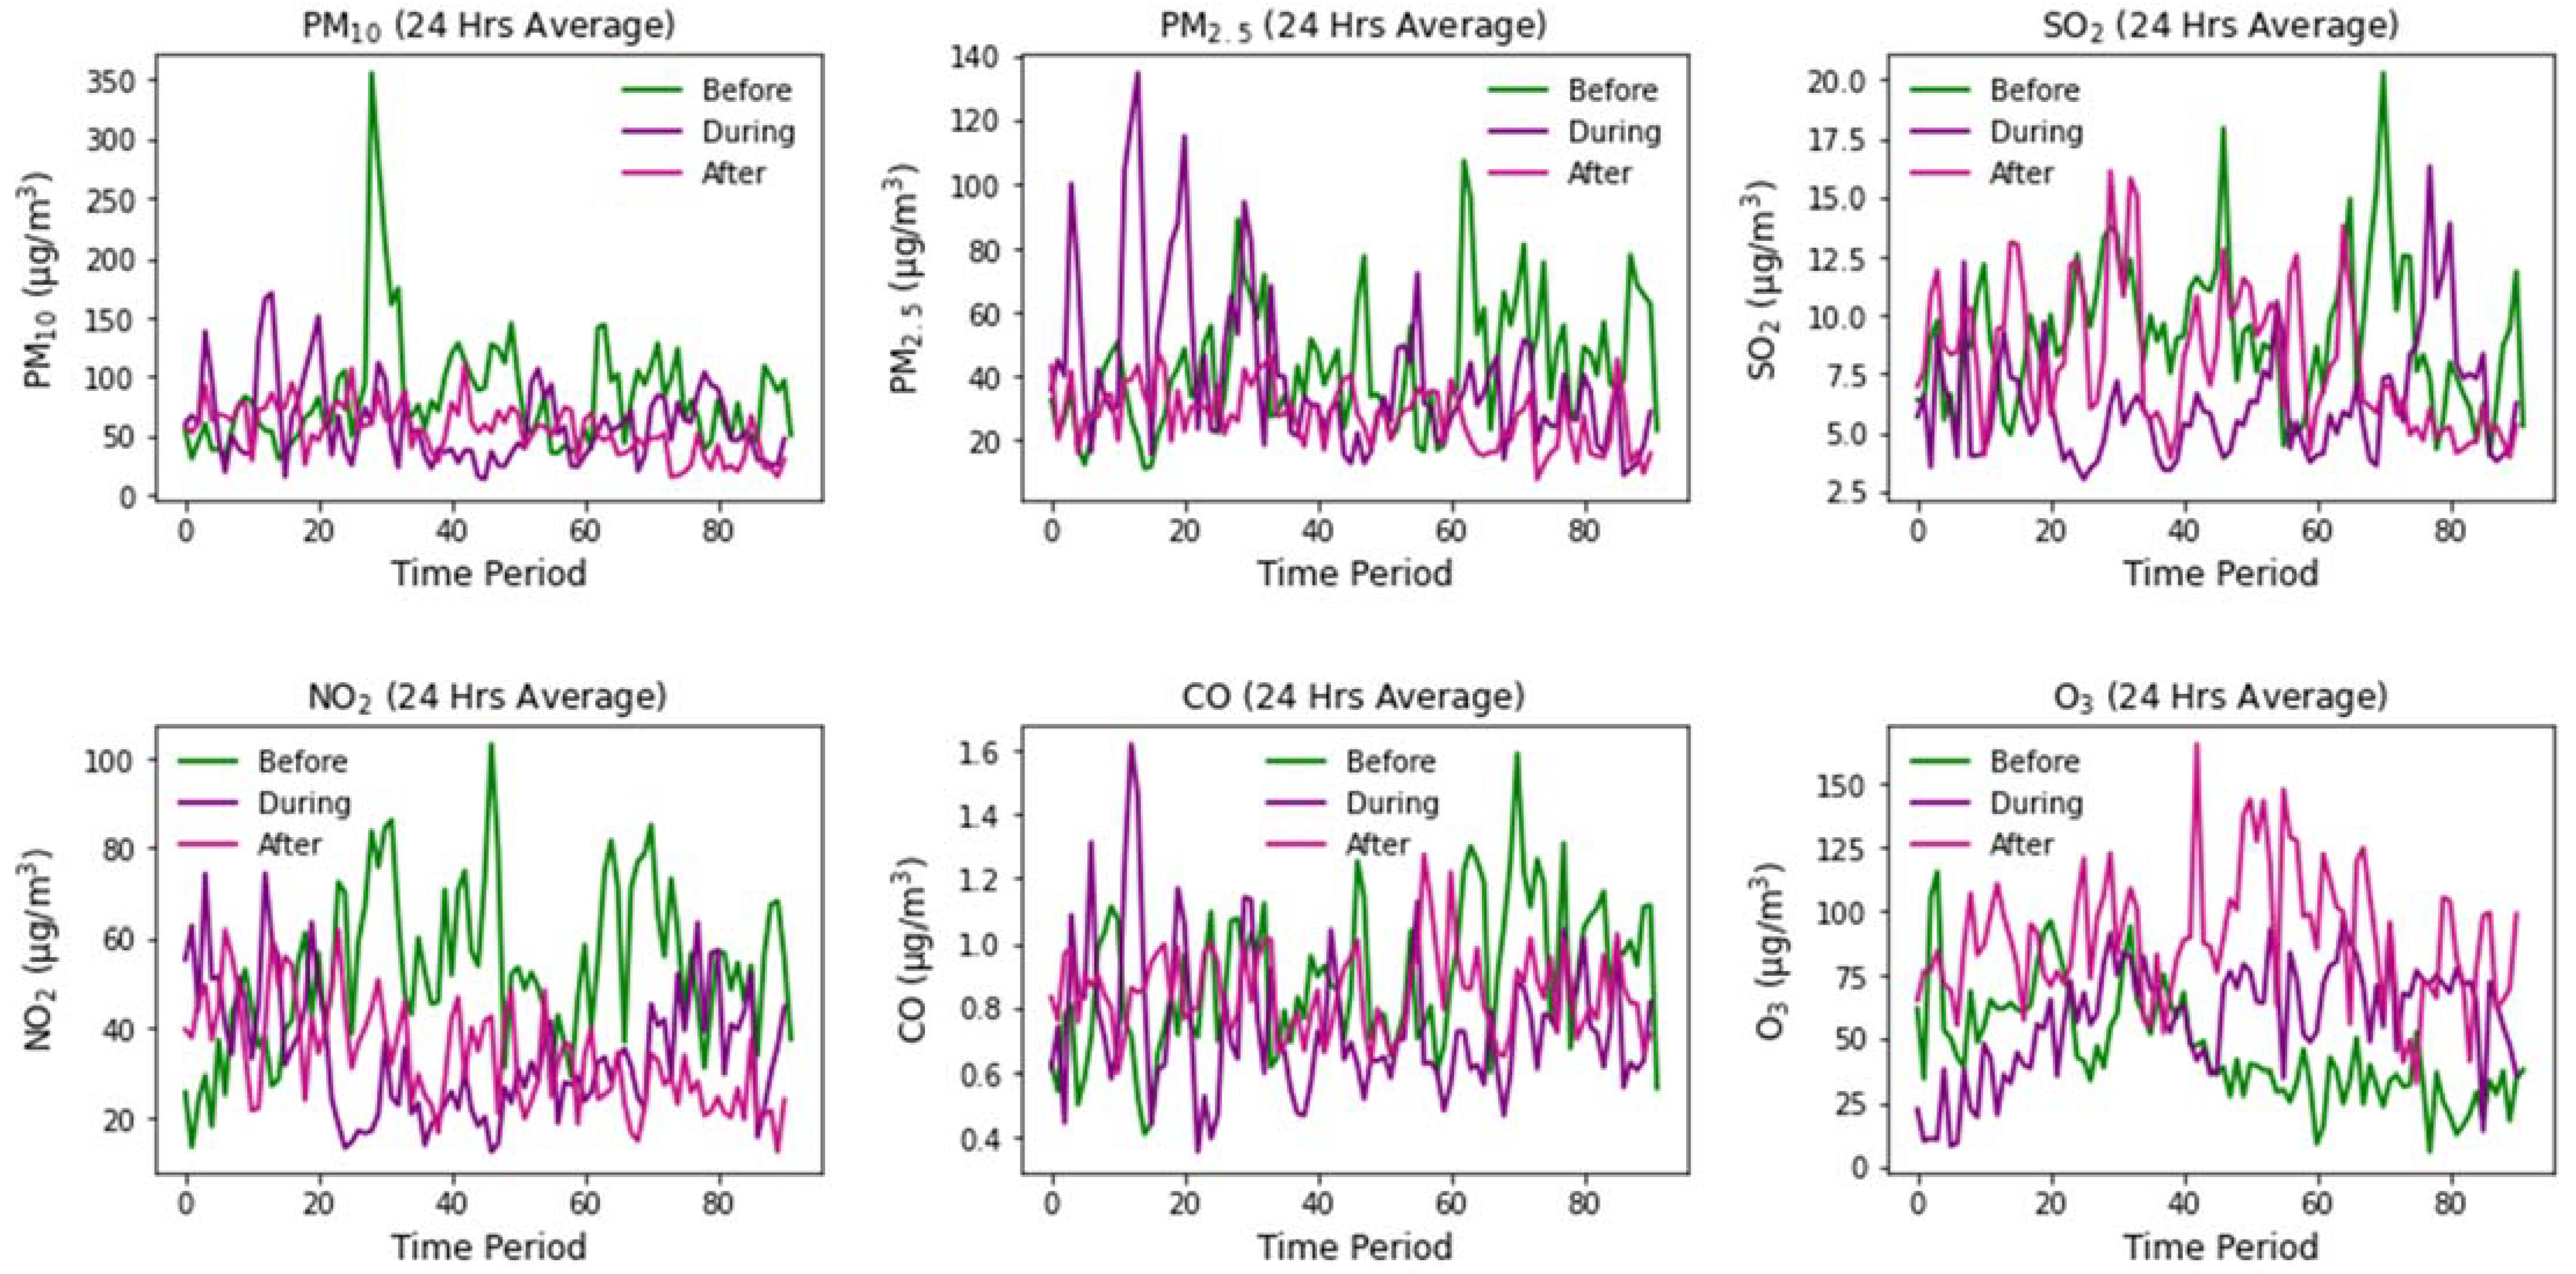
Changes in different pollutants (PM10, PM2.5, SO2, NO2, CO and O3) before, during and after the lockdown periods are shown in Figure 2. Overall, an increasing trend in PM10 was observed before the lockdown phase. During lockdown, a diminishing trend in the concentration of PM10 was observed, and it continued to decrease after the lockdown phase with similar variabilities. The results suggest that the significant reduction in the concentration of PM10 could be due to the limited vehicular, industrial and construction activities. A remarkable reduction in vehicular and transportation activities could also decrease air pollution [43]. Before the lockdown phase, PM2.5 demonstrated an increasing trend; at first, during lockdown it showed an increasing trend and later decreased, while after lockdown, the concentration of PM2.5 decreased significantly. The results suggest that, overall, during the lockdown phase, PM2.5 showed a constantly decreasing trend.
Before lockdown, SO2 concentrations showed an increasing trend, while during and after lockdown, SO2 concentrations decreased. The results suggest that the decrease in the concentration of SO2 was due to the reduced thermal, transportation and industrial activities. The main sources of SO2 are the burning of fuels such as coal and diesel used in thermal, transportation and industrial enterprises [44]. The stoppage of industrial, vehicular, and heating activities were responsible for the reduction in SO2 emissions during the lockdown phase in China [10]. Moreover, before the lockdown phase, just as for PM, a rapidly increasing trend in NO2 was observed, while during lockdown, NO2 showed a declining trend. After lockdown, NO2 presented a substantial diminishing tendency.
Before the lockdown phase, CO demonstrated an increasing trend, while during the lockdown phase, within just a few days, CO showed an increasing trend, then a consistent decline. After lockdown, CO presented an increasing trend with some fluctuations compared with the lockdown phase. Furthermore, a significant decreasing trend in O3 was observed before the lockdown phase, while during lockdown, O3 showed an increasing tendency. A rapidly growing trend was observed after the lockdown phase owing to the enhancement of solar radiation in the summer. In the summer, emissions of isoprene and biomass burning are responsible for the increment in O3 [45]. The results suggest that the decrease in all air pollutants during COVID-19 was due to the low level of traffic, decreased human mobility and the closure of all industrial and construction activities [46].

3.2. Spatial Concentration Pattern of PM10

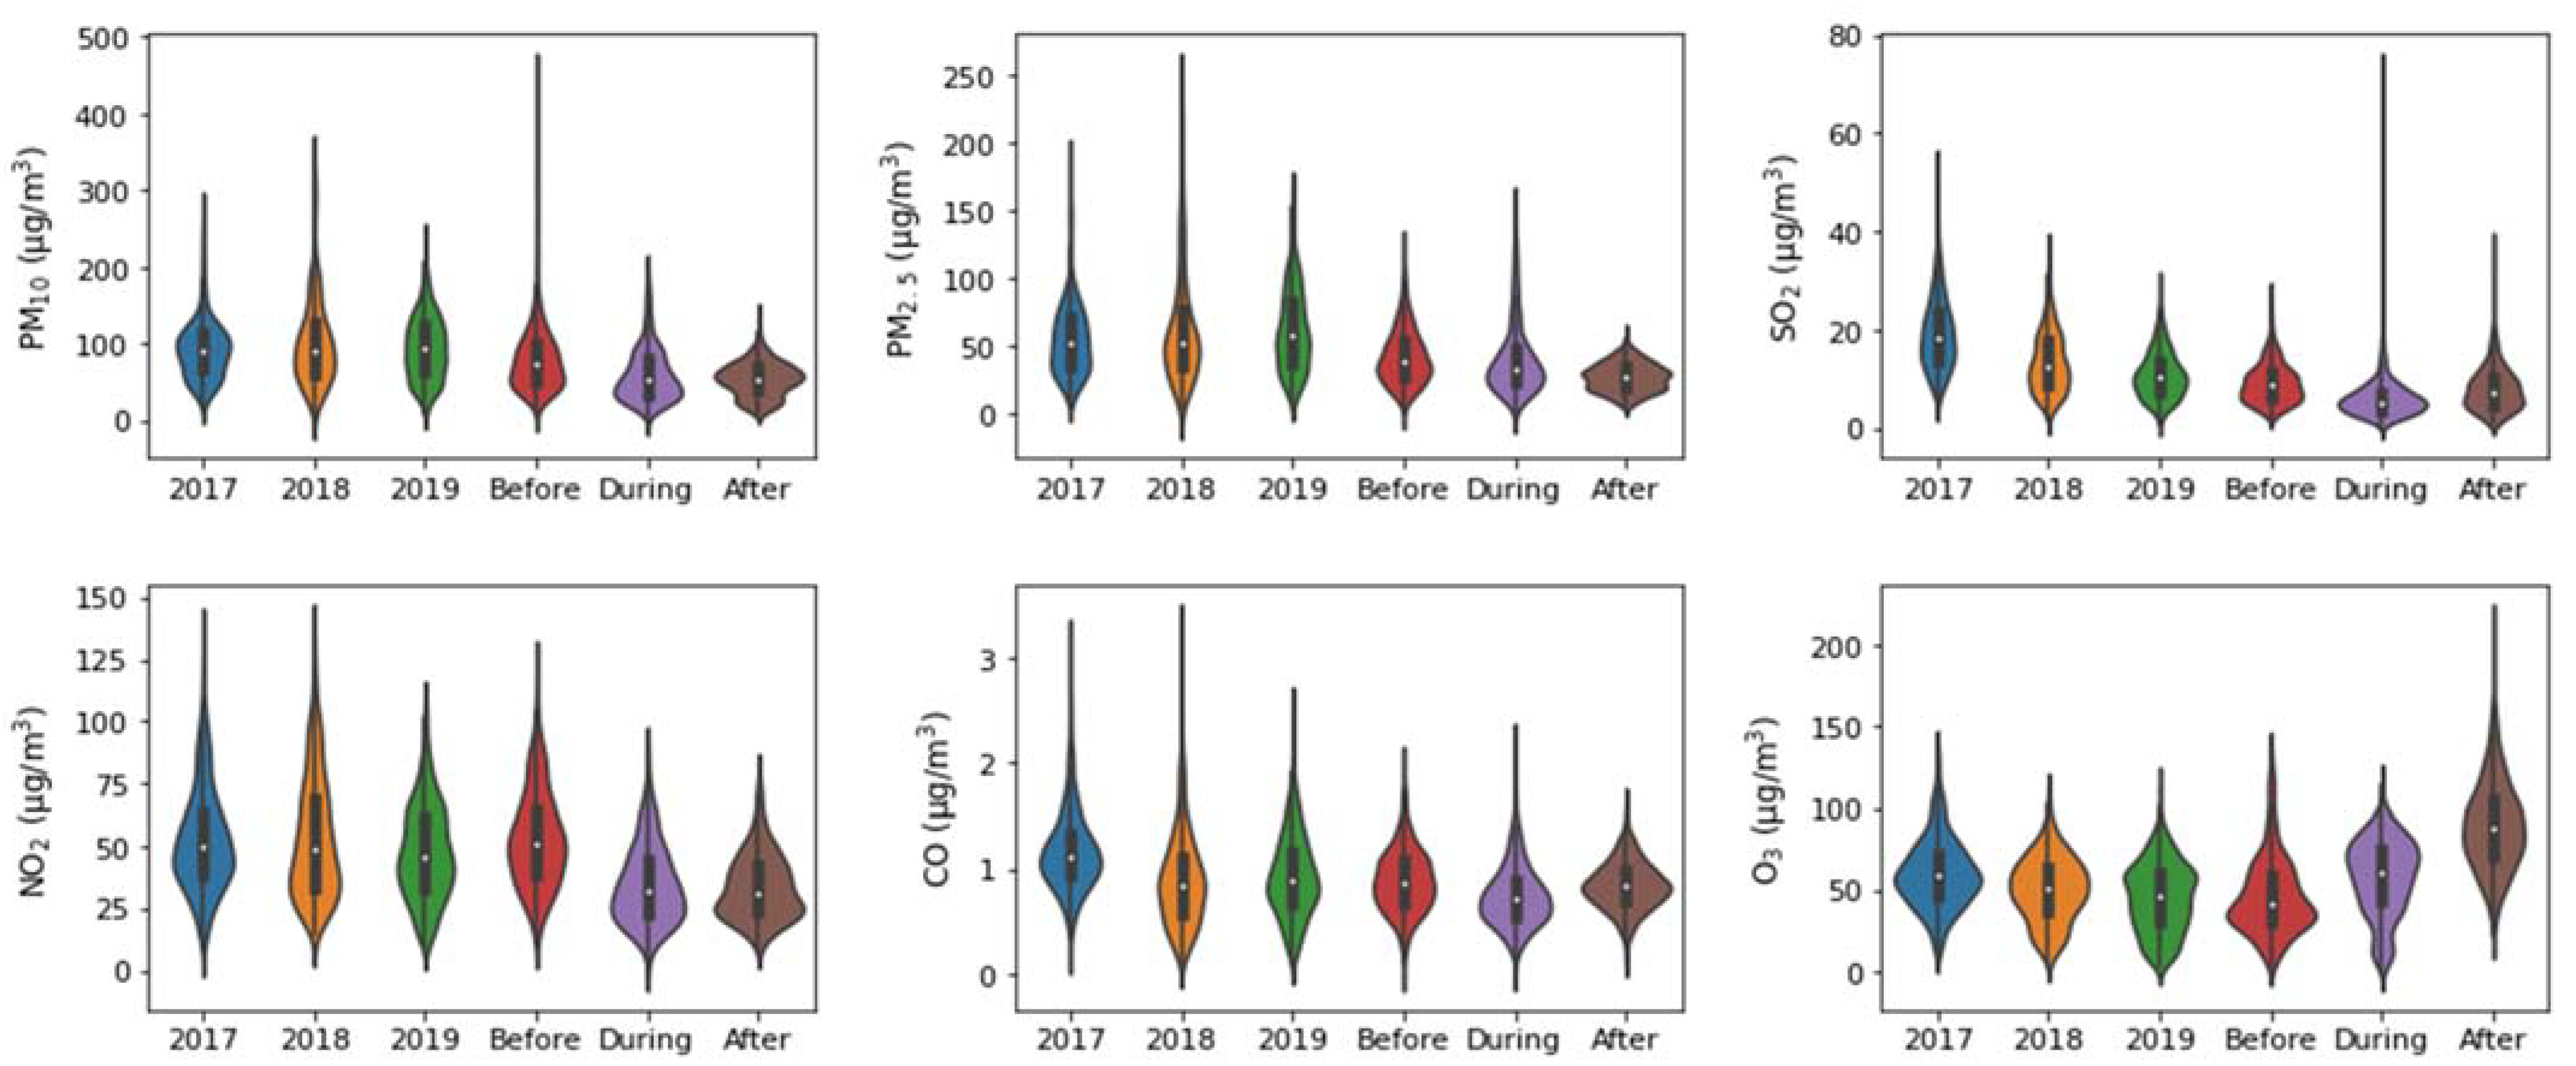
Owing to the COVID-19 pandemic, a lockdown was imposed in many countries to control and minimize the movements of people. In China, the lockdown was implemented in January 2020. This type of shutdown and strict control policies reduce the movement of people and vehicles and restrict industries, markets, universities and construction activities, among others, leading to a drastic change and substantial improvement in air quality in many countries and regions. Our results demonstrate that during the COVID-19 pandemic lockdown phase in China, Nanjing experienced a significant change in PM10 and a reduction of approximately −27.71% compared with the pre-lockdown phase, due to the restricted traffic and shutdown of industries. Compared with the pre- and during lockdown phases, an approximately −23.65% reduction in PM10 concentration was recorded. The average concentration of PM10 and the variations are shown in Figure 3 and Table 1, Table 2 and Table 3. The main sources of PM10 concentrations are road dust and soil resuspension, agronomy, transportation and fugitive dust emissions generated by industrial and manufacturing activities [13]. During the COVID-19 lockdown in 2020, these activities diminished significantly, which resulted in a drastic drop and reduction in air quality, especially in cities that mostly experience heavy pollution due to transportation, manufacturing and industrial processes [47]. For instance, it was reported by Shakoor et al. (2020) [23] that an approximately 27% reduction in PM10 concentration was found in China during the COVID-19 pandemic lockdown period. According to Bao and Zhang 2020 [10], during the COVID-19 pandemic, air pollution decreased by approximately 7.80% in 44 cities in northern China.
Our study shows, compared with 2019 (for the same time frame), the concentration of PM10 was significantly reduced (36.90%) during the COVID-19 lockdown period. As compared with the previous three years 2017–2019 (same dates of lockdown), a −37.99% decline in the concentration of PM10 was observed. According to Chen et al. (2020b) [20], the concentration of PM10 during the COVID-19 pandemic lockdown period decreased in comparison to the previous three years (2017–2019). The results show the variations between the lockdown and post-lockdown periods. During the lockdown period, the reduction in the concentration of PM10 was observed to be −9.02%. After the lockdown phase, compared to the last three years (2017–2019), a significant reduction in PM10 concentration was observed, −43.58%. The results suggest that an improvement in PM10 concentration was evident because of the COVID-19 lockdown. In summary, this significant reduction and improvement in the concentration of PM10 demonstrates that the COVID-19 pandemic lockdown had a remarkable impact on the reduction of PM10 concentrations in Nanjing, China.

3.3. Spatial Concentration Pattern of PM2.5

Particulate matter, also known as PM2.5 with an aerodynamic diameter of 2.5 μm or less than 2.5 μm, is linked with numerous adverse human health effects, especially respiratory and cardiovascular infections. According to the Global Burden of Disease, particulate matter (PM2.5) is the seventh and fourth main risk factor in the world and China, respectively [15,48]. During the COVID-19 lockdown phase in Nanjing, the PM2.5 concentration decreased by −5.09% compared with the pre-lockdown phase. Compared with PM10, the reduction in the concentration of PM2.5 was relatively lower. The average concentration of PM2.5 and variations are presented in Figure 3 and Table 1, Table 2 and Table 3. Further, compared with the pre- and during lockdown phases, Nanjing experienced a significant decline of −33.41% after the lockdown. Similar decreasing trends in the concentrations of PM2.5 in many cities across the world have been reported by Singh and Chauhan (2020) [8]. Vehicular emissions, industrial production and construction activities, among others, are the main sources of PM2.5 concentrations [13]. The results suggest that during the COVID-19 lockdown, reduced human mobility and the stoppage of vehicular and industrial processes subsequently caused a considerable drop in fine particulate matter in the environment. Previously, Chen et al. (2020b) [20] also reported that during the COVID-19 period, PM2.5 declined in many areas and regions across China.
During the lockdown period a noteworthy improvement and reduction in the PM2.5 concentration (−34.81%) was found compared with 2019. The previous three years’ (2017–2019) data showed a significant reduction in PM2.5 (−33.56%). The results indicate that the reduction ratio in 2020 was greater compared with 2017–2019 in Nanjing. A similar pattern of PM2.5 reduction was reported in the USA, using air-quality data between 2017 and 2020 and 2017 and 2019 in China, respectively [20,22]. In the Guangxi Region, compared with 2016–2019, during the lockdown period, an approximately −22.6% reduction in PM2.5 was observed as reported by Fu et al. (2020) [49]. However, the present study revealed that compared with the lockdown period, the concentration of PM2.5 reduced by up to −31.63%, and after lockdown it reached −54.57%. Overall, compared with the previous three years, the present study concludes that the lockdown and strict polices caused a notable reduction and improvement in air quality.

3.4. Spatial Concentration Pattern of SO2

The present study shows that due to the nationwide lockdown, a significant improvement in SO2 was observed. Compared with the pre- and during lockdown phases, SO2 showed an increasing trend. The results demonstrate that compared with the pre-lockdown phase, an approximately −32.90% reduction in the SO2 concentration was observed. However, compared with the pre- and during lockdown phases, SO2 increased by 5.95% in Nanjing. This increment in SO2 concentration can be attributed to coal burning, power plants and industrial activities after lockdown [13]. The average concentration of SO2 and variations are presented in Figure 3 and Table 1, Table 2 and Table 3. The main sources of SO2 are coal and diesel used in thermal power, burning of fuels, transport and industry [44]. Due to the COVID-19 lockdown, limited industrial, vehicular and heating activities were responsible for the reduction in SO2 emissions. Previously in China, a similar pattern in SO2 reduction was reported [10,12]. In addition, it is evident from Shakoor et al.’s (2020) [23] study, that compared with the pre-lockdown phase, SO2 was reduced by 18% during the lockdown phase in China.
Moreover, compared to the year before (2019) with the same time frame, a sizable reduction and improvement in the concentration of SO2 was observed, that is, up to −43.77% during the lockdown phase in Nanjing. A reduction in the SO2 concentration during this period was greater compared with the pre-lockdown phase for the same time frame in Nanjing. Similar results have been reported by Bao and Zhang (2020) [10] and Islam et al. (2020) [39] in China and Bangladesh, respectively. These studies demonstrate that compared to 2019, the SO2 concentration decreased. Further, our study also found that compared with the previous three years with the same time period (2017–2019), SO2 showed a sharp decline of up to −57.70% during the lockdown phase. It is evident from the study by Chen et al. (2020b) [20] that concentrations of SO2 were reduced compared with 2017–2019 in many areas across China. Nanjing experienced a considerable increasing trend in SO2 up to 31.92% after the lockdown. However, in the previous three years, the concentration of SO2 decreased by −44.20%. According to Fu et al. (2020) [49], SO2 was found at its lowest level during the lockdown phase compared with the previous five years in the Guangxi Region, China. Overall, there was a decline in SO2 concentration throughout the study period in Nanjing, except after the lockdown phase compared with the pre- and during lockdown phases.

3.5. Spatial Concentration Pattern of NO2

The results witnessed during the lockdown phase, show that owing to the COVID-19 pandemic and post-lockdown, Nanjing experienced a significant reduction in NO2 concentration. The average concentration of NO2 and variations are shown in Figure 3 and Table 1, Table 2 and Table 3. The study revealed that compared with the pre-lockdown phase, a −34.66% reduction and improvement in NO2 concentration was observed. During the lockdown phase, compared with pre- and during lockdown phases, the concentration of NO2 decreased by −22.70%. The reduction in NO2 concentration was greater during the lockdown phase. A similar pattern of results was observed by NASA (2020) [21], and NO2 emissions decreased by 30% in Central China. Shakoor et al. (2020) [23] reported that during the lockdown phase, a 38% decline in NO2 concentration was found in China. Another study revealed that during lockdown, there was a decline in NO2 concentration over the Yangtze River Delta [9]. NO2 is mainly emitted from vehicles, power plants, road traffic and industrial and manufacturing activities in urban areas and regions. Due to the nationwide lockdown, all of these sectors closed, which resulted in the decline in pollutants such as NO2.
During the lockdown, Nanjing was found to experience a −27.36% drop in NO2 concentration compared to the previous year, 2019. It was reported by Fu et al. (2020) [49] that NO2 showed a declining trend during the lockdown phase compared with the previous 5 years. Compared to the 2019 measurements for the same dates, a 34.7% drop in the concentration of NO2 was found in North China. Compared with 2019, the concentration of surface and tropospheric NO2 decreased by up to 20–30% in China [25]. It is evident from the study by Chen et al. (2020b) [20] that in many areas across China, the concentration of NO2 decreased during 2017–2019. According to Berman and Ebisu 2020 [22], between 2017 and 2020, NO2 emissions decreased by −26% during the lockdown phase in the USA. Moreover, compared to the lockdown phase, the concentration of NO2 declined by up to −2.20% after the lockdown. Compared to the previous three years, for the same time frame (2017–2019), a significant decline of −33.89% in NO2 concentration was observed after the lockdown phase. In summary, a drastic change and improvement in the concentration of NO2 showed that the lockdown and strict policies had a significant impact on changing and decreasing the NO2 concentrations in Nanjing.

3.6. Spatial Concentration Pattern of CO

During the lockdown phase, due to the COVID-19 pandemic in Nanjing, like other pollutants, CO showed a decreasing trend, while after lockdown the CO concentration increased. The average concentration of CO and variations are depicted in Figure 3 and Table 1, Table 2 and Table 3. The present study shows that compared to the pre-lockdown phase, the concentration of CO decreased by −16.85% during the lockdown. The results suggest that it this was mainly due to the restrictions on transportation and vehicles in Nanjing, while compared with the pre- and during lockdown phases, CO increased by 3.07%. CO is emitted from vehicular sources, burning of agricultural waste, biofuel burning and combustion of fossil fuels [50]. During the lockdown period, all of these sectors were closed, which resulted in a significant improvement in the concentration of CO. It was previously reported that during the lockdown period in China, the concentration of CO was reduced by 18% [23]. These findings are very similar to our results. Another study reported by Hanaoka and Masui (2020) [19] revealed that due to the COVID-19 pandemic lockdown period, 25% and 6% reductions in CO concentrations were observed in China and globally, respectively. Meanwhile, during the nationwide lockdown phase in the USA, the concentration of CO was reduced by 1.1%, while in the megacity Delhi, India, compared with the pre-lockdown phase, CO decreased by 30.35% during the lockdown phase [23,51].
Moreover, our results demonstrate that compared to 2019 and using the same dates, the concentration of CO decreased by −20.43% during the lockdown phase, while compared with the previous three years and the same time frame, CO was reduced by up to −25.75%, which is greater than for 2019 in Nanjing. Chen et al. (2020b) [20] found that in many areas across China, the concentration of CO was reduced during the lockdown compared to the previous three years. Compared with the same period from 2016 to 2019, there was a decline in CO concentration of −18.6% during the lockdown in South China. During the lockdown phase, the CO concentration was at its lowest ratio compared to the previous 5 years, and the concentration of CO decreased by 14.5% [49]. Further, compared with the lockdown phase, CO showed an increasing trend of up to 13.51% after the lockdown, while in comparison to the previous three years, concentrations of CO decreased by an average of −15.72% in Nanjing. Overall, during the study period, Nanjing was found to experience a significant reduction in the concentration of CO, except after the lockdown phase.

3.7. Spatial Concentration Pattern of O3

In our study, analysis of the O3 concentration revealed that there was an increasing trend in the concentration of O3 during and after the lockdown phases in Nanjing. The average concentration of O3 and variations are shown in Figure 3 and Table 1, Table 2 and Table 3. O3 is a minor contaminant that is emitted from sunlight and nitrogen oxides (NOx), and volatile organic compounds (VOCs) [52]. During the lockdown phase, the concentration of O3 increased by 25.45% compared with the pre-lockdown phase, while compared with the pre- and during lockdown phases, O3 continuously increased by 72.10% in Nanjing. The increment ratio for the concentration of O3 was greater after the lockdown than during the lockdown due to the winter–summer transection. A similar observation was reported by Chen et al. (2020b) [20], who found that during the lockdown phase in China, the concentration of O3 increased. According to Islam et al. (2020) [39], O3 increased during the lockdown phase in Bangladesh, while Mahato et al. (2020) [51] found that O3 showed an increasing trend during the lockdown phase in Delhi, India.
Moreover, compared to 2019, the concentration of O3 increased by 26.03%. Compared with the previous three years, the O3 concentration increased by 10.61% in Nanjing. Chen et al. (2020b) [20] reported that there was a rising trend in O3 concentration during the lockdown phase in China. Further, compared with the lockdown phase, Nanjing experienced a remarkable increment in the concentration of O3 after the lockdown with an average increment of 54.64%, while in comparison with the previous three years, 2017–2019, for the same period, the concentration of O3 continuously increased by an average of 71.05% in Nanjing. This increment in O3 concentration was greater compared with the lockdown phase in 2020. A drastic change and notable improvement in air quality were observed due to the implementation of the lockdown amid the COVID-19 pandemic, except for O3 in Nanjing.

3.8. Correlation between Different Air Pollutants

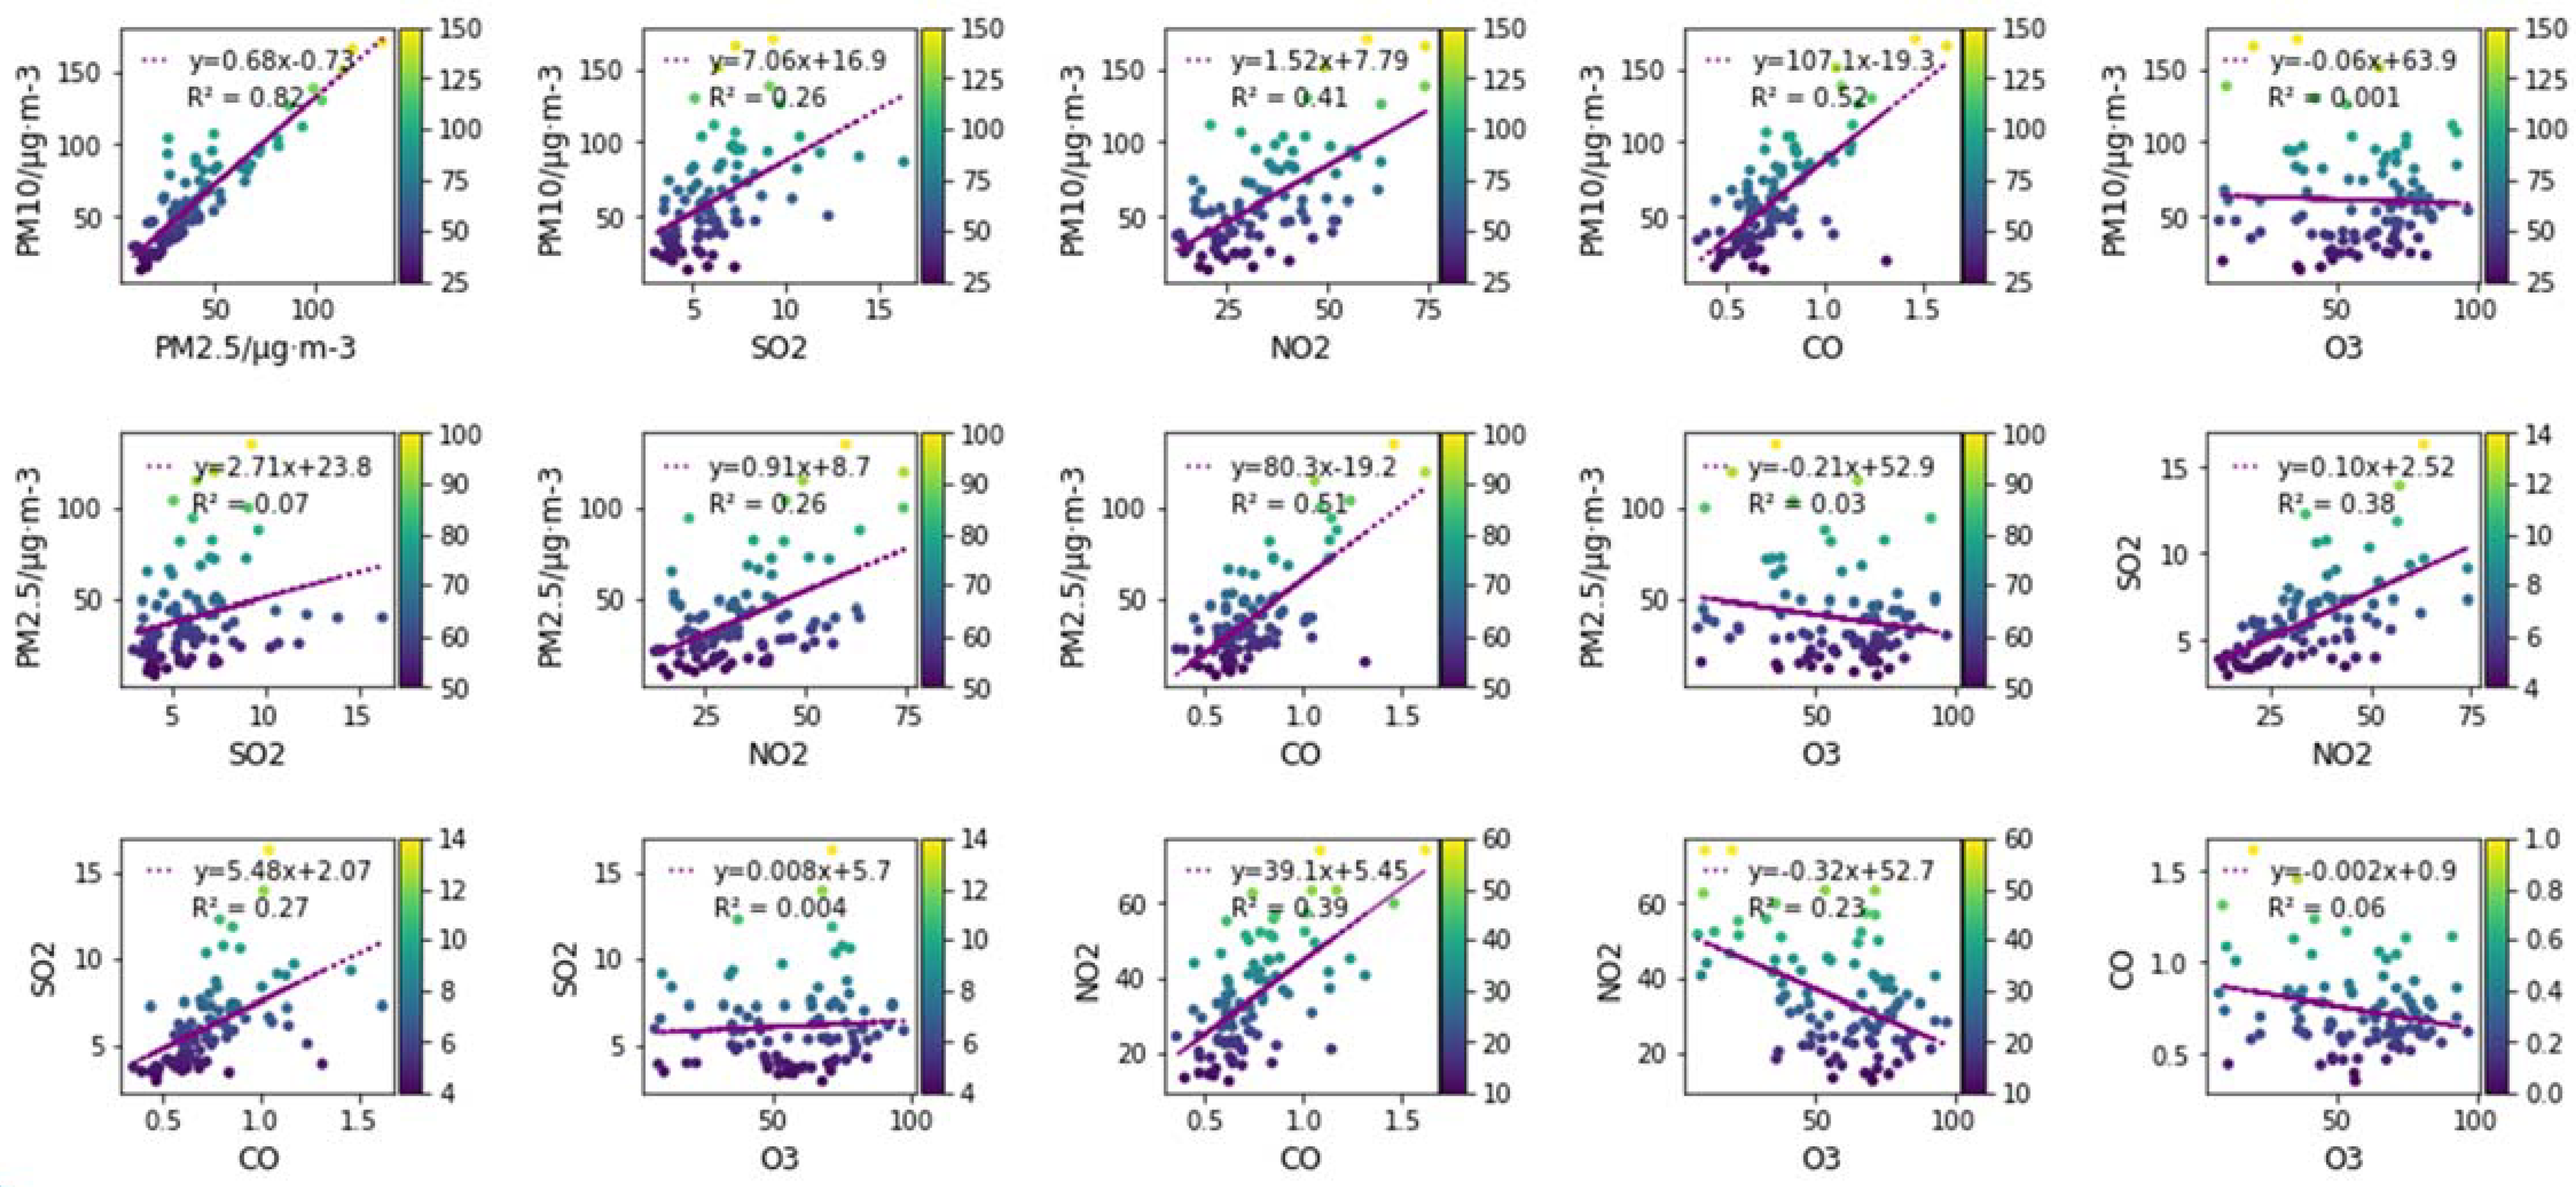
The correlations between different air pollutant concentrations during the lockdown period in Nanjing are shown in Figure 4. The daily (24 h) average concentrations of PM10 and PM2.5 were highly correlated (r = 0.82) with SO2 (r = 0.26). There was a significant positive correlation between PM10 and NO2 (r = 0.41). The strong correlation between PM10 and PM2.5 suggests that it was due to their mutual pollution sources: vehicular and industrial emissions. The correlation analysis indicated that there was a strong correlation between PM10 and CO during the lockdown phase in Nanjing (r = 0.52). PM2.5, SO2 (r = 0.07) and NO2 (r = 0.26) were highly correlated. This shows that PM2.5, SO2 and NO2 had a certain homology, while after the chemical reactions occurred in the atmosphere, SO2 and NO2 produced small particles. Combustion of fossil fuels contaminated with sulfur compounds result in the existence of SO2 in the atmosphere. The daily average concentrations of PM2.5 and CO were significantly correlated (r = 0.51) during the lockdown phase. Moreover, the (24 h) average concentration of SO2 was significantly correlated with the (24 h) average concentration of NO2 (r = 0.38) and CO (r = 0.27). The concentration of NO2 was strongly correlated with the CO concentration (r = 0.39) and O3 (r = 0.23). The positive correlation between NO2 and CO was due to the positive correlation between particulate matter (PM) and CO. It suggests that O3 levels increased with the reduction in the other pollutants, especially NO2 and CO.

4. Conclusions

The capital of Jiangsu Province, Nanjing, is known for its extreme and severe pollution levels, and it is considered one of the most polluted cities in China and internationally. The COVID-19 pandemic lockdown and shutdown policies in different parts of the world have provided a great opportunity to study the impact of humans on the environment. Therefore, the results of this study may help us to understand how responsible we are for our air pollution problems and how to mitigate them. In the current study, the impact of the nationwide lockdown that was imposed in order to curb the rapid spread of COVID-19 in China, on the air quality of the capital city of Jiangsu Province, Nanjing, was evaluated based on six air pollutants. The results show that there was a significant reduction in these pollutants, except for O3 during the lockdown phase in Nanjing. Compared to the previous three years (2017–2019), the concentrations of PM10 and PM2.5 were reduced by −37.99% and −33.56%, respectively, during the lockdown. Therefore, compared to the previous three years, PM10 and PM2.5 concentrations decreased by −43.58% and −54.57%, respectively, after the lockdown. Moreover, a significant reduction in other pollutants, such as SO2, NO2 and CO concentrations, were also observed during the lockdown phase. SO2 and CO showed a tendency to increase after the lockdown phase in Nanjing. During the lockdown, an approximately 25–35% improvement in air quality was observed. This study provides useful information and outcomes for future studies and creates a new paradigm for regulatory authorities and policymakers to create policies for the improvement of air pollution. Other studies, as discussed in Section 1, have mainly focused on either air quality assessment and monitoring over the last few years or the comparison between before and current air pollutants; however, our study performed three types of comparisons, i.e., before, after, and current trends as well as a comparison with data on air pollutants from the last 3 years. Another major advantage of this study is that it considered all of the pollutants, while other studies have focused on only a few pollutants. This helps in policy recommendations for government with regard to how trends in air quality are changing after COVID-19, and it helps air quality and monitoring stations to take the necessary steps if air quality does not improve. Furthermore, the outcomes of the current study will encourage the Chinese administration to deliberate on how to decrease industrial and vehicular contamination to reform and improve air quality, which will help to maintain better public health in China. The current study can be further extended to other regions and countries by finding new correlation factors between air pollutants and meteorological indicators.

Author Contributions

A.H. completed the analysis and wrote the manuscript with contributions from the co-author. Conceptualization, A.H., U.A.B. Data Curation, A.H., U.A.B., B.N. and G.W. Formal analysis, A.H. Writing—Original draft preparation, A.H. and U.A.B. Writing—Review and editing, A.H. Supervision, M.Z.H., Y.Z. and Y.S. Project Management, A.H., M.Z.H., Y.Z. and Y.S. All authors have read and agreed to the published version of the manuscript.

Funding

This research was supported by the Key Fund of National Natural Science Foundation of China (grant No. 41631175).

Institutional Review Board Statement

Not Applicable.

Informed Consent Statement

Not Applicable.

Data Availability Statement

Data are available after request.

Conflicts of Interest

The authors declare that they have no conflict of interest.

References

  1. Qu, Y.; Yang, B.; Lin, S.; Bloom, M.S.; Nie, Z.; Ou, Y.; Mai, J.; Wu, Y.; Gao, X.; Dong, G.; et al. Associations of greenness with gestational diabetes mellitus: The Guangdong Registry of Congenital Heart Disease (GRCHD) study. Environ. Pollut. 2020, 266, 115127. [Google Scholar] [CrossRef]
  2. Wang, Y.; Wang, Y.; Chen, Y.; Qin, Q. Unique epidemiological and clinical features of the emerging 2019 novel coronavirus pneumonia (COVID-19) implicate special control measures. J. Med. Virol. 2020, 92, 568–576. [Google Scholar] [CrossRef] [PubMed] [Green Version]
  3. Chen, K.; Wang, M.; Huang, C.; Kinney, P.L.; Anastas, P.T. Air pollution reduction and mortality benefit during the COVID-19 outbreak in China. Lancet Planet. Health 2020, 4, e210–e212. [Google Scholar] [CrossRef]
  4. World Health Organization. Coronavirus Disease (COVID-19) Situation report-202(EB/OL). Available online: https://www.who.int/docs/default-source/coronaviruse/situa-tion-reports/20200505covid-19-sitrep-106.pdf?sfvrsn¼47090f63_2 (accessed on 10 August 2020).
  5. Vellingiri, B.; Jayaramayya, K.; Iyer, M.; Narayanasamy, A.; Govindasamy, V.; Giridharan, B.; Ganesan, S.; Venugopal, A.; Venkatesan, D.; Ganesan, H.; et al. COVID-19: A promising cure for the global panic. Sci. Total Environ. 2020, 725, 138277. [Google Scholar] [CrossRef]
  6. Deng, S.-Q.; Peng, H.-J. Characteristics of and Public Health Responses to the Coronavirus Disease 2019 Outbreak in China. J. Clin. Med. 2020, 9, 575. [Google Scholar] [CrossRef] [Green Version]
  7. Freedman, A.; Tierney, L. The Silver Lining to Coronavirus Lockdowns: Air Quality is Improving. The Washington Post, 9 April 2020. Available online: https://www.washingtonpost.com/weather/2020/04/09/air-quality-improving-coronavirus/ (accessed on 9 April 2020).
  8. Singh, R.P.; Chauhan, A. Impact of lockdown on air quality in India during COVID-19 pandemic. Air Qual. Atmos. Health 2020, 13, 921–928. [Google Scholar] [CrossRef] [PubMed]
  9. Li, L.; Li, Q.; Huang, L.; Wang, Q.; Zhu, A.; Xu, J.; Liu, Z.; Li, H.; Shi, L.; Li, R.; et al. Air quality changes during the COVID-19 lockdown over the Yangtze River Delta Region: An insight into the impact of human activity pattern changes on air pollution variation. Sci. Total Environ. 2020, 732, 139282. [Google Scholar] [CrossRef] [PubMed]
  10. Bao, R.; Zhang, A. Does lockdown reduce air pollution? Evidence from 44 cities in northern China. Sci. Total Environ. 2020, 731, 139052. [Google Scholar] [CrossRef]
  11. Xu, H.; Yan, C.; Fu, Q.; Xiao, K.; Yu, Y.; Han, D.; Wang, W.; Cheng, J. Possible environmental effects on the spread of COVID-19 in China. Sci. Total Environ. 2020, 731, 139211. [Google Scholar] [CrossRef] [PubMed]
  12. Wang, Y.; Yuan, Y.; Wang, Q.; Liu, C.; Zhi, Q.; Cao, J. Changes in air quality related to the control of coronavirus in China: Implications for traffic and industrial emissions. Sci. Total Environ. 2020, 731, 139133. [Google Scholar] [CrossRef]
  13. Dutheil, F.; Baker, J.S.; Navel, V. COVID-19 as a factor influencing air pollution? Environ. Pollut. 2020, 263, 114466. [Google Scholar] [CrossRef] [PubMed]
  14. Brauer, M. How Much, How Long, What, and Where: Air Pollution Exposure Assessment for Epidemiologic Studies of Respiratory Disease. Proc. Am. Thorac. Soc. 2010, 7, 111–115. [Google Scholar] [CrossRef]
  15. Cohen, A.J.; Brauer, M.; Burnett, R.; Anderson, H.R.; Frostad, J.; Estep, K.; Balakrishnan, K.; Brunekreef, B.; Dandona, L.; Dandona, R.; et al. Estimates and 25-year trends of the global burden of disease attributable to ambient air pollution: An analysis of data from the Global Burden of Diseases Study 2015. Lancet 2017, 389, 1907–1918. [Google Scholar] [CrossRef] [Green Version]
  16. European Environment Agency. Communication from the Commission to the Council and the European Parliament—Thematic Strategy on Air Pollution; European Commission; (COM(2005) 0446 Final); European Environment Agency: København, Denmark, 2005.
  17. Gautam, S. COVID-19: Air pollution remains low as people stay at home. Air Qual. Atmosphere Health 2020, 13, 853–857. [Google Scholar] [CrossRef]
  18. Muhammad, S.; Long, X.; Salman, M. COVID-19 pandemic and environmental pollution: A blessing in disguise? Sci. Total Environ. 2020, 728, 138820. [Google Scholar] [CrossRef] [PubMed]
  19. Hanaoka, T.; Masui, T. Exploring effective short-lived climate pollutant mitigation scenarios by considering synergies and trade-offs of combinations of air pollutant measures and low carbon measures towards the level of the 2 °C target in Asia. Environ. Pollut. 2020, 261, 113650. [Google Scholar] [CrossRef]
  20. Chen, Q.-X.; Huang, C.-L.; Yuan, Y.; Tan, H.-P. Influence of COVID-19 Event on Air Quality and their Association in Mainland China. Aerosol Air Qual. Res. 2020, 20, 1541–1551. [Google Scholar] [CrossRef]
  21. NASA. Airborne Nitrogen Dioxide Plummets over China; NASA: Washington, DC, USA, 2020.
  22. Berman, J.D.; Ebisu, K. Changes in U.S. air pollution during the COVID-19 pandemic. Sci. Total Environ. 2020, 739, 139864. [Google Scholar] [CrossRef] [PubMed]
  23. Shakoor, A.; Chen, X.; Farooq, T.H.; Shahzad, U.; Ashraf, F.; Rehman, A.; Sahar, N.; Yan, W. Fluctuations in environ-mental pollutants and air quality during the lockdown in the USA and China: Two sides of COVID-19 pandemic. Air. Qual. Atmos. Health 2020. [Google Scholar] [CrossRef]
  24. Agarwal, A.; Kaushik, A.; Kumar, S.; Mishra, R.K. Comparative study on air quality status in Indian and Chinese cities before and during the COVID-19 lockdown period. Air Qual. Atmos. Health 2020, 13, 1167–1178. [Google Scholar] [CrossRef]
  25. Yue, X.; Lei, Y.D.; Zhou, H.; Liu, Z.; Cai, Z.; Lin, J.; Jiang, Z.; Liao, H. Changes of anthropogenic carbon emissions and air pollutants during the COVID-19 epidemic in China (in Chinese). Trans. Atmos. Sci. 2020, 43, 265–274. [Google Scholar]
  26. Rodríguez-Urrego, D.; Rodríguez-Urrego, L. Air quality during the COVID-19: PM2.5 analysis in the 50 most polluted capital cities in the world. Environ. Pollut. 2020, 266, 115042. [Google Scholar] [CrossRef]
  27. Zambrano-Monserrate, M.A.; Ruano, M.A. Has air quality improved in Ecuador during the COVID-19 pandemic? A parametric analysis. Air Qual. Atmos. Health 2020, 13, 929–938. [Google Scholar] [CrossRef] [PubMed]
  28. Le, T.; Wang, Y.; Liu, L.; Yang, J.; Yung, Y.L.; Li, G.; Seinfeld, J.H. Unexpected air pollution with marked emission reductions during the COVID-19 outbreak in China. Science 2020, 369, 702–706. [Google Scholar] [CrossRef]
  29. Zhang, R.; Zhang, Y.; Lin, H.; Feng, X.; Fu, T.-M.; Wang, Y. NOx Emission Reduction and Recovery during COVID-19 in East China. Atmosphere 2020, 11, 433. [Google Scholar] [CrossRef] [Green Version]
  30. Vîrghileanu, M.; Săvulescu, I.; Mihai, B.-A.; Nistor, C.; Dobre, R. Nitrogen Dioxide (NO2) Pollution monitoring with Sen-tinel-5P satellite imagery over Europe during the coronavirus pandemic outbreak. Remote Sens. 2020, 12, 3575. [Google Scholar] [CrossRef]
  31. Griffin, D.; McLinden, C.A.; Racine, J.; Moran, M.D.; Fioletov, V.; Pavlovic, R.; Mashayekhi, R.; Zhao, X.; Eskes, H. As-sessing the impact of corona-virus-19 on nitrogen dioxide levels over Southern Ontario, Canada. Remote Sens. 2020, 12, 4112. [Google Scholar] [CrossRef]
  32. Bauwens, M.; Compernolle, S.; Stavrakou, T.; Müller, J.-F.; van Gent, J.; Eskes, H.; Levelt, P.F.; Van Der, A.R.; Veefkind, J.P.; Vlietinck, J.; et al. Impact of coronavirus outbreak on NO2 pollution assessed using TROPOMI and OMI observa-tions. Res. Lett. 2020, 47, e2020GL087978. [Google Scholar] [CrossRef] [PubMed]
  33. Lorente, A.; Boersma, K.F.; Eskes, H.J.; Veefkind, J.P.; Van Geffen, J.H.G.M.; De Zeeuw, M.B.; Van Der Gon, H.A.C.D.; Beirle, S.; Krol, M.C. Quantification of nitrogen oxides emissions from build-up of pollution over Paris with TROPO-MI. Sci. Rep. 2019, 9, 20033. [Google Scholar] [CrossRef] [PubMed]
  34. Solberg, S.; Walker, S.-E.; Schneider, P.; Guerreiro, C. Quantifying the Impact of the Covid-19 Lockdown Measures on Nitrogen Dioxide Levels throughout Europe. Atmosphere 2021, 12, 131. [Google Scholar] [CrossRef]
  35. Wang, Z.; Uno, I.; Yumimoto, K.; Itahashi, S.; Chen, X.; Yang, W.; Wang, Z. Impacts of COVID-19 lockdown, spring fes-tival and meteorology on the NO2variations in early 2020 over China based on in-situ observations, satellite retrievals and model simulations. Atmos. Environ. 2021, 244, 117972. [Google Scholar] [CrossRef] [PubMed]
  36. Goldberg, D.L.; Anenberg, S.C.; Griffin, D.; McLinden, C.A.; Lu, Z.; Streets, D. Disentangling the impact of the COVID-19 lockdowns on urban NO 2 from natural variability. Geophys. Res. Lett. 2020, 47, 47. [Google Scholar] [CrossRef] [PubMed]
  37. Li, W.; Thomas, R.; El-Askary, H.; Piechota, T.; Struppa, D.; Ghaffar, K.A.A. Investigating the Significance of Aerosols in Determining the Coronavirus Fatality Rate Among Three European Countries. Earth Syst. Environ. 2020, 4, 513–522. [Google Scholar] [CrossRef]
  38. Kumar, P.; Hama, S.; Omidvarborna, H.; Sharma, A.; Sahani, J.; Abhijith, K.V.; Debele, S.E.; Zavala-Reyes, J.C.; Bar-wise, Y.; Tiwari, A. Temporary reduction in fine particulate matter due to ‘anthropogenic emissions switch-o’ during COVID-19 lockdown in Indian cities. Sustain. Cities Soc. 2020, 62, 102382. [Google Scholar] [CrossRef]
  39. Islam, S.; Tusher, T.R.; Roy, S.; Rahman, M. Impacts of nationwide lockdown due to COVID-19 outbreak on air quality in Bangladesh: A spatiotemporal analysis. Air Qual. Atmos. Health 2021, 14, 351–363. [Google Scholar] [CrossRef]
  40. Li, L.; Chen, C.H.; Fu, J.S.; Huang, C.; Streets, D.; Huang, H.Y.; Zhang, G.F.; Wang, Y.J.; Jang, C.J.; Wang, H.L.; et al. Air quality and emissions in the Yangtze River Delta, China. Atmos. Chem. Phys. Discuss. 2011, 11, 1621–1639. [Google Scholar] [CrossRef] [Green Version]
  41. Zu, Y.; Hu, J.; Chen, M.; Huang, L.; Zhao, Z.; Liu, H.; Zhang, H.; Ying, Q. Investigation of relationships between meteorological conditions and high PM10 pollution in a megacity in the western Yangtze River Delta, China. Air Qual. Atmos. Health 2017, 5, 383–724. [Google Scholar] [CrossRef]
  42. Nanjing Municipal Government. Available online: http://www.nanjing.gov.cn (accessed on 21 December 2018).
  43. Singh, V.; Sahu, S.K.; Kesarkar, A.P.; Biswal, A. Estimation of high resolution emissions from road transport sector in a megacity Delhi. Urban Clim. 2018, 26, 109–120. [Google Scholar] [CrossRef]
  44. Lu, Z.; Streets, D.G.; Foy, D.B.; Krotkov, N.A. Ozone Monitoring Instrument observations of interannual increases in SO2 emissions from Indian coal-fired power plants during 2005-2012. Environ. Sci. Technol. 2013, 47, 13993–14000. [Google Scholar] [CrossRef] [PubMed]
  45. Lu, X.; Zhang, L.; Liu, X.; Gao, M.; Zhao, Y.; Shao, J. Lower tropospheric ozone over India and its linkage to the South Asian monsoon. Atmos. Chem. Phys. Discuss. 2018, 18, 3101–3118. [Google Scholar] [CrossRef] [Green Version]
  46. Marinello, S.; Lolli, F.; Gamberini, R. Roadway tunnels: A critical review of air pollutant concentrations and vehicular emissions. Transp. Res. Part D Transp. Environ. 2020, 86, 102478. [Google Scholar] [CrossRef]
  47. Hu, M.; Chen, Z.; Cui, H.; Wang, T.; Zhang, C.; Yun, K. Air pollution and critical air pollutant assessment during and after COVID-19 lockdowns: Evidence from pandemic hotspots in China, the Republic of Korea, Japan, and India. Atmos. Pollut. Res. 2021, 12, 316–329. [Google Scholar] [CrossRef]
  48. Liu, M.; Huang, Y.; Ma, Z.; Jin, Z.; Liu, X.; Wang, H.; Liu, Y.; Wang, J.; Jantunen, M.; Bi, J.; et al. Spatial and temporal trends in the mortality burden of air pollution in China: 2004–2012. Environ. Int. 2017, 98, 75–81. [Google Scholar] [CrossRef] [PubMed] [Green Version]
  49. Fu, S.; Guo, M.; Fan, L.; Deng, Q.; Han, D.; Wei, Y.; Luo, J.; Qin, G.; Cheng, J. Ozone pollution mitigation in guangxi (south China) driven by meteorology and anthropogenic emissions during the COVID-19 lockdown. Environ. Pollut. 2021, 272, 115927. [Google Scholar] [CrossRef] [PubMed]
  50. Holloway, T.; Levy, H.; Kasibhatla, P. Global distribution of carbon monoxide. J. Geophys. Res. Space Phys. 2000, 105, 12123–12147. [Google Scholar] [CrossRef]
  51. Mahato, S.; Pal, S.; Ghosh, K.G. Effect of lockdown amid COVID-19 pandemic on air quality of the megacity Delhi, India. Sci. Total Environ. 2020, 730, 139086. [Google Scholar] [CrossRef]
  52. Lal, S.; Naja, M.; Subbaraya, B. Seasonal variations in surface ozone and its precursors over an urban site in India. Atmos. Environ. 2000, 34, 2713–2724. [Google Scholar] [CrossRef]
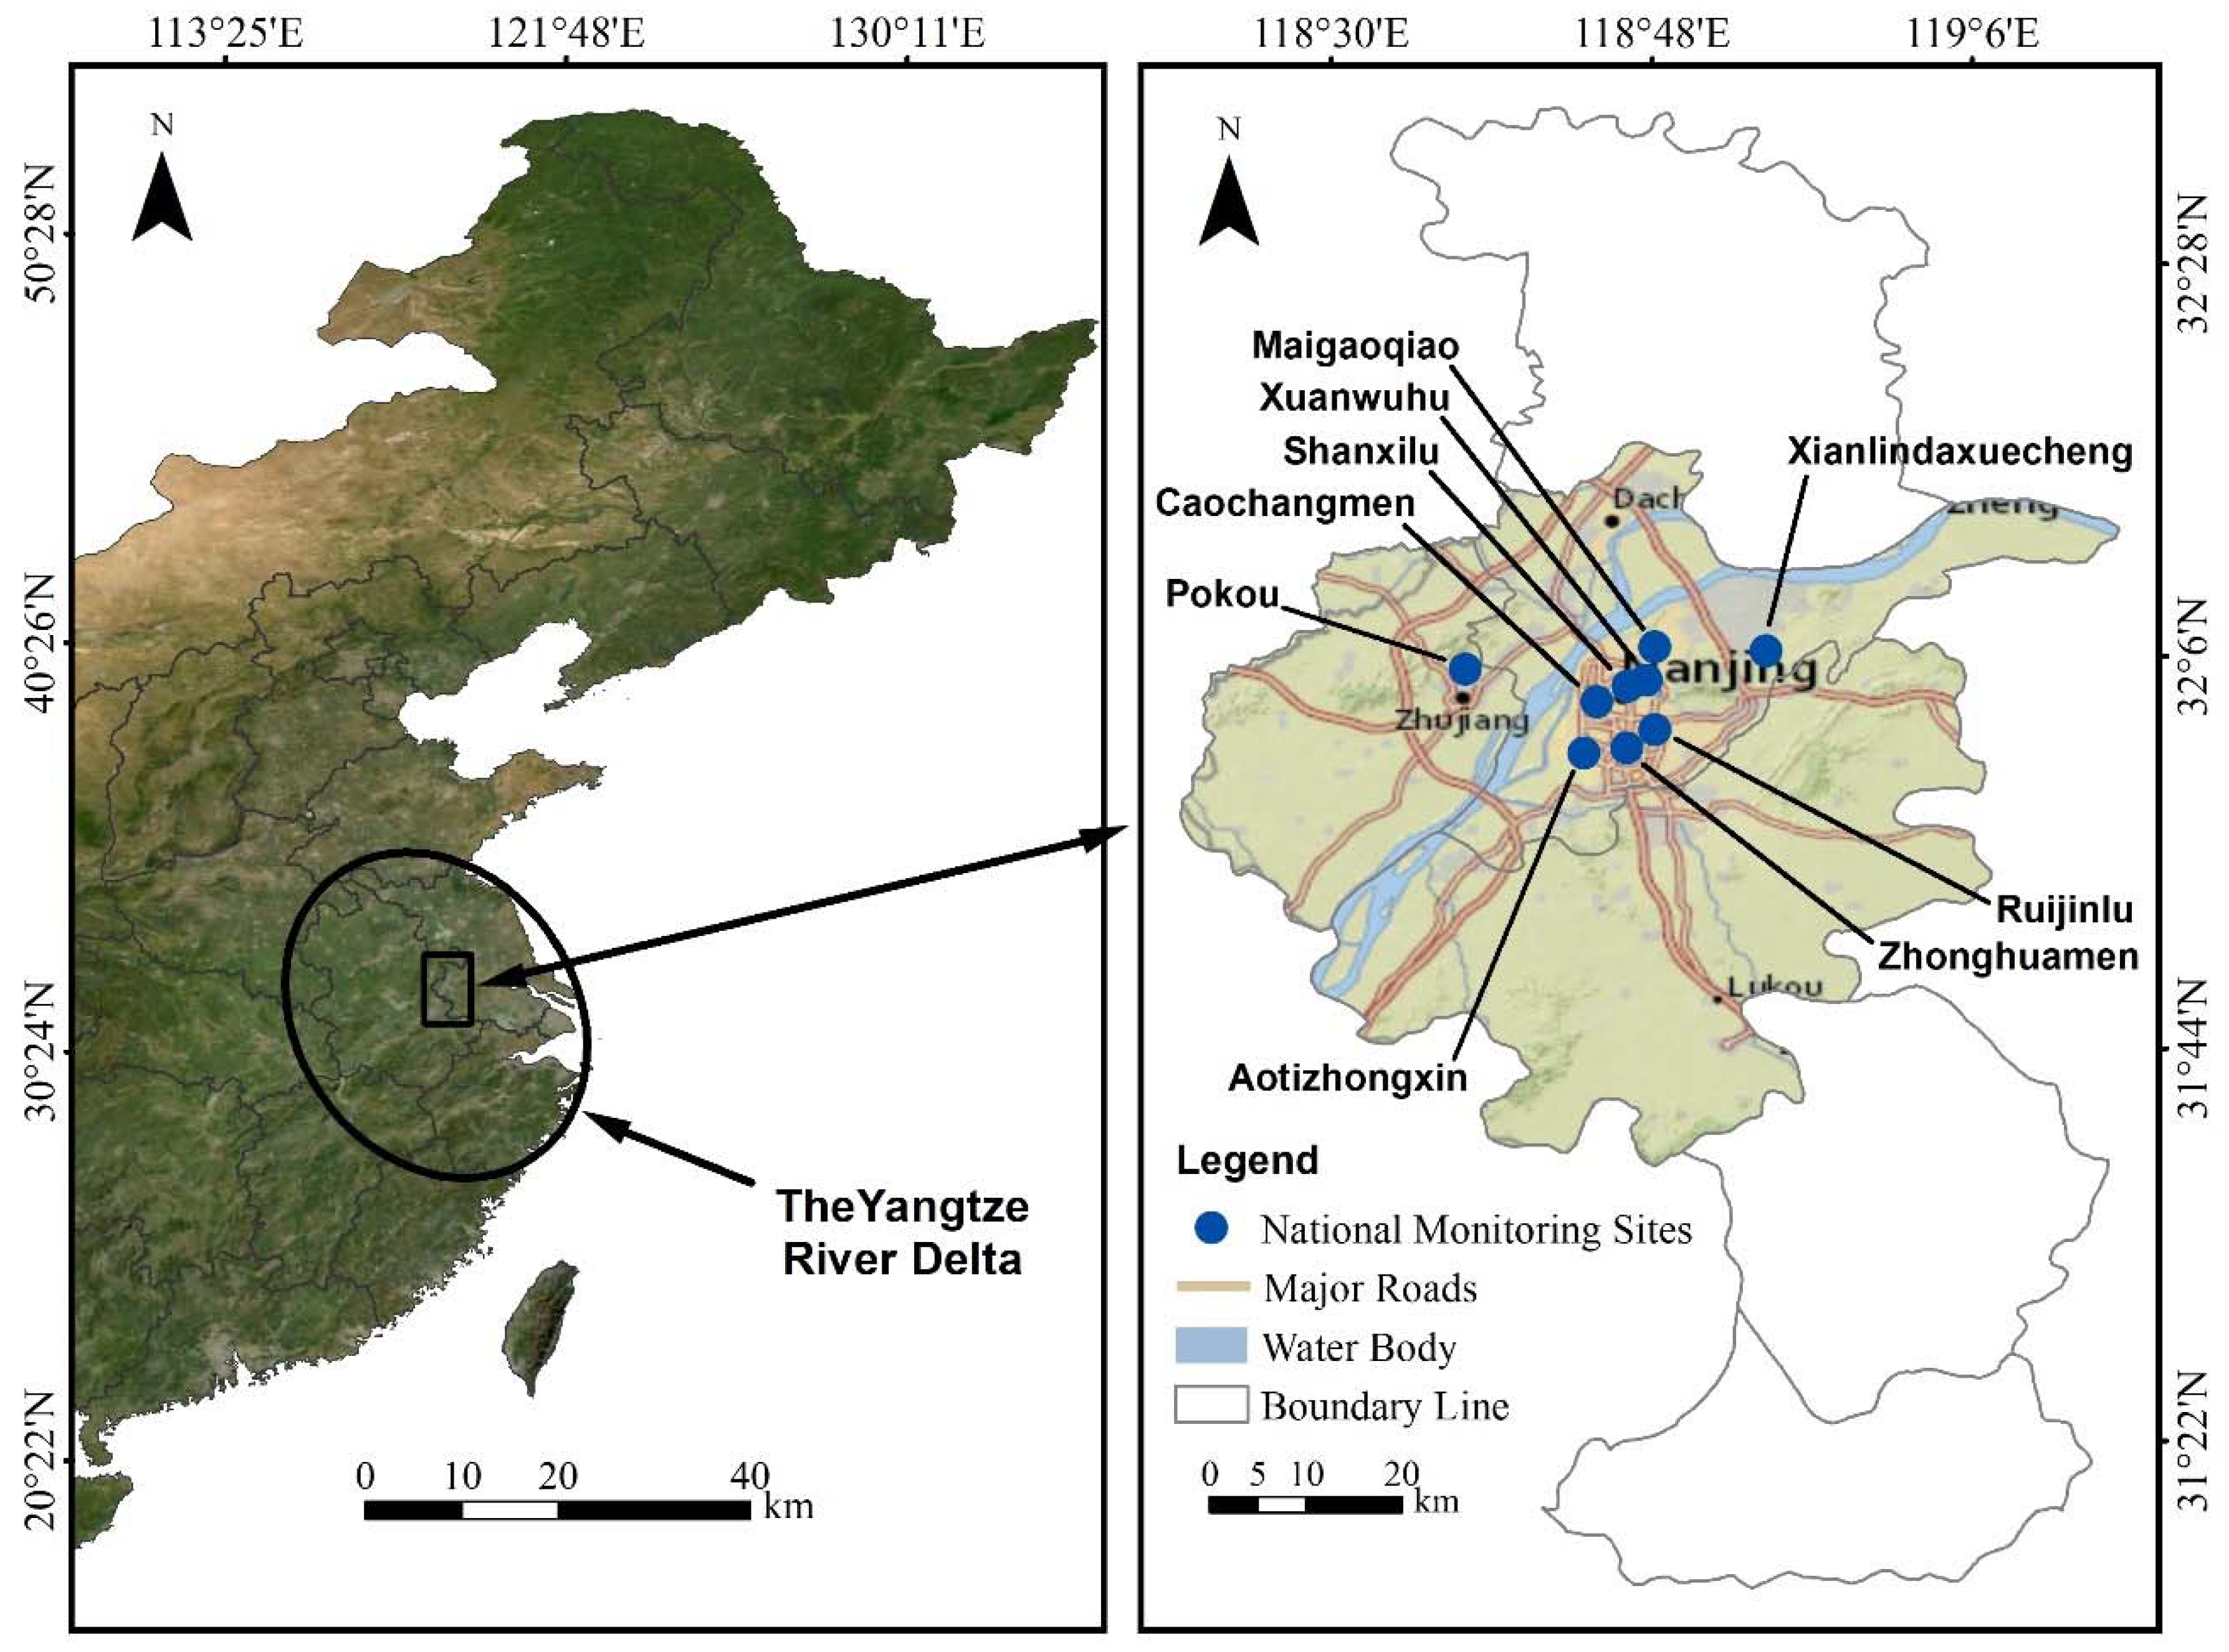
Figure 1. The geographical location and the air pollution monitoring stations in Nanjing.
Atmosphere 12 00743 g001
Figure 2. Temporal evolution of 24 h average concentrations of PM10, PM2.5, SO2, NO2, CO, and O3 before, during and after the lockdown periods.
Atmosphere 12 00743 g002
Figure 3. Daily average concentrations of PM10, PM2.5, SO2, NO2, CO and O3 in 2017, 2018, 2019, before, during and after lockdown.
Atmosphere 12 00743 g003
Figure 4. Correlation between different air pollutants.
Atmosphere 12 00743 g004
Table 1. 24 h average concentration and variation of pollutants before, during and after lockdown in Nanjing. (Bold values show average maximum decrease).
Pollutantsbefore Lockdownduring LockdownAvg. before and during Lockdownafter LockdownVariation (during and before Lockdown)Variation (after Lockdown and Avg. of before and during Lockdown)
Net%Net%
PM10
Maximum355.76170.79263.28111.45−184.97−51.99−151.83−57.67
Average83.4760.3471.9154.9−23.13−27.71−17.01−23.65
Minimum30.4313.2221.8315.4−17.21−56.56−6.43−29.44
PM2.5
Maximum107.18134.64120.9147.5827.4625.62−73.33−60.65
Average42.6440.4741.5627.67−2.17−5.09−13.89−33.41
Minimum10.968.959.967.61−2.01−18.34−2.35−23.56
SO2
Maximum20.2816.3018.2916.11−3.98−19.63−2.18−11.92
Average9.156.147.658.1−3.01−32.900.465.95
Minimum3.662.993.333.89−0.67−18.310.5716.99
NO2
Maximum103.2374.3488.7961.92−28.89−27.99−26.87−30.26
Average52.8634.5443.7033.78−18.32−34.66−9.92−22.70
Minimum13.5612.5213.0412.55−1.04−7.67−0.49−3.76
CO
Maximum1.581.611.601.270.031.90−0.33−20.38
Average0.890.740.820.84−0.15−16.850.033.07
Minimum0.400.350.380.59−0.05−12.500.2257.33
O3
Maximum115.2897.05106.17165.61−18.23−15.8159.4555.99
Average45.9757.6751.8289.1811.725.4537.3672.10
Minimum5.728.026.8732.552.340.2125.68373.80
Table 2. 24 h average concentration and variation of pollutants during 2017–2020 (same dates of lockdown) in Nanjing. (Bold values show average maximum decrease).
Pollutants201720182019Avg. of 2017–20192020Variation
(2020 and 2019)
Variation
(2020 and Avg. of 2017–2019)
Net%Net%
PM10
Maximum237.96304.96194.38245.77170.79−23.59−12.14−74.98−30.51
Average93.57102.7595.6297.3160.34−35.28−36.90−36.97−37.99
Minimum27.0516.3525.6023.0013.22−12.38−48.36−9.78−42.52
PM2.5
Maximum159.87217.46150.48175.94134.64−15.84−10.53−41.30−23.47
Average55.3065.3662.0860.9140.47−21.61−34.81−20.44−33.56
Minimum15.1611.9915.2714.148.95−6.32−41.39−5.19−36.70
SO2
Maximum36.6228.9420.9328.8316.30−4.63−22.12−12.53−43.46
Average19.2413.3910.9214.526.14−4.78−43.77−8.38−57.70
Minimum9.025.274.606.302.99−1.61−35.00−3.31−52.51
NO2
Maximum114.33109.8191.51105.2274.34−17.17−18.76−30.88−29.35
Average52.5753.1747.5551.1034.54−13.01−27.36−16.56−32.40
Minimum16.5321.3314.6617.5112.52−2.14−14.60−4.99−28.48
CO
Maximum2.261.971.551.931.610.063.87−0.32−16.44
Average1.170.890.931.000.74−0.19−20.43−0.26−25.75
Minimum0.630.440.370.480.35−0.02−5.41−0.13−27.08
O3
Maximum110.1283.4687.2793.6297.059.7811.213.433.67
Average60.1550.5045.7652.1457.6711.9126.035.5310.61
Minimum18.0011.546.4411.998.021.5824.53−3.97−33.13
Table 3. 24 h average concentration and variation of pollutants for the periods of 2017–2020 to after lockdown in Nanjing. (Bold values show average maximum decrease).
Pollutants201720182019Avg. of 2017–2019during Lockdown (2020)after LockdownVariation (after and during Lockdown)Variation (after lockdown and Avg. of 2017–2019)
Net%Net%
PM10
Maximum237.96304.96194.38245.77170.79111.45−59.34−34.74−134.32−54.65
Average93.57102.7595.6297.3160.3454.9−5.44−9.02−42.41−43.58
Minimum27.0516.3525.6023.0013.2215.42.1816.49−7.60−33.04
PM2.5
Maximum159.87217.46150.48175.94134.6447.58−87.06−64.66−128.36−72.96
Average55.3065.3662.0860.9140.4727.67−12.8−31.63−33.24−54.57
Minimum15.1611.9915.2714.148.957.61−1.34−14.97−6.53−46.18
SO2
Maximum36.6228.9420.9328.8316.3016.11−0.19−1.17−12.72−44.12
Average19.2413.3910.9214.526.148.11.9631.92−6.42−44.20
Minimum9.025.274.606.302.993.890.930.10−2.41−38.22
NO2
Maximum114.33109.8191.51105.2274.3461.92−12.42−16.71−43.30−41.15
Average52.5753.1747.5551.1034.5433.78−0.76−2.20−17.32−33.89
Minimum16.5321.3314.6617.5112.5212.550.030.24−4.96−28.31
CO
Maximum2.261.971.551.931.611.27−0.34−21.12−0.66−34.08
Average1.170.890.931.000.740.840.113.51−0.16−15.72
Minimum0.630.440.370.480.350.590.2468.570.1122.92
O3
Maximum110.1283.4687.2793.6297.05165.6168.5670.6471.9976.90
Average60.1550.5045.7652.1457.6789.1831.5154.6437.0471.05
Minimum18.0011.546.4411.998.0232.5524.53305.8620.56171.40
Publisher’s Note: MDPI stays neutral with regard to jurisdictional claims in published maps and institutional affiliations.