Abstract
Due to their major role in atmospheric chemistry and secondary pollutant formation such as ozone or secondary organic aerosols, an accurate representation of OH and HO2 (HOX) radicals in air quality models is essential. Air quality models use simplified mechanisms to represent atmospheric chemistry and interactions between HOX and organic compounds. In this work, HOX concentrations during the oxidation of toluene and xylene within the Regional Atmospheric Chemistry Mechanism (RACM2) are improved using a deterministic–near-explicit mechanism based on the Master Chemical Mechanism (MCM) and the generator of explicit chemistry and kinetics of organics in the atmosphere (GECKO-A). Flow tube toluene oxidation experiments are first simulated with RACM2 and MCM/GECKO-A. RACM2, which is a simplified mechanism, is then modified to better reproduce the HOX concentration evolution simulated by MCM/GECKO-A. In total, 12 reactions of the oxidation mechanism of toluene and xylene are updated, making OH simulated by RACM2 up to 70% more comparable to the comprehensive MCM/GECKO-A model for chamber oxidation simulations.
1. Introduction
OH and HO2 (HOX) radicals play a major role in the formation of secondary atmospheric pollutants such as ozone or secondary organic aerosols (SOAs) in outdoor air (e.g., [1]) and indoor air (e.g., [2]). OH is the main atmospheric oxidant, determining the lifetime of volatile organic compounds (VOCs). Peroxy radicals (RO2) formed by (nonradical) VOC oxidation mainly react with HO2 or NO. HOX concentrations, therefore, influence both the kinetics and the oxidation reaction pathways of VOCs. Conversely, because HOX are formed from reactions involving VOCs and NOX (NO and NO2), the VOC distribution influences the HOX concentrations. The efficiency of mitigation strategies for VOC emissions in secondary pollutant formation is therefore dependent on HOX concentrations. A good understanding of these interactions and an accurate representation in 3D air quality models are essential for ozone and secondary aerosol forecasting or estimation of emission mitigation strategies’ efficiency.
The atmospheric oxidation of VOCs involves millions of different compounds. This chemistry can be represented in detail in so-called deterministic or near-explicit chemical mechanisms such as the Master Chemical Mechanism (MCM, [3,4]) or those generated by the generator of explicit chemistry and kinetics of organics in the atmosphere (GECKO-A, [5]). The high number of VOCs represented in these mechanisms leads to high computational costs, limiting their use in box or 0D models. To be used in 3D air quality models, this chemistry must be simplified, with a limited number of compounds (a few hundred compounds at most). A common simplification method is the grouping of compounds according to their characteristics, such as the types of carbon bonds in the CB05 mechanism [6] or the OH kinetics in MELCHIOR2 [7] and RACM2 [8] mechanisms.
These simplified mechanisms were first designed focusing on reproducing the evolution of ozone concentrations. However, in response to changing regulations and the need to represent particulate matter and SOA, they have subsequently been modified by adding chemical reactions to describe the SOA formation (e.g., [9,10,11,12,13,14,15]). HOX concentrations often remain determined by the original mechanism only. The addition of SOA formation and its dependence on HOX concentrations makes accurate representation of HOX by simplified mechanisms all the more crucial [16]. Although a recent evaluation of RACM2 compared with the deterministic model MCM showed that RACM2 does fairly well in representing OH concentration during a polluted episode with a mix of pollutants characteristic of urban pollution [17], the comparison of different simplified chemical mechanisms shows remarkable differences in the estimation of HOX radicals during VOC oxidation [9,18], especially under low NOX conditions [19].
Toluene and xylene are among the most abundant aromatic compounds formed by fossil fuel combustion processes. Their oxidation can lead to the formation of secondary VOCs, such as methylglyoxal and benzaldehyde, and anthropogenic SOA. They are therefore compounds of interest for air quality, and their degradation is represented in most simplified chemical mechanisms.
This study aims at evaluating and improving the modeling of the HOX radicals formed during toluene and xylene oxidations in the RACM2 simplified mechanism. First, toluene oxidation experiments are used as a reference and to adjust the initial conditions of simulations run using a deterministic mechanism that combines MCM and GECKO-A. Then, those deterministic simulations are used as a reference for improving the HOX representation during toluene and xylene oxidations with the RACM2 simplified chemical mechanism.
2. Presentation of the Experiments and Deterministic Simulations
This work is based primarily on six toluene oxidation experiments reproduced using a deterministic chemical mechanism.
The experiments were carried out in a cylindrical aerosol flow tube (AFT) made of Pyrex (12 cm in diameter and 152 cm in length) at atmospheric pressure. The AFT was surrounded by 7 UV lamps to activate the chemistry. The temperature (T) and relative humidity (RH) were controlled and constant during the experiments (T ranged from 7 to 22 °C, RH from 24% to 50%). The residence time in the AFT was estimated to be at 13 min. The losses at the walls of gaseous toluene in the AFT were evaluated to be between 1% at 22 °C and 5% at 7 °C. To generate OH radicals, isopropyl nitrite (IPN) was injected into the AFT along with toluene. Photolysis of IPN led to the formation of NO, HO2, and acetone. OH radicals were then formed by the NO + HO2 reaction. The advantage of using IPN as an OH precursor is that the acetone also formed is very poorly reactive towards OH radical and does not significantly interfere with its concentration evolution. The IPN injection fluxes were not evaluated precisely, but the average OH concentrations were estimated experimentally by measuring the inlet and outlet concentrations of toluene using a proton transfer reaction mass spectrometer (PTR-ToF-MS Ionicon 8000).
As the results of the six experiments were similar, only one is presented in detail here. During this reference experiment, 112 ppb of toluene was injected into the AFT at a temperature of 7 °C and an RH of 24%. An amount of 63 ppb of toluene was measured at the outlet.
A deterministic chemical mechanism was used to model the toluene oxidation experiment. IPN initial concentration was constrained in order to reproduce experimental toluene degradation. Computing the OH concentrations with a model has several advantages, compared with a simple calculation of the average OH concentration between the initial and final measured concentrations of toluene: (1) it takes into account the consumption of OH due to reactivity with secondary species, (2) it offers an estimate of the HO2 and NOX concentrations, and (3) it gives the temporal variations of these concentrations during the 13 min of oxidation. The deterministic chemical mechanism used here was generated by GECKO-A [5] with updates (see La et al. [20] for more details) for nonaromatic secondary species and used MCM (v3.3.1) to describe the chemistry of species, including an aromatic structure [3,4]. The MCM/GECKO-A mechanism was limited to the six first generations of stable products and included about 2200 species and 13,500 reactions.
Five reactions were added to the MCM/GECKO-A mechanism to represent the chemistry of IPN (Table 1). The kinetics of the IPN2 and IPN5 reactions were from Raff and Finlayson-Pitts [21], and that of the IPN3 and IPN4 reactions were from Fittschen et al. [22]. The formation of OH then took place via the NO + HO2 reaction already included in the mechanism. All the photolysis constants of the chemical mechanism were recalculated and adapted to the irradiation of the lamps of the experiment. The photolysis constant of IPN was recalculated based on the absorption spectrum provided by Raff and Finlayson-Pitts [21], considering a quantum yield of 1.
Table 1.
IPN chemical reactions.
An additional reaction representing the heterogeneous reaction of NO2 on the walls of the AFT was also added (e.g., [23]; see Table 2). The kinetics of this heterogeneous reaction was calculated according to the method described by Fiorentino et al. [24], which integrates impaction and reaction and takes into account the area and volume of the AFT. The uptake coefficient of NO2 was fixed to 10−5 (in the (10−6;10−3) range recommended by Jacob, 2000) to obtain a simulated distribution of the mass charge ratio (m/z) of the formed compound closest to the experimental data, especially for the concentration of hydroperoxides (formed by reaction of RO2 with HO2) and organic nitrates formed in the presence of NOX.
Table 2.
NO2 heterogeneous reaction on flow tube walls.
The completed chemical mechanism was implemented in a box model. For the oxidation, time integration was solved using the two-step solver [25,26]. A residence time of 13 min in the AFT was taken as the simulation time. The initial toluene concentration of the simulation was the one measured at the inlet (introduced flow) of the AFT (112 ppb). The final simulated concentration was compared with the outlet (outgoing flow) of the AFT. Because the initial IPN concentration was not measured during the experiment, it was adjusted in the model in order to reproduce the final concentration of toluene (63 ppb), and an initial concentration of 120 ppb was chosen.
3. Modification of Toluene and Xylene Chemistry in RACM2
The simplified RACM2 mechanism [8], as implemented in the SSH-aerosol box model [27], was selected to reproduce the experiments and to be compared with the deterministic mechanism. The chemistry of IPN (Table 1) and the heterogeneous reaction of NO2 on the walls of the AFT (Table 2) were added to RACM2 to make a comparison with the MCM/GECKO-A simulations.
Comparisons showed a higher OH concentration and, therefore, greater toluene degradation with RACM2 than with MCM/GECKO-A despite identical gaseous inorganic chemistry and conditions. 
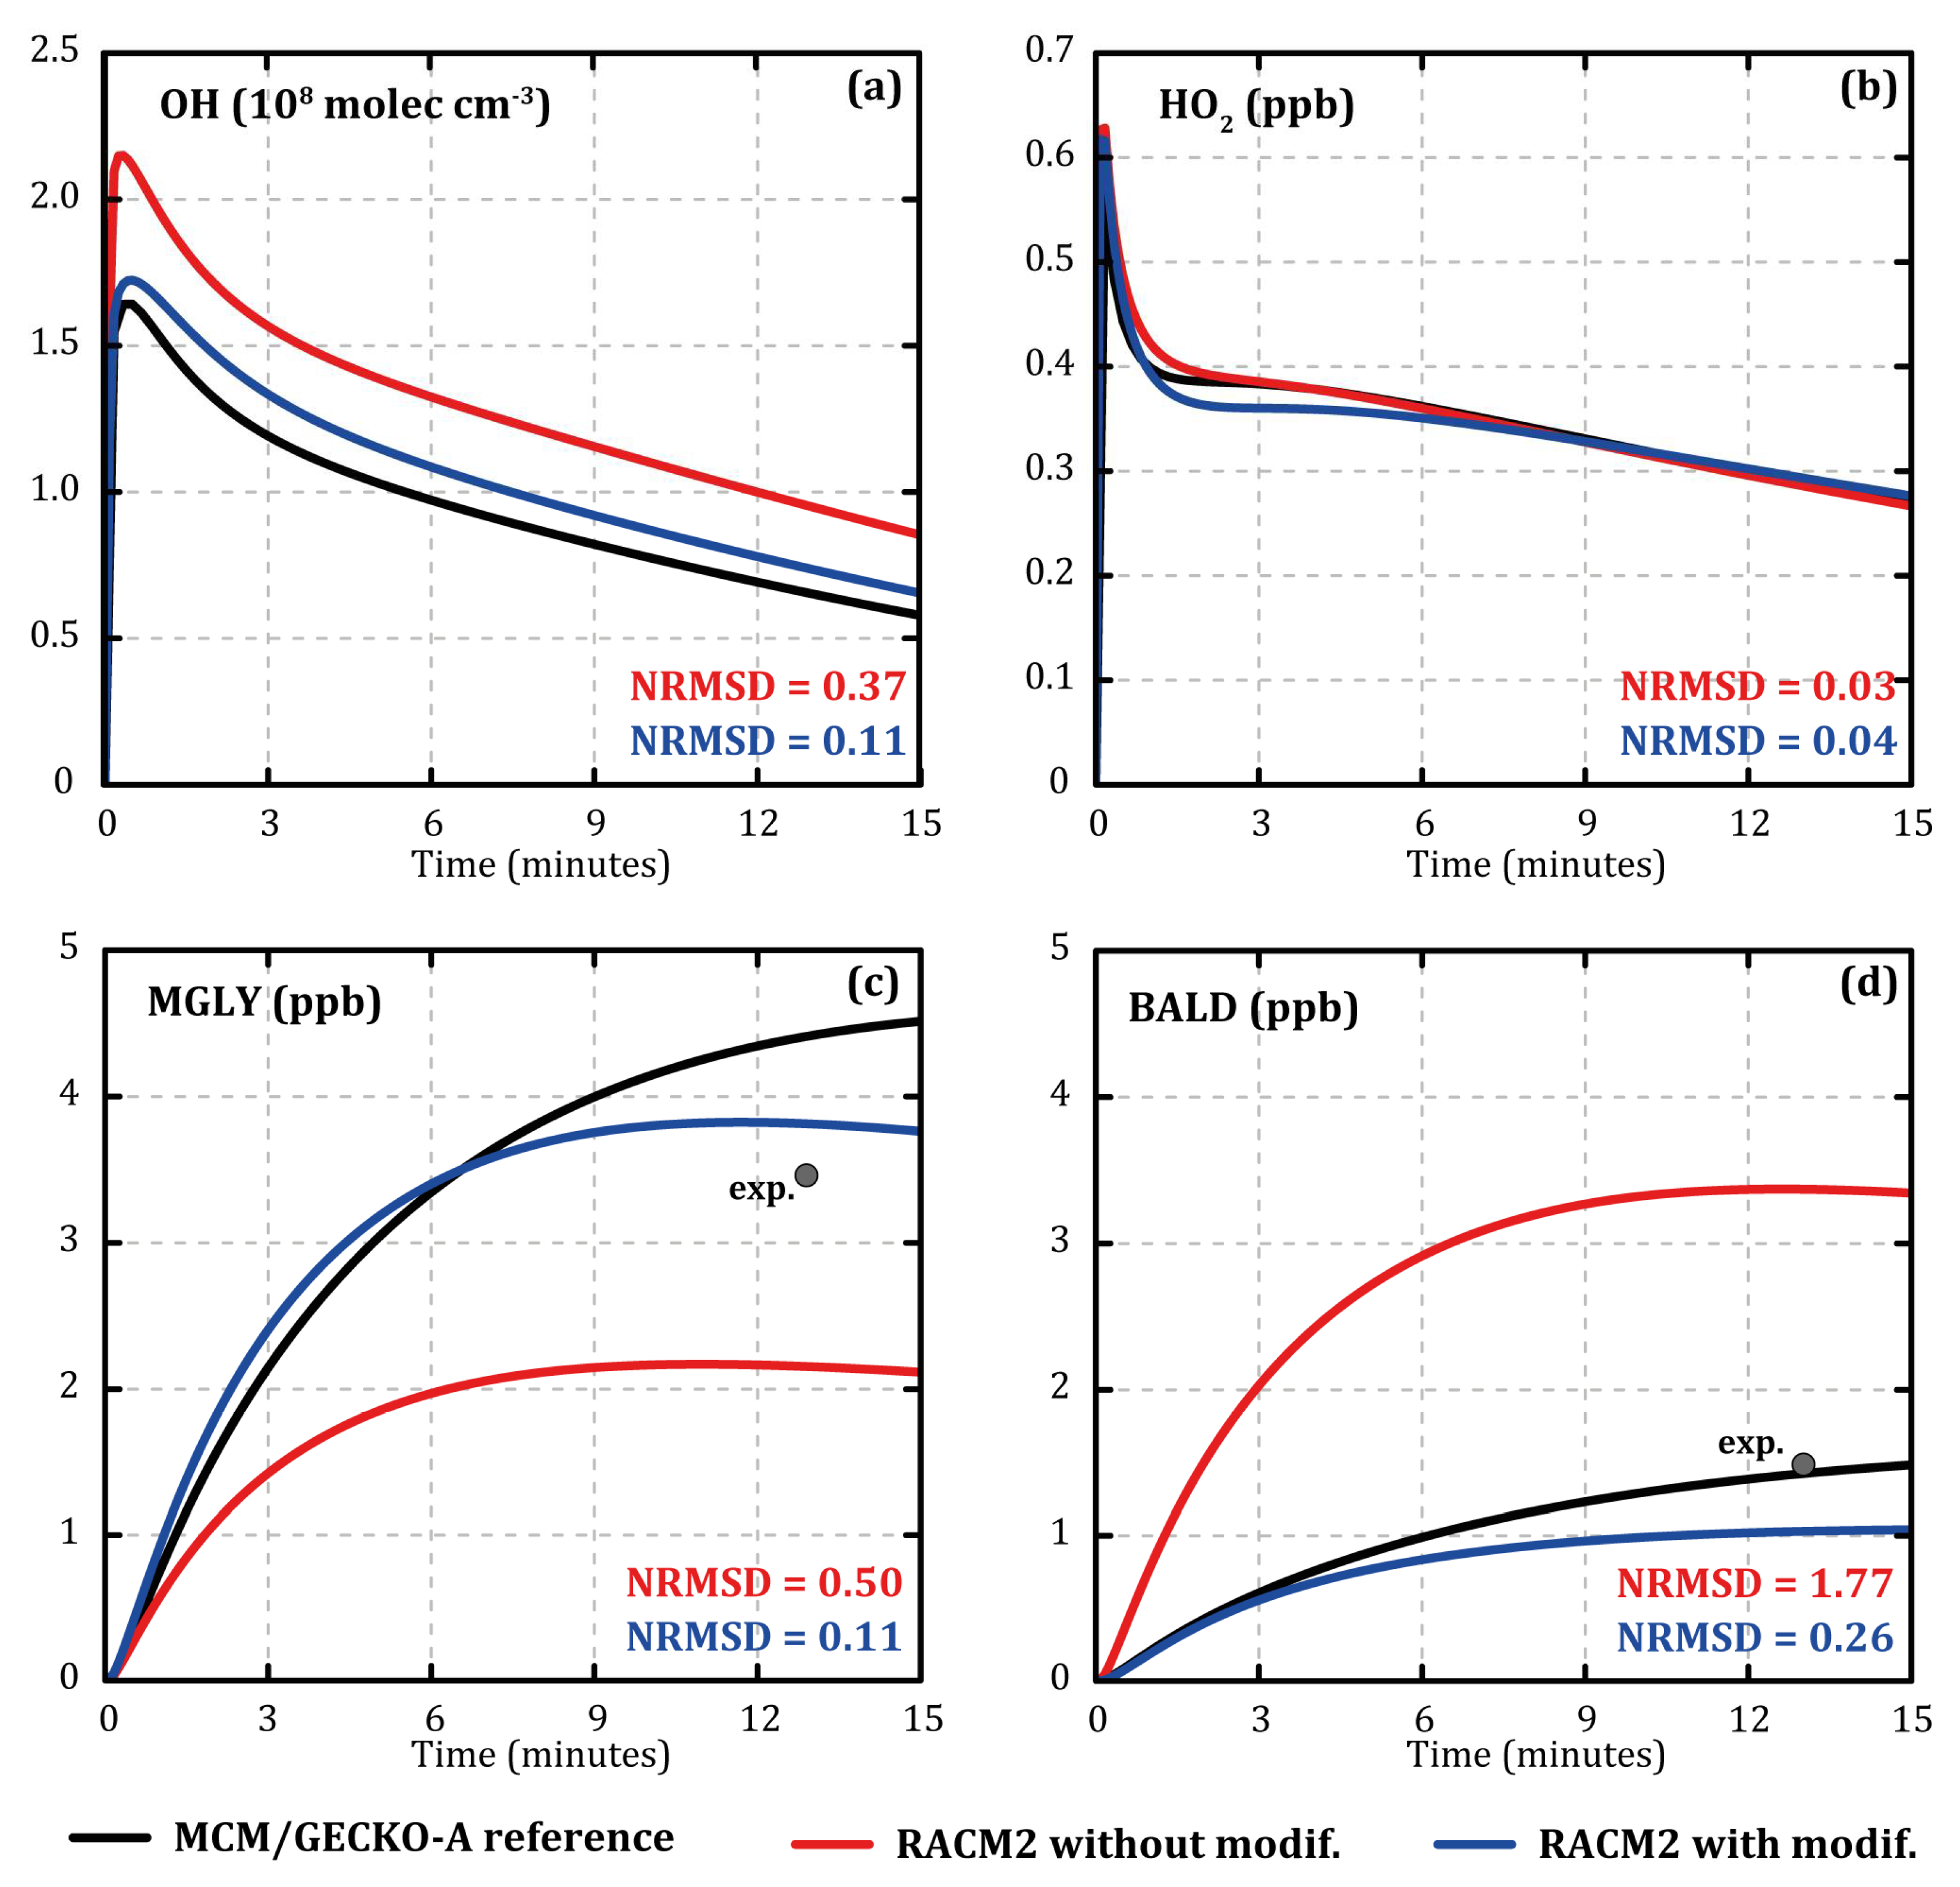
Figure 1 shows the evolution of the concentrations of OH (Figure 1a), HO2 (Figure 1b), methylglyoxal (MGLY, Figure 1c), and aromatic aldehydes (BALD, Figure 1d) during the MCM/GECKO-A (black) and RACM2 (red) simulations at 7 °C with 120 ppb of IPN and 112 ppb of toluene as input. Normalized root mean square deviation (NRMSD) was calculated for each species as follows:
with and the species concentrations at each time step i simulated with the MCM/GECKO-A reference and RACM2 (modified or not), respectively, and n the total number of time steps. OH concentration was overestimated with RACM2 compared with MCM/GECKO-A (NRMSD ≈ 0.37). The evolution of the HO2 concentration was similar for the two mechanisms (NRMSD ≈ 0.03). The concentration of methylglyoxal was significantly underestimated by RACM2 compared with MCM/GECKO-A (NRMSD ≈ 0.50). Compared with outlet experimental data, methylglyoxal was better modeled with MCM/GECKO-A than RACM2 (see Figure 1c), although it was overestimated in MCM/GECKO-A and underestimated in RACM2. Methylglyoxal is a major secondary compound that is formed through various reaction pathways and at different oxidation stages during the oxidation of toluene. For example, methylglyoxal is formed by 193 different reactions in MCM/GECKO-A deterministic mechanism and by 15 reactions in RACM2. It is very difficult to achieve such a drastic reduction of the number of reactions while maintaining an accurate representation of the concentrations. Aromatic aldehyde and especially benzaldehyde, which is a first oxidation step product of toluene, were very well modeled by MCM/GECKO-A compared with the outlet experimental concentrations (see Figure 1d). However, they were largely overestimated by RACM2 (NRMSD ≈ 1.77 compared with MCM/GECKO-A).
Figure 1.
Temporal evolution of the concentrations of OH (a), HO2 (b), methylglyoxal (c), and aromatic aldehydes (d) simulated with MCM/GECKO-A (black lines), RACM2 (red lines), and modified RACM2 (blue lines) during toluene oxidation. Results are shown for oxidation performed at a temperature of 7 °C, an RH of 24%, 120 ppb of IPN, and 112 ppb of toluene. Grey points represent the outlet experimental concentrations.
Although the RACM2 mechanism overestimates the OH concentrations, it represents well the NO, NO2, and HO2 concentrations. Modifying the mechanism to improve the OH concentrations is tricky, as there are interactions between HOX, NOX, and VOCs.
To correct these differences, eight reactions of RACM2 were modified (reactions R101, 102, 107, 139, 157, 161, 162, and 183 of Table 3; reaction numbers are those from Goliff et al. [8]). Table 4 lists the model species of RACM2 involved in these changes and the compounds they represent. Modifications mainly concerned the formation of secondary organic species, such as ALD, EPX, BALD, or MGLY or directly HOX, since the first oxidation step (TR2 and TOLP are RO2 formed from toluene oxidation by OH) were:
Table 3.
Modified RACM2 reactions (reaction numbers are those from Goliff et al. [8]).
Table 4.
List of RACM2 species involved in modified reactions (adapted from Goliff et al. [8]).
- -
- The suppression of the immediate reformation of OH radicals after oxidation of toluene (R160 and R161). This reformation was not justified according to deterministic mechanisms.
- -
- The increase in aldehyde formation. As methylglyoxal, the concentrations of short carbon chain aldehydes (ALD in RACM2) were underestimated, leading to a lower consumption of OH radicals. To correct this bias, the reactions of dicarbonyls DCB1 and DCB2 were modified to form 1.00 ALD instead of 0.40 (R101) and 0.00 (R102).
- -
- The return to an old RACM2 version of R183 reaction of the peroxide radical with NO. The formations of DCB1 and methylglyoxal (MGLY) were increased, and the formation of aromatic aldehydes (BALD) was suppressed because this reaction path did not appear in the explicit mechanisms and led to an overestimation of their production.
- -
- The decrease in HO2 (and CO) production by 1/3 for the oxidation reactions of the epoxide EPX (R107, R139, and R159. This modification was justified by the fact that in MCM, only 2/3 of the epoxides formed after oxidation of toluene led to the formation of these compounds.
All of these modifications improved the modeling of OH concentration evolutions with RACM2 compared with MCM/GECKO-A (NRMSD ≈ 0.11, see Figure 1a) without degrading the evolutions of the NOX and HO2 concentrations. They also led to significant improvement of the concentrations of methylglyoxal (NRMSD ≈ 0.11, see Figure 1c) and aromatic aldehydes (NRMSD ≈ 0.26, see Figure 1d). By making RACM2 concentrations closer to the ones simulated by MCM/GECKO-A, the modifications led to a better representation of the experimental data.
The xylene oxidation mechanism in RACM2 was quite similar to that of toluene, in particular, with the reformation of part of the OH from the first oxidation step. In addition, certain species affected by the modifications were part of the xylene mechanism (i.e., EPX, DCB1, and DCB2). The same deterministic/simplified comparison method was therefore applied to xylenes to modify their mechanism in RACM2. In addition to the reactions initially modified for toluene, four reactions were modified to suppress the reformation of OH from the first oxidation step (R162 to R165, see Table 3). 
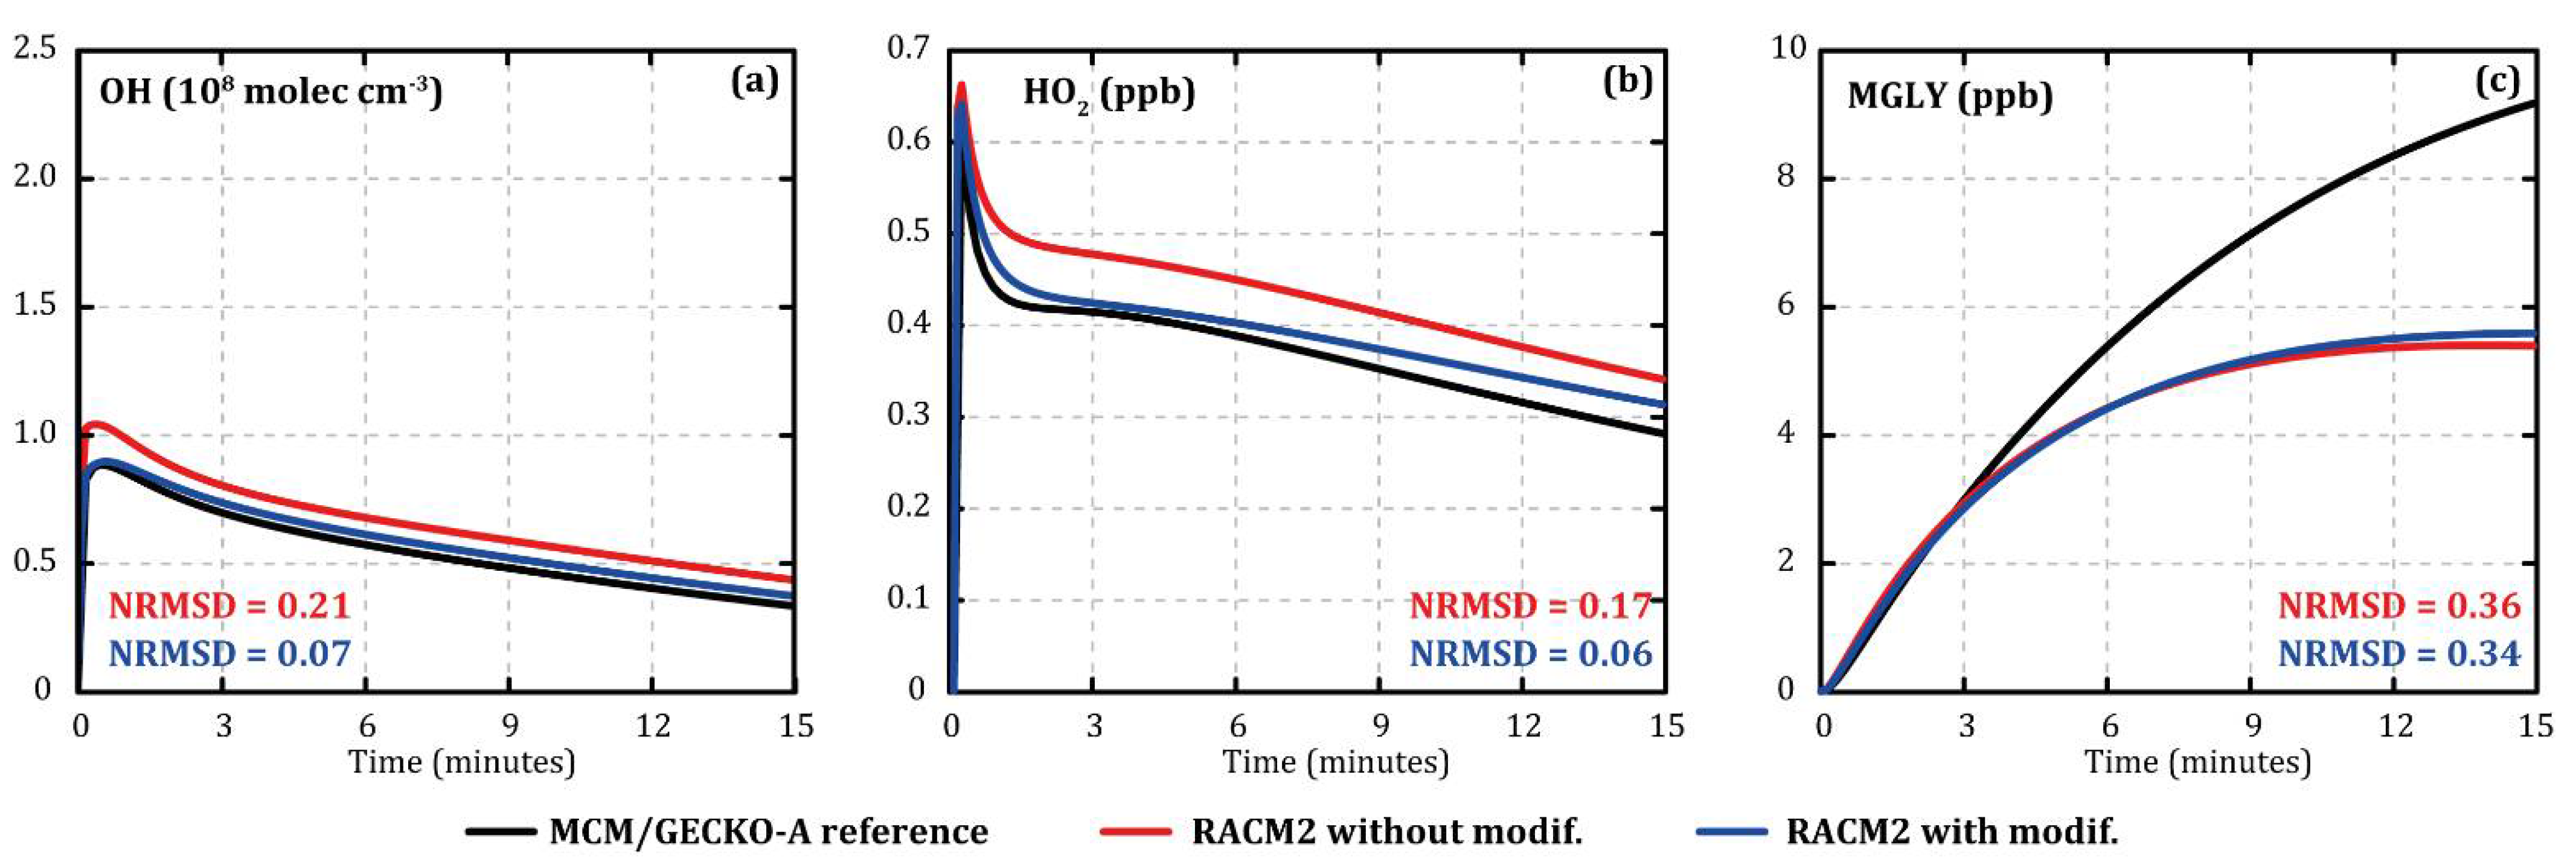
Figure 2 shows the evolution of the concentrations of OH (Figure 2a), HO2 (Figure 2b), and methylglyoxal (MGLY, Figure 2c) during o-xylene oxidation with MCM/GECKO-A (black), original RACM2 (red) (Appendix A), and modified RACM2 (blue) under similar conditions compared with toluene oxidation (7 °C, 120 ppb of IPN, and 112 ppb of o-xylene as input). The modifications made in the RACM2 xylene mechanism improved the evolution of OH and HO2 concentrations, reducing NRMSD from 0.21 to 0.07 and from 0.17 to 0.06, respectively (see Figure 2a,b), without degrading the evolutions of the NOX. Methylglyoxal concentrations were not significantly modified (NRMSD from 0.36 to 0.34, see Figure 2c).
Figure 2.
Temporal evolution of the concentrations of OH (a), HO2 (b), and methylglyoxal (c) simulated with MCM/GECKO-A (black lines), RACM2 (red lines), and modified RACM2 (blue lines) during o-xylene oxidation. Simulated concentrations are shown for oxidation performed at a temperature of 7 °C, an RH of 24%, 120 ppb of IPN, and 112 ppb of o-xylene.
Variations in temperature or relative humidity did not significantly modify the chemical equilibria and the radical concentrations, contrariwise to the NOX concentration variations. Additional simulations were performed at different levels of NOX injected in addition to those formed during the IPN photolysis to verify the consistency of the changes for a wide range of NOX concentrations (see Appendix B and Appendix C). In these simulations, three different additional levels of NOX were tested (0, 100, and 200 ppb respectively noted NOX000, NOX100, and NOX200 in (Appendix B and Appendix C), and three different initial concentrations of toluene and IPN (50, 100, and 200 ppb respectively noted TOL050, TOL100, and TOL200 and IPN050, IPN100, and IPN200 in (Appendix B and Appendix C). Temperature and relative humidity were fixed similar to the previous toluene/xylene oxidation simulations (i.e., T = 7 °C and RH = 24%). The calculated NRMSDs between the RACM2 and MCM/GECKO-A simulations show that (1) the modified version of RACM2 better reproduced the HOX concentrations simulated by MCM/GECKO-A in the majority of cases (for 21/27 test simulations), (2) the improvements were greater at low NOX (up to −17% for NRMSDHO2 and −33% for NRMSDOH), and (3) in cases where the HOX concentrations were not improved, the difference remained small (up to +3% for NRMSDHO2 and +6% for NRMSDOH). The modified chemical mechanism was therefore usable for all NOX conditions.
4. Conclusions and Perspectives
The representation of OH and HO2 concentrations during the oxidation of toluene and xylene with RACM2 was improved, compared with the deterministic model MCM/GECKO-A. Based on flow tube toluene oxidation experiments and deterministic simulations of toluene and xylene oxidation performed with an MCM/GECKO-A mechanism, 12 reactions of RACM2 were modified. These changes reduced deviations on simulated OH concentrations with RACM2 by approximately 70% compared with the deterministic mechanism. The modifications introduced also improved the modeling of aldehydes, such as methylglyoxal and aromatic aldehydes compared with experimental data. The modified RACM2 mechanism improved the simulated HOX concentrations compared with MCM/GECKO-A, especially under low NOX conditions. The use of the modified mechanism will therefore be particularly significant in environments with high concentrations of monoaromatic compounds and relatively low NOX concentrations, such as in indoor air [24] or in industrial regions with high VOC emissions.
Author Contributions
Data curation, B.D.; investigation, V.L.; methodology, V.L., F.C., R.V., and K.S.; supervision, K.S.; writing—original draft, V.L.; writing—review and editing, B.D., F.C., R.V., and K.S. All authors have read and agreed to the published version of the manuscript.
Funding
This work was supported by the MAESTRO project of the ADEME CORTEA program, and the POLEMICS project of the ANR program (grant ANR-18-CE22-0011).
Conflicts of Interest
The authors declare no conflict of interest.
Appendix A
Table A1.
Original RACM2 reactions.
Table A1.
Original RACM2 reactions.
| Reaction | Reaction | k | ||
|---|---|---|---|---|
| No. | (a)s−1 or (b)molec−1 cm3 s−1 | |||
| R160 | TR2 | → | 0.28 DCB2 + 0.28 EPX + 0.01 CSL + 0.28 TOLP + 0.15 PER1 + 0.29 HO2 + 0.28 OH | 1.0 × 10³ (a) |
| R161 | TOLP | → | 0.49 DCB2 + 0.01 HO2 + 0.01 CSL + 0.49 OH + 0.50 PER1 | 1.0 × 10³ (a) |
| R101 | DCB1 + HO | → | 0.52 HO2 + 0.33 CO + 0.40 ALD + 0.78 KET + 0.10 GLY + 0.01 MGLY | 2.8 × 10⁻¹¹ × exp (175/T) (b) |
| R102 | DCB2 + HO | → | 0.52 HO2 + 0.33 CO + 0.13 MEK + 0.10 GLY + 0.01 MGLY + 0.78 OP2 | 2.8 × 10⁻¹¹ × exp (175/T) (b) |
| R183 | PER1 + NO | → | 0.50 DCB1 + 0.95 NO2 + 0.50 MGLY + 0.50 HO2 + 0.05 ONIT + 0.50 BALD | 2.7 × 10⁻¹² × exp (360/T) (b) |
| R107 | EPX + HO | → | 1.00 XO2 + 1.00 HO2 + 1.00 ALD + 1.00 CO | 2.8 × 10⁻¹¹ × exp (175/T) (b) |
| R139 | EPX + O3 | → | 1.50 HO2 + 0.05 HO + 1.50 CO + 1.00 GLY + 0.85 BALD | 1.0 × 10⁻¹⁶ (b) |
| R157 | EPX + NO3 | → | 1.50 HO2 + 0.50 HO + 1.50 CO + 1.00 GLY + 0.50 NO2 + 0.50 HNO3 | 2.87 × 10⁻¹³ × exp (−1000/T) (b) |
| R162 | XY2 | → | 0.224 DCB2 + 0.84 EPX + 0.01 CSL + 0.308 XYLP + 0.15 PER2 + 0.308 HO2 + 0.158 OH + 0.25 RCO3 | 1.0 × 10³ (a) |
| R163 | XYLP | → | 0.49 DCB2 + 0.01 HO2 + 0.01 CSL + 0.39 OH + 0.50 PER2 | 1.0 × 10³ (a) |
| R164 | XYO2 | → | 0.224 DCB2 + 0.84 EPX + 0.01 CSL + 0.308 XYOP + 0.15 PER2 + 0.308 HO2 + 0.158 OH + 0.25 RCO3 | 1.0 × 10³ (a) |
| R165 | XYOP | → | 0.49 DCB2 + 0.01 HO2 + 0.01 CSL + 0.39 OH + 0.50 PER2 | 1.0 × 10³ (a) |
Appendix B
Table A2.
Statistical Results on Simulated OH Concentrations for Additional Toluene Oxidation Simulations. The Concentrations Are Averaged over the 15 Min Simulations for the Deterministic Mechanism (MCM/GECKO-A), the Original RACM2 Mechanism (RACM2), and the RACM2 Mechanism Modified to Improve the Representation of HOX Radicals (RACM2rad). The Last Column Represents the Relative Differences between the NRMSD Calculated for RACM2rad and the NRMSD Calculated for RACM2 Compared with the Deterministic References.
| OH | MCM/GECKO-A Mean | RACM2 Mean | RACM2rad Mean | RACM2 NRMSD | RACM2rad NRMSD | NRMSD Rel. Diff. |
|---|---|---|---|---|---|---|
| molec cm−3 | molec cm−3 | molec cm−3 | ||||
| TOL050_IPN050_NOX000 | 9.2 × 10⁷ | 1.3 × 10⁸ | 1.1 × 10⁸ | 0.77 | 0.541 | −0.298 |
| TOL050_IPN050_NOX100 | 2.0 × 10⁸ | 1.7 × 10⁸ | 1.7 × 10⁸ | 0.483 | 0.512 | 0.06 |
| TOL050_IPN050_NOX200 | 1.4 × 10⁸ | 9.3 × 10⁷ | 9.1 × 10⁷ | 0.642 | 0.652 | 0.0144 |
| TOL050_IPN100_NOX000 | 1.5 × 10⁸ | 2.1 × 10⁸ | 1.7 × 10⁸ | 0.722 | 0.48 | −0.335 |
| TOL050_IPN100_NOX100 | 2.6 × 10⁸ | 2.7 × 10⁸ | 2.4 × 10⁸ | 0.384 | 0.363 | −0.0559 |
| TOL050_IPN100_NOX200 | 2.3 × 10⁸ | 1.6 × 10⁸ | 1.6 × 10⁸ | 0.607 | 0.582 | −0.0405 |
| TOL050_IPN200_NOX000 | 2.5 × 10⁸ | 3.4 × 10⁸ | 2.8 × 10⁸ | 0.591 | 0.378 | −0.362 |
| TOL050_IPN200_NOX100 | 3.4 × 10⁸ | 3.7 × 10⁸ | 3.3 × 10⁸ | 0.293 | 0.294 | 0.00179 |
| TOL050_IPN200_NOX200 | 3.4 × 10⁸ | 2.6 × 10⁸ | 2.7 × 10⁸ | 0.424 | 0.387 | −0.0882 |
| TOL100_IPN050_NOX000 | 5.7 × 10⁷ | 8.0 × 10⁷ | 6.7 × 10⁷ | 0.797 | 0.575 | −0.279 |
| TOL100_IPN050_NOX100 | 1.3 × 10⁸ | 1.6 × 10⁸ | 1.3 × 10⁸ | 0.699 | 0.576 | −0.175 |
| TOL100_IPN050_NOX200 | 1.6 × 10⁸ | 9.7 × 10⁷ | 9.2 × 10⁷ | 0.757 | 0.789 | 0.0422 |
| TOL100_IPN100_NOX000 | 9.3 × 10⁷ | 1.3 × 10⁸ | 1.1 × 10⁸ | 0.805 | 0.567 | −0.296 |
| TOL100_IPN100_NOX100 | 1.6 × 10⁸ | 2.1 × 10⁸ | 1.7 × 10⁸ | 0.74 | 0.629 | −0.15 |
| TOL100_IPN100_NOX200 | 2.0 × 10⁸ | 1.7 × 10⁸ | 1.7 × 10⁸ | 0.493 | 0.518 | 0.0504 |
| TOL100_IPN200_NOX000 | 1.5 × 10⁸ | 2.2 × 10⁸ | 1.8 × 10⁸ | 0.76 | 0.507 | −0.333 |
| TOL100_IPN200_NOX100 | 2.2 × 10⁸ | 2.8 × 10⁸ | 2.3 × 10⁸ | 0.696 | 0.546 | −0.217 |
| TOL100_IPN200_NOX200 | 2.6 × 10⁸ | 2.7 × 10⁸ | 2.4 × 10⁸ | 0.407 | 0.379 | −0.069 |
| TOL200_IPN050_NOX000 | 3.6 × 10⁷ | 4.9 × 10⁷ | 4.1 × 10⁷ | 0.782 | 0.553 | −0.293 |
| TOL200_IPN050_NOX100 | 8.2 × 10⁷ | 1.1 × 10⁸ | 8.8 × 10⁷ | 0.989 | 0.803 | −0.189 |
| TOL200_IPN050_NOX200 | 1.1 × 10⁸ | 1.0 × 10⁸ | 8.9 × 10⁷ | 0.732 | 0.758 | 0.0353 |
| TOL200_IPN100_NOX000 | 5.7 × 10⁷ | 8.1 × 10⁷ | 6.7 × 10⁷ | 0.821 | 0.593 | −0.278 |
| TOL200_IPN100_NOX100 | 9.9 × 10⁷ | 1.4 × 10⁸ | 1.1 × 10⁸ | 1.1 | 0.923 | −0.158 |
| TOL200_IPN100_NOX200 | 1.3 × 10⁸ | 1.6 × 10⁸ | 1.3 × 10⁸ | 0.719 | 0.592 | −0.177 |
| TOL200_IPN200_NOX000 | 9.2 × 10⁷ | 1.3 × 10⁸ | 1.1 × 10⁸ | 0.832 | 0.587 | −0.295 |
| TOL200_IPN200_NOX100 | 1.3 × 10⁸ | 1.8 × 10⁸ | 1.5 × 10⁸ | 1.01 | 0.822 | −0.189 |
| TOL200_IPN200_NOX200 | 1.6 × 10⁸ | 2.1 × 10⁸ | 1.7 × 10⁸ | 0.783 | 0.658 | −0.159 |
Appendix C
Table A3.
Statistical Results on Simulated HO2 Concentrations for Additional Toluene Oxidation Simulations. The Concentrations Are Averaged over the 15 Min Simulations for the Deterministic Mechanism (MCM/GECKO-A), the Original RACM2 Mechanism (RACM2), and the RACM2 Mechanism Modified to Improve the Representation of HOX Radicals (RACM2rad). The Last Column Represents the Relative Differences between the NRMSD Calculated for RACM2rad and the NRMSD Calculated for RACM2 Compared with the Deterministic References.
| HO2 | GECKO-A Mean | RACM2 Mean | RACM2rad Mean | RACM2 NRMSD | RACM2rad NRMSD | NRMSD Rel. Diff. |
|---|---|---|---|---|---|---|
| ppt | ppt | ppt | ||||
| TOL050_IPN050_NOX000 | 2.4 × 10² | 2.3 × 10² | 2.3 × 10² | 0.269 | 0.252 | −0.064 |
| TOL050_IPN050_NOX100 | 9.2 × 101 | 8.8 | 1.7 × 101 | 1.8 | 1.65 | −0.0831 |
| TOL050_IPN050_NOX200 | 4.9 | 2.0 | 2.3 | 1.11 | 1.03 | −0.0723 |
| TOL050_IPN100_NOX000 | 3.2 × 10² | 2.9 × 10² | 2.9 × 10² | 0.303 | 0.27 | −0.108 |
| TOL050_IPN100_NOX100 | 1.5 × 10² | 3.6 × 101 | 7.5 × 101 | 1.36 | 1.13 | −0.171 |
| TOL050_IPN100_NOX200 | 1.7 × 101 | 4.4 | 5.9 | 1.55 | 1.43 | −0.0748 |
| TOL050_IPN200_NOX000 | 4.0 × 10² | 3.4 × 10² | 3.6 × 10² | 0.362 | 0.303 | −0.163 |
| TOL050_IPN200_NOX100 | 2.2 × 10² | 9.3 × 101 | 1.4 × 10² | 1.04 | 0.919 | −0.112 |
| TOL050_IPN200_NOX200 | 5.9 × 101 | 1.1 × 101 | 2.1 × 101 | 1.61 | 1.35 | −0.158 |
| TOL100_IPN050_NOX000 | 2.5 × 10² | 2.6 × 10² | 2.5 × 10² | 0.263 | 0.239 | −0.0906 |
| TOL100_IPN050_NOX100 | 1.7 × 10² | 5.1 × 101 | 6.6 × 101 | 1.31 | 1.23 | −0.0601 |
| TOL100_IPN050_NOX200 | 5.9 × 101 | 3.3 | 3.9 | 2.41 | 2.4 | −0.00734 |
| TOL100_IPN100_NOX000 | 3.4 × 10² | 3.4 × 10² | 3.3 × 10² | 0.267 | 0.25 | −0.0643 |
| TOL100_IPN100_NOX100 | 2.4 × 10² | 1.3 × 10² | 1.5 × 10² | 1.06 | 1.06 | 0.0011 |
| TOL100_IPN100_NOX200 | 1.3 × 10² | 9.4 | 2.1 × 101 | 1.86 | 1.7 | −0.0834 |
| TOL100_IPN200_NOX000 | 4.5 × 10² | 4.1 × 10² | 4.2 × 10² | 0.294 | 0.268 | −0.0873 |
| TOL100_IPN200_NOX100 | 3.3 × 10² | 2.1 × 10² | 2.4 × 10² | 0.883 | 0.846 | −0.0426 |
| TOL100_IPN200_NOX200 | 2.1 × 10² | 4.9 × 101 | 1.0 × 10² | 1.39 | 1.17 | −0.157 |
| TOL200_IPN050_NOX000 | 2.7 × 10² | 2.9 × 10² | 2.7 × 10² | 0.272 | 0.227 | −0.165 |
| TOL200_IPN050_NOX100 | 2.2 × 10² | 1.3 × 10² | 1.2 × 10² | 1.08 | 1.09 | 0.00423 |
| TOL200_IPN050_NOX200 | 1.6 × 10² | 9.0 | 1.1 × 101 | 1.83 | 1.81 | −0.0103 |
| TOL200_IPN100_NOX000 | 3.6 × 10² | 3.8 × 10² | 3.6 × 10² | 0.268 | 0.238 | −0.11 |
| TOL200_IPN100_NOX100 | 2.9 × 10² | 2.2 × 10² | 2.1 × 10² | 0.964 | 0.987 | 0.0239 |
| TOL200_IPN100_NOX200 | 2.3 × 10² | 7.4 × 101 | 9.2 × 101 | 1.32 | 1.25 | −0.0531 |
| TOL200_IPN200_NOX000 | 4.8 × 10² | 4.8 × 10² | 4.7 × 10² | 0.267 | 0.249 | −0.0676 |
| TOL200_IPN200_NOX100 | 4.1 × 10² | 3.2 × 10² | 3.2 × 10² | 0.748 | 0.77 | 0.0291 |
| TOL200_IPN200_NOX200 | 3.3 × 10² | 1.8 × 10² | 2.0 × 10² | 1.1 | 1.1 | 0.00498 |
References
- Seigneur, C. Air Pollution; Cambridge University Press: Cambridge, UK, 2019. [Google Scholar]
- Gligorovski, S.; Wortham, H.; Kleffmann, J. The hydroxyl radical (OH) in indoor air: Sources and implications. Atmos. Environ. 2014, 99, 568–570. [Google Scholar] [CrossRef]
- Bloss, C.; Wagner, V.; Jenkin, M.E.; Volkamer, R.; Bloss, W.J.; Lee, J.D.; Heard, D.; Wirtz, K.; Martin-Reviejo, M.; Rea, G.; et al. Development of a detailed chemical mechanism (MCMv3.1) for the atmospheric oxidation of aromatic hydrocarbons. Atmos. Chem. Phys. Discuss. 2005, 5, 641–664. [Google Scholar] [CrossRef]
- Jenkin, M.E.; Saunders, S.M.; Wagner, V.; Pilling, M.J. Protocol for the development of the Master Chemical Mechanism, MCM v3 (Part B): Tropospheric degradation of aromatic volatile organic compounds. Atmos. Chem. Phys. Discuss. 2003, 3, 181–193. [Google Scholar] [CrossRef]
- Aumont, B.; Szopa, S.; Madronich, S. Modelling the evolution of organic carbon during its gas-phase tropospheric oxidation: Development of an explicit model based on a self generating approach. Atmos. Chem. Phys. 2005, 5, 2497–2517. [Google Scholar] [CrossRef]
- Yarwood, G.; Rao, S.; Yocke, M.; Whitten, G. Updates to the Carbon Bond Chemical Mechanism: CB05 Final Report to the US EPA, RT-04006752005. Available online: https://camx-wp.azurewebsites.net/Files/CB05_Final_Report_120805.pdf (accessed on 7 June 2021).
- Derognat, C.; Baeumle, M.; Beekmann, M.; Martin, D.; Schmidt, H. Effect of biogenic volatile organic compound emissions on tropospheric chemistry during the Atmospheric Pollution Over the Paris Area (ESQUIF) campaign in the Ile-de-France region. J. Geophys. Res. Space Phys. 2003, 108, 8560. [Google Scholar] [CrossRef]
- Goliff, W.S.; Stockwell, W.R.; Lawson, C.V. The regional atmospheric chemistry mechanism, version 2. Atmos. Environ. 2013, 68, 174–185. [Google Scholar] [CrossRef]
- Kim, Y.; Couvidat, F.; Sartelet, K.; Seigneur, C. Comparison of different gas-phase mechanisms and aerosol modules for simulating particulate matter formation. J. Air Waste Manag. Assoc. 2011, 61, 1218–1226. [Google Scholar] [CrossRef]
- Couvidat, F.; Debry, É.; Sartelet, K.; Seigneur, C. A hydrophilic/hydrophobic organic (H2O) aerosol model: Development, evaluation and sensitivity analysis. J. Geophys. Res. 2012, 117, D10304. [Google Scholar] [CrossRef]
- Alvarado, M.J.; Lonsdale, C.R.; Yokelson, R.J.; Akagi, S.K.; Coe, H.; Craven, J.S.; Fischer, E.V.; McMeeking, G.R.; Seinfeld, J.H.; Soni, T.; et al. Investigating the links between ozone and organic aerosol chemistry in a biomass burning plume from a prescribed fire in California chaparral. Atmos. Chem. Phys. 2015, 15, 6667–6688. [Google Scholar] [CrossRef]
- Woody, M.C.; Baker, K.R.; Hayes, P.L.; Jimenez, J.L.; Koo, B.; Pye, H.O.T. Understanding sources of organic aerosol during CalNex-2010 using the CMAQ-VBS. Atmos. Chem. Phys. 2016, 16, 4081–4100. [Google Scholar] [CrossRef]
- Majdi, M.; Sartelet, K.; Lanzafame, G.M.; Couvidat, F.; Kim, Y.; Chrit, M.; Turquety, S. Precursors and formation of secondary organic aerosols from wildfires in the Euro-Mediterranean region. Atmos. Chem. Phys. 2019, 19, 5543–5569. [Google Scholar] [CrossRef]
- Lannuque, V.; Couvidat, F.; Camredon, M.; Aumont, B.; Bessagnet, B. Modeling organic aerosol over Europe in summer conditions with the VBS-GECKO parameterization: Sensitivity to secondary organic compound properties and IVOC (intermediate-volatility organic compound) emissions. Atmos. Chem. Phys. 2020, 20, 4905–4931. [Google Scholar] [CrossRef]
- Pai, S.J.; Heald, C.L.; Pierce, J.R.; Farina, S.C.; Marais, E.A.; Jimenez, J.L.; Campuzano-Jost, P.; Nault, B.A.; Middlebrook, A.M.; Coe, H.; et al. An evaluation of global organic aerosol schemes using airborne observations. Atmospheric Chem. Phys. Discuss. 2020, 20, 2637–2665. [Google Scholar] [CrossRef]
- Kim, Y.; Sartelet, K.; Seigneur, C. Formation of secondary aerosols over Europe: Comparison of two gas-phase chemical mechanisms. Atmos. Chem. Phys. Discuss. 2011, 11, 583–598. [Google Scholar] [CrossRef]
- Zong, R.; Xue, L.; Wang, T.; Wang, W. Inter-comparison of the Regional Atmospheric Chemistry Mechanism (RACM2) and Master Chemical Mechanism (MCM) on the simulation of acetaldehyde. Atmos. Environ. 2018, 186, 144–149. [Google Scholar] [CrossRef]
- Sarwar, G.; Godowitch, J.; Henderson, B.H.; Fahey, K.; Pouliot, G.; Hutzell, W.T.; Mathur, R.; Kang, D.; Goliff, W.S.; Stockwell, W.R. A comparison of atmospheric composition using the Carbon Bond and Regional Atmospheric Chemistry Mechanisms. Atmos. Chem. Phys. 2013, 13, 9695–9712. [Google Scholar] [CrossRef]
- Stone, D.; Whalley, L.K.; Heard, D.E. Tropospheric OH and HO2 radicals: Field measurements and model comparisons. Chem. Soc. Rev. 2012, 41, 6348–6404. [Google Scholar] [CrossRef] [PubMed]
- La, Y.S.; Camredon, M.; Ziemann, P.J.; Valorso, R.; Matsunaga, A.; Lannuque, V.; Lee-Taylor, J.; Hodzic, A.; Madronich, S.; Aumont, B. Impact of chamber wall loss of gaseous organic compounds on secondary organic aerosol formation: Explicit modeling of SOA formation from alkane and alkene oxidation. Atmos. Chem. Phys. 2016, 16, 1417–1431. [Google Scholar] [CrossRef]
- Raff, J.D.; Finlayson-Pitts, B.J. Hydroxyl Radical Quantum Yields from Isopropyl Nitrite Photolysis in Air. Environ. Sci. Technol. 2010, 44, 8150–8155. [Google Scholar] [CrossRef]
- Fittschen, C.; Frenzel, A.; Imrik, K.; Devolder, P. Rate constants for the reactions of C2H5O, i-C3H7O, and n-C3H7O with NO and O2 as a function of temperature. Int. J. Chem. Kinet. 1999, 31, 860–866. [Google Scholar] [CrossRef]
- Jacob, D. Heterogeneous chemistry and tropospheric ozone. Atmos. Environ. 2000, 34, 2131–2159. [Google Scholar] [CrossRef]
- Fiorentino, E.-A.; Wortham, H.; Sartelet, K. Combining homogeneous and heterogeneous chemistry to model inorganic compounds concentrations in indoor environments: The H2I model (v1.0). Geosci. Model Dev. 2021, 14, 2747–2780. [Google Scholar] [CrossRef]
- Verwer, J.G.; Van Loon, M. An Evaluation of Explicit Pseudo-Steady-State Approximation Schemes for Stiff ODE Systems from Chemical Kinetics. J. Comput. Phys. 1994, 113, 347–352. [Google Scholar] [CrossRef]
- Verwer, J.G.; Blom, J.G.; Van Loon, M.; Spee, E.J. A comparison of stiff ode solvers for atmospheric chemistry problems. Atmos. Environ. 1996, 30, 49–58. [Google Scholar] [CrossRef]
- Sartelet, K.; Couvidat, F.; Wang, Z.; Flageul, C.; Kim, Y. SSH-Aerosol v1.1: A Modular Box Model to Simulate the Evolution of Primary and Secondary Aerosols. Atmosphere 2020, 11, 525. [Google Scholar] [CrossRef]
Publisher’s Note: MDPI stays neutral with regard to jurisdictional claims in published maps and institutional affiliations. |
© 2021 by the authors. Licensee MDPI, Basel, Switzerland. This article is an open access article distributed under the terms and conditions of the Creative Commons Attribution (CC BY) license (https://creativecommons.org/licenses/by/4.0/).