
Are CH4, CO2, and N2O Emissions from Soil Affected by the Sources and Doses of N in Warm-Season Pasture?


 ,
,  and
and
Abstract
1. Introduction
2. Materials and Methods
2.1. Experimental Sites
2.2. Experimental Design and Treatments
2.3. Quantification of CH4, CO2, and N2O Emissions
2.4. Soil and Meteorological Parameters
2.5. Statistical Analysis
3. Results
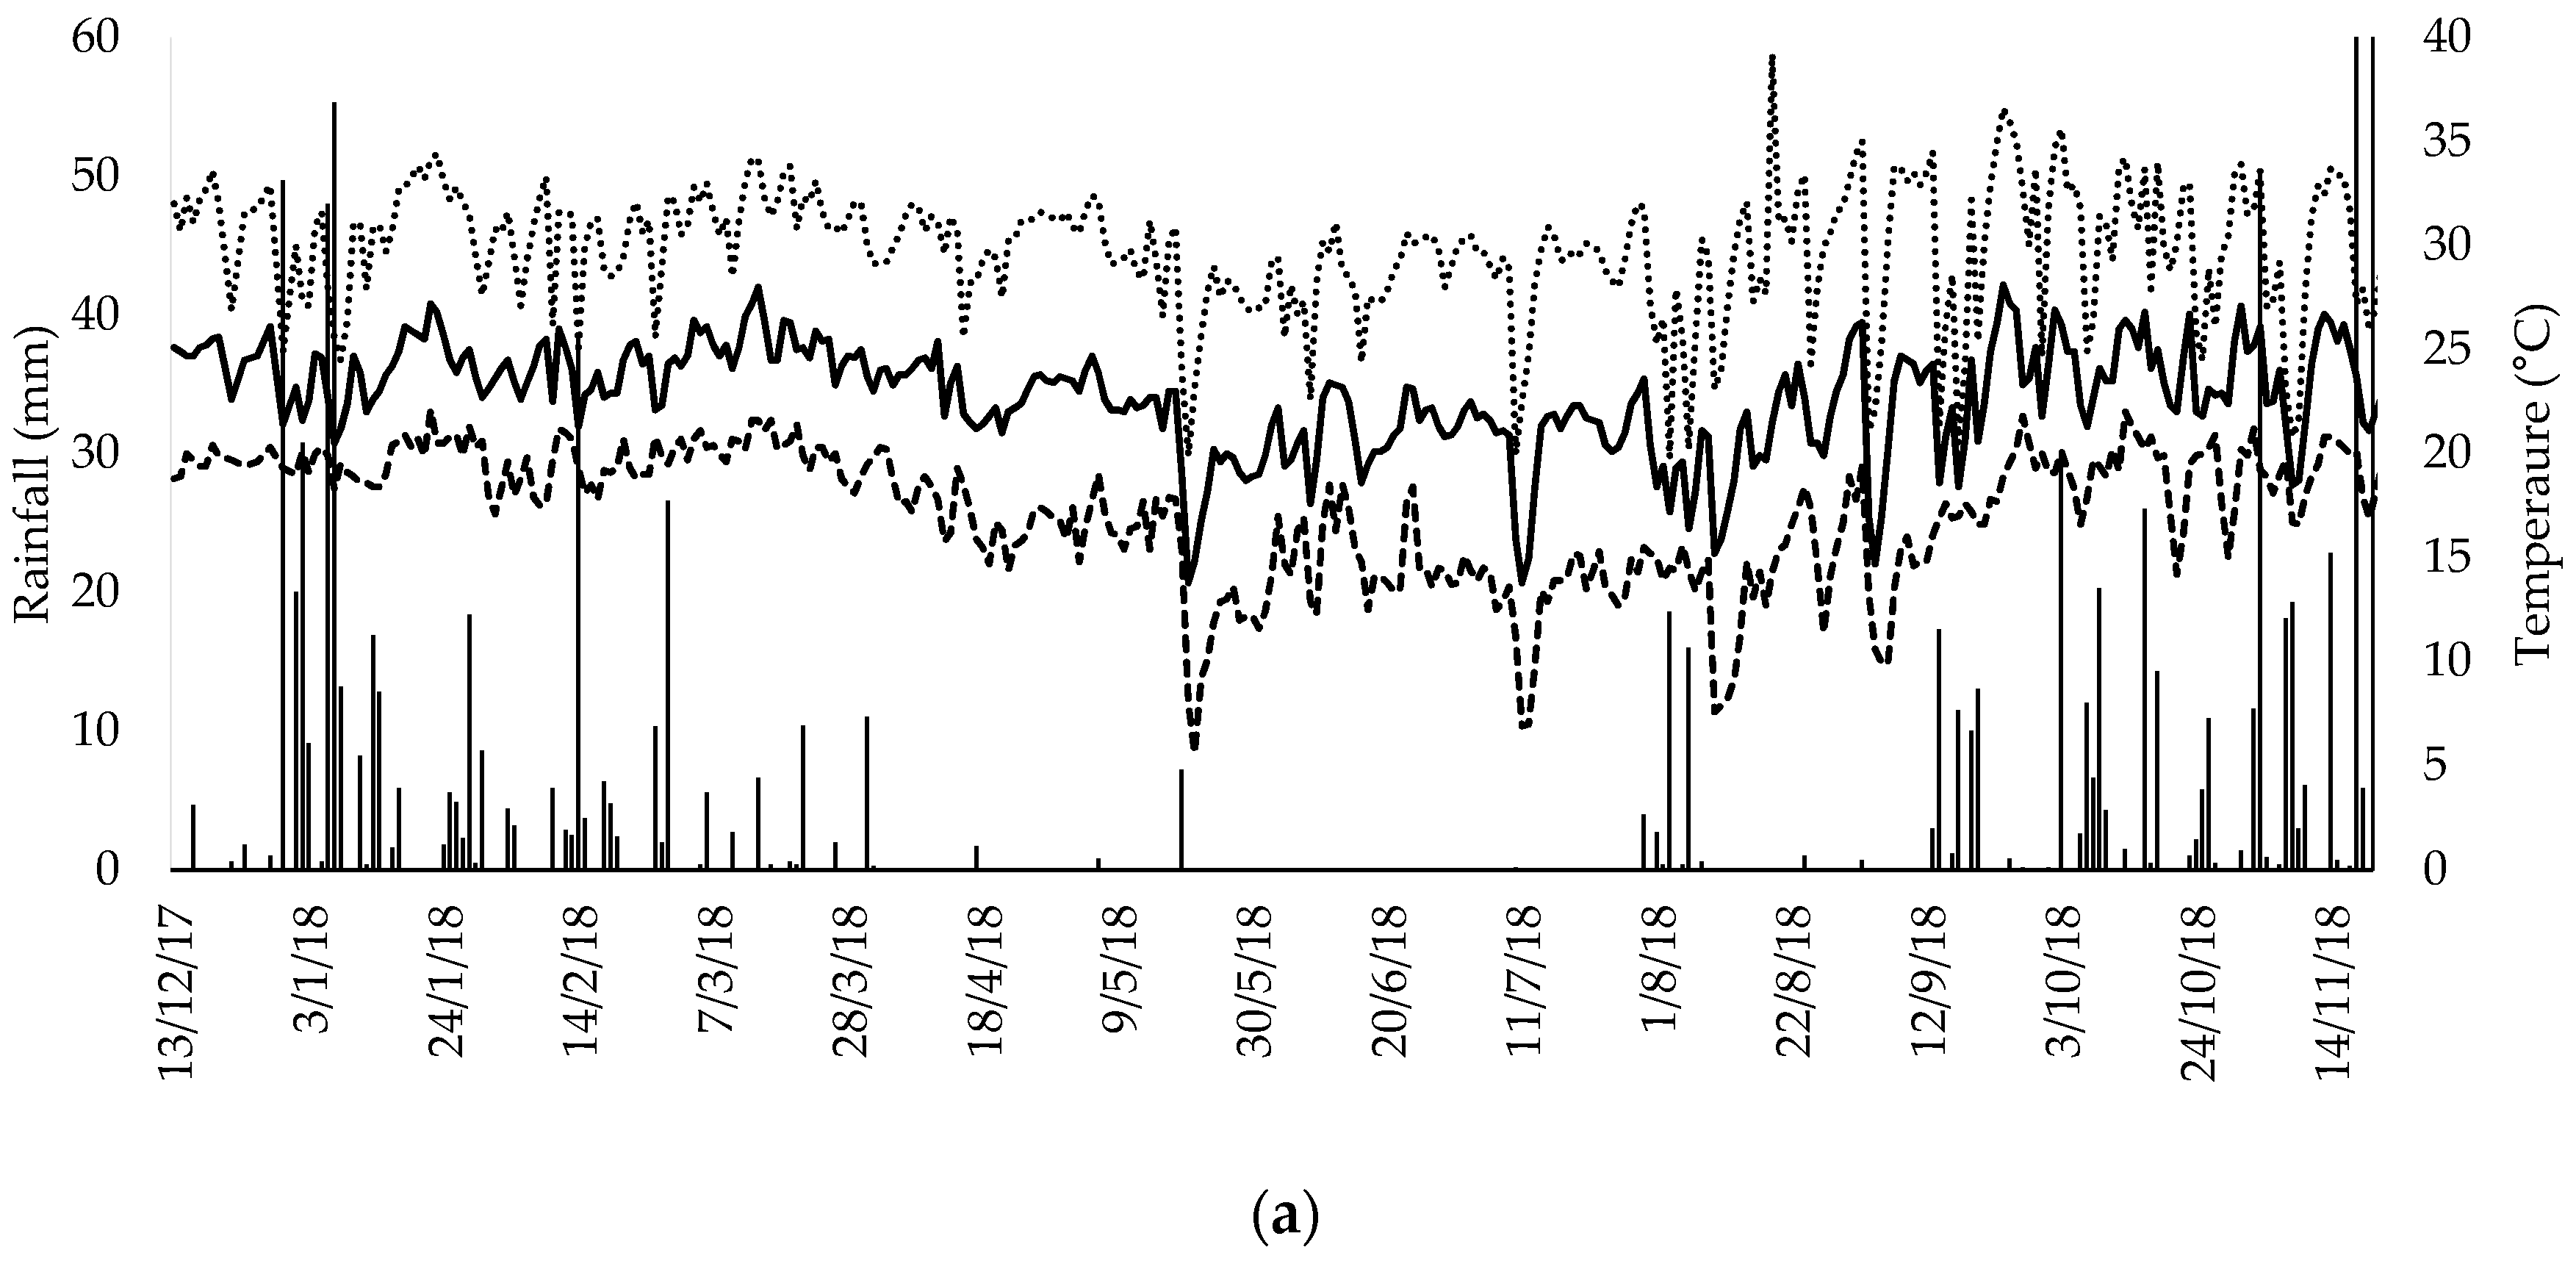
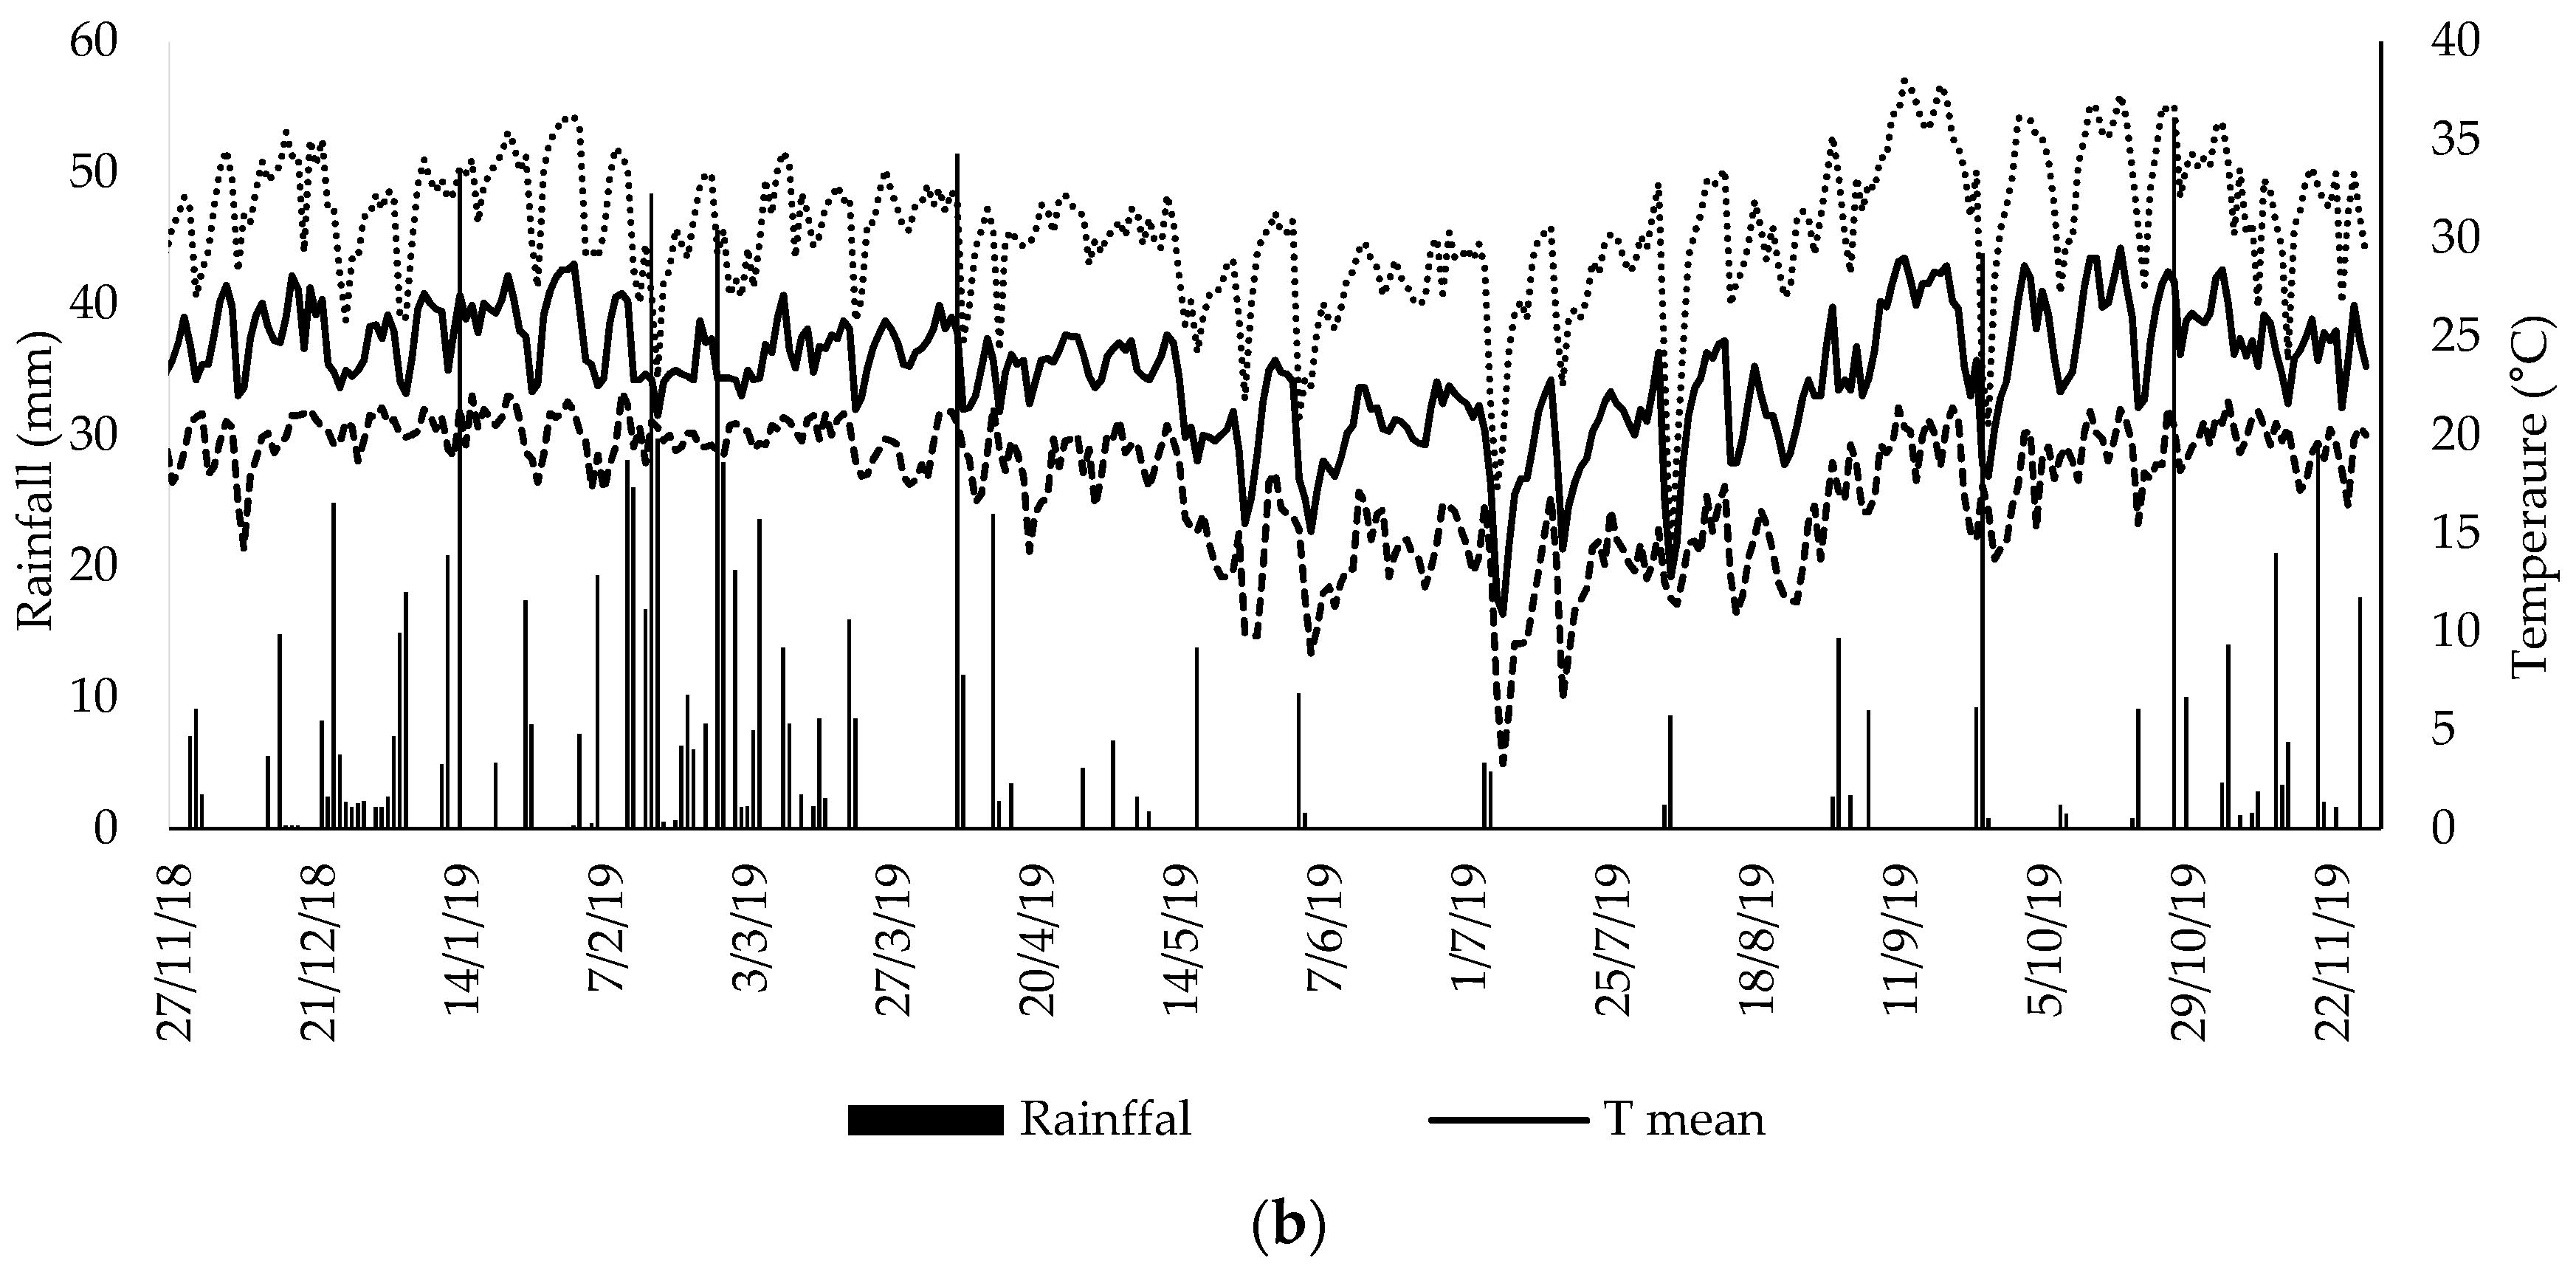
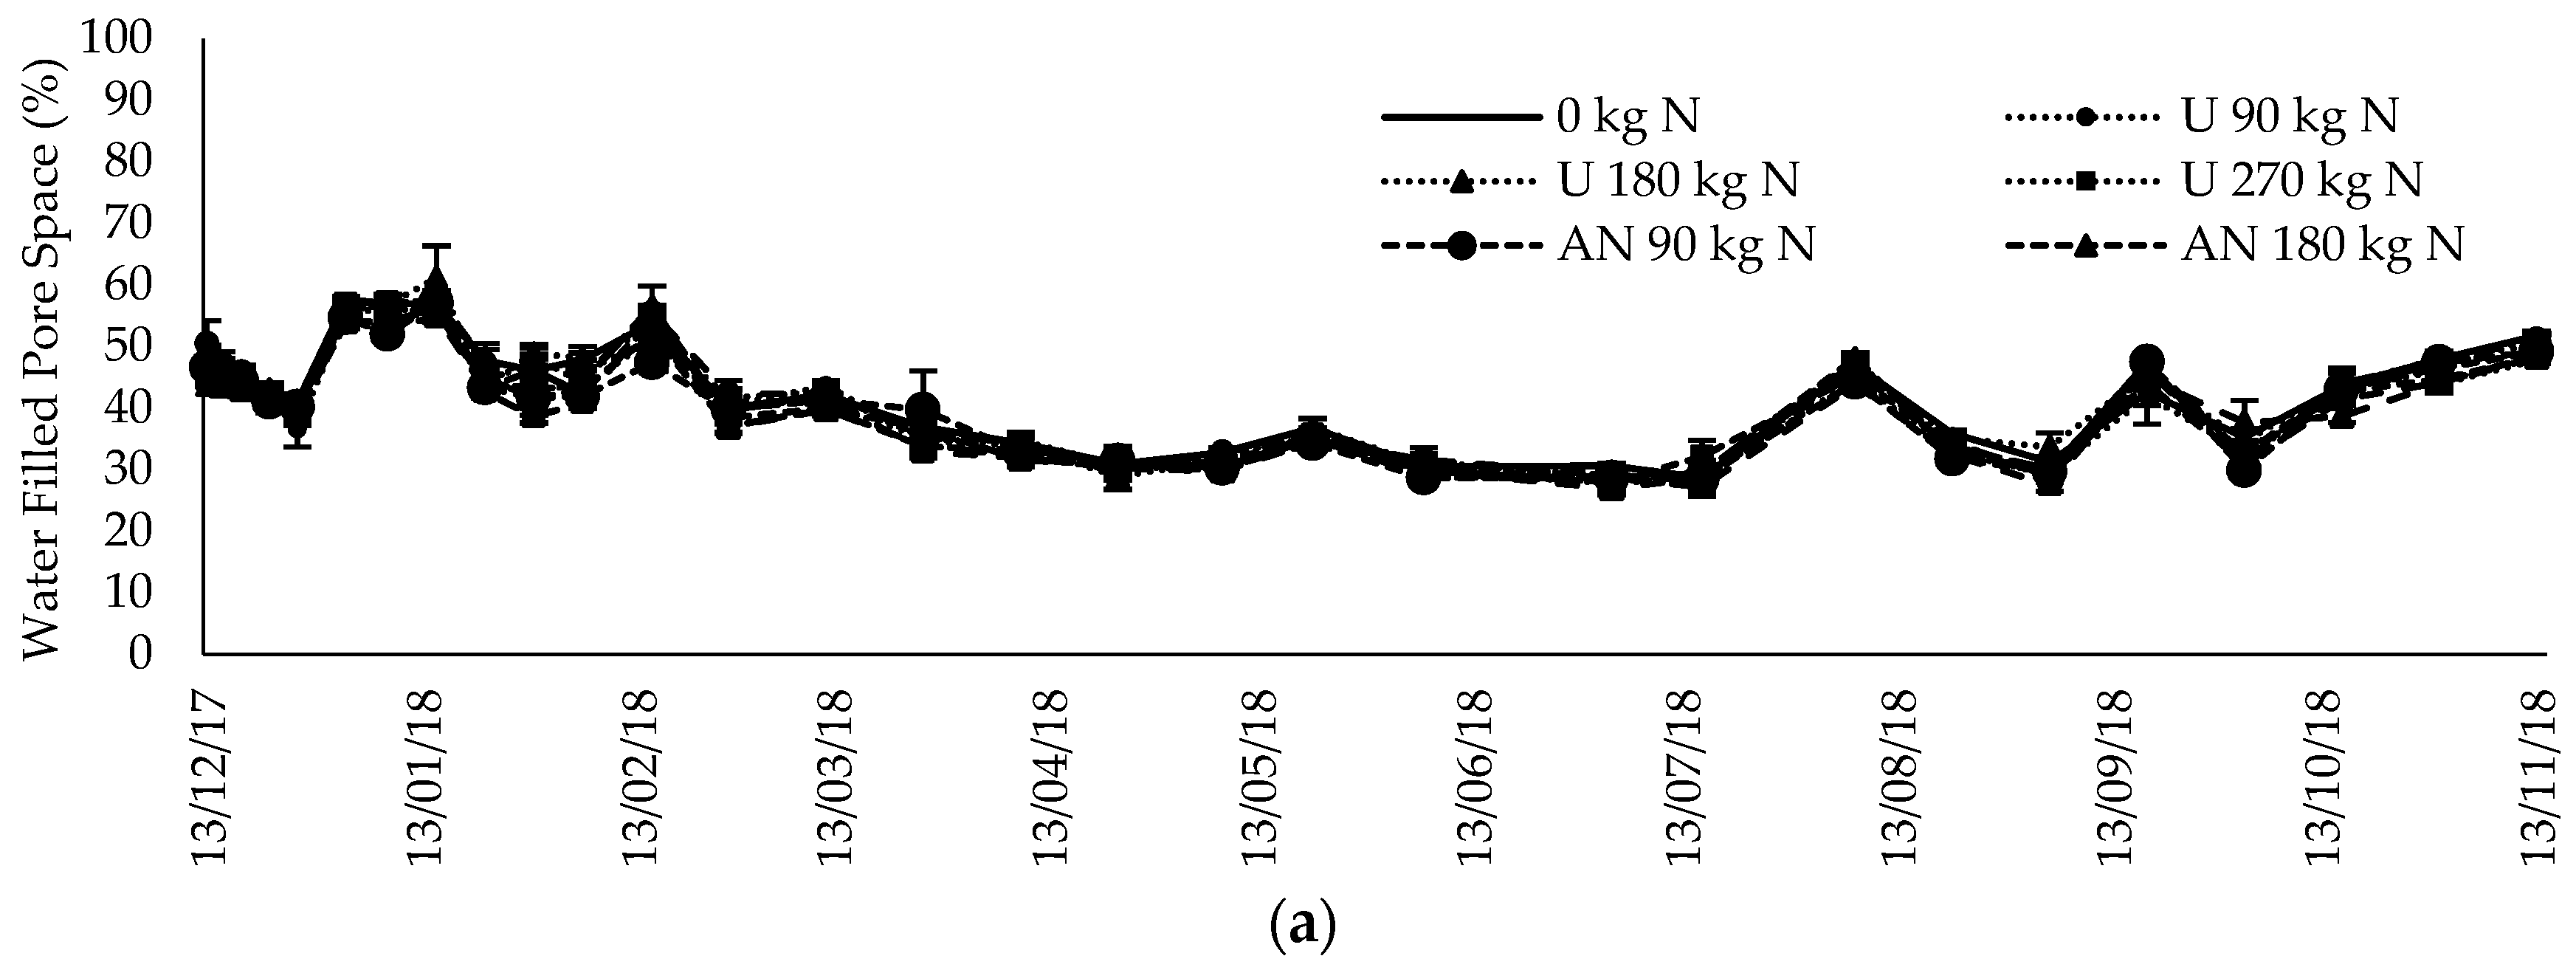
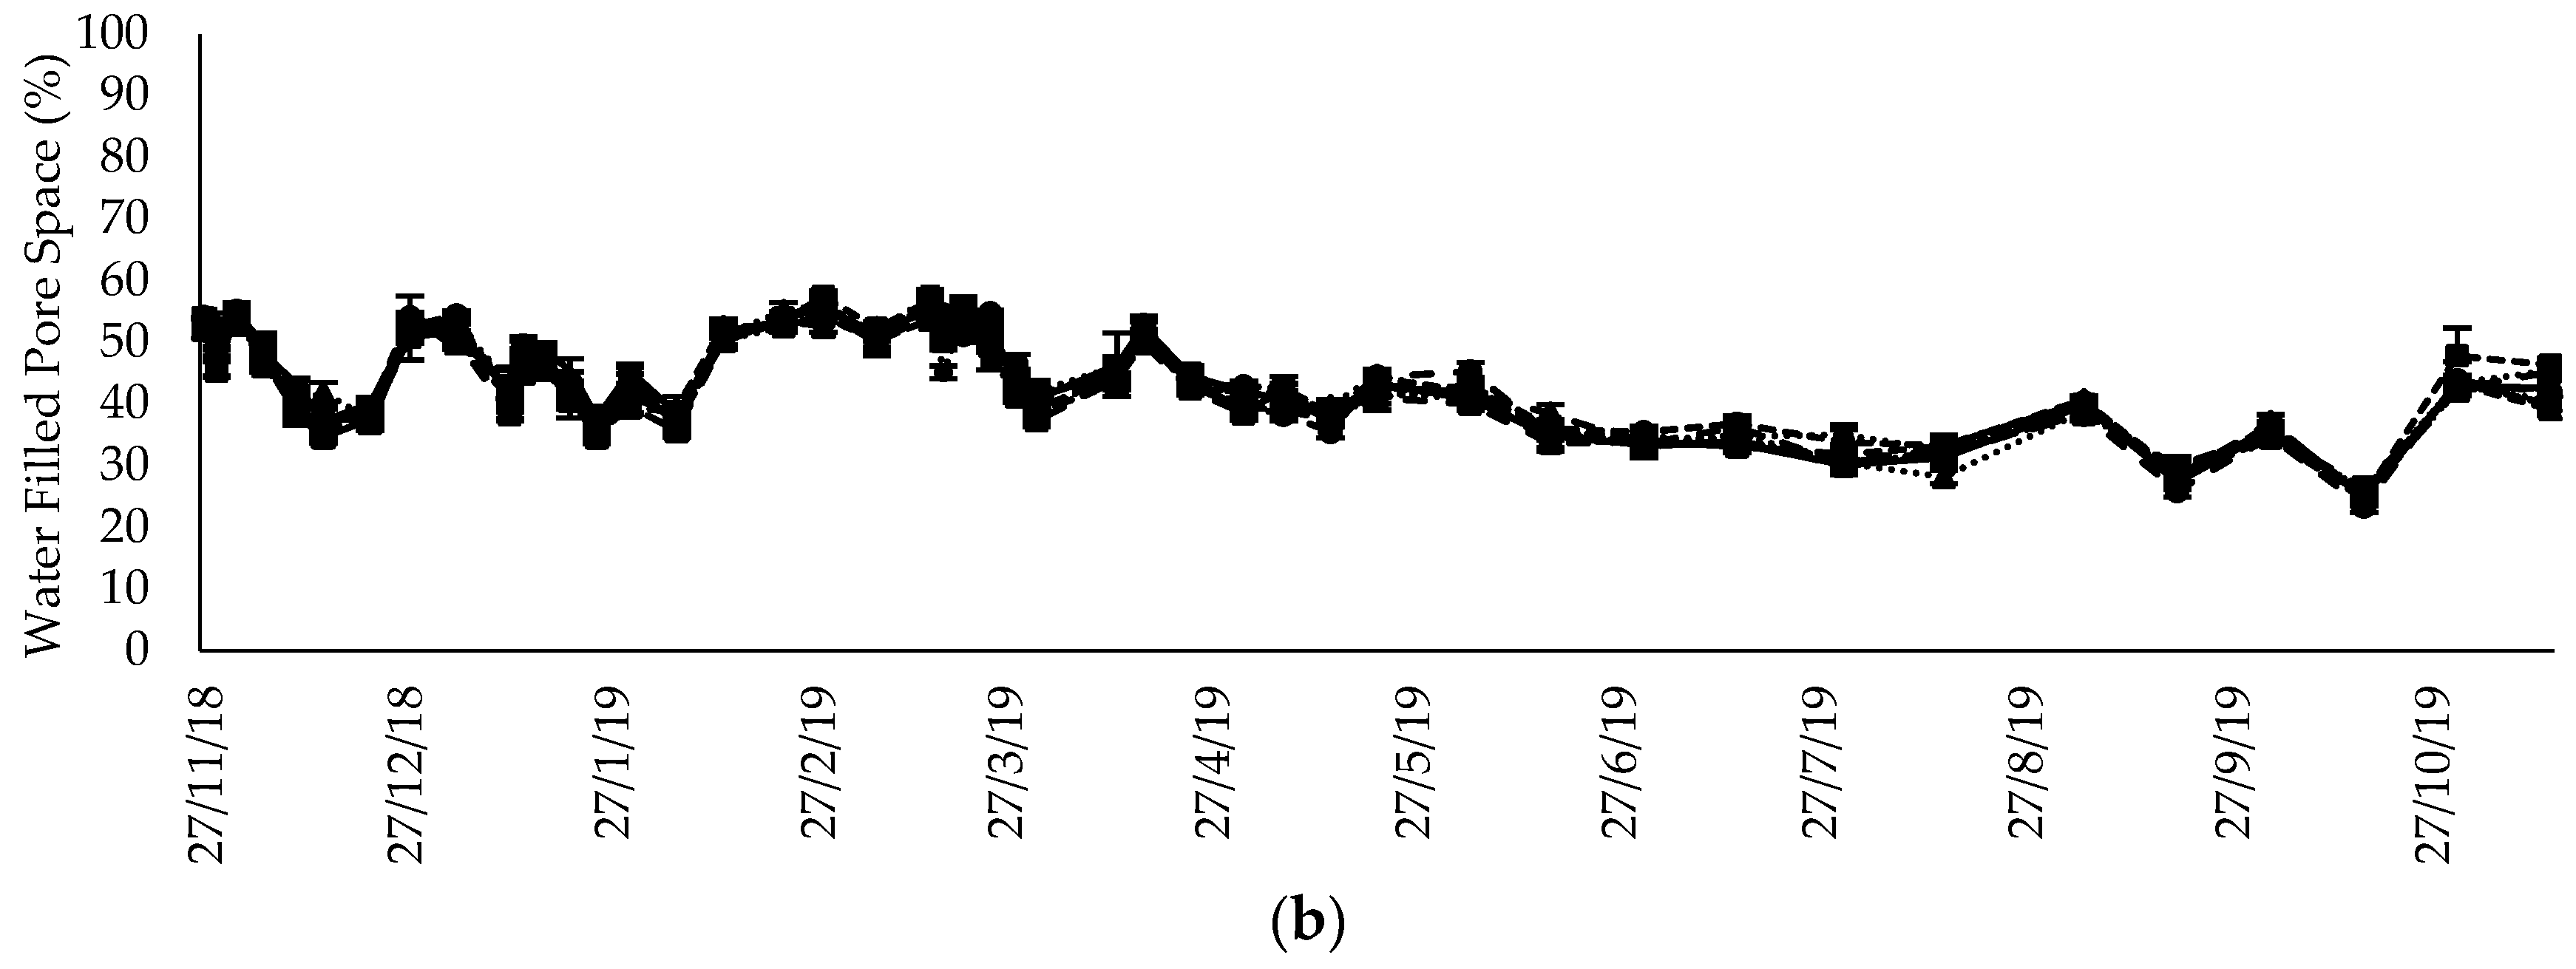
3.1. Climatic Variables
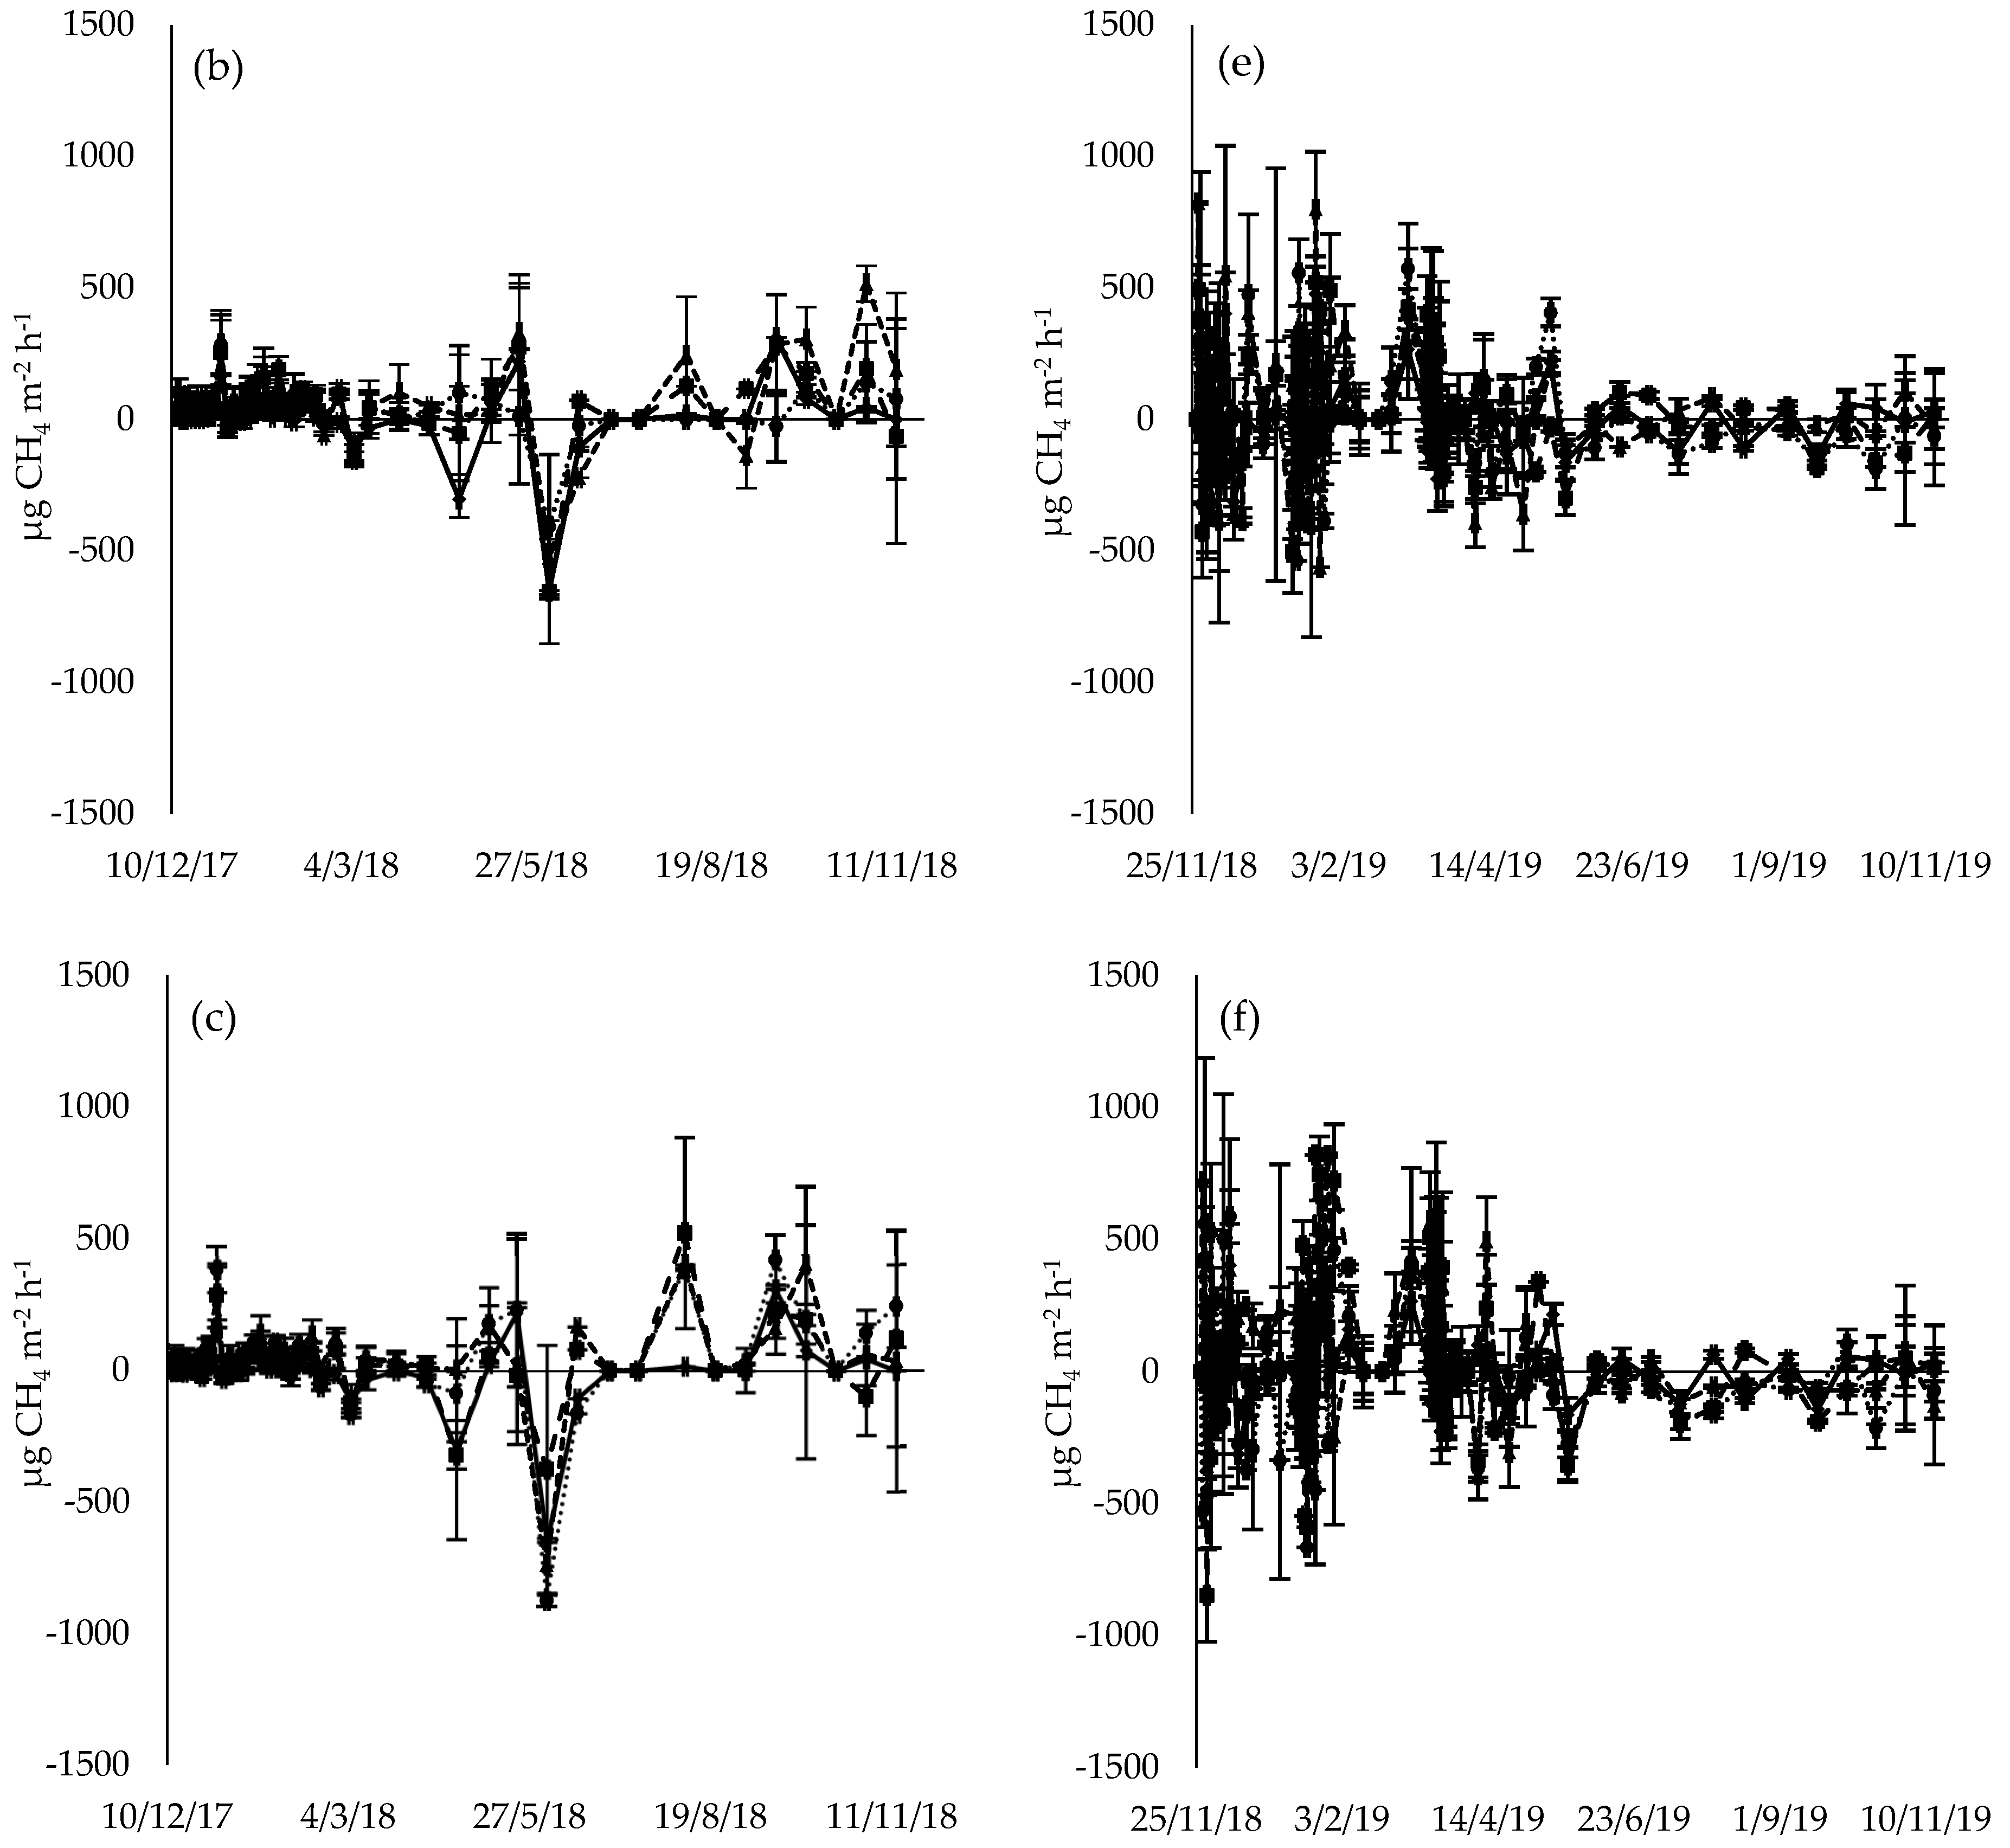
3.2. CH4 Flux
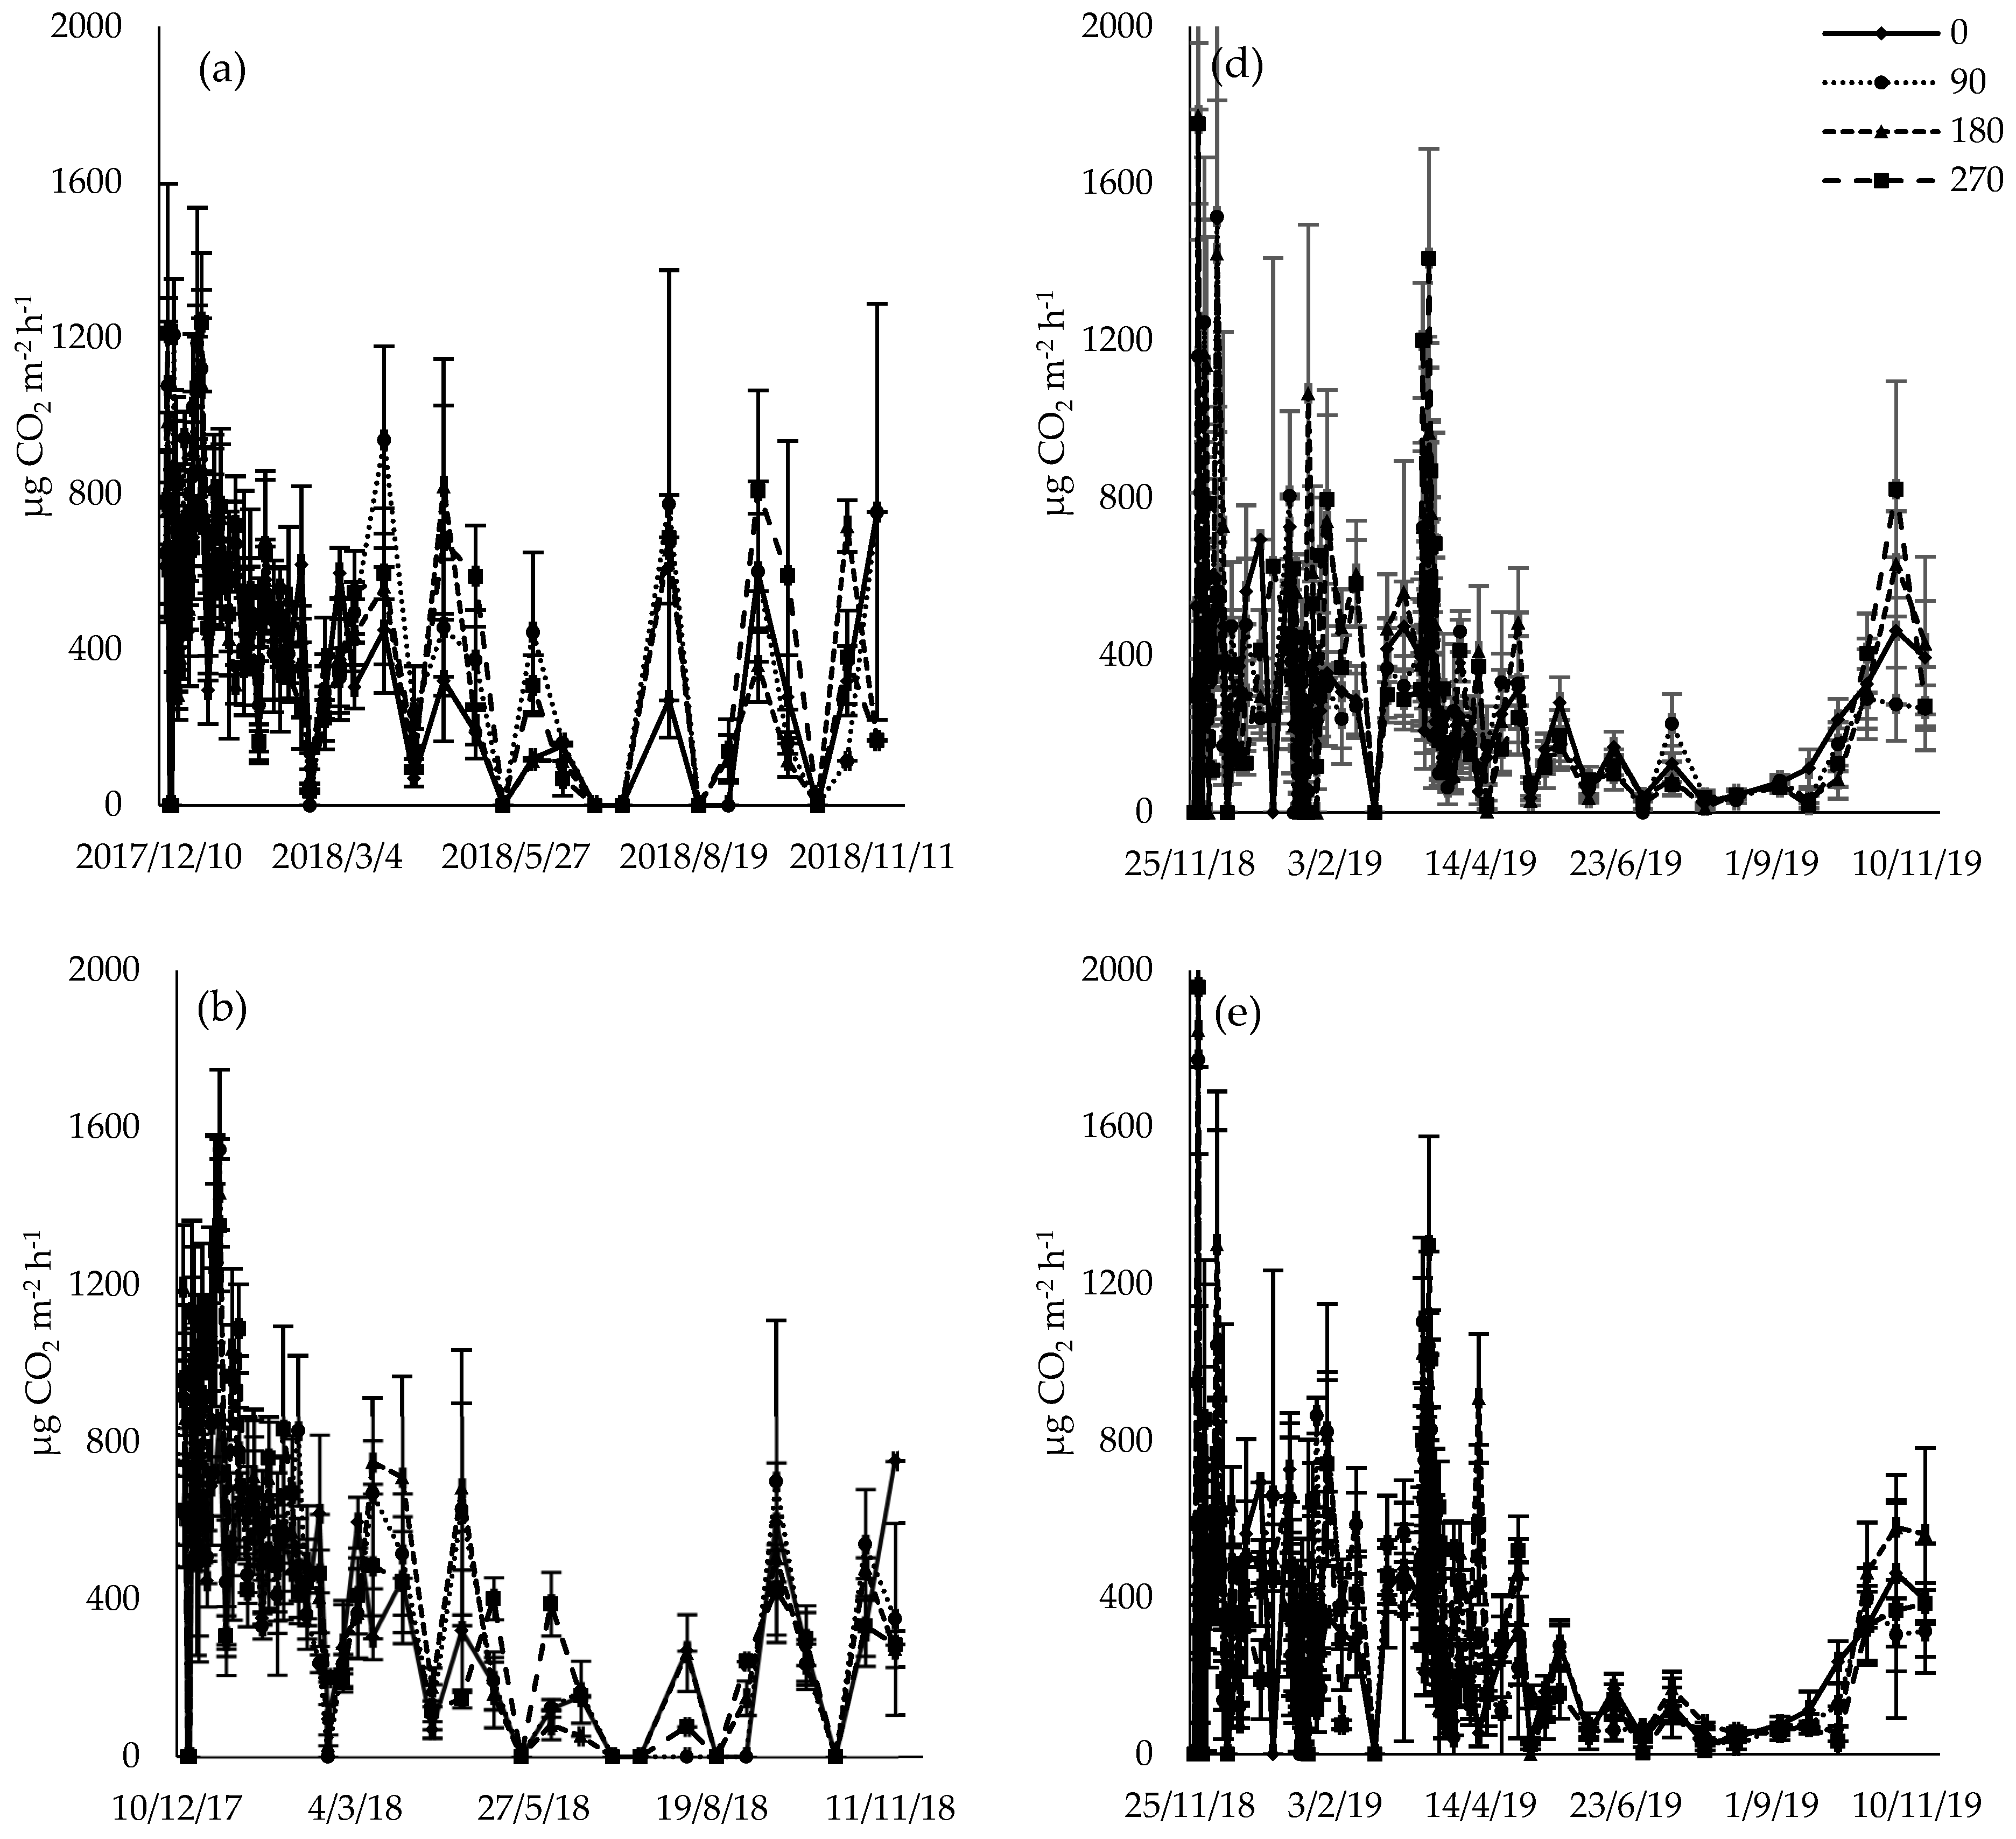
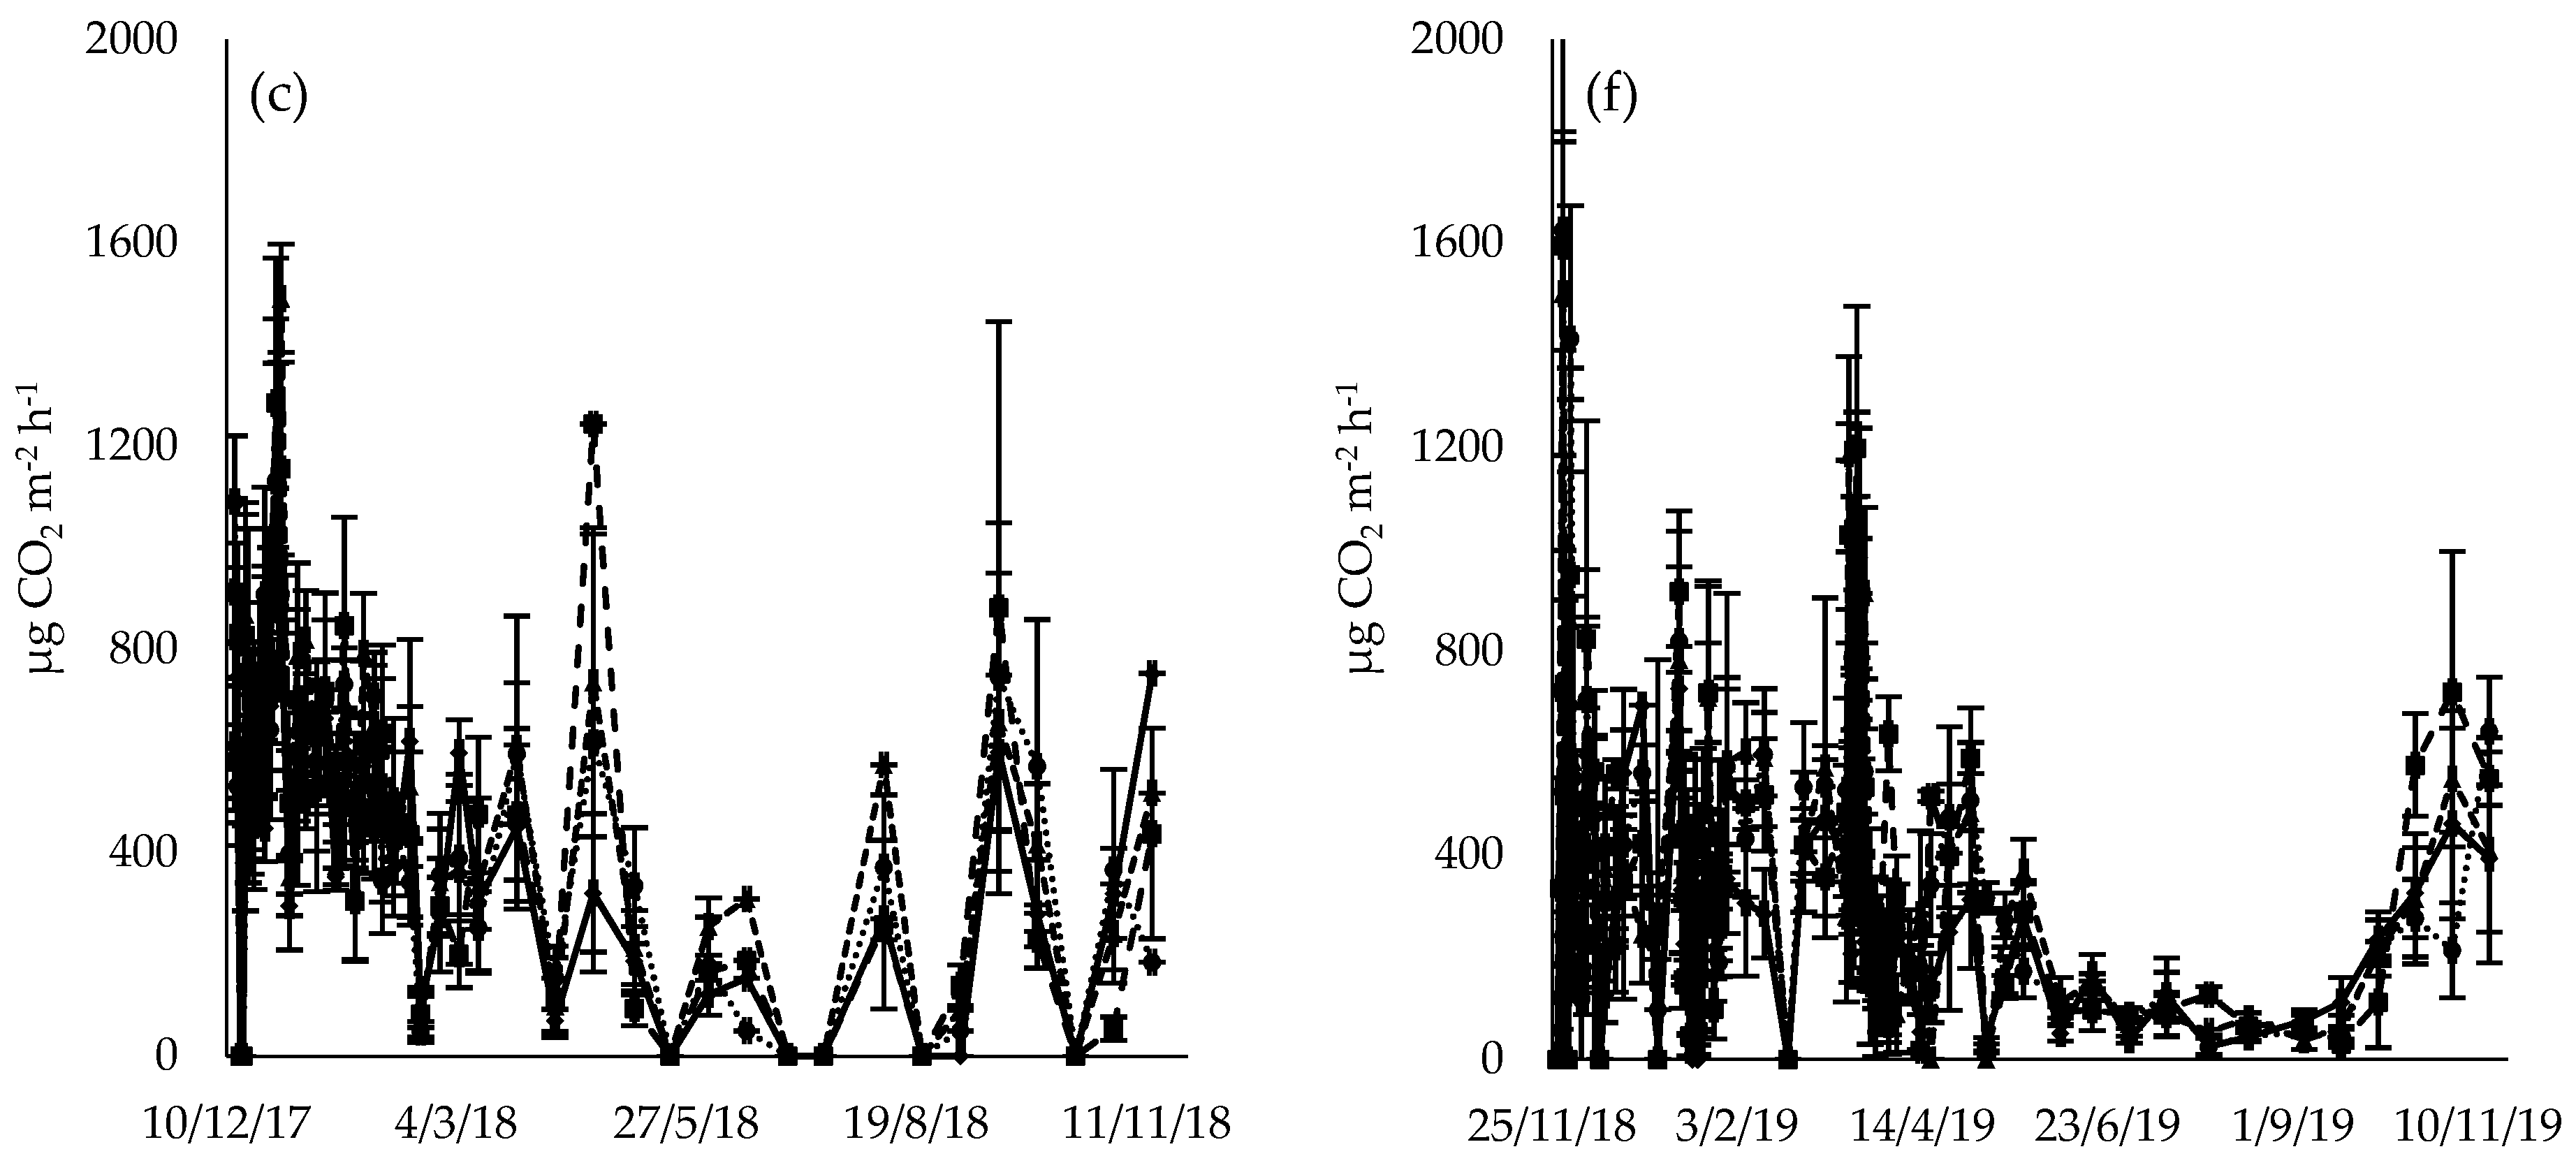
3.3. CO2 Flux
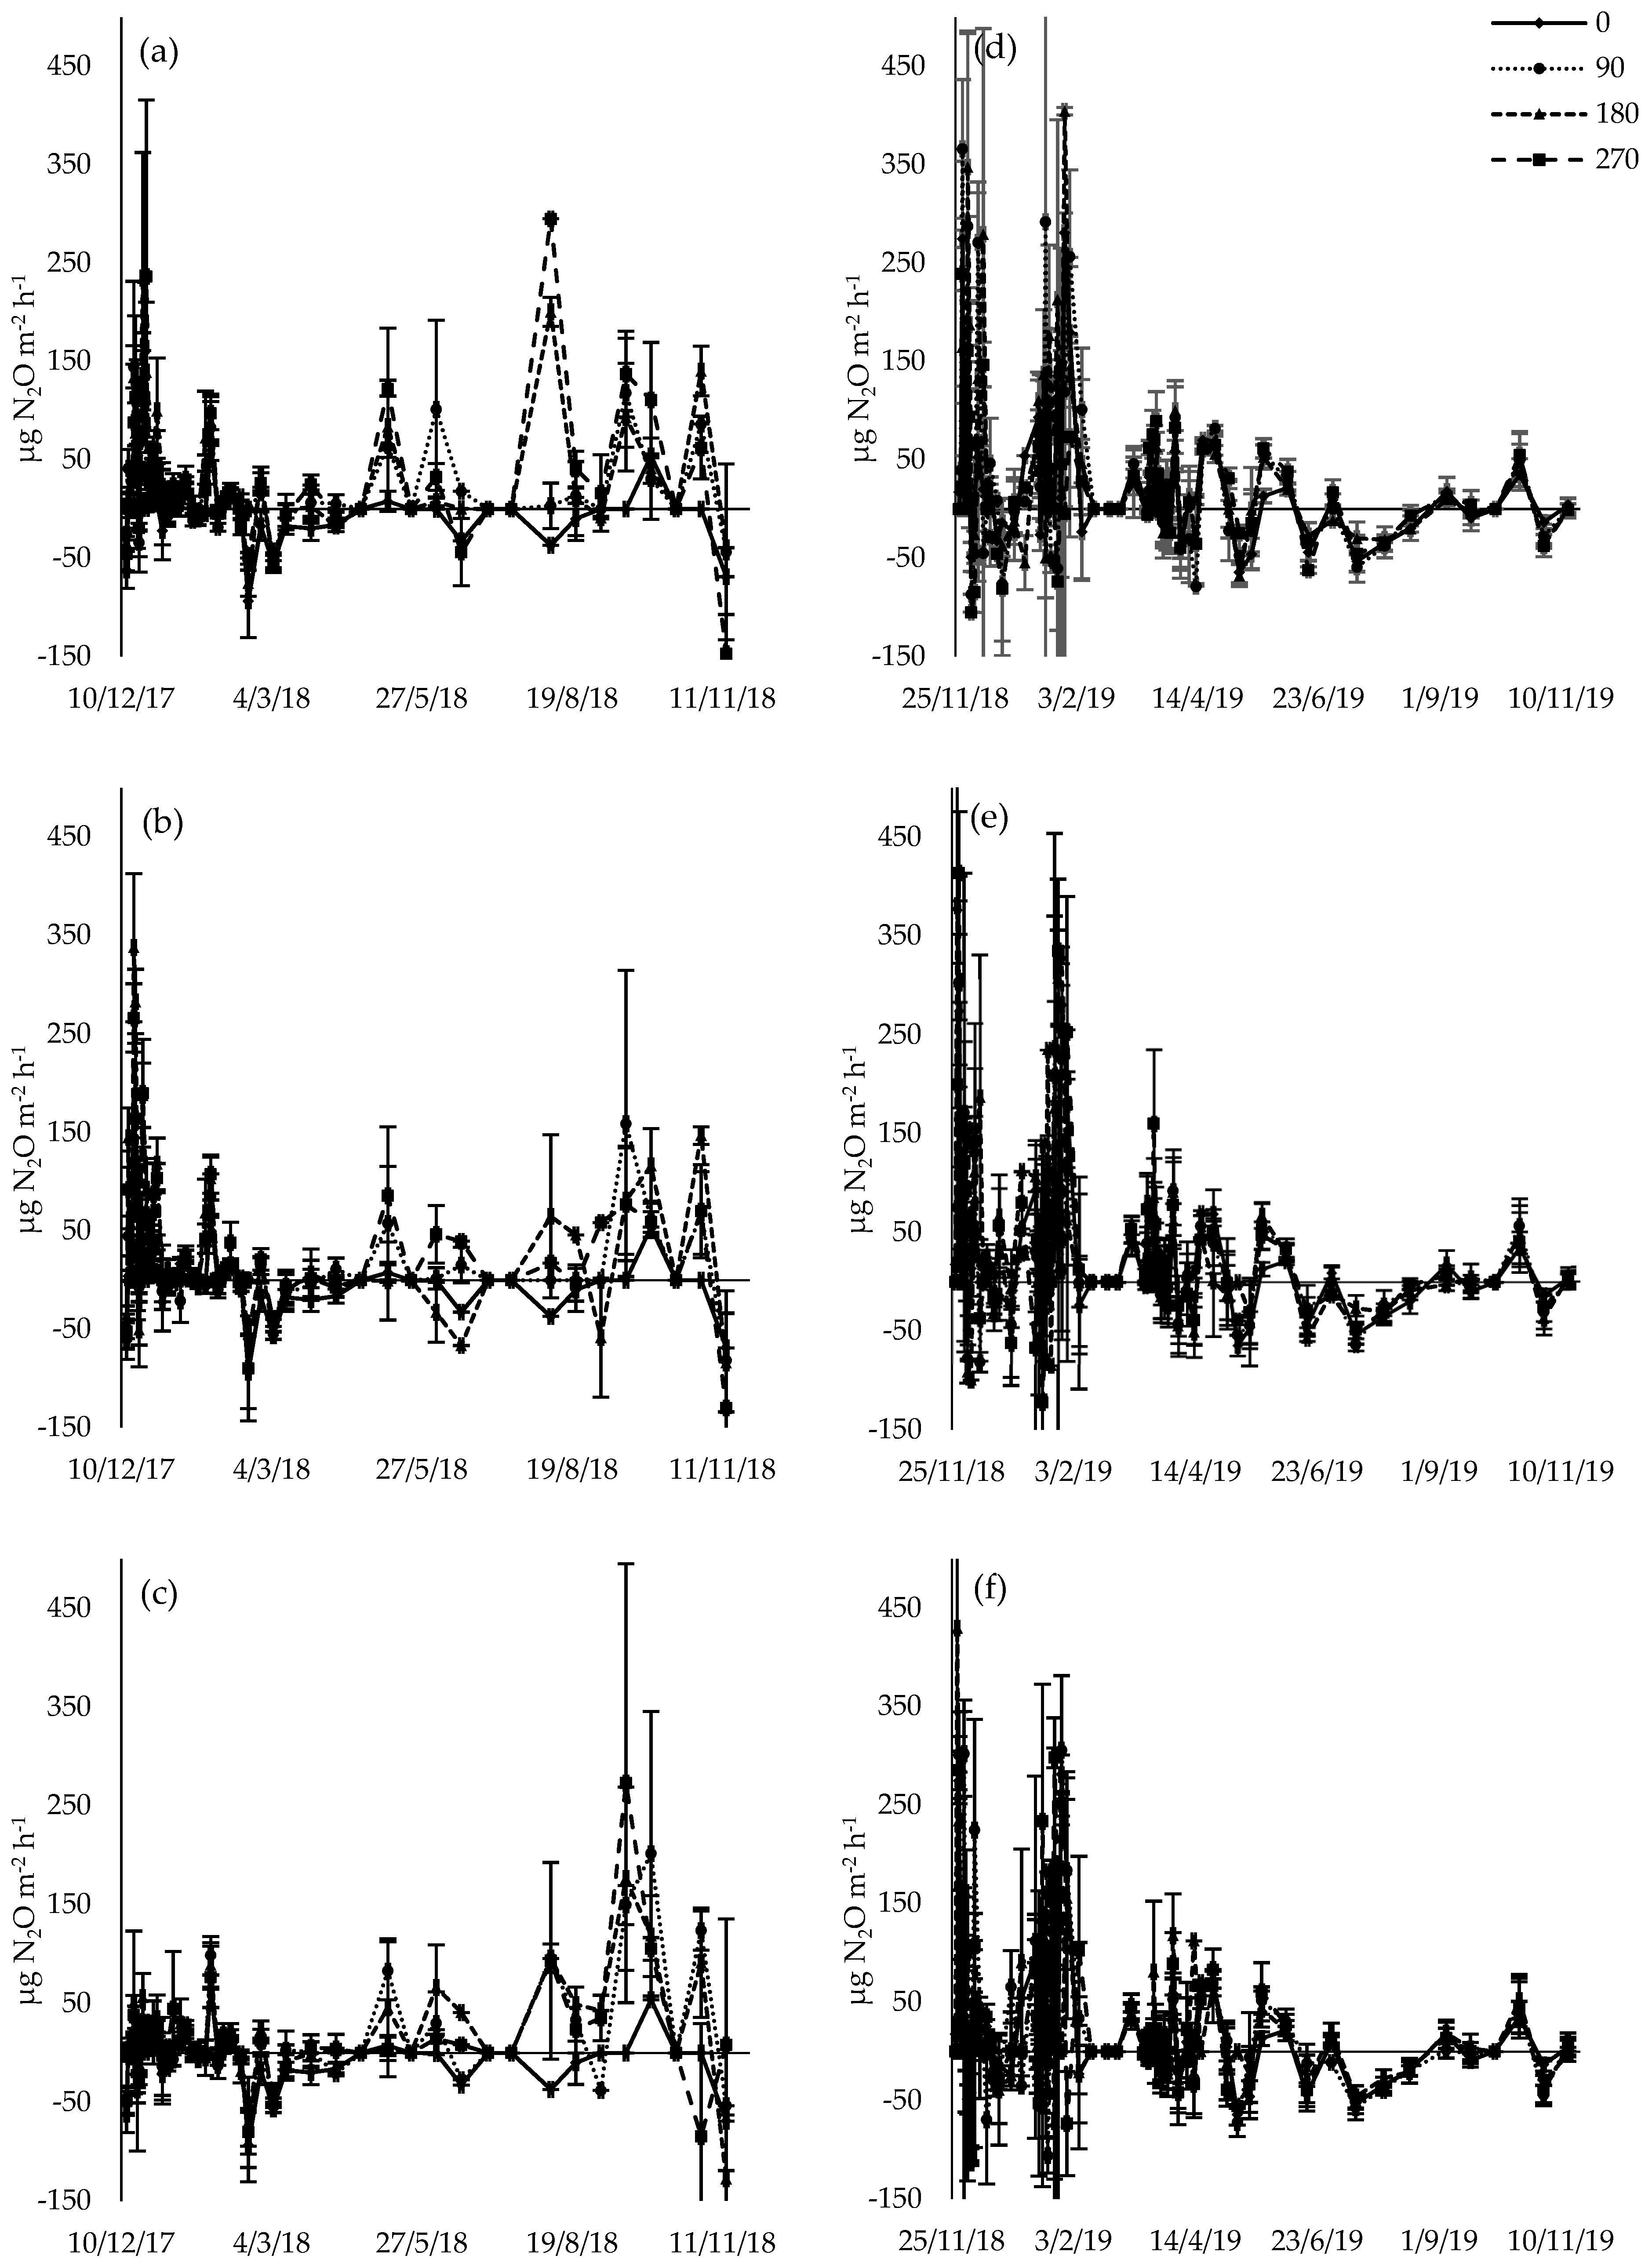
3.4. N2O Flux
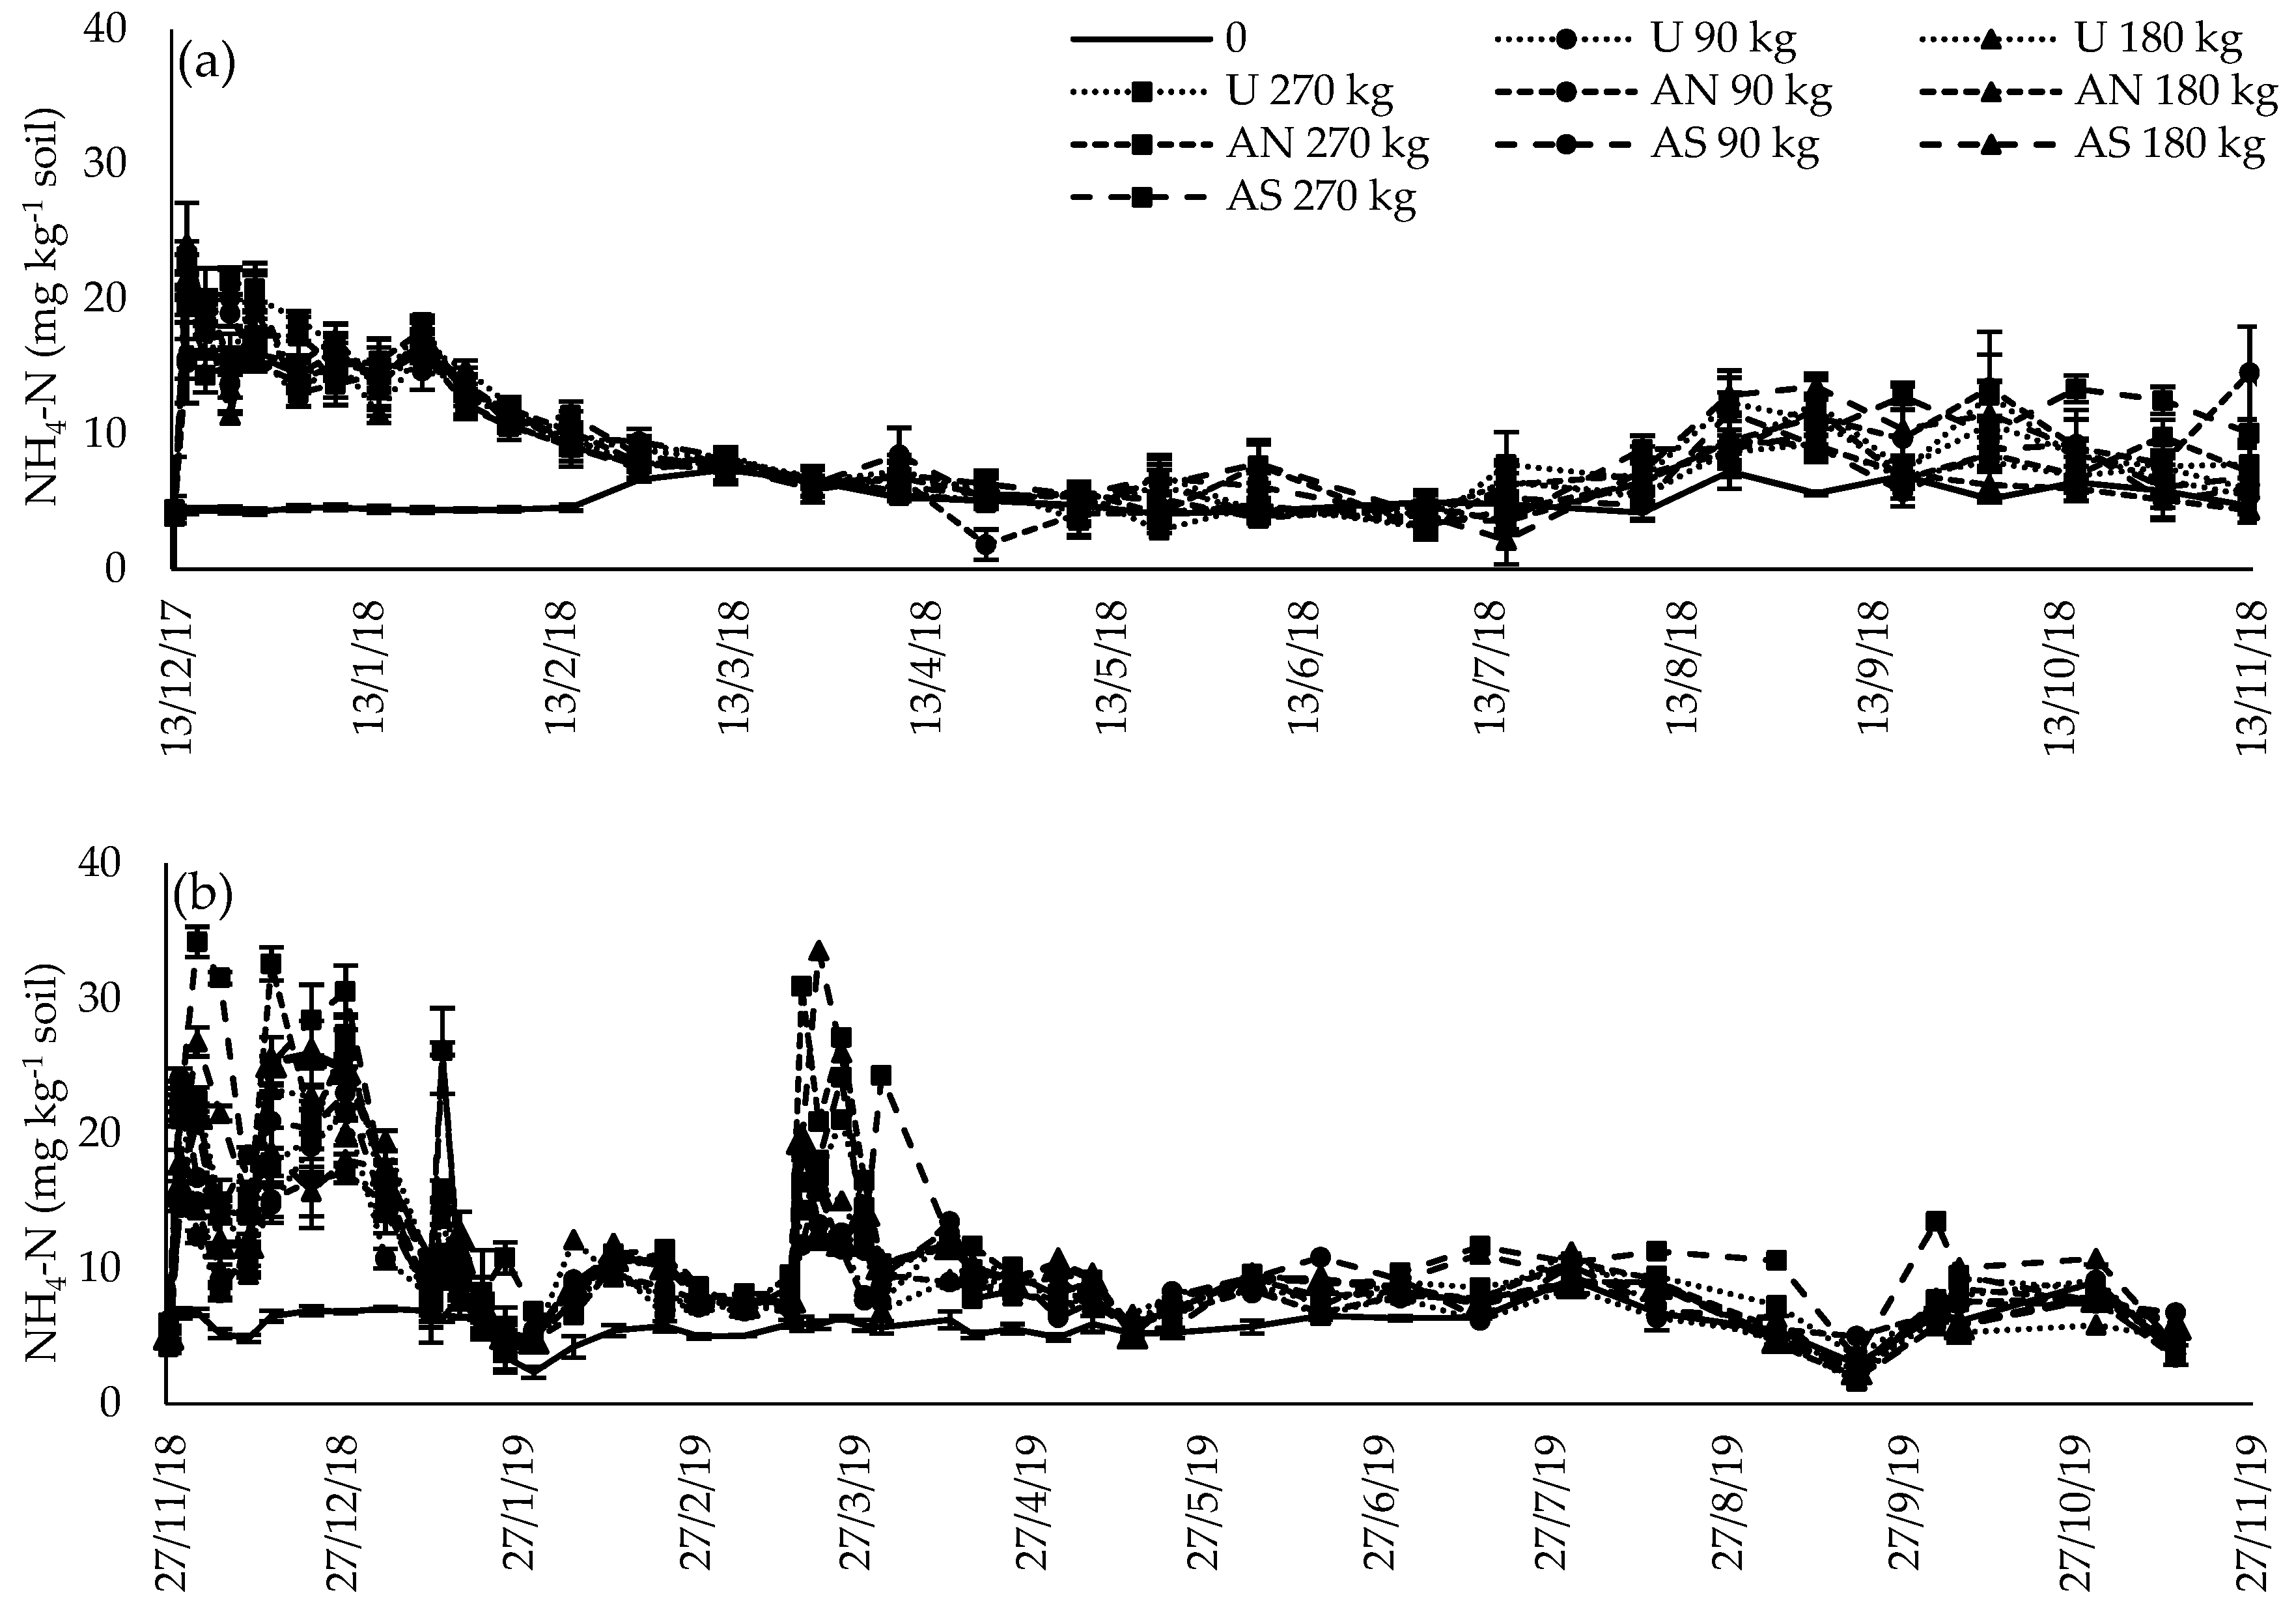
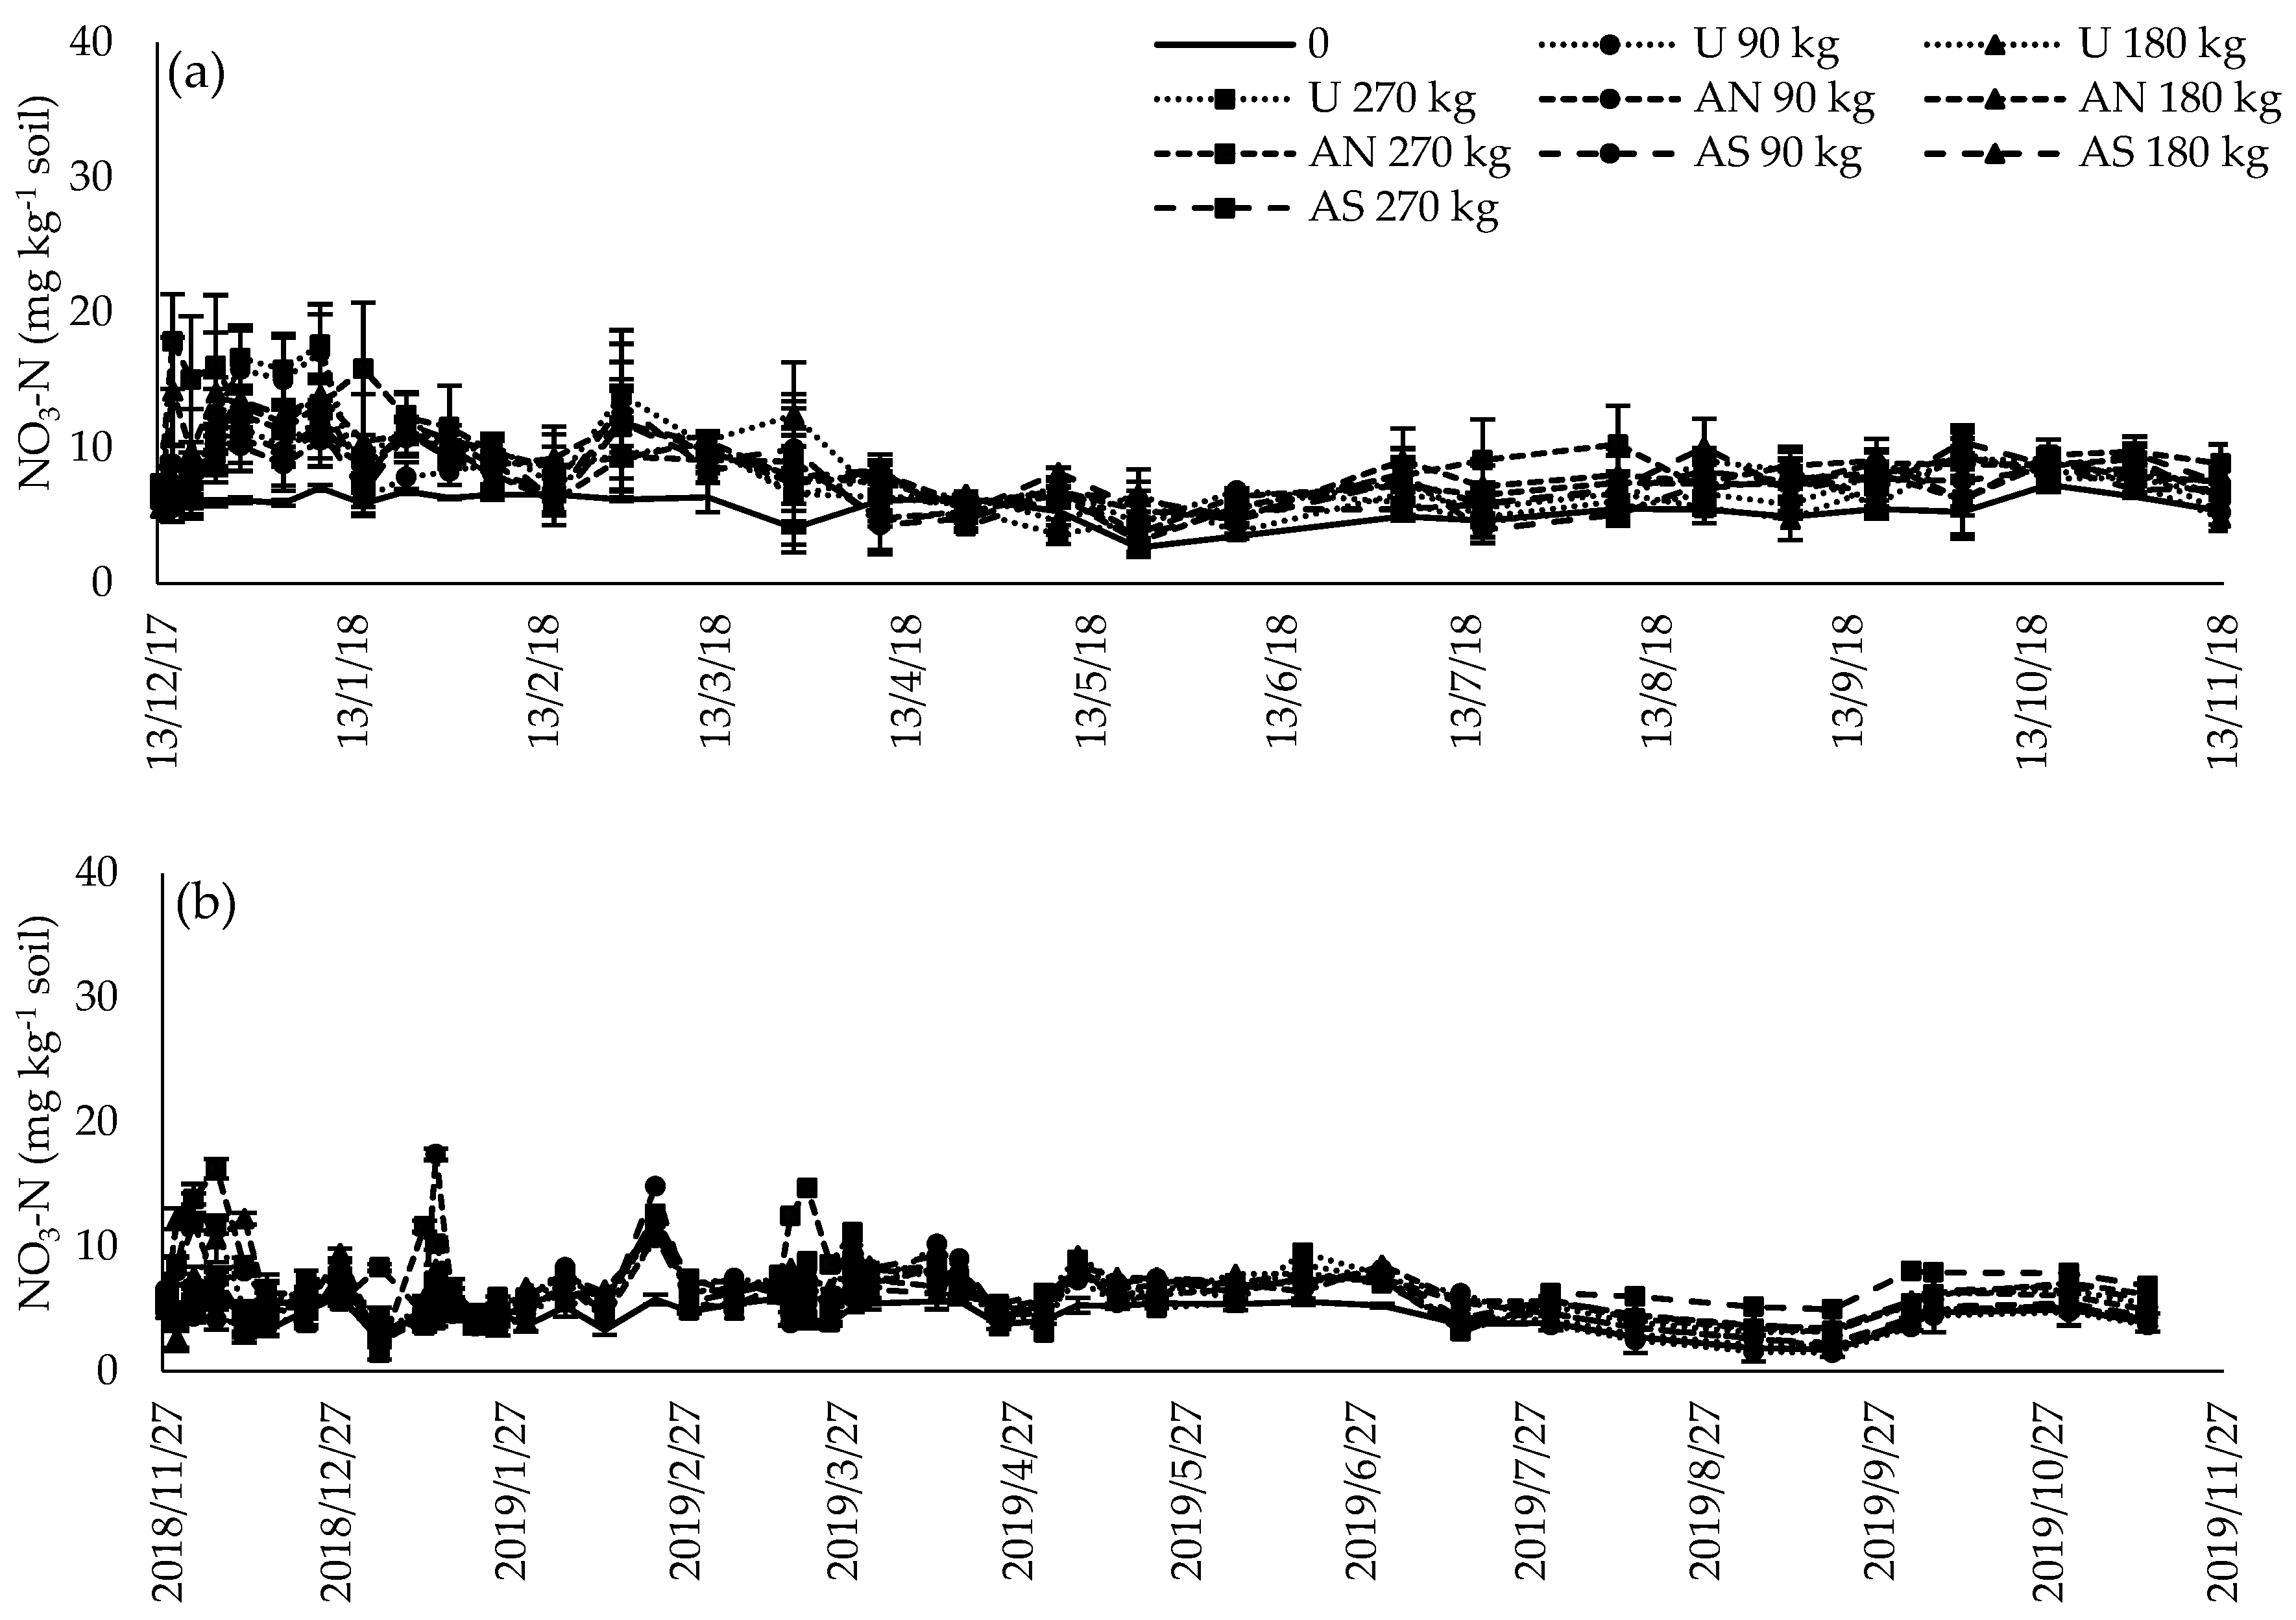
3.5. Inorganic N
3.6. Cumulative GHG Emissions
4. Discussion
4.1. CH4 Flux
4.2. CO2 Flux
4.3. N2O Flux
4.4. Cumulative GHG Emissions
4.5. EFs of N2O
5. Conclusions
Author Contributions
Funding
Institutional Review Board Statement
Informed Consent Statement
Data Availability Statement
Acknowledgments
Conflicts of Interest
References
- Dupas, E.; Buzetti, S.; Rabêlo, F.H.S.; Sarto, A.L.; Cheng, N.C.; Galindo, F.S.; Dinalli, R.P.; de Niro Gazola, R. Nitrogen recovery, use efficiency, dry matter yield, and chemical composition of palisade grass fertilized with nitrogen sources in the Cerrado biome. Aust. J. Crop Sci. 2016, 10, 1330. [Google Scholar] [CrossRef]
- Pires, M.V.; da Cunha, D.A.; Carlos, S.M.; Costa, M.H. Nitrogen-use efficiency, nitrous oxide emissions, and cereal production in Brazil: Current trends and forecasts. PLoS ONE 2015, 10, e0135234. [Google Scholar] [CrossRef]
- Tiritan, C.S.; Bull, L.T.; Crusciol, C.A.C.; Carmeis Filho, A.C.A.; Fernandes, D.M.; Nascente, A.S. Tillage system and lime application in a tropical region: Soil chemical fertility and corn yield in succession to degraded pastures. Soil Till. Res. 2016, 155, 437–447. [Google Scholar] [CrossRef]
- Intergovernmental Panel on Climate Change—IPCC. Climate Change 2013: The Physical Science Basis—Contribution of Working Group I to the Fifth Assessment Report of the Intergovernamental Panel on Climate Change; Cambridge University Press: New York, NY, USA, 2013. [Google Scholar]
- Firestone, M.K.; Davidson, E.A. Microbiological basis of NO and N2O production and consumption in soil. Exch. Trace Gases Terr. Ecosyst. Atmos. 1989, 47, 7–21. [Google Scholar]
- Kreuzer, M.; Hindrichen, I.K. Methane mitigation in ruminants by dictary means: The role of their methane emission from manure. Int. Congr. 2006, 1293, 199–208. [Google Scholar] [CrossRef]
- De Morais, R.F.; Boddey, R.M.; Urquiaga, S.; Jantalia, C.P.; Alves, B.J. Ammonia volatilization and nitrous oxide emissions during soil preparation and N fertilization of elephant grass (Pennisetum purpureum Schum.). Soil Biol. Biochem. 2013, 64, 80–88. [Google Scholar] [CrossRef]
- Cardoso, A.S.; Oliveira, S.C.; Janusckiewicz, E.R.; Brito, L.F.; Morgado, E.S.; Reis, R.A.; Ruggieri, A.C. Seasonal effects on ammonia, nitrous oxide, and methane emissions for beef cattle excreta and urea fertilizer applied to a tropical pasture. Soil Tillage Res. 2019, 194, 104341. [Google Scholar] [CrossRef]
- Nascimento, A.F.; de Oliveira, C.M.; Pedreira, B.C.; Pereira, D.H.; Rodrigues, R.R.A. Nitrous oxide emissions and forage accumulation in the Brazilian Amazon forage-livestock systems submitted to N input strategies. Grassl. Sci. 2020. [Google Scholar] [CrossRef]
- Raposo, E.; Brito, L.F.; Janusckiewicz, E.R.; Oliveira, L.F.; Versuti, J.; Assumpção, F.M.; Cardoso, A.S.; Sinischalchi, D.; Delevatti, L.M.; Malheiros, E.B.; et al. Greenhouse gases emissions from tropical grasslands affected by nitrogen fertilizer management. Agron. J. 2020. [Google Scholar] [CrossRef]
- Li, X.G.; Jia, B.; Lv, J.; Ma, Q.; Kuzyakov, Y.; Li, F.M. Nitrogen fertilization decreases the decomposition of soil organic matter and plant residues in planted soils. Soil Biol. Biochem. 2017, 112, 47–55. [Google Scholar] [CrossRef]
- Skinner, R.H. Nitrogen fertilization effects on pasture photosynthesis, respiration, and ecosystem carbon content. Agric. Ecosyst. Environ. 2013, 172, 35–41. [Google Scholar] [CrossRef]
- Zhang, L.; Hou, L.; Guo, D.; Li, L.; Xu, X. Interactive impacts of nitrogen input and water amendment on growing season fluxes of CO2, CH4, and N2O in a semiarid grassland, Northern China. Sci. Total Environ. 2017, 578, 523–534. [Google Scholar] [CrossRef]
- Vilarrasa-Nogué, M.; Teira-Esmatges, M.R.; Pascual, M.; Villar, J.M.; Rufat, J. Effect of N dose, fertilisation duration and application of a nitrification inhibitor on GHG emissions from a peach orchard. Sci. Total Environ. 2020, 699, 134042. [Google Scholar] [CrossRef]
- Liu, L.; Greaver, T.L.A. Review of nitrogen enrichment effects on three biogenic GHGs: The CO2 sink may be largely offset by stimulated N2O and CH4 emission. Ecol. Lett. 2009, 12, 1103–1117. [Google Scholar] [CrossRef]
- Hawthorne, I.; Johnson, M.S.; Jassal, R.S.; Black, T.A.; Grant, N.J.; Smukler, S.M. Application of biochar and nitrogen influences fluxes of CO2, CH4 and N2O in a forest soil. J. Environ. Manag. 2017, 192, 203–214. [Google Scholar] [CrossRef] [PubMed]
- Cardoso, A.S.; Quintana, B.G.; Janusckiewicz, E.R.; Brito, L.F.; da Silva Morgado, E.; Reis, R.A.; Ruggieri, A.C. How do methane rates vary with soil moisture and compaction, N compound and rate, and dung addition in a tropical soil? Int. J. Biometeorol. 2019, 63, 1533–1540. [Google Scholar] [CrossRef] [PubMed]
- Peters, M.; Rao, I.M.; Fisher, M.J.; Subbarao, G.; Martens, S.; Herrero, G.; van der Hoek, R.; Schultze-Kraft, R.; Miles, J.; Castro, A.; et al. Tropical forage-based systems to mitigate greenhouse gas emissions. In Eco-Efficiency: From Vision to Reality; Hershey, C.H., Ed.; Centro Internacional de Agricultura Tropical (CIAT): Valle del Cauca, Colombia, 2012. [Google Scholar]
- IPCC. Refinement to the 2006 IPCC Guidelines for National Greenhouse Gas Inventories. Guidelines for National Greenhouse Gas Inventories; Chapter 11; International Panel on Climate Change (IPCC): Geneva, Switzerland, 2019; Volume 4. [Google Scholar]
- Bruulsema, T.; Lemunyon, J.; Herz, B. Know your fertilizer rights. Crops Soils 2009, 42, 13–18. [Google Scholar]
- Del Grosso, S.J.; Ojima, D.S.; Parton, W.J.; Stehfest, E.; Heistemann, M.; DeAngelo, B.; Rose, S. Global scale DAYCENT model analysis of greenhouse gas emissions and mitigation strategies for cropped soils. Glob. Planet. Chang. 2009, 67, 44–50. [Google Scholar] [CrossRef]
- Signor, D.; Cerri, C.E.P. Nitrous oxide emissions in agricultural soils: A review. Pesqui. Agropecu. Trop. 2013, 43, 322–338. [Google Scholar] [CrossRef]
- Tan, I.Y.; van Es, H.M.; Duxbury, J.M.; Melkonian, J.J.; Schindelbeck, R.R.; Geohring, L.D.; Moebius, B.N. Single-event nitrous oxide losses under maize production as affected by soil type, tillage, rotation, and fertilization. Soil Tillage Res. 2009, 102, 19–26. [Google Scholar] [CrossRef]
- Viard, A.; Hénault, C.; Rochette, P.; Kuikman, P.; Flénet, F.; Cellier, P. Le protoxyde d’azote (N2O), puissant gaz à effet de serre émis par les sols agricoles: Méthodes d’inventaire et leviers de réduction. Ol. Corps Gras Lipides 2013, 20, 108–118. [Google Scholar] [CrossRef][Green Version]
- IUSS. World Reference Base for Soil Resources 2006; World Soil Resources Reports; FAO: Rome, Italy, 2006. [Google Scholar]
- Mosier, A.R. Chamber and isotope techniques. In Exchange of Traces Gases between Terrestrial Ecosystems and the Atmosphere: Report of the Dahlem Workshop; Andreae, M.O., Schimel, D.S., Eds.; Wiley: Weinheim, Germany, 1989; pp. 175–187. [Google Scholar]
- Alves, B.J.; Smith, K.A.; Flores, R.A.; Cardoso, A.S.; Oliveira, W.R.; Jantalia, C.P.; Boddey, R.M. Selection of the most suitable sampling time for static chambers for the estimation of daily mean N2O flux from soils. Soil Biol. Biochem. 2012, 46, 129–135. [Google Scholar] [CrossRef]
- Cardoso, A.S.; Alves, B.J.R.; Urquiaga, S.; Boddey, R.M. Effect of volume of urine and mas of feces on N2O and CH4 emissions of dairy cow excreta in a tropical pasture. Anim. Product. Sci. 2018. [Google Scholar] [CrossRef]
- Kempers, A.J.; Zweers, A. Ammonium determination in soil extracts by the salicylate method. Commun. Soil Sci. Plant Anal. 1986, 17, 715–723. [Google Scholar] [CrossRef]
- Miyazawa, M.; Pavan, M.A.; Block, M.F.M. Spectrophotometry determination of nitrate in soil extracts without chemical reduction. Pesqui. Agropecu. Bras. 1985, 20, 29–133. [Google Scholar]
- Olsen, K.K. Multiple wavelength ultraviolet determinations of nitrate concentration, method comparisons from the preakness brook monitoring project, October 2005 to October 2006. Water Air Soil Pollut. 2008, 187, 195–202. [Google Scholar] [CrossRef]
- André, R.G.B.; da Anunciação, Y.M.T. A precipitação pluvial provável em Jaboticabal, São Paulo. Agrometeoros 2018, 25. [Google Scholar] [CrossRef]
- Boon, P.I.; Mitchell, A. Methanogenesis in the sediments of an Australian freshwater wetland, Comparison with aerobic decay, and factors controlling methanogenesis. FEMS Microbiol. Ecol. 1995, 18, 175–190. [Google Scholar] [CrossRef]
- Miyajima, T.; Wada, E.; Hanba, Y.T.; Vijarnsorn, P. Anaerobic mineralization of indigenous organic matters and methanogenesis in tropical wetland soils. Geochim. Cosmochim. Acta 1997, 61, 3739–3751. [Google Scholar] [CrossRef]
- Rath, A.K.; Ramakrishnan, B.; Sethunathan, N. Temperature dependence of methane production in tropical rice soils. Geomicrobiol. J. 2002, 19, 581–592. [Google Scholar] [CrossRef]
- Mazzetto, A.M.; Barneze, A.S.; Feigl, B.J.; Van Groenigen, J.W.; Oenema, O.; Cerri, C.C. Temperature and moisture affect methane and nitrous oxide emission from bovine manure patches in tropical conditions. Soil Biol. Biochem. 2014, 76, 242–248. [Google Scholar] [CrossRef]
- Castro, M.S.; Steudler, P.A.; Melillo, J.M.; Aber, J.D.; Bowden, R.D. Factors controlling atmospheric methane consumption by temperate forest soils. Glob. Biogeochem. Cycles 1995, 9, 1–10. [Google Scholar] [CrossRef]
- Dasselaar, P.A.; Beusichem, M.V.; Oenema, O. Effects of soil moisture content and temperature on methane uptake by grassland on sandy soils. Plant Soil 1998, 204, 213–222. [Google Scholar] [CrossRef]
- Cardoso, A.S.; Brito, L.F.; Janusckiewicz, E.R.; Morgado, E.S.; Barbero, R.P.; Koscheck, J.F.W.; Reis, R.A.; Ruggieri, A.C. Impact of grazing intensity and seasons on greenhouse gas emissions in tropical grassland. Ecosystems 2017, 20, 845–859. [Google Scholar] [CrossRef]
- Jiang, C.; Yu, G.; Fang, H.; Cao, G.; Li, Y. Short-term effect of increasing nitrogen deposition on CO2, CH4 and N2O fluxes in an alpine meadow on the Qinghai-Tibetan Plateau, China. Atmos. Environ. 2010, 44, 2920–2926. [Google Scholar] [CrossRef]
- Agostinetto, D.; Fleck, N.G.; Rizzardi, M.A.; Balbinot, A.A., Jr. Potencial de emissão de metano em lavouras de arroz irrigado. Cienc. Rural 2002, 32, 1073–1081. [Google Scholar] [CrossRef][Green Version]
- Westermann, P. Temperature regulation of methanogenesis in wetlands. Chemosphere 1993, 26, 321–328. [Google Scholar] [CrossRef]
- Wagner, D.; Pfeiffer, E.M. Two temperature optima of methane production in a typical soil of the Elbe river marshland. FEMS Microbiol. Ecol. 1997, 22, 145–153. [Google Scholar] [CrossRef][Green Version]
- Chin, K.; Lukow, T.; Conrad, R. Effect of temperature on structure and function of the methanogenic archaeal community in an anoxic rice field soil. Appl. Environ. Microbiol. 1999, 65, 2341–2349. [Google Scholar] [CrossRef]
- Chu, H.; Hosen, Y.; Yagi, K. NO, N2O, CH4 and CO2 fluxes in winter barley field of Japanese Andisol as affected by N fertilizer management. Soil Biol. Biochem. 2007, 39, 330–339. [Google Scholar] [CrossRef]
- Beltran, I.; Van der Weerden, T.J.; Alfaro, M.A.; Amon, B.; De Klein, C.A.; Grace, P.; Hafner, S.; Hassouna, M.; Hutchings, N.; Krol, D.J.; et al. DataMan: A global dataset of nitrous oxide and ammonia emission factors for excreta deposited by livestock and land-applied manure. J. Environ. Qual. 2021, 1–16. [Google Scholar] [CrossRef]
- Hütsch, B.W. Methane oxidation in arable soil as inhibited by ammonium, nitrite and organic manure with respect to soil pH. Biol. Fertil. Soils 1998, 28, 27–35. [Google Scholar] [CrossRef]
- Hütsch, B.W. Methane oxidation in non-flooded soils as affected by crop production—Invited paper. Eur. J. Soil Sci. 2001, 14, 237–260. [Google Scholar] [CrossRef]
- Brito, L.F.; Azenha, M.V.; Janusckiewicz, E.R.; Cardoso, A.S.; Morgado, E.S.; Malheiros, E.B.; La Scala, N.; Reis, R.A.; Ruggieri, A.C. Seasonal fluctuation of soil carbon dioxide emission in differently managed pastures. Agron. J. 2015, 107, 957–962. [Google Scholar] [CrossRef]
- Moreira, F.S.; Siqueira, J.S. Microbiologia e Bioquímica do Solo; Editora UFLA: Lavras, Brazil, 2006; pp. 721–729. [Google Scholar]
- Epron, D.; Bosc, A.; Bonal, D.; Freycon, V. Spatial variation of soil respiration across a topographic gradient in a tropical rain forest in French Guiana. J. Trop. Ecol. 2006, 22, 565–574. [Google Scholar] [CrossRef]
- Lal, R. Challenges and opportunities in soil organic matter research. Eur. J. Soil Sci. 2009, 60, 158–169. [Google Scholar] [CrossRef]
- Pulrolnik, K. Transformações do Carbono no Solo; Embrapa Cerrados: Brasilia, Brazil, 2009; pp. 1–28. [Google Scholar]
- Neff, J.C.; Townsend, A.R.; Gleixner, G.; Lehman, S.J.; Turnbull, J.; Bowman, W.D. Variable effects of nitrogen additions on the stability and turnover of soil carbon. Nature 2002, 419, 915–917. [Google Scholar] [CrossRef] [PubMed]
- Potthoff, M.; Dyckmans, J.; Flessa, H.; Muhs, A.; Beese, F.; Joergensen, R.G. Dynamics of maize (Zea mays L.) leaf straw mineralization as affected by the presence of soil and the availability of nitrogen. Soil Biol. Biochem. 2005, 37, 1259–1266. [Google Scholar] [CrossRef]
- Fang, H.; Cheng, S.; Yu, G.; Zheng, J.; Zhang, P.; Xu, M.; Yang, X. Responses of CO2 efflux from an alpine meadow soil on the Qinghai Tibetan Plateau to multi-form and low-level N addition. Plant Soil 2012, 351, 177–190. [Google Scholar] [CrossRef]
- Corrêa, D.C.C.; da SilvaCardoso, A.; Siniscalchi, D.; Ruggieri, A.C.; Reis, R.A. Influência de fertilizantes nitrogenados no acúmulo de forragem em pastos de Capim-Marandu no noroeste paulista. In Proceedings of the IX Simpósio sobre Manejo Estratégico de Pastagens e VI Simpósio Internacional sobre Produção Animal em Pastejo, Viçosa, Brazil, 20–21 January 2019. [Google Scholar]
- Tian, Z.; Wang, J.J.; Liu, S.; Zhang, Z.; Dodla, S.K.; Myers, G. Application effects of coated urea and urease and nitrification inhibitors on ammonia and greenhouse gas emissions from a subtropical cotton field of the Mississippi delta region. Sci. Total Environ. 2015, 533, 329–338. [Google Scholar] [CrossRef] [PubMed]
- Song, L.; Tian, P.; Zhang, J.; Jin, G. Effects of three years of simulated nitrogen deposition on soil nitrogen dynamics and greenhouse gas emissions in a Korean pine plantation of northeast China. Sci. Total Environ. 2017, 609, 1303–1311. [Google Scholar] [CrossRef]
- Grant, B.; Smith, W.N.; Desjardins, R.; Lemke, R.; Li, C. Estimated N2O and CO2 emissions as influenced by agricultural practices in Canada. Clim. Chang. 2004, 65, 315–332. [Google Scholar] [CrossRef]
- Dobbie, K.E.; Smith, K.A. The effects of temperature, water-filled pore space and land use on N2O emissions from an imperfectly drained gleysol. Eur. J. Soil Sci. 2001, 52, 667–673. [Google Scholar] [CrossRef]
- Nogueira, A.K.D.S.; Rodrigues, R.D.A.; Castro, B.S.; Nogueira, T.F.; da Silva, J.J.; Behling, M.; Mombacha, M.; Armacoloa, N.; Silveira, J.G. Emissões de óxido nitroso e metano do solo em áreas de recuperação de pastagens na Amazônia matogrossense. Química Nova 2015, 38, 937–943. [Google Scholar] [CrossRef]
- Van Der Weerden, T.J.; Luo, J.; Di, H.J.; Podolyan, A.; Phillips, R.L.; Saggar, S.; Klein, C.A.M.; Cox, N.; Ettema, P.; Rys, G. Nitrous oxide emissions from urea fertiliser and effluent with and without inhibitors applied to pasture. Agric. Ecosyst. Environ. 2016, 219, 58–70. [Google Scholar] [CrossRef]
- Jantalia, C.P.; dos Santos, H.P.; Urquiaga, S.; Boddey, R.M.; Alves, B.J. Fluxes of nitrous oxide from soil under different crop rotations and tillage systems in the South of Brazil. Nutr. Cycl. Agroecosyst. 2008, 82, 161–173. [Google Scholar] [CrossRef]
- Piva, J.T.; Dieckow, J.; Bayer, C.; Zanatta, J.A.; de Moraes, A.; Tomazi, M.; PAuletti, V.; Barth, G.; de Cassia Piccolo, M. Soil gaseous N2O and CH4 emissions and carbon pool due to integrated crop-livestock in a subtropical Ferralsol. Agric. Ecosyst. Environ. 2014, 190, 87–93. [Google Scholar] [CrossRef]
- Campanha, M.M.; de Oliveira, A.D.; Marriel, I.E.; Neto, M.M.G.; Malaquias, J.V.; Landau, E.C.; Albuquerque Filho, M.R.de; Ribeiro, F.P.; de Carvalho, A.M. Effect of soil tillage and N fertilization on N2O mitigation in maize in the Brazilian Cerrado. Sci. Total Environ. 2019, 692, 1165–1174. [Google Scholar] [CrossRef] [PubMed]
- Nascimento, A.F.; Rodrigues, R.D.A.R.; Silveira, J.G.D.; Silva, J.J.N.D.; Daniel, V.D.C.; Segatto, E.R. Nitrous oxide emissions from a tropical Oxisol under monocultures and an integrated system in the Southern Amazon–Brazil. Rev. Bras. Cienc. Solo 2020, 44. [Google Scholar] [CrossRef]
- Smith, K.A.; Ball, T.; Conen, F.; Dobbie, K.E.; Massheder, J.; Rey, A. Exchange of greenhouse gases between soil and atmosphere: Interactions of soil physical factors and biological processes. Eur. J. Soil Sci. 2003, 54, 779–791. [Google Scholar] [CrossRef]
- Bento, C.B.; Filoso, S.; Pitombo, L.M.; Cantarella, H.; Rossetto, R.; Martinelli, L.A.; do Carmo, J.B. Impacts of sugarcane agriculture expansion over low-intensity cattle ranch pasture in Brazil on greenhouse gases. J. Environ. Manag. 2018, 206, 980–988. [Google Scholar] [CrossRef] [PubMed]
- Bouwman, A.F. Exchange of greenhouse gases between terrestrial ecosystems and the atmosphere. In Soils and the Greenhouse Effect; Bouwman, A.F., Ed.; John Wiley: New York, NY, USA, 1990; pp. 61–127. [Google Scholar]
- Ryden, J.C. Denitrification loss from a grassland soil in the field receiving different rates of nitrogen as ammonium nitrate. J. Soil Sci. 1983, 34, 355–365. [Google Scholar] [CrossRef]
- Kirschbaum, M.U.F. The temperature dependence of organic-matter decomposition: Still a topic of debate. Soil Biol. Biochem. 2006, 38, 2510–2518. [Google Scholar] [CrossRef]
- Burton, D.L.; Li, X.; Grant, C.A. Influence of fertilizer nitrogen source and management practice on N2O emissions from two Black Chernozemic soils. Can. J. Soil Sci. 2008, 88, 219–227. [Google Scholar] [CrossRef]
- Bédard, C.; Knowles, R. Physiology, biochemistry, and specific inhibitors of CH4, NH4+, and CO oxidation by methanotrophs and nitrifiers. Microbiol. Mol. Biol. Rev. 1989, 53, 68–84. [Google Scholar] [CrossRef]
- Veldkamp, E.; Weitz, A.M.; Keller, M. Management effects on methane fluxes in humid tropical pasture soils. Soil Biol. Biochem. 2001, 33, 1493–1499. [Google Scholar] [CrossRef]
- Alho, C.F.B.V.; Cardoso, A.D.S.; Alves, B.J.R.; Novotny, E.H. Biochar and soil nitrous oxide emissions. Pesqui. Agropecu. Bras. 2012, 47, 722–725. [Google Scholar] [CrossRef]
- Mohanty, S.R.; Bodelier, P.L.; Floris, V.; Conrad, R. Differential effects of nitrogenous fertilizers on methane-consuming microbes in rice field and forest soils. Appl. Environ. Microbiol. 2006, 72, 1346–1354. [Google Scholar] [CrossRef]
- Tao, B.; Liu, C.; Zhang, B.; Dong, J. Effects of inorganic and organic nitrogen additions on CO2 emissions in the coastal wetlands of the Yellow River Delta, China. Atmos. Environ. 2018, 185, 159–167. [Google Scholar] [CrossRef]
- Chi, Y.; Yang, P.; Ren, S.; Ma, N.; Yang, J.; Xu, Y. Effects of fertilizer types and water quality on carbon dioxide emissions from soil in wheat-maize rotations. Sci. Total Environ. 2020, 698, 134010. [Google Scholar] [CrossRef] [PubMed]
- Liu, S.; Wang, J.J.; Tian, Z.; Wang, X.; Harrison, S. Ammonia and greenhouse gas emissions from a subtropical wheat field under different nitrogen fertilization strategies. J. Environ. Sci. 2017, 57, 196–210. [Google Scholar] [CrossRef]
- Li, K.; Gong, Y.; Song, W.; He, G.; Hu, Y.; Tian, C.; Liu, X. Responses of CH4, CO2 and N2O fluxes to increasing nitrogen deposition in alpine grassland of the Tianshan Mountains. Chemosphere 2012, 88, 140–143. [Google Scholar] [CrossRef]
- Liyanage, A.; Grace, P.R.; Scheer, C.; de Rosa, D.; Ranwala, S.; Rowlings, D.W. Carbon limits non-linear response of nitrous oxide (N2O) to increasing N inputs in a highly-weathered tropical soil in Sri Lanka. Agric. Ecosyst. Environ. 2020, 292, 106808. [Google Scholar] [CrossRef]
- Barton, L.; Kiese, R.; Gatter, D.; Butterbach-Bahl, K.; Buck, R.; Hinz, C.; Murphy, D.V. Nitrous oxide emissions from a cropped soil in a semi-arid climate. Glob. Chang. Biol. 2008, 14, 177–192. [Google Scholar] [CrossRef]
- Zebarth, B.J.; Rochette, P.; Burton, D.L.; Price, M. Effect of fertilizer nitrogen management on N2O emissions in commercial corn fields. Can. J. Soil Sci. 2008, 88, 189–195. [Google Scholar] [CrossRef]
- Vanderzaag, A.C.; Jayasundara, S.; Wagner-Riddle, C. Strategies to mitigate nitrous oxide emissions from land applied manure. Anim. Feed Sci. Technol. 2011, 166, 464–479. [Google Scholar] [CrossRef]
- Bayer, C.; Gomes, J.; Zanatta, J.A.; Vieira, F.C.B.; de Cássia Piccolo, M.; Dieckow, J.; Six, J. Soil nitrous oxide emissions as affected by long-term tillage, cropping systems and nitrogen fertilization in Southern Brazil. Soil Tillage Res. 2015, 146, 213–222. [Google Scholar] [CrossRef]
- Cardoso, A.S.; Junqueira, J.B.; Reis, R.A.; Ruggieri, A.C. How do greenhouse gas emissions vary with biofertilizer type and soil temperature and moisture in a tropical grassland? Pedosphere 2020, 30, 607–617. [Google Scholar] [CrossRef]
- Dos Santos, C.A.; de Rezende, C.P.; Boddey, R.M.; Jantalia, C.P.; Urquiaga, S.; Alves, B.J.R. Nitrous Oxide Emissions from Fertiliser and Cattle Excreta Applied to a Palisade Grass Pasture with and without Urea Fertilisation or Mixed with the Forage Legume Desmodium heterocarpon. (Manuscript in preparation).


| Experiment | P resin | S–SO42– | OM | pH CaCl2 | K+ | Ca2+ | Mg2+ | H+Al | Al3+ | CEC | V% |
|---|---|---|---|---|---|---|---|---|---|---|---|
| mg/dm3 | g/dm3 | mg/dm3 | |||||||||
| 1 | 12 | 16 | 25 | 5.6 | 26 | 36 | 11 | 22 | 0 | 72 | 69 |
| 2 | 21 | 11 | 27 | 5.1 | 58 | 37 | 17 | 38 | 0 | 98 | 61 |
| Factor Effect | Experiment 1 | Experiment 2 | ||||
|---|---|---|---|---|---|---|
| (+, − or NS) a | N2O | CH4 | CO2 | N2O | CH4 | CO2 |
| T° Air | +(<0.01) | +(<0.01) | +(<0.001) | −(<0.001) | −(<0.01) | +(<0.001) |
| T° Soil | −(<0.001) | +(<0.001) | −(<0.001) | +(<0.001) | NS | NS |
| % WFPS | NS | NS | NS | −(<0.001) | −(<0.01) | +(<0.001) |
| Moisture | NS | NS | NS | +(<0.001) | NS | NS |
| NH4–N | +(<0.01) | +(<0.001) | +(<0.05) | −(<0.05) | −(<0.01) | NS |
| NO3–N | NS | NS | +(<0.01) | NS | NS | NS |
| CO2 | +(<0.001) | +(<0.001) | +(<0.001) | +(<0.001) | ||
| GHG | Source | Emission | |
|---|---|---|---|
| Experiment 1 | Experiment 2 | ||
| CH4 | Urea | 25.5 ± 82.4a | 20.4 ± 83.6a |
| Ammonium nitrate | 177.4 ± 90.4a | –3.9 ± 88.4a | |
| Ammonium sulfate | 162.6 ± 109.2a | 2.6 ± 134.8a | |
| Control | –99.8 ± 40.8a | –77.4 ± 33.5a | |
| CO2 | Urea | 2208.9 ± 102.8a | 1796.2 ± 132.3a |
| Ammonium nitrate | 2206.5 ± 77.6a | 1887.7 ± 99.6a | |
| Ammonium sulfate | 2115.6 ± 113.4a | 2043.5 ± 170.3a | |
| Control | 1523.4 ± 66.6b | 1486.6 ± 170.3a | |
| N2O | Urea | 153.4 ± 27.7a | 94.7 ± 20.0a |
| Ammonium nitrate | 122.0 ± 33.7ab | 75.3 ± 14.9a | |
| Ammonium sulfate | 158.9 ± 28.9a | 68.7 ± 16.1a | |
| Control | –26.6 ± 4.2b | 31.7 ± 22.9a | |
| Treatment | Experiment 1 | Experiment 2 |
|---|---|---|
| Urea | 1.00 ± 0.2a | 0.35 ± 0.1a |
| Ammonium nitrate | 0.83 ± 0.2a | 0.24 ± 0.1a |
| Ammonium sulfate | 1.03 ± 0.3a | 0.21 ± 0.1a |
Publisher’s Note: MDPI stays neutral with regard to jurisdictional claims in published maps and institutional affiliations. |
© 2021 by the authors. Licensee MDPI, Basel, Switzerland. This article is an open access article distributed under the terms and conditions of the Creative Commons Attribution (CC BY) license (https://creativecommons.org/licenses/by/4.0/).
Share and Cite
Corrêa, D.C.d.C.; Cardoso, A.d.S.; Ferreira, M.R.; Siniscalchi, D.; Toniello, A.D.; Lima, G.C.d.; Reis, R.A.; Ruggieri, A.C. Are CH4, CO2, and N2O Emissions from Soil Affected by the Sources and Doses of N in Warm-Season Pasture? Atmosphere 2021, 12, 697. https://doi.org/10.3390/atmos12060697
Corrêa DCdC, Cardoso AdS, Ferreira MR, Siniscalchi D, Toniello AD, Lima GCd, Reis RA, Ruggieri AC. Are CH4, CO2, and N2O Emissions from Soil Affected by the Sources and Doses of N in Warm-Season Pasture? Atmosphere. 2021; 12(6):697. https://doi.org/10.3390/atmos12060697
Chicago/Turabian StyleCorrêa, Darlena Caroline da Cruz, Abmael da Silva Cardoso, Mariane Rodrigues Ferreira, Débora Siniscalchi, Ariana Desie Toniello, Gilmar Cotrin de Lima, Ricardo Andrade Reis, and Ana Claudia Ruggieri. 2021. "Are CH4, CO2, and N2O Emissions from Soil Affected by the Sources and Doses of N in Warm-Season Pasture?" Atmosphere 12, no. 6: 697. https://doi.org/10.3390/atmos12060697
APA StyleCorrêa, D. C. d. C., Cardoso, A. d. S., Ferreira, M. R., Siniscalchi, D., Toniello, A. D., Lima, G. C. d., Reis, R. A., & Ruggieri, A. C. (2021). Are CH4, CO2, and N2O Emissions from Soil Affected by the Sources and Doses of N in Warm-Season Pasture? Atmosphere, 12(6), 697. https://doi.org/10.3390/atmos12060697