Article

Characteristics of Summer Hourly Extreme Precipitation Events and Its Local Environmental Influencing Factors in Beijing under Urbanization Background

1
Institute of Urban Meteorology, China Meteorological Administration, Beijing 100089, China
2
Hubei Key Laboratory for Heavy Rain Monitoring and Warning Research, Institute of Heavy Rain, China Meteorological Administration, Wuhan 430205, China
*
Author to whom correspondence should be addressed.
Atmosphere 2021, 12(5), 632; https://doi.org/10.3390/atmos12050632
Submission received: 19 April 2021 / Revised: 8 May 2021 / Accepted: 12 May 2021 / Published: 16 May 2021
(This article belongs to the Special Issue Hazards, Urbanization, and Climate Change)

Abstract

:
Studies on urban extreme precipitation and its influencing factors are significant for prevention and reduction of meteorological disasters; however, few studies focus on hourly extreme precipitation (HEP) events due to the limitation of observation. By using the summer hourly precipitation data in Beijing from 1980 to 2020, the spatial distribution and temporal variation of HEP as well as its local environmental influencing factors are investigated. It is found that both summer precipitation amount and frequency of HEP are affected by topography, with high values in windward slope area. The summer precipitation amount of HEP is 160–200 mm, accounting for 42–47% of the annual summer precipitation amount, while the frequency proportion of HEP is only 5.5–6.0%. Although the summer precipitation amount and frequency in Beijing both decrease in the past 41 years, those for HEP present an opposite trend mainly due to the increasing HEP since 2003 and this is a phenomenon worthy of attention. A similar bimodal pattern in diurnal variation is found for the summer precipitation amount and frequency of HEP, with two peaks in 19–22 LT and 01–05 LT, respectively, indicating that HEPs are more concentrated in the evening and early morning especially in urban area. Moreover, the urbanization process of Beijing is consistent with the change trend of HEP, implying that the stronger the urban heat island intensity (UHI), the higher the probability of HEP. Furthermore, the convergence lines of terrain are also conducive to local heavy rainfall, and lower tropospheric stability (LTS) and convective available potential energy (CAPE) as well as aerosols may also affect HEP in Beijing.

1. Introduction

In the past 40 years, with rapid global urbanization, the urbanization process led by human activities has often been accompanied by the rapid succession of underlying surfaces and the changes in thermodynamic transmission and hydraulic penetration [1]. Many studies have found that urbanization has an impact on precipitation [2,3]. Urban extreme precipitation, as a kind of low-probability and high-impact event, can lead to serious damage to human society. It is of great significance to investigate the variation of urban extreme precipitation and its influencing factors for improving meteorological prediction capability and safeguarding social and economic development.
Myhre et al. [4] found that with the warming of climate, the global extreme precipitation events are changing in a stronger direction, which will lead to the change of extreme precipitation more widely than the global mean precipitation. It is pointed out that the comprehensive influence of the change of extreme precipitation frequency and intensity on the total precipitation amount should be explored. At the same time, Sub-daily extreme precipitation events are becoming more and more important [5,6], because they play an important role in flood disasters in densely populated and economically developed areas, such as megacities. Therefore, the frequency, intensity and sustainability of extreme precipitation on sub-diurnal scale have been paid attention to in the world, such as Singapore and the UK [7,8]. According to Mukherjee et al. [9], the frequency and intensity of extreme precipitation events in India are increasing from 1979 to 2015, and human-made warming has an important contribution to the rise of extreme precipitation frequency. It is suggested that reducing the effect of urban heat island is helpful to alleviate the impacts of extreme weather events [10].
Some researchers have studied the distribution and variation of extreme precipitation in China and the impact of urbanization on it. It is found that there is a significant regional difference in the distribution of extreme precipitation in East China [11]. Kong et al. [12] pointed out that the hourly precipitation amount at rainstorms levels in China increased during the period 1991–2010. Yu [13] found that there are complex spatial differences in the diurnal variation of heavy precipitation in China. The daily peak of precipitation occurs in the afternoon in south and northeast China, at midnight in the Tibetan Plateau and east China, in the early morning along the middle reaches of the Yangtze River, and there are two peaks in the early morning and in the afternoon for the Yangtze-Huaihe and Huanghe-Huaihe regions. It is believed that these differences are related to monsoons, boundary-layer inertia oscillations and regional heat flux forcing [14]. Although there are differences in weather background and seasonal variation, the increase in urban precipitation is related to rapid urbanization, in which urban heat island may play an important role in the initial process of convection and exacerbate extreme precipitation [15]. The simulation results show that urbanization can cause the change of surface energy balance, which leads to the increase in extreme precipitation [16]. These studies reveal some characteristics of extreme precipitation from different perspectives, but on the whole, the understanding of urban extreme precipitation is still insufficient, and the prediction ability of urban extreme precipitation is still limited. Although sub-daily extreme precipitation is one of the important causes of flood disasters in big cities, due to the limited observation, there is little understanding on the distribution characteristics and long-term change trend of sub-daily extreme precipitation event in big cities as well as its local environmental influencing factors.
Beijing is one of the largest and fastest developing cities in the world. From 1980 to 2019, the built-up area of Beijing expanded from 304 km2 to 1485 km2, with mountains surrounding the west and northeast. The heavy rainfall events in Beijing mainly occur in summer, with the characteristics of short duration and high hourly precipitation. These heavy rainfall events, such as those on 23 June 2011, 21 July 2012 and 20 July 2016, have caused huge losses to people’s lives and property. Therefore, it is of great significance to study the physical process, climate characteristics and influence mechanism of heavy precipitation events for preventing and reducing meteorological disasters. In the past, researches on heavy precipitation in Beijing mostly focus on the analysis of weather cases and the application of new detection data [17,18], but few studies are reported on the long-term trend of hourly extreme precipitation (HEP) events and the impact of urbanization. Recently, based on the data of 18 stations in Beijing from 1977 to 2013, Yuan et al. [19] found that the contribution of HEP to total precipitation amount presents an increasing trend, which may be related to the rapid urbanization of Beijing and urban heat island, and they pointed out that the comprehensive influence of multiple factors on short-term extreme precipitation should be paid attention to.
In this study, based on the summer hourly observations at 20 conventional meteorological stations in Beijing during 1980–2020, correlation analysis and attribution analysis are adopted to investigate the spatial distribution and temporal variation of HEP in Beijing, and the influence of local environment on HEP is also explored. This study can do good for understanding the change law of urban HEP under special topography and may provide hints for improving urban meteorological forecasting ability.
This paper is organized as the follows. Section 2 introduces the materials and methods. The spatial distribution and temporal variation of HEP as well as the impact of local environment on HEP are analyzed in Section 3. Section 4 presents the discussion on the results. Additionally, the main conclusions are drawn in Section 5.

2. Materials and Methods

The summer (June–August) hourly observations of 20 stations in the Beijing area during 1980–2020 are obtained from the Beijing Meteorological Information Center (BMIC) of Beijing Meteorological Service. Before being released, this dataset is subject to strict quality controls by the BMIC. The missing records of each station in summer are less than 2%. Besides hourly precipitation data, the hourly observations of 2 m temperature, surface wind and radiation flux are also employed in this study. In addition, the urban development data including urban population and urban built-up area are from Beijing statistical yearbook, which is an annual book published by China Statistical Press.
The 95th percentile is used to delimit HEP, and the threshold is calculated by using all hourly records gathered during the period from 1981 to 2010, according to the standard reference period of 30 years defined by WMO. With the defined threshold, the HEP changes are obtained based on derived information covering the entire period during 1980–2020. Figure 1 presents the terrain height and urban impervious surface in Beijing as well as the calculated HEP thresholds of 20 stations. It can be seen that Beijing is plain in the southeast and surrounded by mountains in the west, north and northeast. The urban impervious surface of Beijing occupies a large area of about 1485 km2. As shown in Figure 1, the mean HEP threshold of the west and north mountain stations is 8.7 mm/h, and those of the suburban and urban stations in plain area are 12.2 and 11.5 mm/h, respectively.
In order to distinguish urban area from suburban ones objectively and properly, satellite image data from the US Defense Meteorological Satellite Program (DMSP)/Operational Linescan System (OLS) is utilized in this study. The DMSP/OLS nighttime light images can reflect comprehensive information, which covers the traffic roads, residential areas and other built-up areas. According to Wang et al. [20] and Yuan et al. [19], the observation stations in this study are divided into three types: urban area, suburban area and mountain area (Figure 1). The urban heat island intensity (UHI) is defined as the difference between the mean temperature of 11 urban stations and that of 3 suburban stations. In the analysis of interannual variation, in order to eliminate the high-frequency noise in the sequence, the 5-point moving average is calculated. The isolines in following figures are obtained from the station data by the inverse distance space weighted interpolation method of GRADS (Grid Analysis Display System).
Additionally, LTS and CAPE are used to describe the thermo-dynamical state of the low-level troposphere. For LTS, it is defined as the differences in potential temperature (θ) between the free troposphere (700 hPa) and the surface (1000 hPa), i.e., LTS = θ700hPa – θ1000hPa, and high LTS values generally signify the existence of a strong inversion layer, indicative of a relatively stable atmospheric stratification at low level [21]. ERA5 reanalysis data in 1 h intervals from European Centre for Medium-Range Weather Forecasts is used to calculate LTS and CAPE.

3. Results

3.1. Spatial Distributions of Summer Precipitation and HEP

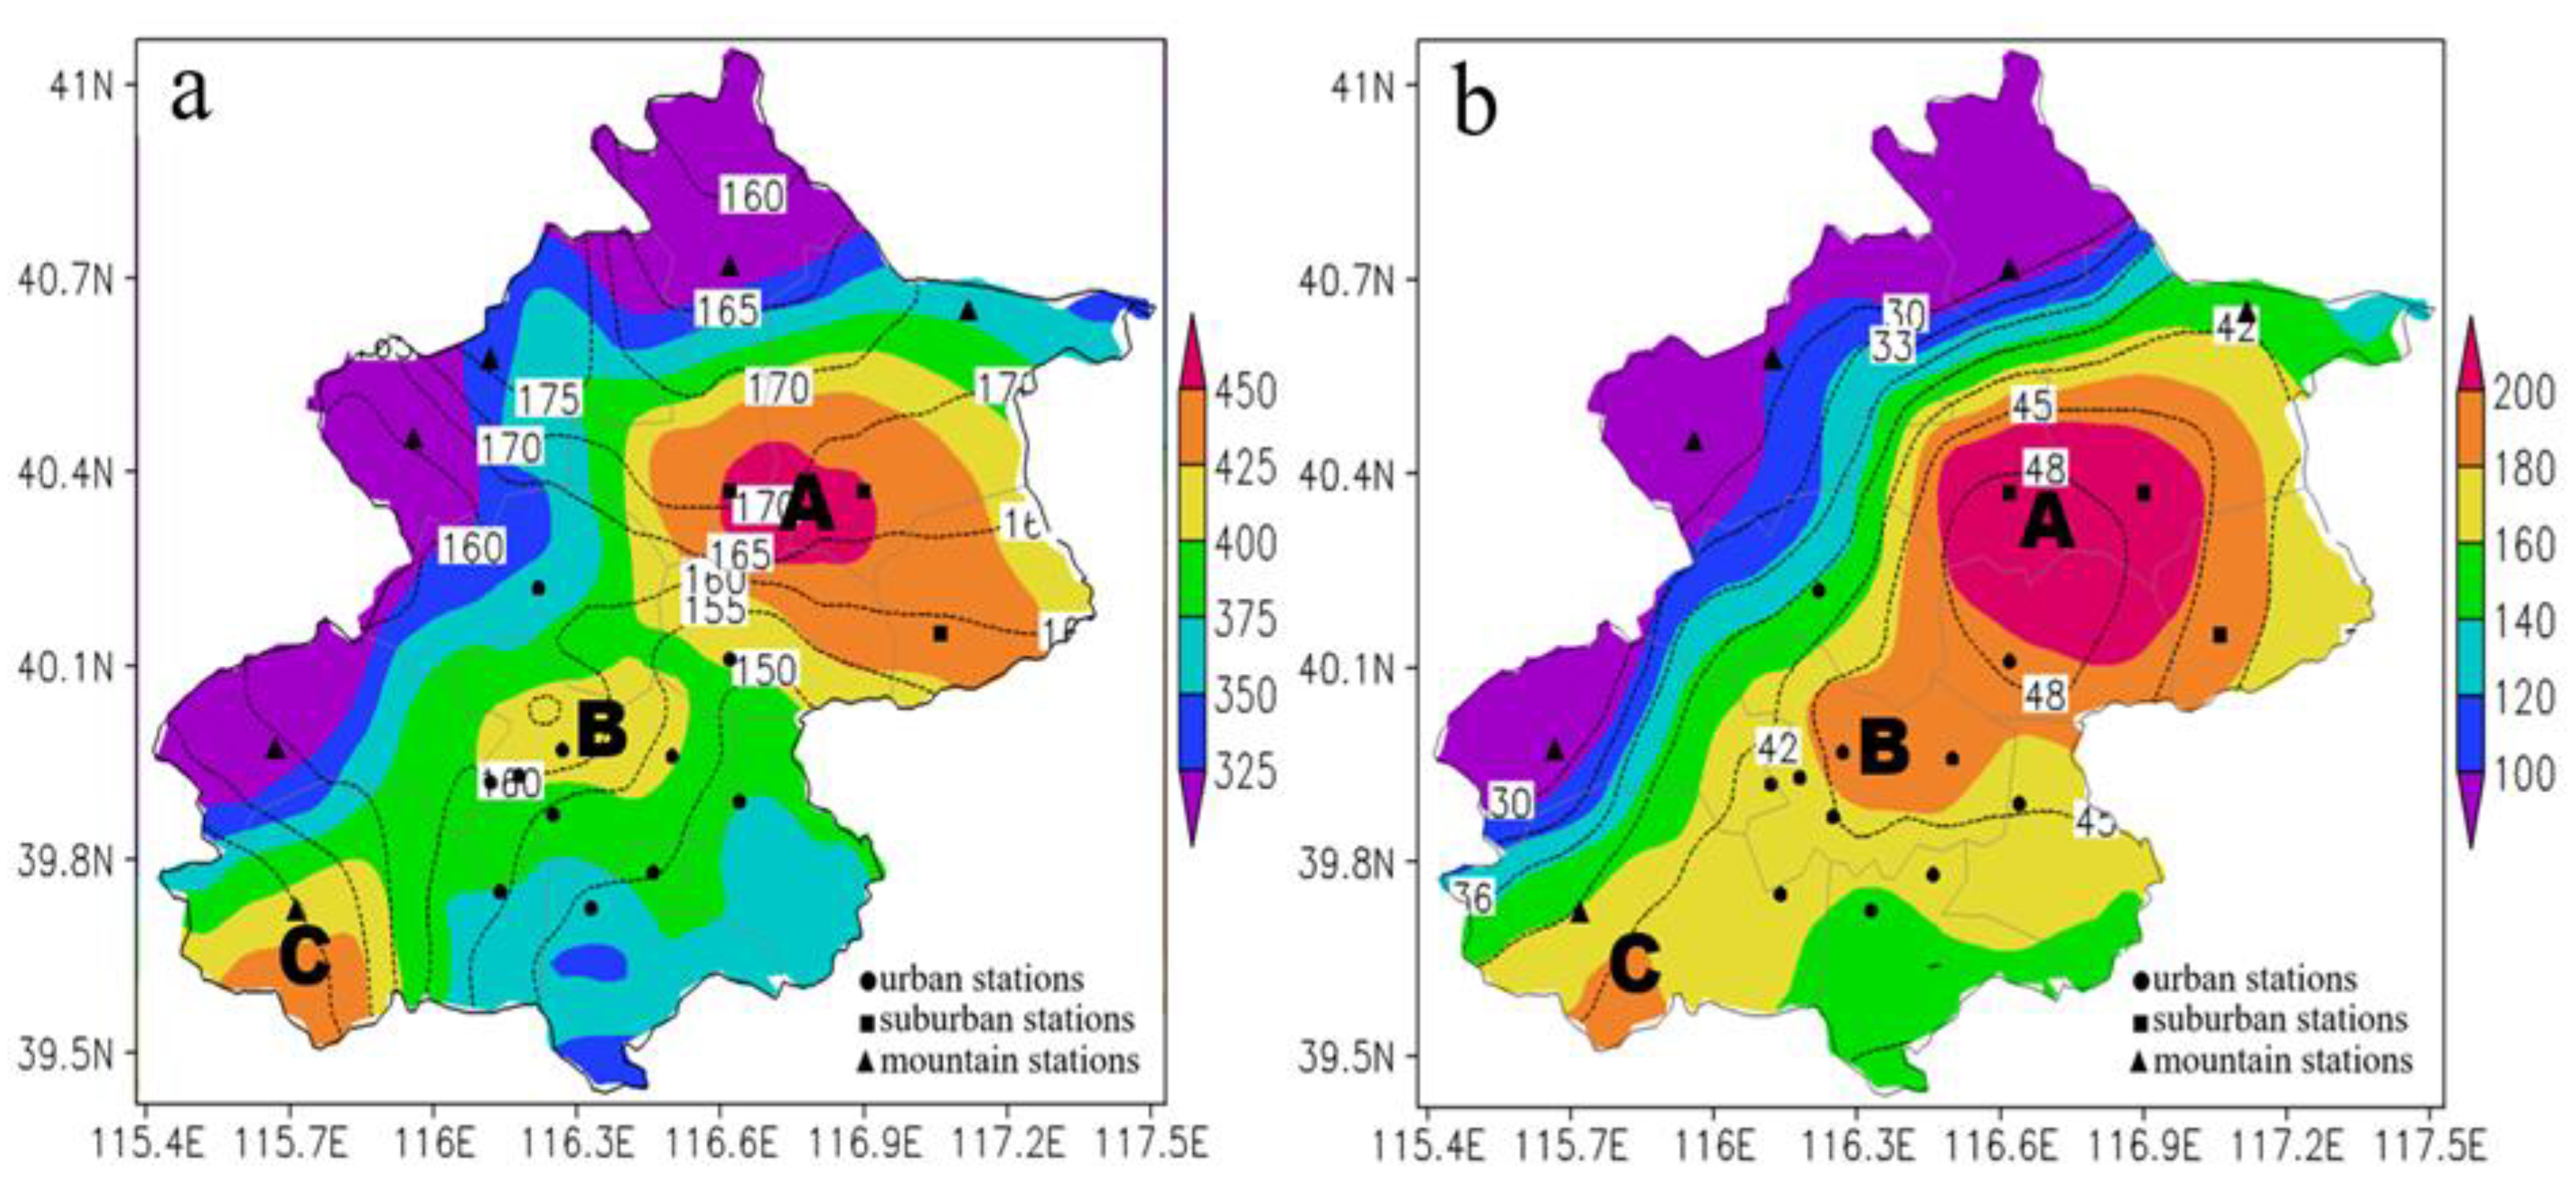
As shown in Figure 1, the spatial distribution of the summer HEP threshold in Beijing is similar to that of the mean annual summer precipitation amount (see Figure 2a), in that the higher the altitude is, the lower the HEP threshold and precipitation amount are. This spatial distribution is mainly influenced by the topography, because in summer the south wind prevails in Beijing and the water vapor mainly comes from the south, so under the effect of terrain blocking, precipitation mainly occurs in the windward slope area (at “A” and “C” in Figure 2a) [22]. Figure 1 also presents that the mean HEP thresholds at the mountain stations in west and north Beijing are 8.7 mm/h, and those at the suburban and urban stations in the plain region are 12.2 and 11.5 mm/h, respectively. Especially, in the urban area, the mean HEP threshold of the northern station is higher than that of the southern station. This is because the frequency and intensity of precipitation in downwind area are higher than those of upwind area due to the effect of urban heat island, while in summer, the south wind prevails in Beijing, so the mean HEP threshold of the north station in urban area is higher than that of the south station [12]. More presentation on local environmental impact is conducted in Section 3.3.
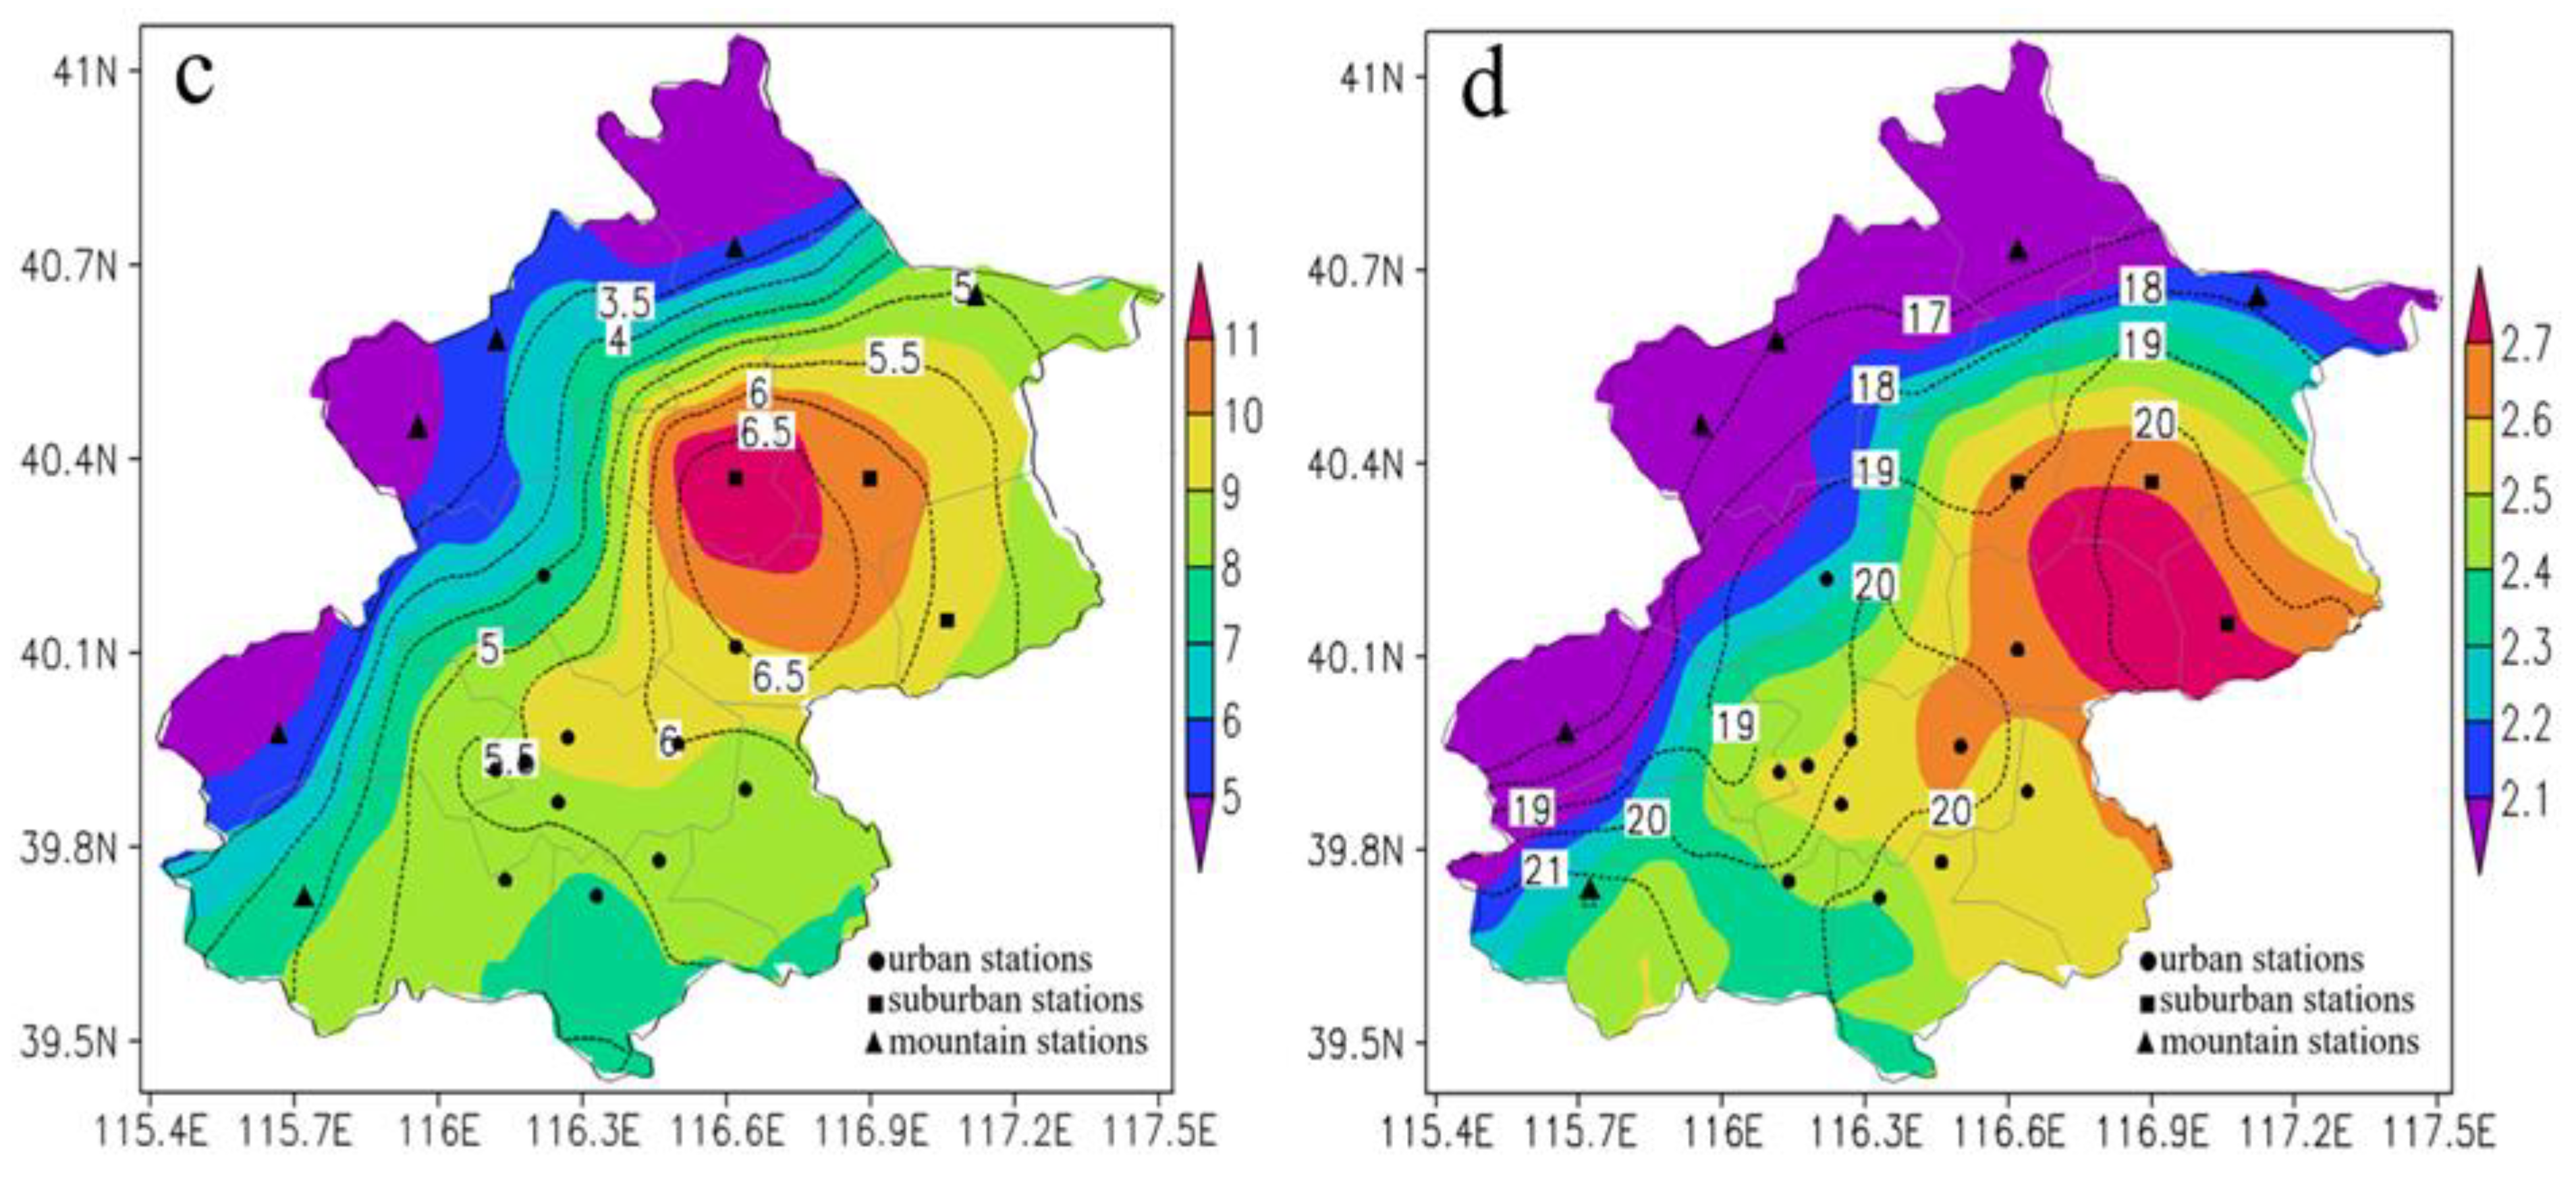
In the past 41 years, the mean annual summer precipitation amount in Beijing is distributed along the terrain height in the northeast-southwest direction (Figure 2a). There are three precipitation centers located in the windward slope of the northeast mountain area, the central urban area and the windward slope of the southwest mountain area, respectively (Identification of A, B, and C in Figure 2a, respectively). The mean summer precipitation frequency in the mountain area is generally higher than that in the plain area, with more than 170 h for the former and less than 160 h for the later. As shown in Figure 2b, the spatial distribution of mean annual summer precipitation amount for HEP in Beijing is similar to that of the mean annual summer precipitation amount, with three peaks in the same areas. Note that the peak of mean annual summer precipitation amount for HEP in the windward slope of northeast mountain area is higher than 200 mm, accounting for 45–50% of the mean annual summer precipitation amount. The mean annual summer precipitation amounts of HEP in the urban area and the windward slope of southwest mountain area mostly are 160–200 mm, accounting for 42–47% of the mean annual summer precipitation amount. In the high-altitude mountain area, the mean annual summer precipitation amount of HEP is less than 160 mm, accounting for less than 35% of the mean annual summer precipitation amount. Figure 2c presents the mean frequency of summer HEP and its proportion in the annual number of summer hourly precipitation events. It can be seen that both the frequency and proportion of HEP in the windward slope of the northeast mountain area in Beijing are the highest, with values greater than 11 h and 6.5%, respectively. The urban area is followed with a frequency of 8–10 h and a proportion of 5.5–6.0%. Additionally, the other areas have a frequency less than 8 h and the proportion is less than 5.0%. Figure 2d shows that the mean summer precipitation intensity in Beijing does not exceed 3 mm/h, but the mean summer HEP intensity exceeds 20 mm/h in the plain area, and even in the high-altitude mountain area, it can reach 16–18 mm/h.

3.2. Temporal Variation of HEP

The maximum hourly precipitation (MHP) is an index to measure the extreme situation of HEP in certain degree. From 1980 to 2020, the summer MHP in the urban area of Beijing has a mean value of 37.0 mm, with significant interannual differences (Figure 3). For example, the MHP in 2012 is 58.8 mm, and this value is three times that in 2010. The variation rate of MHP during 1980–2020 is only 1.2 mm/10 a, which is close to the variation rate of 1.1 mm/10 a for the difference between urban and suburban areas, and this means that the MHP in suburban area almost has no change trend in the past 41 years. Additionally, the variation rate of MHP in urban area during 2003–2012 is 8.9 mm/10 a with a confidence level above 0.95 (r = 0.478, n = 18), which shows an evident upward trend in this period. This phenomenon is worthy of attention because it is rarely reported.
Figure 4a shows that the annual summer precipitation amount in the urban area of Beijing presents different trend to the summer precipitation amount of HEP. During 1980–2020, the annual summer precipitation amount decreases with a rate of 5.8 mm/10a, but the summer precipitation amount of HEP increases with a rate of 5.3 mm/10a. Moreover, the proportion of HEP precipitation amount in annual summer precipitation amount increases with a rate of 2.2%/10a during 1980–2020, especially during 2003–2020, it increases with a rate of 10.2%/10a at a confidence level above 0.99 (r = 0.592). Figure 4b presents that the annual summer precipitation frequency decreases with a rate of 3.0 h/10a in the past 41 years, while the summer precipitation amount of HEP and its proportion still show the opposite trend, with increasing rates of 0.8 h/10a and 0.17%/10a, respectively, and the increasing rate of proportion reaches to 2.4%/10a during 2003–2020. As shown in Figure 4c, there is almost no change in summer precipitation intensity in Beijing from 1980 to 2020, but the summer precipitation intensity of HEP shows a weak increasing rate of 0.28 mm/h every 10 years, and the increasing rate reaches to 2.3 mm/h every 10 years during 2003–2020. These results indicate that although the summer precipitation amount and frequency in Beijing become gradual weakening during 1980–2020, the summer precipitation amount, frequency and intensity of HEP show an increasing trend especially in the past decade (2003–2020). Obviously, the increase in HEP precipitation amount in summer in Beijing during 2003–2020 is mainly due to the increase in HEP precipitation intensity, because the increase in HEP precipitation frequency in the same period is not significant. By applying Mann–Kendall statistical test on summer precipitation amount of HEP, it is found that there are two mutation points around 1994 and 2010, and the year 2003 is the turning point for summer precipitation amount of HEP from a decrease to an increase (Figure 4d).
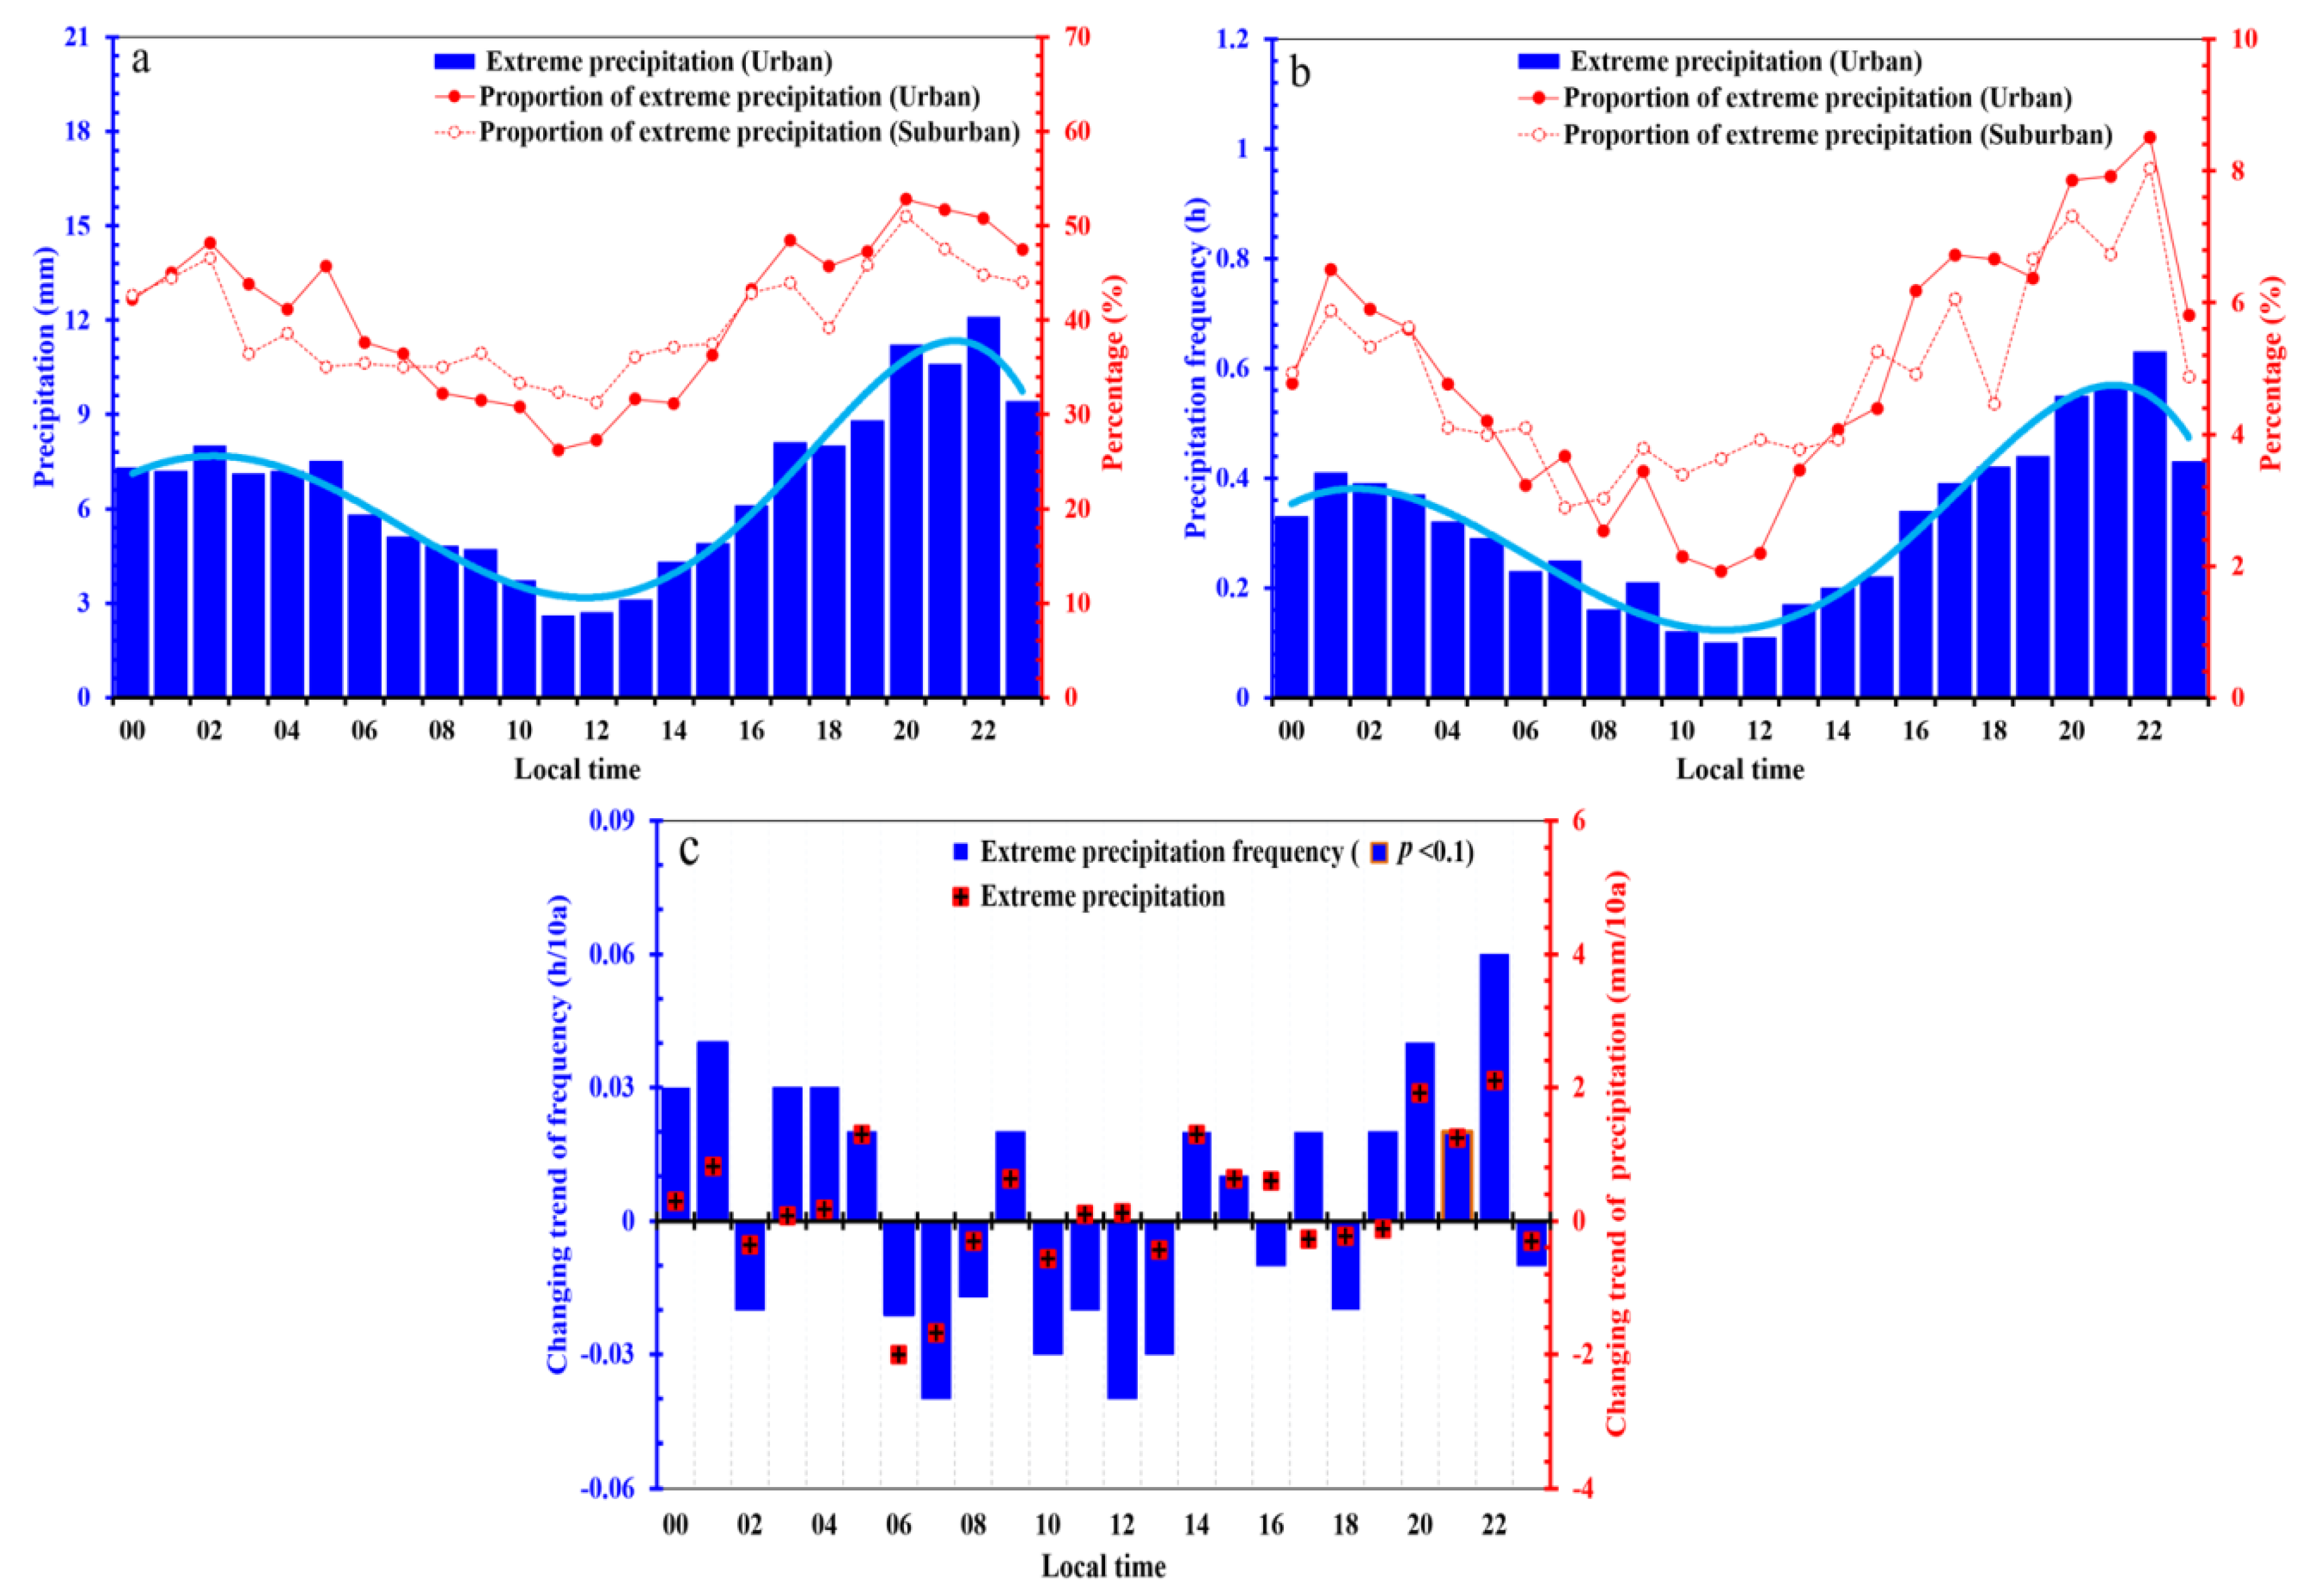
Both the summer precipitation amount and frequency of HEP in Beijing present a similar bimodal pattern in diurnal variation (Figure 5). The main peak occurs in 19–22 LT in the evening and the secondary peak occurs in 01–05 LT in the morning. This similar diurnal variation implies that the precipitation frequency of HEP is the main factor affecting the precipitation amount of HEP. Moreover, in peak period, the precipitation amount and frequency of HEP in urban area contribute 47.5% and 7.0% to the annual precipitation amount and frequency, respectively, while in suburban area, the corresponding proportions are 43.3% and 6.5%; in other periods, the precipitation amount and frequency of HEP in urban area only account for 36.5% and 4.1% in the annual precipitation amount and frequency, respectively, and in suburban area the corresponding proportions also decrease to 37.6% and 4.2%. This indicates that the precipitation amount and frequency of HEP present a stronger diurnal variation in urban area than in suburban area, and are more concentrated in the evening and early morning. Furthermore, as shown in Figure 5c, both the precipitation amount and frequency of HEP present an increasing trend in early morning and evening, yet they tend to decrease in other period, indicating that the high incidence period of HEP tends to shift to the early morning and evening.

3.3. Impact of Local Environment on HEP

Land use change is the most direct way for urban development to affect regional climate. Figure 6 presents that the growth rate of Beijing’s built-up area is 364 km2/10 a during 1980–2019. However, a significant turning point is found in 2001. The growth rate of Beijing’s built-up area from 1980 to 2000 is 105 km2/10 a, and that from 2001 to 2019 increases to 252 km2/10 a. Only during 2001–2003, the built-up area in Beijing expands from 520 km2 to 1180.1 km2, and Beijing’s mega city pattern has basically taken shape. Additionally, UHI is the performance of regional climate affected by urbanization. The UHI of Beijing also changed from negative anomaly to positive anomaly in 2003. The correlation coefficient between built-up area and UHI is 0.89 with confidence level above 0.99. As mentioned above, the trend of HEP in the urban area of Beijing changes significantly around 2003 (Figure 4). Therefore, it is reasonable to think that urbanization has an important impact on the HEP in Beijing. Some studies indicate that the precipitation amount and frequency in city and its downwind area are significantly higher than those in the surrounding areas especially in summer, and the increase in precipitation range and intensity is related to urban scale [2,3,23,24].
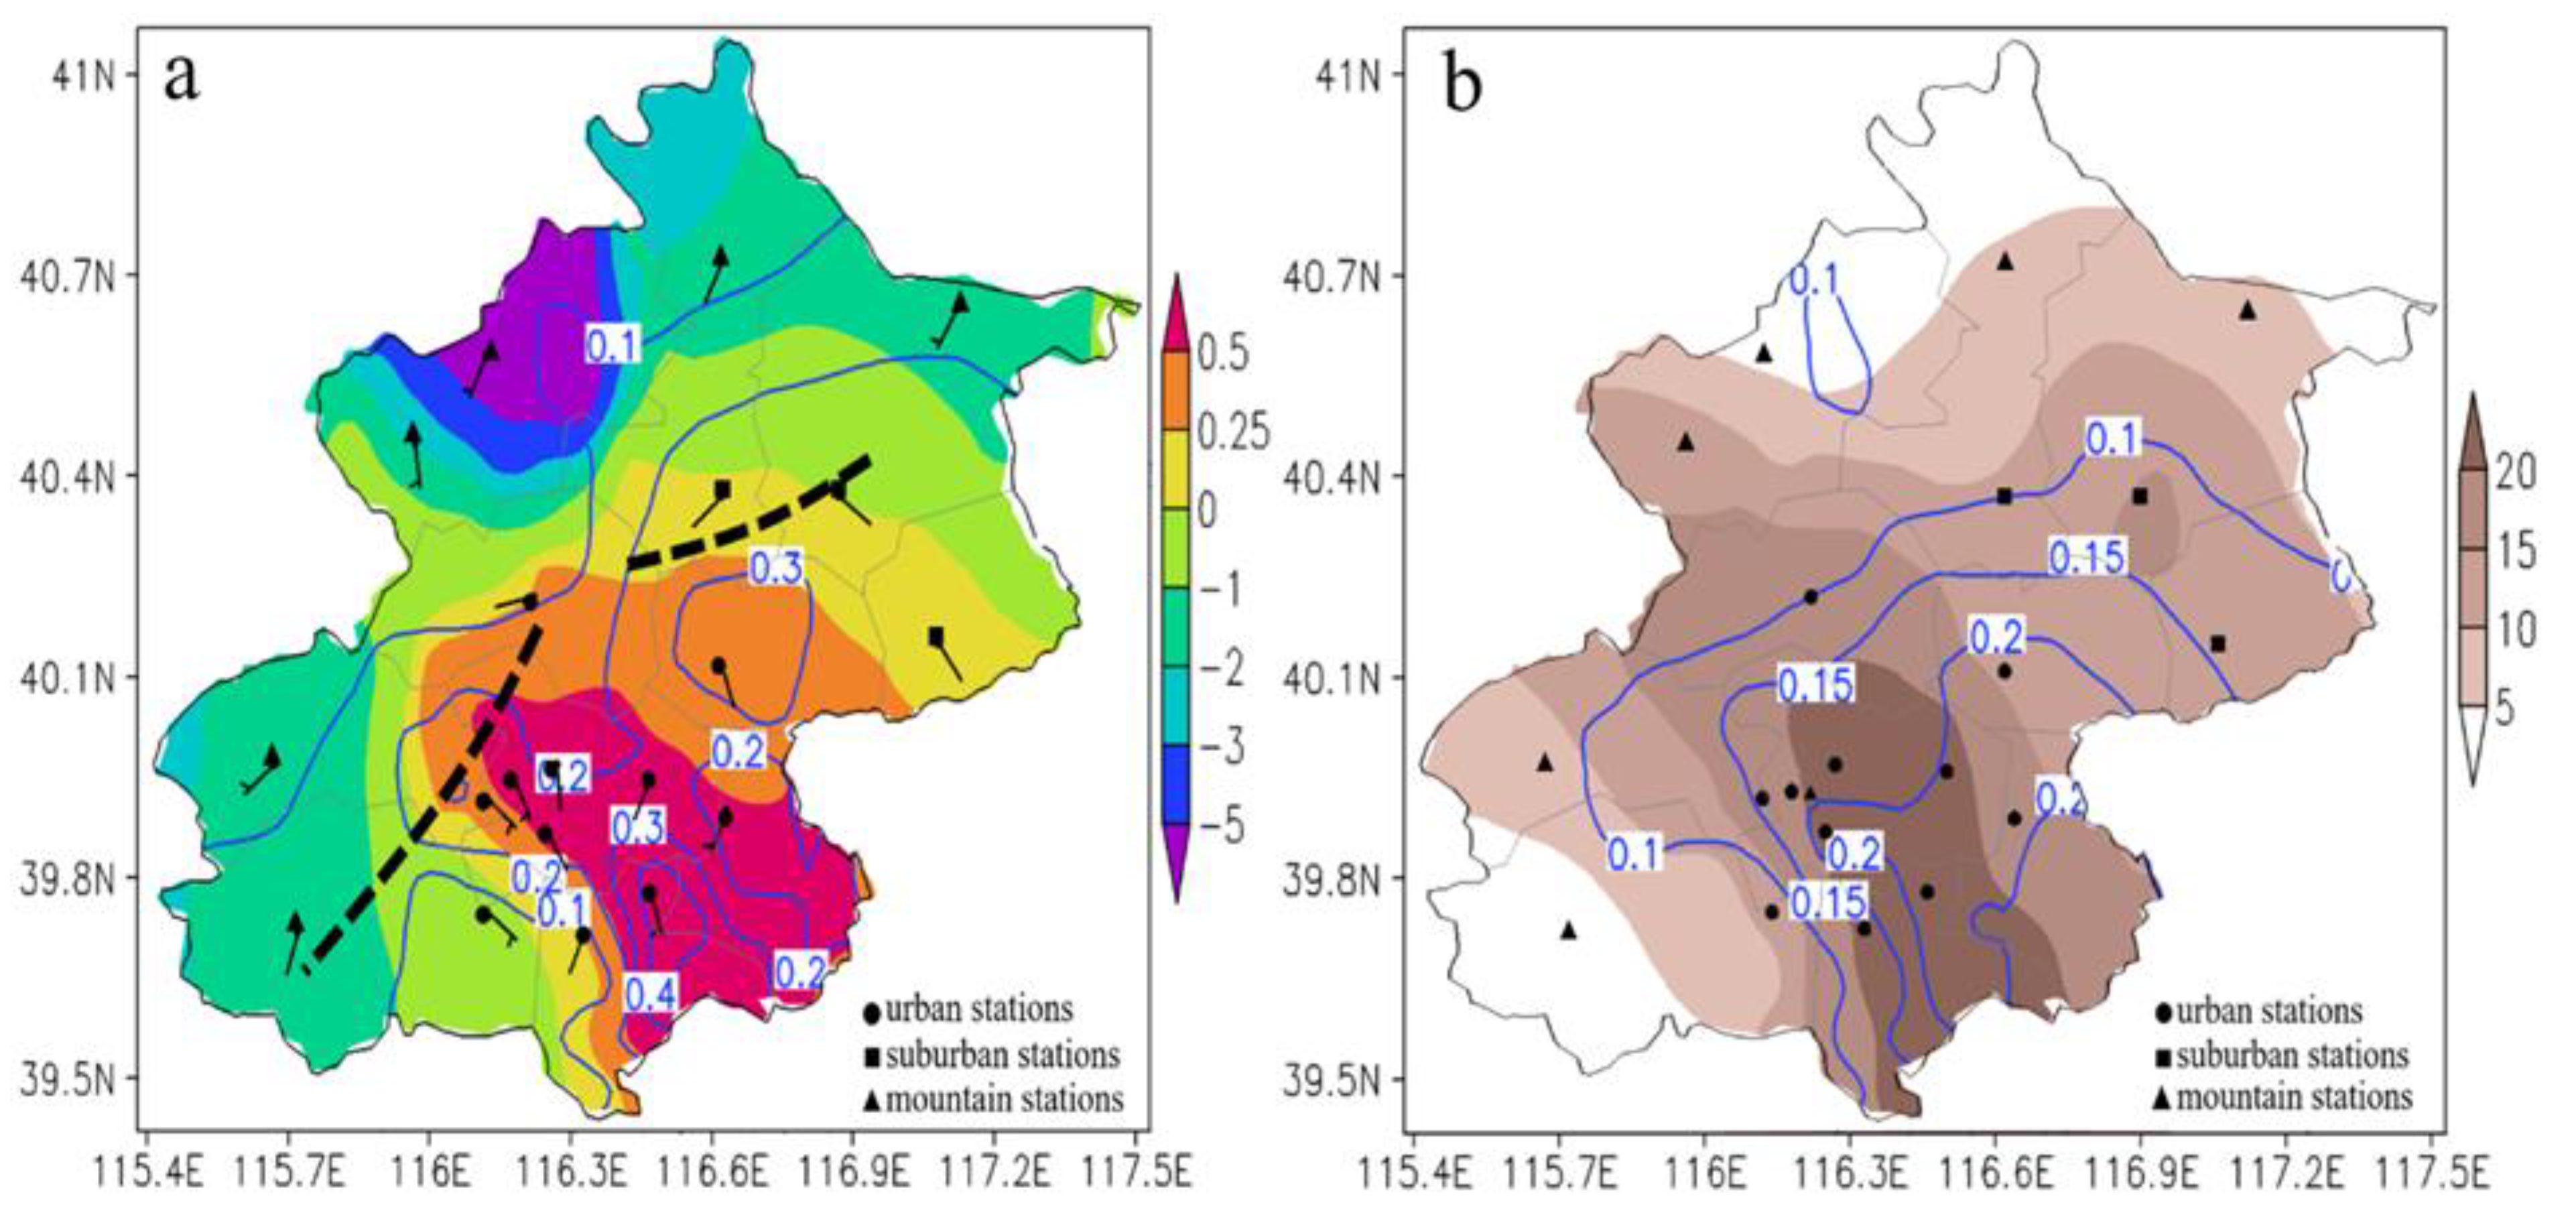
Figure 7 presents the spatial distributions of UHI and haze days in summer in Beijing during 1980–2020 and their correlation coefficients with HEP frequency proportion, also including the prevail surface wind field in summer. As shown in Figure 7a, the UHI of Beijing extends outward with the urban area as the center, and the center intensity exceeds 0.5 °C. Although the frequency of HEP and the UHI are not significantly correlated, the frequency proportion of HEP in the annual precipitation frequency is clearly proportional to the UHI. The maximum correlation coefficient between the frequency proportion of HEP and the UHI is 0.42 with confidence level above 0.99, indicating that the stronger the UHI, the higher the probability of HEP. Compared with the suburban station, the urban station has a stronger trend of ground temperature, which is favorable to the precipitation amount and frequency HEP [11]. It is suggested that the circulation of heat island can trigger and enhance convective weather such as thunderstorm and heavy precipitation, and change the dynamic structure of cloud and storm [25]. Moreover, urban heat island can promote the growth of low clouds when it propagates downwind [26,27]. Due to the impact of urban heat island, the temperature near the surface increases, which leads to stratification instability and forces the hot air to rise on the urban surface resulting in a relatively low-pressure convergence area, and the water vapor transported in can offset the shortage of water vapor supply from the urban underlying surface and cause more precipitation in the city and its downwind area [28]. Furthermore, urban heat island circulation is often coupled with local circulation, forming convergence lines in the city or its downwind area [29]. Figure 7a shows that there are two wind convergence lines caused by terrain in the windward slopes of the west and north mountain areas in Beijing, which also have an important impact on local heavy rainfall. Simple terrain convergence is not considered to trigger convection directly, but severe convective weather can be caused by terrain convergence under favorable weather systems [30]. Additionally, the impact of aerosols on precipitation is controversial because of its uncertainty [31]. However, the number of hazy days in summer in Beijing presents a similar distribution pattern to that of the UHI and is positively correlated with the frequency proportion of HEP in the annual precipitation frequency (Figure 7b), implying that the impact of aerosols on HEP in Beijing may exist. Due to the effect of urban heat island, the frequency and intensity of precipitation in downwind area tend to be higher than those of upwind area. In summer, the south wind prevails in Beijing, thus the convergence of prevailing wind and heat island circulation in the downwind of the city (north side) is strengthened, which leads to the increase in precipitation in the north side of the city (Figure 2a). This phenomenon has been found in previous studies [16], and it may also explain that the mean HEP threshold of the north station in urban area is higher than that of the south station (Figure 1).
Generally, when the wind speed is small in the daytime, the near-surface turbulence is dominated by the thermal turbulence produced by solar radiation, yet it is dominated by the dynamic turbulence produced by wind speed and ground shear in the night. Dou et al. [32] indicate that the diurnal variation of heat flux in the urban and suburban areas in Beijing is affected by the uneven distribution of aerosols. Figure 8a shows that the latent heat flux in urban area of Beijing is higher than that in suburban area from afternoon to night, and the urban area has higher underlying surface roughness than that in suburban area, which means that the turbulence in the near surface is also stronger than that in suburban area from afternoon to night. According to Zheng et al. [33], the aerosol radiation effect can cause the local circulation produced by the urban heat island circulation and the valley wind in Beijing to be weakened and change its direction in advance, which leads to the increase in heavy precipitation intensity and causes heavy precipitation more concentrated in the period from dusk to midnight, also showing the impact of aerosols on HEP in Beijing. In addition, the lower tropospheric stability (LTS) and convective available potential energy (CAPE) in summer in Beijing both present an increasing trend in recent years, with the rates of 0.98 K and 325.6 J/kg every 10 years (Figure 8b). The asymmetric change of LTS and CAPE means that the weak convection process may be restrained, because the enhancement of LTS is not conducive to the formation of weak convection. However, due to the enhancement of CAPE, strong convective weather is more likely to occur. This may partly explain the increase in precipitation frequency of HEP against the background of the gradual reduction in annual precipitation frequency. Dixon and Mote [34] also found that urban heat island is one of the important factors inducing precipitation under unstable weather conditions.

4. Discussion

Due to the limitation of observation, studies on extreme precipitation are mostly conducted by the daily precipitation data, and few of them focus on extreme precipitation on the subdiurnal scale [12]. Although numerical simulation products are with relatively high temporal precision, these products are usually specific to certain cases and have not been evaluated by using observations, also the simulation results present great uncertainty [35]. In this study, the climatic characteristics of summer HEP in Beijing are analyzed by using hourly precipitation data from 1980 to 2020. It is found that precipitation frequency of HEP only accounts for 5.5–6.0% of annual precipitation frequency, but precipitation amount of HEP contributes 42–47% to annual precipitation amount, indicating that the impact of HEP cannot be ignored in precipitation events. The year 2003 is a turning point for HEP from a decrease to an increase, and is also the period when Beijing’s mega city pattern has basically taken shape, which shows that HEP is closely related to urbanization [19]. In addition, HEP may also be associated with changes in local LTS and CAPE.
There were more HEPs in urban areas than in suburban areas in Beijing during 1980–2020, but the correlation between HEP and UHI in Beijing is weak because both summer precipitation amount and frequency present a downward trend during this period under monsoon climate change. Although the frequency of HEP and the UHI are not significantly correlated, the frequency proportion of HEP in annual precipitation frequency is clearly proportional to the UHI. This phenomenon is worthy of attention and implies that under the background of further urbanization in the future, the frequency proportion of HEP in annual precipitation frequency may increase. It is also found that the summer HEP in Beijing tend to occur in the evening and early morning, and presents a stronger diurnal variation in urban area than in suburban area. Moreover, the number of hazy days is positively correlated with the frequency proportion of HEP in annual precipitation frequency. These phenomena, which have rarely been reported in previous studies, may be related to the diurnal variation of heat flux in the urban and suburban areas in Beijing.
The special terrain around Beijing is an important factor affecting the spatial distribution of precipitation in this region, but there are still other influential factors. It is summarized that there are three primary effects of urbanization which may result in altering the intensity and frequency of precipitation, i.e., urban heat island effect, urban canopy effect and urban aerosol effect [36,37,38,39]. However, these effects are complex. For example, under the condition of sufficient water vapor in convective clouds, the increase in aerosol in clouds may lead to the increase in cloud condensation nodules, which is beneficial to precipitation, and may also lead to the decrease incloud condensation nodule radius, which is unfavorable for precipitation [31]. Zhai et al. [37] point out that the overlapping influence of global, regional and urban effects on city should be considered in current climate change research. It is suggested that extreme precipitation events in China will continue to occur frequently [40]. Under the background of the expected advance of urbanization and the gradually apparent effect of air quality control, it remains challenging to further improve the predictive capability of extreme precipitation events by comprehensively considering the impact of various factors.

5. Conclusions

By using the summer hourly precipitation data in Beijing region from 1980 to 2020, the spatial distribution and temporal variation of HEP in this region are investigated and the local environmental impact on HEP is also explored. The results are as the following.
Both the precipitation amount and frequency of summer HEP in Beijing are significantly affected by topography and the high-value areas are distributed in the northeast-southwest direction. The mean summer precipitation caused by HEP is 160–200 mm, accounting for 42–47% of the mean annual summer precipitation, and the mean summer precipitation frequency of HEP is 8–10 h, accounting for 5.5–6.0% of the mean annual precipitation frequency. In addition, the mean intensity of HEP is greater than 20 mm/h.
In the past 41 years, the summer precipitation amount and frequency in Beijing both present a decreasing trend, but those for HEP present an opposite trend, leading to their proportions with an increasing trend of 2.2% and 0.17% every 10 years in the annual summer precipitation amount and frequency, respectively. This phenomenon is mainly contributed by the significant increasing HEP from 2003 to 2020, and the year 2003 is a turning point of HEP from a decrease to an increase.
The summer precipitation amount and frequency of HEP in Beijing both present a similar bimodal pattern in diurnal variation, with one peak in 19–22 LT and another one in 01–05 LT. In peak period, the proportions of HEP in the summer precipitation amount and frequency are higher in urban area than in suburban area, indicating that HEP presents a stronger diurnal variation in urban area and are more concentrated in the evening and early morning.
Additionally, the urbanization process of Beijing is consistent with the change trend of HEP, and the proportion of HEP in the annual precipitation frequency is proportional to the UHI, with the maximum correlation coefficient of 0.42 at confidence level above 0.99, and these indicate that the stronger the UHI, the higher the probability of HEP. Moreover, the convergence lines of terrain in the west and north mountain areas in Beijing are also conducive to local heavy rainfall. Furthermore, local LTS and CAPE as well as aerosols may also affect HEP in Beijing.

Author Contributions

Conceptualization, Z.Z. and G.X.; methodology, Z.Z.; software, Z.Z.; validation, Z.Z. and H.G.; formal analysis, Z.Z. and G.X.; investigation, H.G.; resources, Z.Z.; data curation, H.G.; writing—original draft preparation, Z.Z.; writing—review and editing, G.X.; visualization, Z.Z.; supervision, G.X.; project administration, Z.Z.; funding acquisition, Z.Z. All authors have read and agreed to the published version of the manuscript.

Funding

This research was funded by the Beijing Natural Science Foundation (Grant No. 8202022) and the National Natural Science Foundation of China (Grant No. 41575010).

Institutional Review Board Statement

Not applicable.

Informed Consent Statement

Not applicable.

Data Availability Statement

The data presented in this study are available on request from the first author.

Acknowledgments

The authors acknowledge the Beijing Meteorological Information Center of Beijing Meteorological Service and the China Statistical Press for providing the data used in this study.

Conflicts of Interest

The authors declare no conflict of interest.

References

  1. Oki, T.; Musiake, K. Seasonal change of the diurnal cycle of precipitation over Japan and Malaysia. J. Appl. Meteorol. 1994, 33, 1445–1463. [Google Scholar] [CrossRef] [Green Version]
  2. Huff, F.A.; Vogel, J.L. Urban, topographic and diurnal effects on rainfall in the St Louis Region. J. Appl. Meteorol. Clim. 1978, 17, 565–577. [Google Scholar] [CrossRef] [Green Version]
  3. Bornstein, R.; Lin, Q.L. Urban heat islands and summertime convective thunderstorms in Atlanta: Three case studies. Atmos. Environ. 2000, 34, 507–516. [Google Scholar] [CrossRef]
  4. Myhre, G.; Alterskjær, K.; Stjern, C.W.; Hodnebrog, O.; Marelle, L.; Samset, B.H.; Sillmann, J.; Schaller, N.; Fischer, E.; Schulz, M.; et al. Frequency of extreme precipitation increases extensively with event rareness under global warming. Sci. Rep. 2019, 9, 16063. [Google Scholar] [CrossRef] [PubMed] [Green Version]
  5. Trenberth, K.E. Changes in precipitation with climate change. Clim. Res. 2011, 47, 123–138. [Google Scholar] [CrossRef] [Green Version]
  6. Willems, P.; Arnbjerg, K.; Olsson, J.; Nguyen, V.T.V. Climate change impact assessment on urban rainfall extremes and urban drainage: Methods and shortcomings. Atmos. Res. 2012, 103, 106–118. [Google Scholar] [CrossRef]
  7. Beck, F.; Bardossy, A.; Seidel, J.; Müller, T.; Sanchis, E.F.; Hauser, A. Statistical analysis of sub-daily precipitation extremes in Singapore. J. Hydrol. Reg. Stud. 2015, 3, 337–358. [Google Scholar] [CrossRef] [Green Version]
  8. Chan, S.C.; Kendon, E.J.; Fowler, H.J.; Blenkinsop, S.; Roberts, N.M. Projected increases in summer and winter UK sub-daily precipitation extremes from high-resolution regional climate models. Environ. Res. Lett. 2014, 9, 084019. [Google Scholar] [CrossRef] [Green Version]
  9. Mukherjee, S.; Aadhar, S.; Stone, D.; Mishra, V. Increase in extreme precipitation events under anthropogenic warming in India. Weather Clim. Extrem. 2018, 20, 45–53. [Google Scholar] [CrossRef]
  10. He, B.J. Potentials of meteorological characteristics and synoptic conditions to mitigate urban heat island effects. Urban Clim. 2018, 24, 26–33. [Google Scholar] [CrossRef]
  11. Jiang, X.; Luo, Y.; Zhang, D.L.; Wu, M. Urbanization Enhanced Summertime Extreme Hourly Precipitation over the Yangtze River Delta. J. Clim. 2020, 33, 5809–5826. [Google Scholar] [CrossRef] [Green Version]
  12. Kong, F.; Lv, L.; Fang, J. Spatiotemporal pattern of hourly heavy rainfall in China and its spatial correlation with urbanization factors during 1991−2010. Clim. Environ. Res. 2017, 22, 355–364. (In Chinese) [Google Scholar] [CrossRef]
  13. Yu, R.C.; Zhou, T.J.; Xiong, A.Y.; Zhu, Y.; Li, J. Diurnal variations of summer precipitation over contiguous China. Geophys. Res. Lett. 2007, 34, L01704. [Google Scholar] [CrossRef] [Green Version]
  14. Chen, G. Diurnal cycle of the Asian summer monsoon: Air pump of the second kind. J. Clim. 2020, 33, 1747–1775. [Google Scholar] [CrossRef]
  15. Wu, M.; Luo, Y.; Chen, F.; Wong, W. Observed Link of Extreme Hourly Precipitation Changes to Urbanization over Coastal South China. J. Appl. Meteorol. Clim. 2019, 58, 1799–1819. [Google Scholar] [CrossRef]
  16. Zhang, H.; Wu, C.; Chen, W.; Huang, G. Effect of urban expansion on summer rainfall in the Pearl River Delta, South China. J. Hydrol. 2019, 568, 747–757. [Google Scholar] [CrossRef]
  17. Miao, S.; Chen, F.; Li, Q.; Fan, S. Impacts of Urban Processes and Urbanization on Summer Precipitation: A Case Study of Heavy Rainfall in Beijing on 1 August 2006. J. Appl. Meteorol. Clim. 2011, 50, 806–825. [Google Scholar] [CrossRef]
  18. Yan, Y.; Miao, Y.; Guo, J.; Liu, S.; Liu, H.; Lou, M.; Liu, L.; Chen, D.; Xue, W.; Zhai, P. Synoptic patterns and sounding-derived parameters associated with summertime heavy rainfall in Beijing. Int. J. Clim. 2019, 39, 1476–1489. [Google Scholar] [CrossRef]
  19. Yuan, Y.; Zha, P.; Chen, Y.; Li, J. Hourly Extreme Precipitation Changes under the Influences of Regional and Urbanization Effects in Beijing. Int. J. Clim. 2020, 41, 1179–1189. [Google Scholar] [CrossRef]
  20. Wang, J.; Yan, Z.W.; Li, Z.; Liu, W.; Wang, Y. Impact of urbanization on changes in temperature extremes in Beijing during 1978–2008. Chin. Sci. Bull. 2013, 58, 4679–4686. [Google Scholar] [CrossRef]
  21. Guo, J.P.; Deng, M.J.; Lee, S.S.; Wang, F.; Li, Z.Q.; Zhai, P.M.; Liu, H.; Lv, W.T.; Yao, W. Delaying precipitation and lightning by air pollution over the Pearl River Delta. Part 1: Observational analyses. J. Geophys. Res. Atmos. 2016, 121, 6472–6488. [Google Scholar] [CrossRef]
  22. Wang, J.L.; Zhang, R.H.; Wang, Y.C. Characteristics of precipitation in Beijing and the precipitation representativeness of Beijing weather observatory. Theor. Appl. Clim. 2012, 23, 265–273. [Google Scholar] [CrossRef]
  23. Molders, N. Landscape changes over a region in East Germany and their impact upon the processes of its atmpospheric water-cycle. Meteorol. Atmos. Phys. 1998, 68, 79–98. [Google Scholar] [CrossRef]
  24. Hand, L.M.; Shepherd, J.M. An investigation of warm-season spatial rainfall variability in Oklahoma City: Possible Linkages to urbanization and prevailing wind. J. Appl. Meteorol.Clim. 2009, 48, 251–269. [Google Scholar] [CrossRef]
  25. Changnon, S.A. Urban effects on Severe Local Stoms at St.Louis. J. Appl. Meteorol. 1978, 17, 578–586. [Google Scholar] [CrossRef] [Green Version]
  26. Shepherd, J.M.; Pierce, H.; Negri, A.J. Rainfall modification by major urban areas: Observations from spaceborne rain radar on the TRMM satellite. J. Appl. Meteorol. 2002, 41, 689–701. [Google Scholar] [CrossRef]
  27. Shepherd, J.M.; Burian, S.J. Detection of urban-induced rainfall anomalies in a major coastal city. Earth Interact. 2003, 7, 1–17. [Google Scholar] [CrossRef] [Green Version]
  28. Tomohiko, I.; Takeki, I.; Hiroshima, A. Diagnostic study of the effects of a large city on heavy rainfall as revealed by an ensemble simulation: A case study of central Tokyo, Japan. J. Appl. Meteorol. 2011, 50, 713–728. [Google Scholar] [CrossRef]
  29. Cotton, W.R.; Pielke, R.A. Inadvertent human impacts on regional weather and climate. In Human Impacts on Weather and Climate, 2nd ed.; Cambridge University Press: Cambridge, UK, 2007; pp. 73–148. [Google Scholar]
  30. Wang, L.; Liu, L.; Wang, L.; Wang, Z. Analysis of Surface Convergence Line Features in the Eastern Side of Taihang Mountain. Meteorol. Mon. 2013, 39, 1445–1451. (In Chinese) [Google Scholar] [CrossRef]
  31. Albrecht, B.A. Aerosols, cloud microphysics, and fractional cloudiness. Science 1989, 245, 1227–1230. [Google Scholar] [CrossRef]
  32. Dou, J.; Grimmond, S.; Cheng, Z.; Miao, S.; Feng, D.; Liao, M. Summertime surface energy balance fluxes at two Beijing sites. Int. J. Climatol. 2019, 39, 2793–2810. [Google Scholar] [CrossRef] [Green Version]
  33. Zheng, Z.; Zhao, C.; Lolli, S.; Wang, X.; Wang, Y.; Ma, X.; Li, Q.; Yang, Y. Diurnal variation of summer precipitation modulated by air pollution: Observational evidences in the Beijing metropolitan area. Environ. Res. Lett. 2020, 15, 094053. [Google Scholar] [CrossRef]
  34. Dixon, P.G.; Mote, T.L. Patterns and causes of Atlanta's urban heat island–initiated precipitation. J. Appl. Meteorol. 2003, 42, 1273–1284. [Google Scholar] [CrossRef]
  35. Yu, M.; Miao, S.; Zhang, H. Uncertainties in the impact of urbanization on heavy rainfall: Case study of a rainfall event in Beijing on 7 August 2015. J. Geophys. Res. Atmos. 2018, 123, 6005–6021. [Google Scholar] [CrossRef]
  36. Zhai, P.; Sun, A.; Ren, F. Changes of climate extremes in China. Clim. Chang. 1999, 42, 203–218. [Google Scholar] [CrossRef]
  37. Zhai, P.; Yuan, Y.; Yu, R. Climate change and sustainable development for cities. Chin. Sci. Bull. 2019, 64, 1995–2001. [Google Scholar] [CrossRef] [Green Version]
  38. Chen, F.; Kusaka, H.; Bornstein, R.; Ching, J.; Grimmond, C.S.B.; Grossman-Clarke, S.; Loridan, T.; Manning, K.; Martilli, A.; Sailor, D.; et al. The integrated WRF/urban modelling system: Development, evaluation, and applications to urban environmental problems. Int. J. Climatol. 2011, 31, 273–288. [Google Scholar] [CrossRef]
  39. Guo, J.; Deng, M.; Fan, J.; Li, Z.; Chen, Q.; Zhai, P.; Dai, Z.; Li, X. Precipitation and air pollution at mountain and plain stations in northern China: Insights gained from observations and modeling. J. Geophys. Res. 2014, 119, 4793–4807. [Google Scholar] [CrossRef]
  40. Qin, P.H.; Xie, Z.H.; Zou, J.; Liu, S.; Chen, S. Future precipitation extremes in China under climate change and their physical quantification based on a regional climate model and CMIP5 model simulations. Adv. Atmos. Sci. 2021, 38, 460–479. [Google Scholar] [CrossRef]
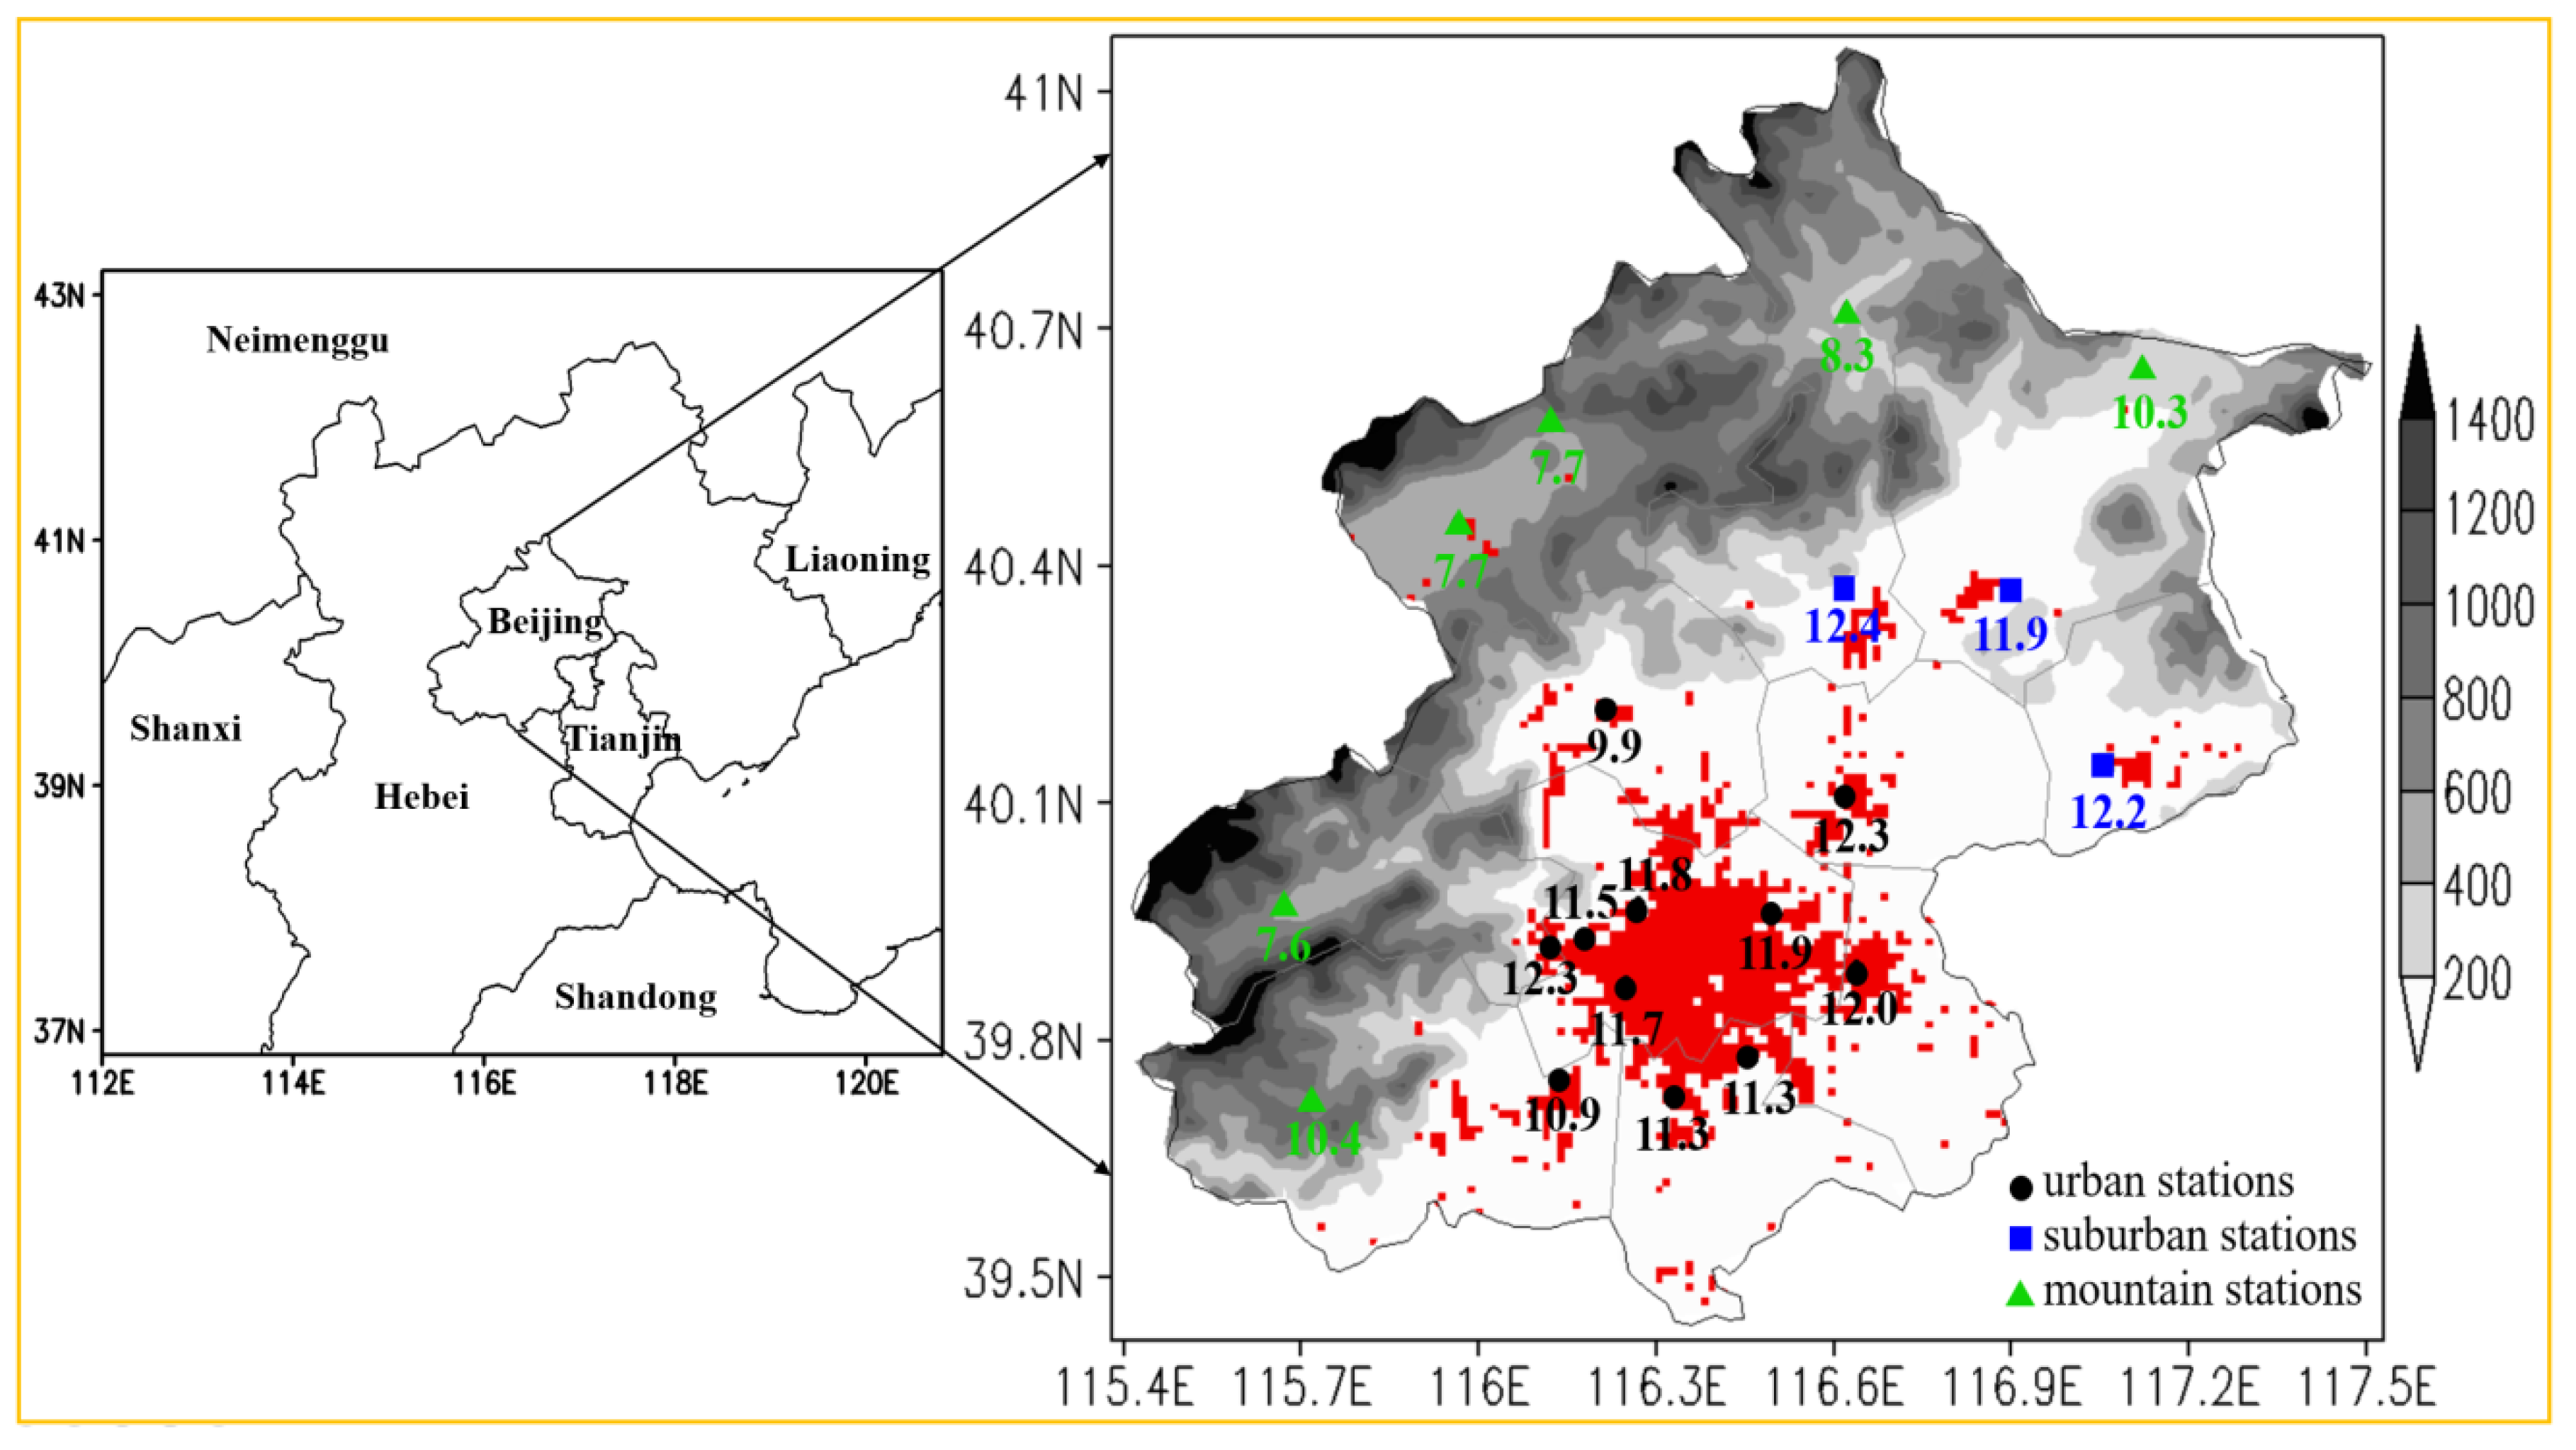
Figure 1. Terrain height (unit: m, gray filled) and urban impervious surface (red area) in Beijing as well as HEP thresholds (unit: mm, the numbers) of 20 stations.
Atmosphere 12 00632 g001
Figure 2. Spatial distribution of summer precipitation in Beijing from 1980 to 2020: (a) mean annual summer precipita-tion amount (unit: mm, color filled) and frequency (unit: h, isoline); (b) mean summer precipitation amount of HEP (unit: mm, color filled) and its proportion in mean annual summer precipitation amount (unit: %, isoline); (c) mean summer precipitation frequency of HEP (unit: h, color filled) and its proportion in mean annual summer precipitation frequency (unit: %, isoline); (d) mean summer precipitation intensity (unit: mm/h, color filled) and that for HEP (unit: mm/h, isoline). The "A", "B" and "C" in the figure represent the windward slope of northeast mountain area, central urban area and windward slope of southwest mountain area in Beijing, respectively.
Atmosphere 12 00632 g002aAtmosphere 12 00632 g002b
Figure 3. Interannual variations of the summer maximum hourly precipitation in urban area (red) and its difference (blue) between urban and suburban areas in Beijing during 1980–2020. The dash line is the 5-point moving average series.
Atmosphere 12 00632 g003
Figure 4. Interannual variations of summer precipitation in urban area in Beijing: (a) precipitation amount (left) and proportion of HEP precipitation amount in annual summer precipitation amount (right); (b) precipitation frequency (left) and proportion of HEP precipitation frequency in annual summer precipitation frequency (right); (c) precipitation intensity anomaly; (d) Mann–Kendall test on precipitation amount of HEP, and the thick straight lines indicate the values at significance level of 0.05.The anomaly values in the figure are the differences between the meteorological elements of the current year and the climatic mean values during 1981–2010, and the dash line is the 5-point moving average series.
Atmosphere 12 00632 g004
Figure 5. Diurnal variations of summer precipitation in Beijing: (a) precipitation amount (left) and proportion of HEP precipitation amount in annual summer precipitation amount (right); (b) precipitation frequency (left) and proportion of HEP precipitation frequency in annual summer precipitation frequency (right); (c) change trends for precipitation frequency (left) and amount (right) of HEP. The blue curve is a polynomial fitting data series.
Atmosphere 12 00632 g005
Figure 6. Annual changes of built-up area and UHI anomaly in Beijing during 1980–2020.
Atmosphere 12 00632 g006
Figure 7. The spatial distributions of (a) UHI and (b) haze days in summer in Beijing during 1980–2020 and their correlation coefficients with HEP frequency proportion. The UHI (unit: °C) and haze days are color filled, while blue isoline indicates the correlation coefficient. The wind shafts at the stations on the left panel indicate the prevailing surface wind field in summer in Beijing, and the thick dotted line indicates the wind convergence line caused by terrain.
Atmosphere 12 00632 g007
Figure 8. Diurnal variations of (a) sensible heat flux (QE) and latent heat flux (QH) in summer in Beijing during 2015–2016, and (b) those of lower tropospheric stability (LTS) and convective available potential energy (CAPE) in summer in Beijing during 2008–2018.
Atmosphere 12 00632 g008
Publisher’s Note: MDPI stays neutral with regard to jurisdictional claims in published maps and institutional affiliations.