Article

Exposure Assessment of Climate Extremes over the Europe–Mediterranean Region

by
Mehmet Barış Kelebek
1,
Fulden Batibeniz
2 and
Barış Önol
1,*
1
Aeronautics and Astronautics Faculty, Meteorological Engineering, Istanbul Technical University, Istanbul 34469, Turkey
2
Institute for Atmospheric and Climate Science, ETH Zurich, 8092 Zurich, Switzerland
*
Author to whom correspondence should be addressed.
Atmosphere 2021, 12(5), 633; https://doi.org/10.3390/atmos12050633
Submission received: 27 March 2021 / Revised: 1 May 2021 / Accepted: 7 May 2021 / Published: 17 May 2021

Abstract

:
The use of a compact set of climate change indexes enhances our understanding of the combined impacts of extreme climatic conditions. In this study, we developed the modified Climate Extremes Index (mCEI) to obtain unified information about different types of extremes. For this purpose, we calculated 10 different climate change indexes considering the temperature extremes, extreme precipitation, and moisture surplus and drought over the Europe–Mediterranean (EURO–MED) region for the 1979–2016 period. As a holistic approach, mCEI provides spatiotemporal information, and the high-resolution grid-based data allow us to accomplish detailed country-based and city-based analyses. The analyses indicate that warm temperature extremes rise significantly over the EURO–MED region at a rate of 1.9% decade−1, whereas the cold temperature extremes decrease. Extreme drought has a significant increasing trend of 3.8% decade−1. Although there are regional differences, extreme precipitation indexes have a significant increasing tendency. According to the mCEI, the major hotspots for the combined extremes are the Mediterranean coasts, the Balkan countries, Eastern Europe, Iceland, western Russia, western Turkey, and western Iraq. The decadal changes of mCEI for these regions are in the range of 3–5% decade−1. The city-scale analysis based on urbanized locations reveals that Fes (Morocco), Izmir (Turkey), Marseille and Aix-en-Provence (France), and Tel Aviv (Israel) have the highest increasing trend of mCEI, which is greater than 3.5% decade−1.

Graphical Abstract

1. Introduction

The warming rate of the climate system is at a remarkable level with respect to the 1950s’ global temperature (IPCC Report, [1]). Beyond the changes in the mean climate, increasing extreme weather events become more prominent in climate change studies due to their impacts on the human environment and the natural ecosystem. In the 21st century, although there are broad spatial and interannual differences, economic losses caused by weather- and climate-related disasters have increased (IPCC Report, [2]). The duration and intensity of warm spells and the frequency of heavy precipitation are expected to increase in the near future over many areas of the world. Given the spatial and temporal heterogeneity of potential increases in extreme events in the future, assessing possible exposures to changes in climate extremes is highly critical.
Many studies focusing on extremes have used climate indexes defined by the WMO CCL/CLIVAR Expert Team on Climate Change Detection and Indices (ETCCDI) in order to investigate the changes in extreme conditions. These studies, focusing on the global extremes, indicate that there has been a significant increase in warm temperature extremes and a decrease in cold temperature extremes since the 1950s [3,4,5]. Additionally, extremes have been investigated over many regions, including Europe [6,7], Asia [8,9], North America [10], Australia [11], South America [12,13], the Middle East [14], and the Eastern Mediterranean region [15], and the positive trends in warm extremes have been highlighted. Another study investigating the global long-term drought, using the Palmer Drought Severity Index, found that the aridity over the Mediterranean basin has increased substantially since the 1970s [16]. However, studies focusing on single extreme events without the concept of combining them are not able to explain the combined impacts. Therefore, it is essential to consider their combined impacts on current and future exposures to have comprehensive knowledge.
Despite the extensive use of indexes for climate change detection and monitoring [5,17], concluding the overall impact of different extreme conditions can be challenging due to the complex interactions between them. The Climate Extremes Index (CEI) developed by Karl et al. [18] is an easy and fast interpreted tool that combines spatial information about different types of extremes in a single frame. It is a metric that measures the proportion of an area experiencing extreme climatic conditions by averaging five indicators for monthly maximum and minimum temperature extremes, drought or moisture surplus based on the Palmer Drought Severity Index (PDSI) [19], extreme precipitation rate from 1 day precipitation extremes, and the number of wet–dry days. This method has been used over different regions, including the U.S. [18,20,21,22,23,24], Australia [21,22,23,25], Asia [22,23], and Europe [21,22,23] with several modifications applied to the original CEI formula. For example, Gleason et al. [20] revised it by changing the fixed threshold criteria in the extreme 1 day precipitation indicator to the locally observed 90th percentiles and calculated CEI for the U.S. Gallant and Karoly [25]; Gallant et al. [21] subtracted the lower extremes from the upper extremes so that the positive or negative values would give the direction of tendency. In both studies, they used monthly datasets (mCEI) and daily datasets (dmCEI) in CEI calculations. Moreover, Dittus et al. [22] used the subtraction methodology to calculate a modified version of CEI (EmCEI) at continental and hemispheric (Northern Hemisphere) scales, using gridded observations of the extreme indexes. They applied the same methodology by using CMIP5 simulations, and highlighted the impact of anthropogenic forcing on the increase in temperature and, partly, precipitation extremes over different regions of the world [23]. Another study by Batibeniz et al. [24] used CEI to evaluate exposure to the aggregated climate extremes in future climate conditions in the U.S. They found that every county in the U.S. has experienced an increase in extremes in recent decades and projected an upcoming change that exposure to these extremes will permanently exceed in the future.
There are many studies focused on combining the impacts of different climate extremes across the globe [26,27,28] and over many regions, including Europe [29,30,31] and India [32,33]. As a different technique, we used CEI in this study, which also provides similar analysis and gives a single fractional value for specified regions under the effect of combined extremes. However, although CEI provides information about the spatial extent of multivariate extreme conditions, a single fractional value for a broad region may not be representative of its sub-regions. Additionally, it may stay inadequate in presenting detailed temporal intensities of multivariate extremes and exposure assessment to these extremes. In order to improve on these limitations of CEI, we developed a new methodology by re-designating the extreme indicators of CEI to obtain information about the temporal intensities of extreme conditions, in addition to grid-based calculations instead of areal fractions over a broad region. Therefore, we call this new methodology modified Climate Extremes Index (mCEI). This study also makes use of recently released high-resolution ERA5 reanalysis (European Centre for Medium-range Weather Forecasts (ECMWF) Reanalysis 5) and MSWEP observations (Multi-Source Weighted-Ensemble Precipitation) to have detailed spatial information at country and city levels regarding combined extremes over Europe, the Eastern Mediterranean region, and the north coast of Africa (hereafter referred to as the EURO–MED region).

2. Data and Method

2.1. Data

Increased data availability, which is related to improvements in observation systems and computation resources, provides a vast amount of information for detailed temporal and spatial analyses. In this study, we used the last generation gridded datasets according to their spatial and temporal coverages. For the temperature indexes, we used the ERA5 (resolution; 0.125° × 0.125°) daily temperature reanalysis dataset, which is the last generation dataset of ECMWF produced by using the Integrated Forecast System (IFS) [34]. For the precipitation indexes, we used the MSWEP (resolution; 0.1° × 0.1°) daily precipitation dataset, which provides reliable global precipitation estimates [35]. As a drought indicator, we used the self-calibrating Palmer Drought Severity Index (scPDSI). Compared to the original PDSI, scPDSI represents the climates of different locations more realistically [36]. Its calculation requires monthly temperature and potential evapotranspiration (PET), and soil water holding capacity data. The monthly scPDSI was computed by using available water holding capacity data of Webb et al. [37] and PET data produced by using Thornthwaite’s method [38]. All the datasets used in the study are interpolated to MSWEP’s spatial resolution (0.1°) by using bilinear interpolation in order to allow grid-based comparisons.
Additionally, we used GHS Settlement Model grid (GHS-SMOD) global data at 1 km horizontal resolution, which is a part of the Global Human Settlement Layer (GHSL) project [39], to define the urban extent of the EURO–MED region. GHS-SMOD classifies settlement typologies by using a logical algorithm based on population size and densities of population and built-up areas for the years 1975, 1990, 2000, and 2015. Settlement typologies are classified as cities, dense towns, semi-dense towns, suburbs, and rural areas and are given a code number. In the study, we defined the urban extent as the combination of cities, dense towns, semi-dense towns, and suburbs. A detailed definition and determination algorithms of the typologies can be found in Florczyk et al. [40].

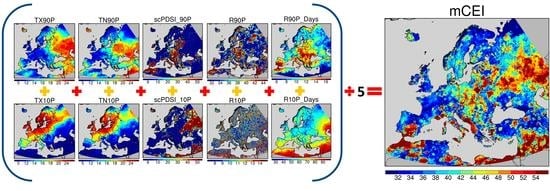
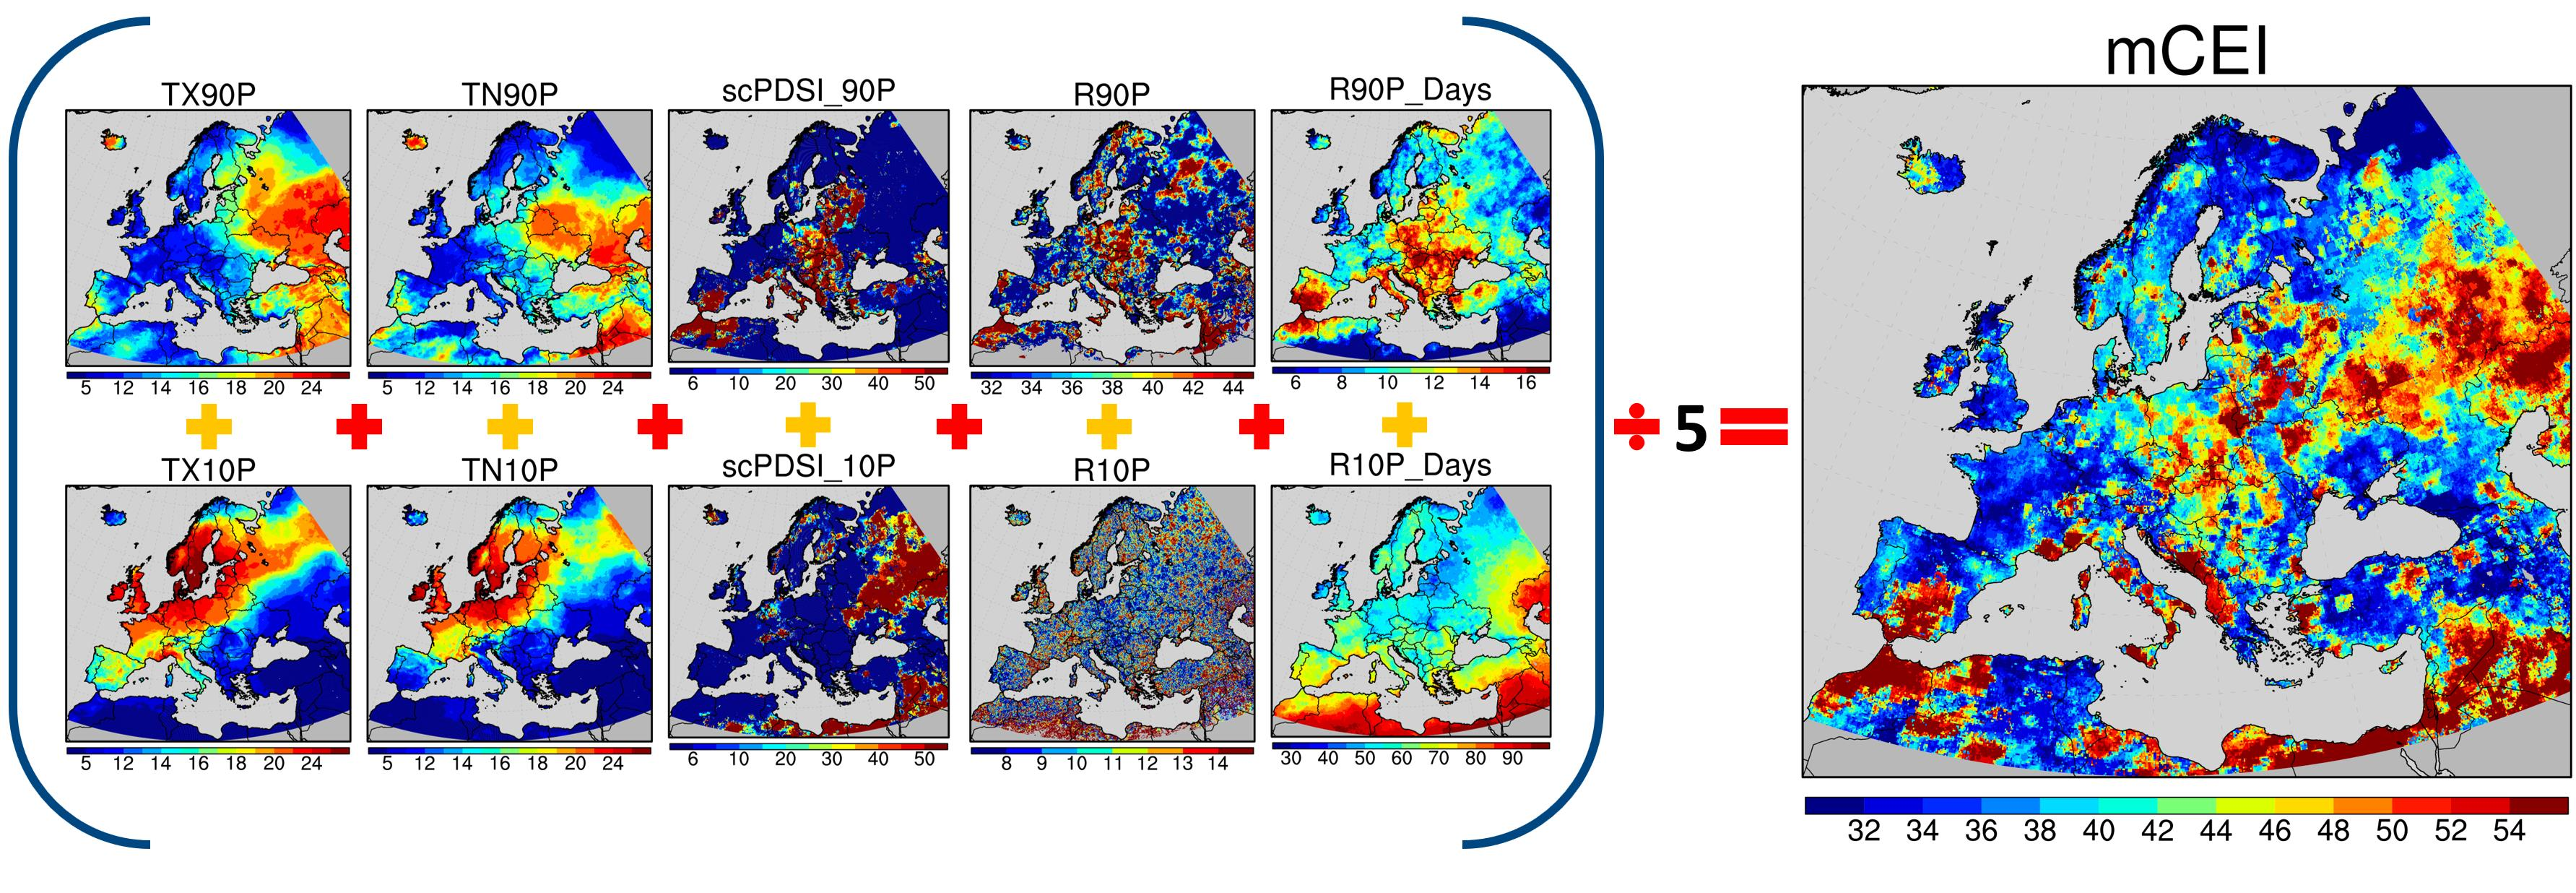
2.2. Climate Extremes Index

The original version of CEI is based on a set of climate extreme indicators that measure the fraction of an area of the U.S. experiencing the combined impact of climate extremes. It consists of five indicators that illustrate 10 possible extremes in monthly mean maximum and minimum temperatures, extreme 1 day precipitation, days with/without precipitation, and the Palmer Drought Severity Index (PDSI). Detailed information regarding the original CEI methodology can be found on the website of the National Oceanic and Atmospheric Administration (NOAA) [41]. Compared to the original CEI, there are two main differences in our methodology (mCEI) (Table 1). First, we calculate mCEI as the arithmetic mean of five indicators that measure the temporal percentages of extremes on every grid point instead of the fraction of specific areas (e.g., county, province, state) under the influence of extreme conditions. While defining the extreme conditions, percentile-based indexes can be preferred if there is a long enough base period record (e.g., 30 years) for the threshold calculations [42]. The number of extremes for each indicator is calculated in terms of occurrences above (below) the 90th (10th) percentile value at each grid point (Figure 1). Each of the percentile values is calculated by using the 1981–2010 World Meteorological Organization (WMO) standard reference period. We believe this change prevents the loss of information over the regions with complex topography and different land-use characteristics that can cause different climate conditions. Second, we calculated the 4th indicator (Table 1), using the 90th and the 10th percentiles of each grid cell rather than a fixed threshold (50.8 mm). As mentioned in Zhang et al. [17], this alteration enables the definition of representative percentiles for the area of interest and avoids any spatial misinterpretations over broad areas. Details related to the modifications and differences between CEI and mCEI can be found in Table 1.

3. Results and Discussion

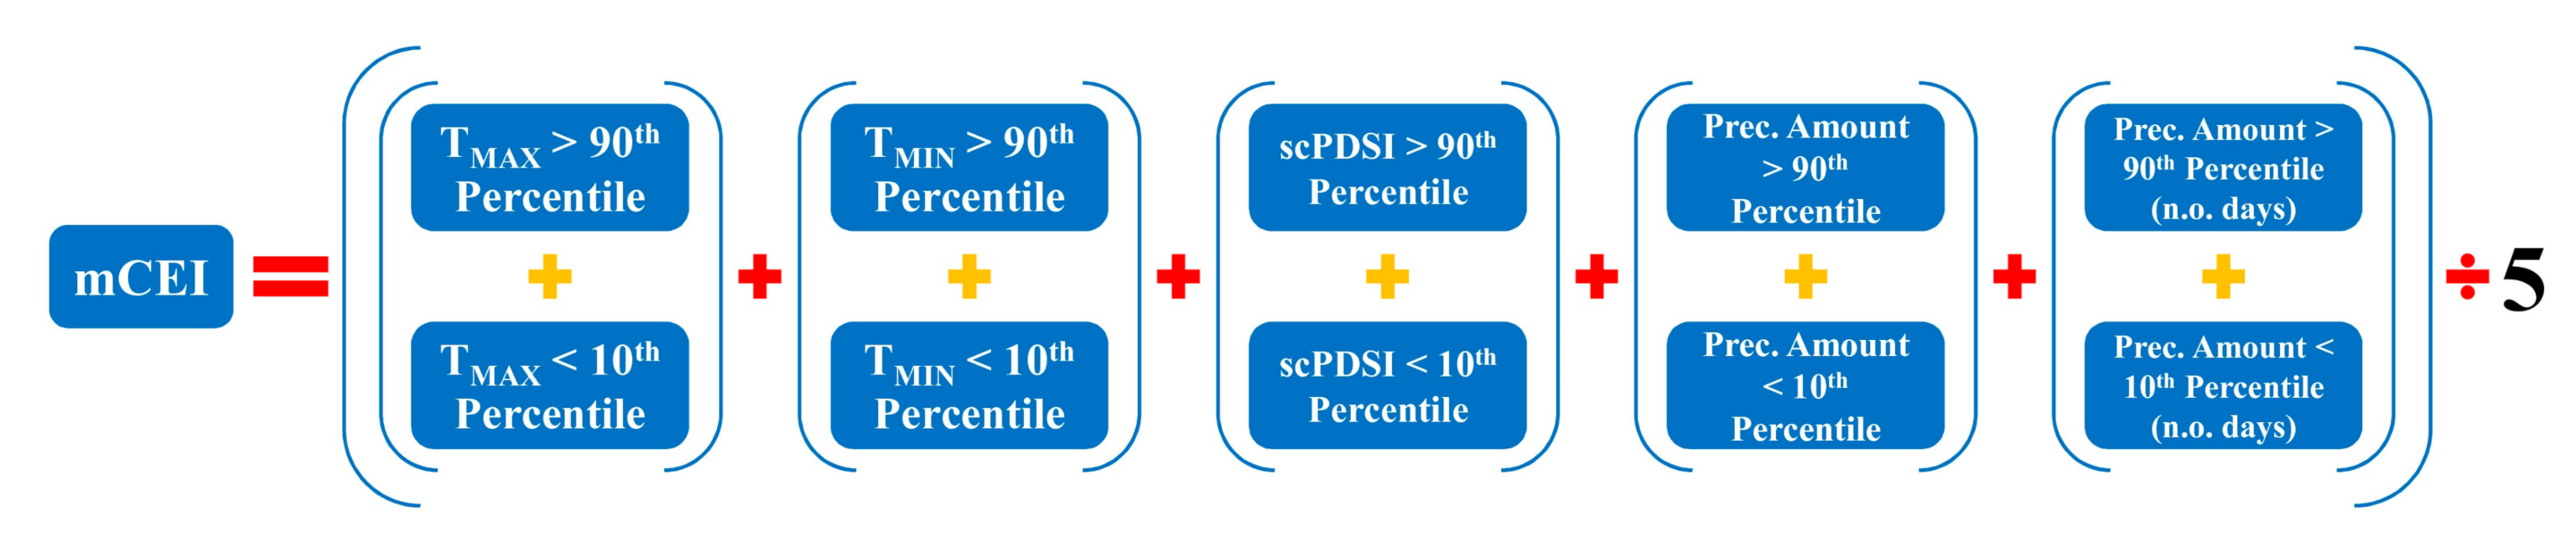
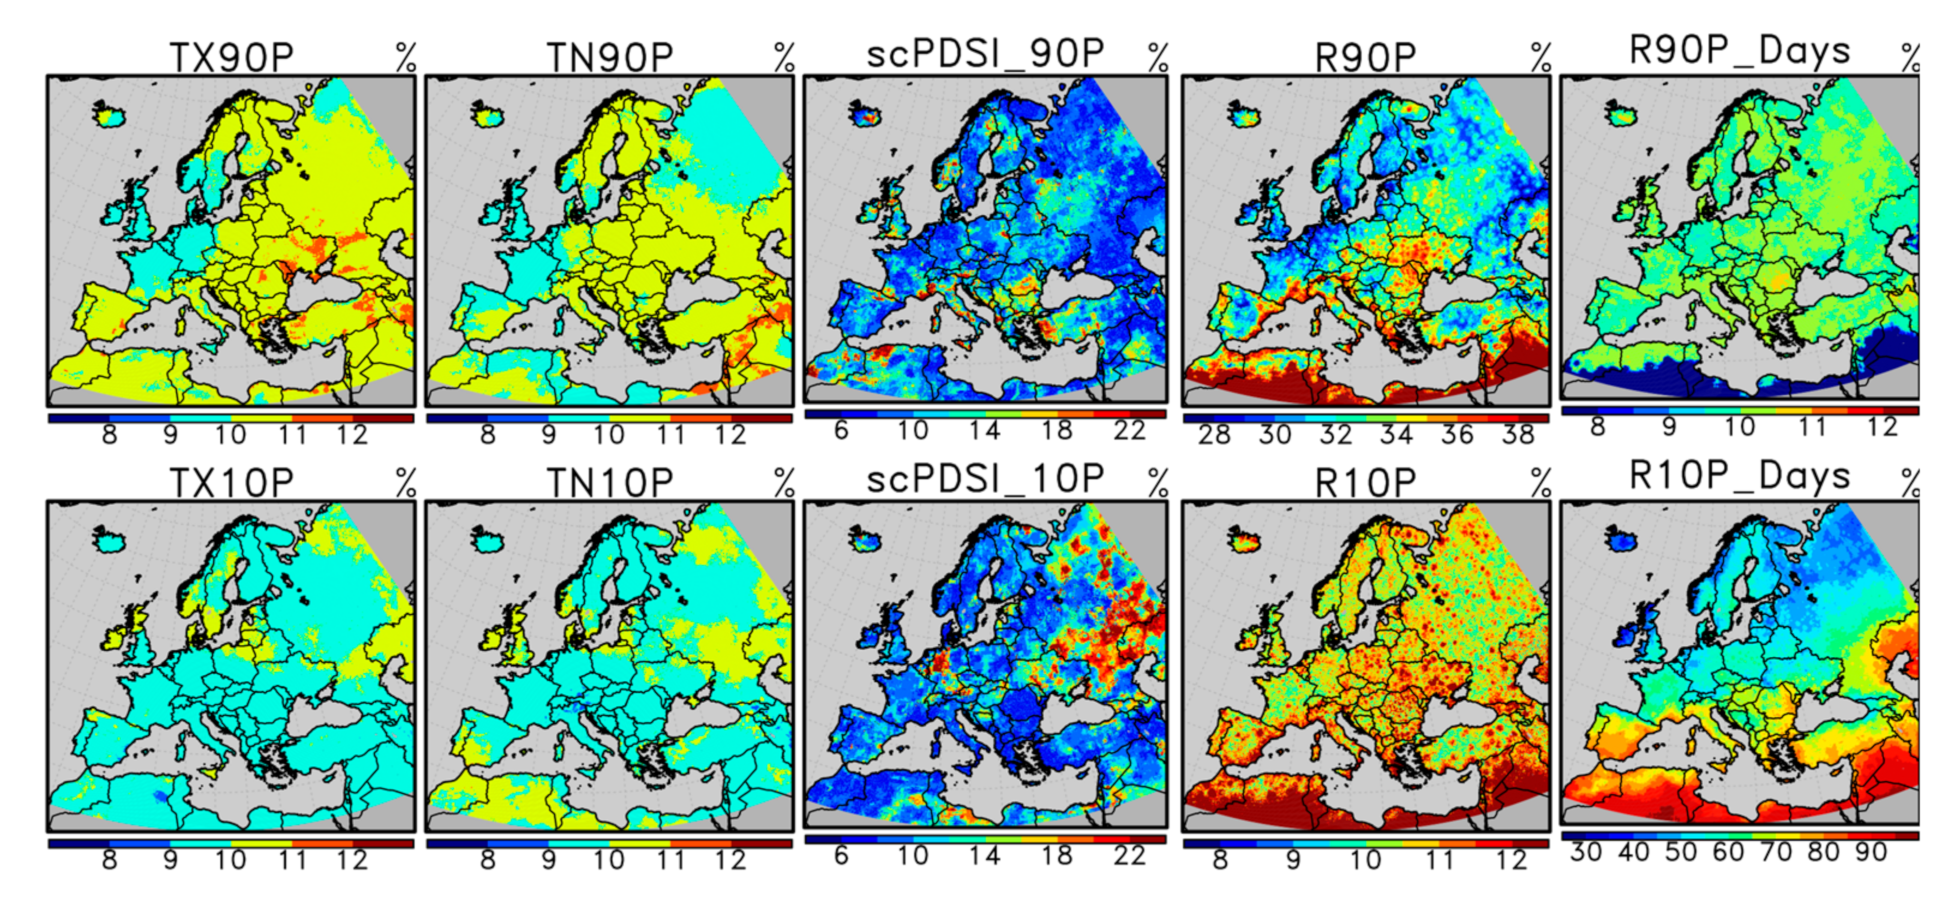
3.1. Climatology of the Extreme Indexes Composing mCEI

We examine each of the indexes in detail that construct the mCEI in terms of climatology and thresholds. Figure 2 shows the spatial distribution of the 90th and the 10th percentiles of the reference period for the extreme indexes. Temperature thresholds for warm (TX90P, TN90P) and cold (TX10P, TN10P) extreme indexes change gradually from north to south, except over the mountainous areas. The reason for the change toward the south and the extreme values over the mountainous regions can be explained by the latitudinal distribution of the solar radiation and high elevations, respectively. The thresholds for moisture surplus (scPDSI_90P) and extreme drought (scPDSI_10P) indexes exhibit expected values for wet and dry cases. The most prominent characteristic of the extreme precipitation (R90P, R90P_Days) and dry day (R10P, R10P_Days) indexes is the fact that they have the highest thresholds over the western coasts (western coasts of the Balkans and Norway, the northwest of Portugal and Spain, the Aegean coasts of Turkey, the Black Sea coast of Georgia, and the East Mediterranean coasts), which represent the climate of these regions. The reasons for these higher values of extreme thresholds are the prevailing east–west wind direction and the synoptic-scale motions over the EURO–MED region. Similar dynamics are evident for mountainous areas due to orographic forcing.
Long-term (1979–2016) averages of the extreme indexes above (below) the 90th (10th) percentile are given in Figure 3. The area of interest is exposed to warm days and warm nights in the range from 9% to 12%, and cold days and nights in the range from 8% to 11%. The regional differences in moisture surplus and extreme drought indexes are considerably large. The most notable exposure to the extreme moist conditions is over western Turkey, the Balkans, Italy, eastern Iceland, the Mediterranean coasts of France, Italy, and Algeria, and the United Kingdom (18–22%). The climatological mean for the extreme drought intensity exceeds 22% over Germany, Ukraine, and western Russia. The climatology for the annual ratio of extreme precipitation amount to the total precipitation (R90P) has diverse regional distribution and reaches the maxima over Eastern Europe, the Balkans, and the Mediterranean coasts of Europe (>37%). The fraction of extremely wet days (R90P_Days) has a spatially coherent distribution over Europe, and 1979–2016 averages are between 9% and 11%. The annual ratio of precipitation amount during dry days (the days with a precipitation amount less than the 10th percentile threshold) to the total precipitation (R10P) has local hotspots, while the annual count of dry days (R10P_Days) increases from north to south (30–90%).
Concerns may arise as to whether the choice of a percentile-based threshold at each grid point or a fixed value for all locations represents the extreme precipitation indexes. Although the index mathematically indicates extreme precipitation, is it an extreme condition regarding its impacts on a region? For example, although the thresholds over Tunisia and Peloponnese Peninsula are different (15–18 mm and 36–39 mm, respectively), the R90P_Days index over these regions is around 10%. However, considering the duration and total precipitation amount for the two locations, the environmental and economic impacts would probably be different.

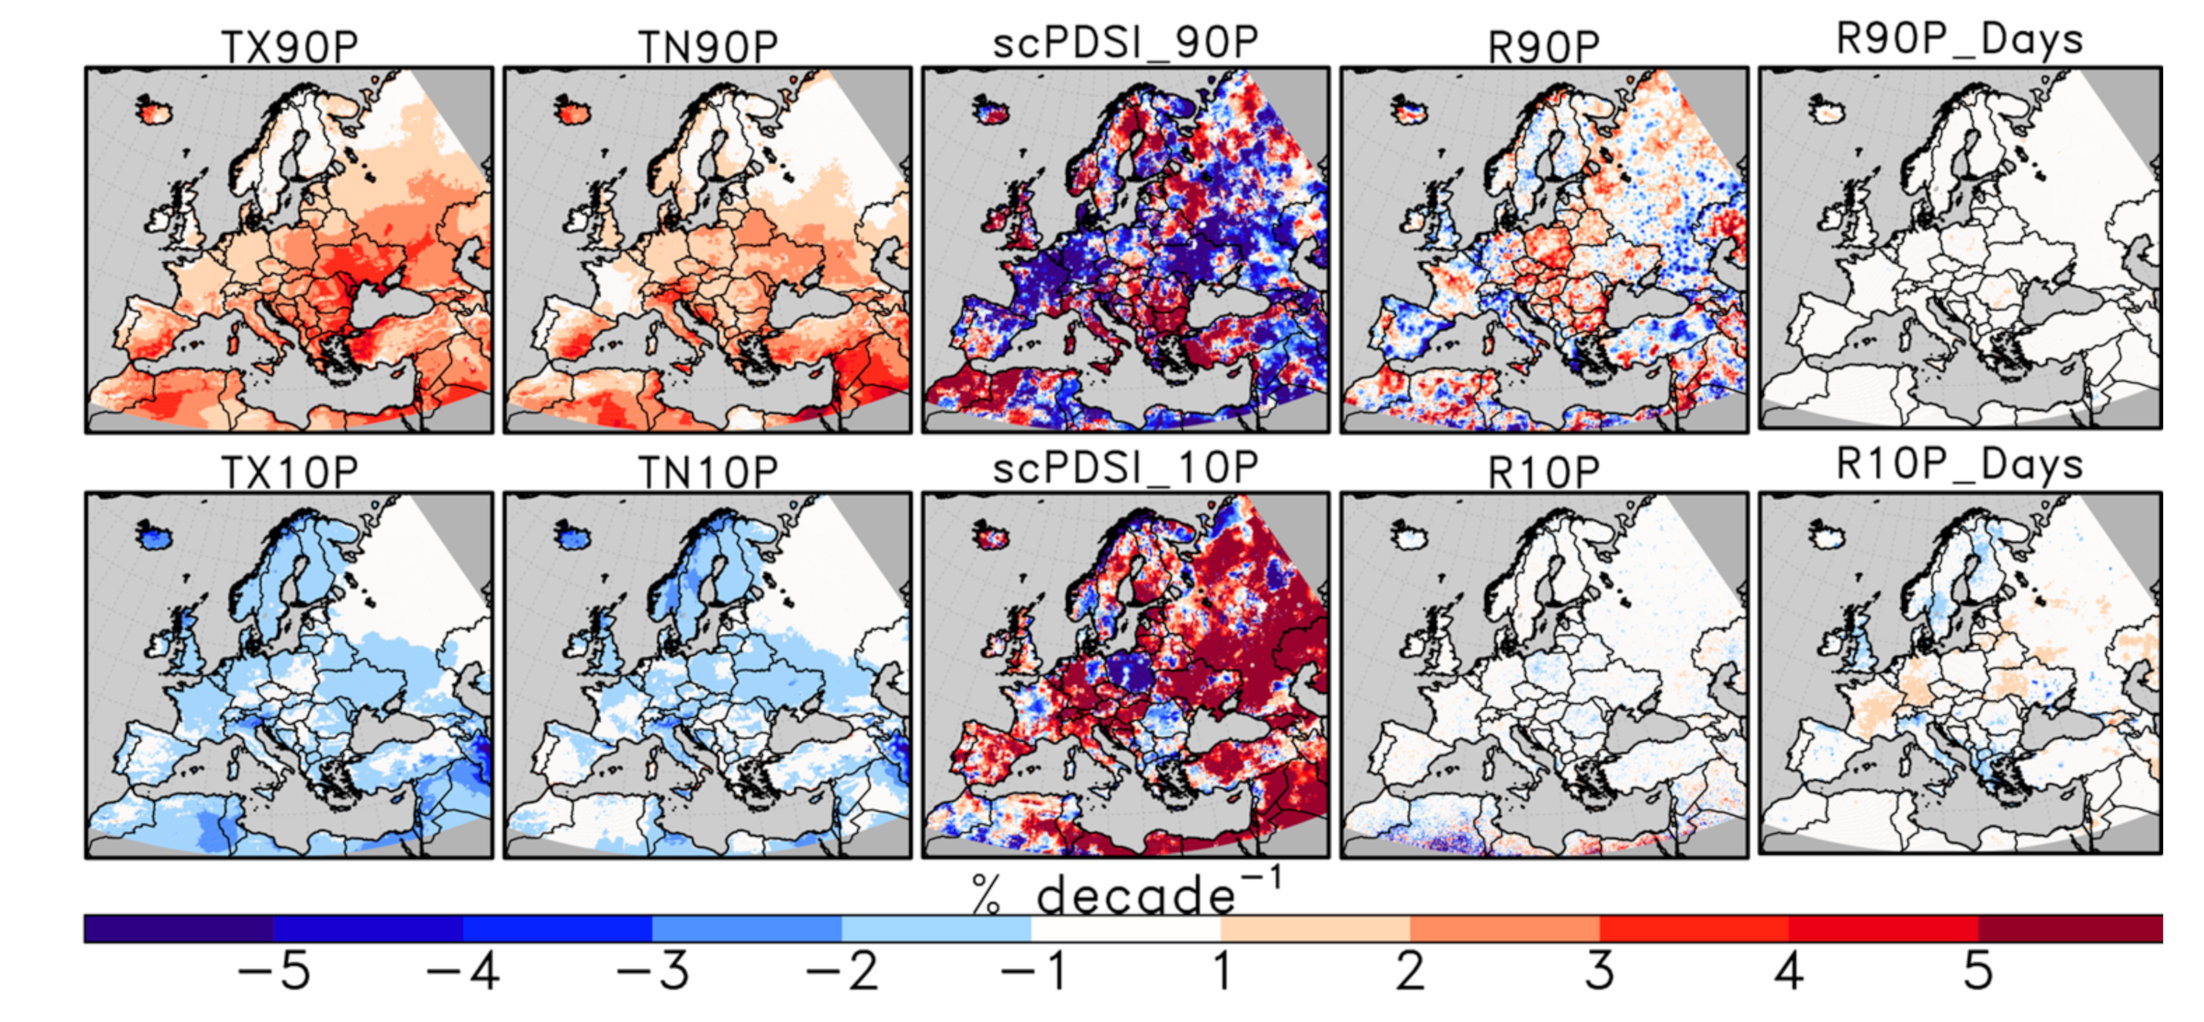
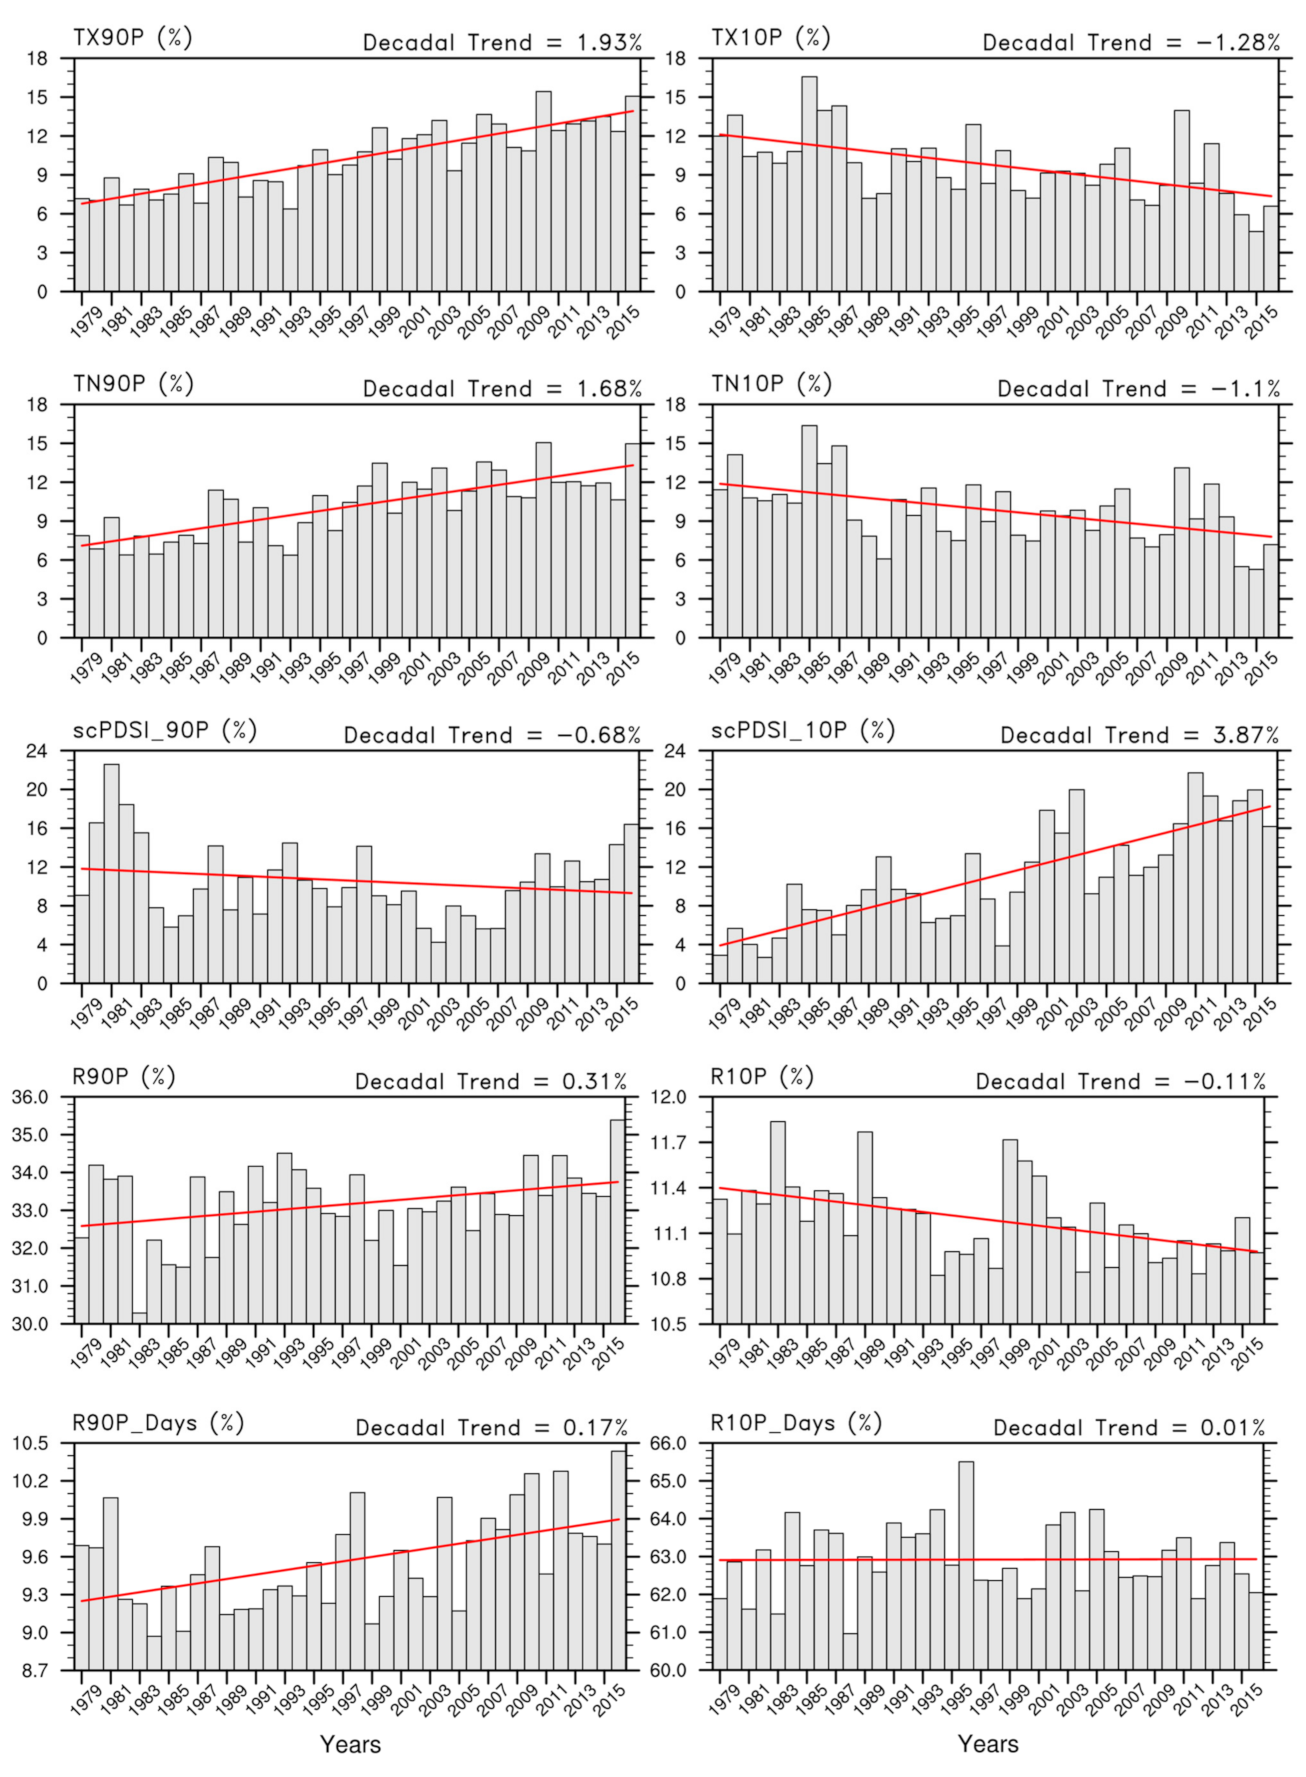
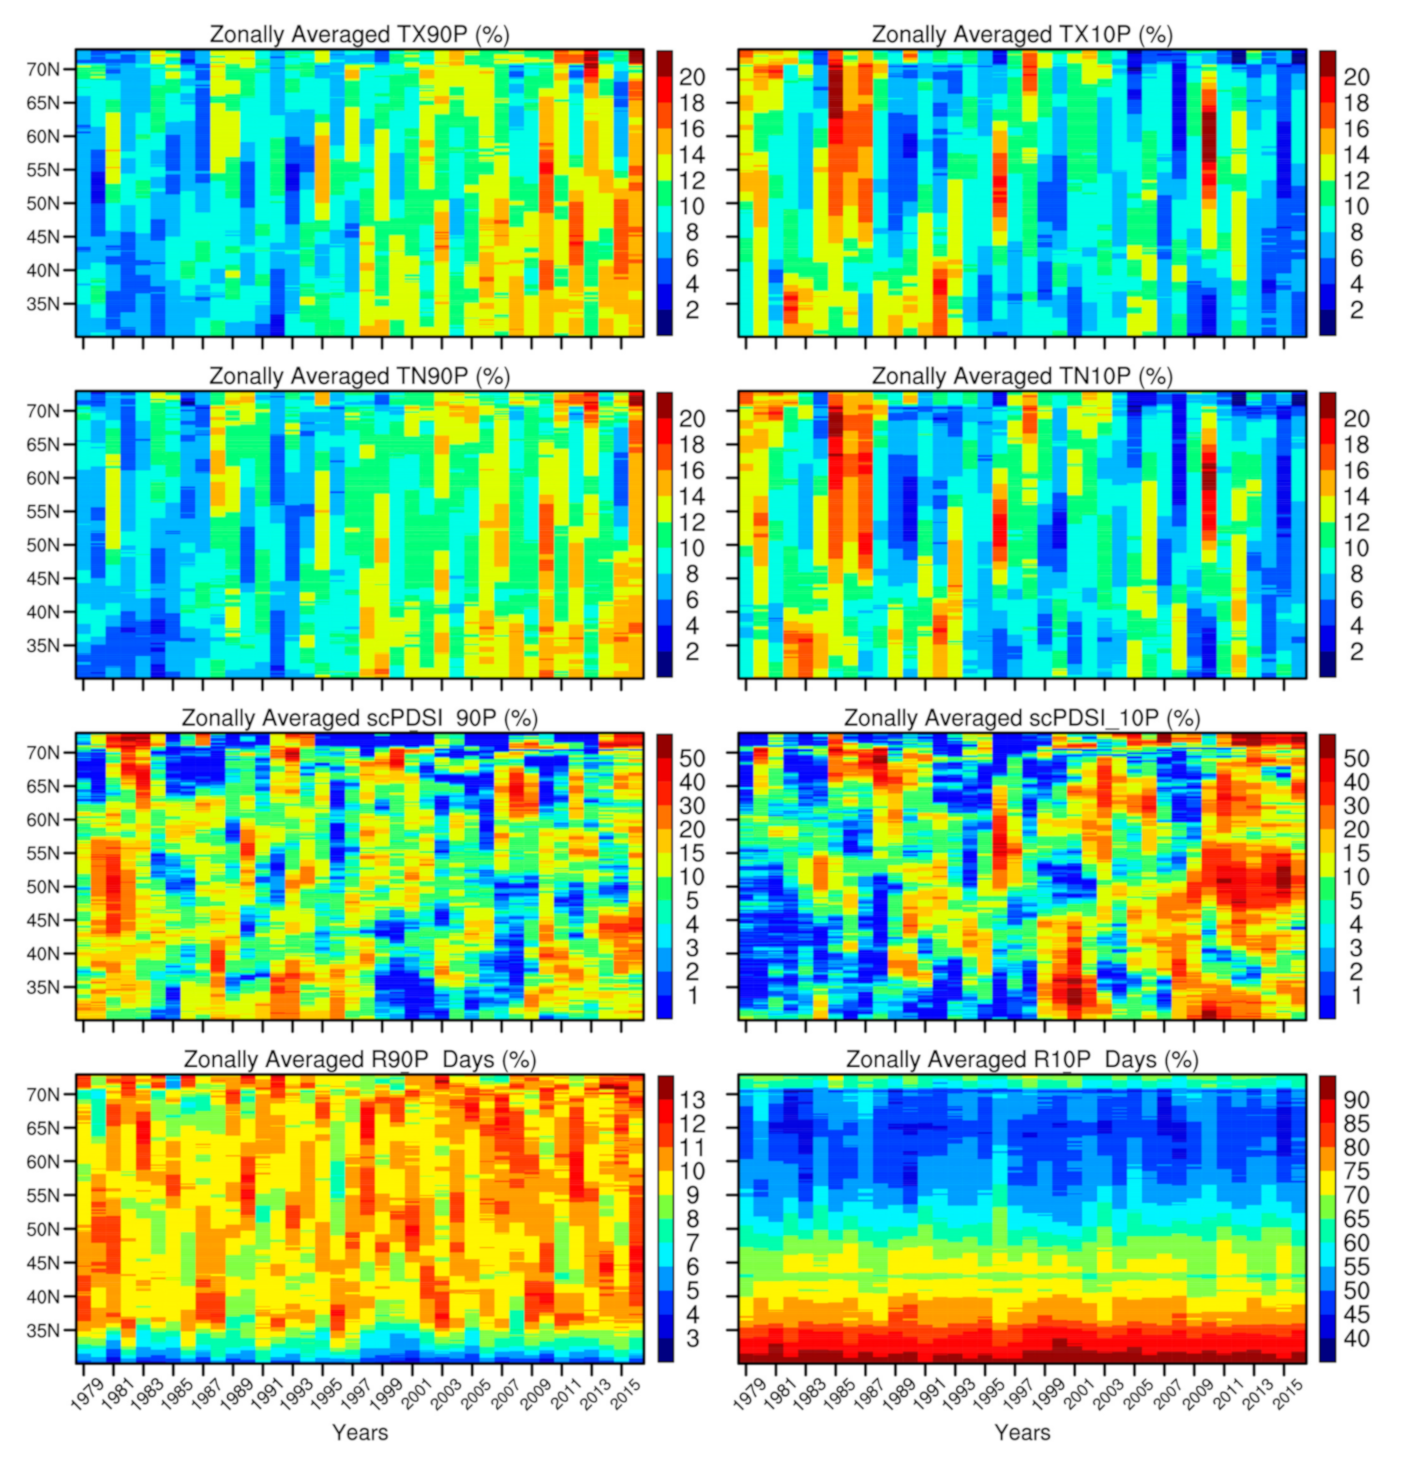
3.2. Changes in the Extreme Indexes: Spatial and Temporal Analyses

Figure 4 shows the spatial distribution of the decadal trends in each extreme index for the 1979–2016 period. The EURO–MED region is exposed to increasing warm temperature extremes. The increasing trend over Italy, Iceland, Eastern Europe, the Balkans, North Africa, and the Middle East is between 2% and 4% decade−1. The highest increasing tendency is over western Turkey, Israel, the Black Sea coasts of Ukraine and Romania, and the south of Portugal (>4% decade−1). Unlike the warm extremes, there is a dominant decreasing tendency in cold extremes. The fastest decline is over the northwest of Iceland (around −4% decade−1) and the northeast of Iran (down to −5% decade−1).
For extreme moist and dry conditions, the EURO–MED region exhibits regional contrasts. There is an increasing tendency in moisture surplus over the northern, western, and southern regions of Turkey, the Balkans, Italy, parts of the Mediterranean coasts, Iceland, the United Kingdom, the north and southwest of Scandinavia, and the north of western Russia of up to >5% decade−1. On the other hand, Central Europe, Ukraine, and most of the Middle East and the coasts of Africa exhibit a decreasing tendency, down to −5% decade−1. Severe drought conditions increase up to 5% decade−1 over the EURO–MED region with few exceptions having decreasing signals (e.g., Poland and the northern parts of the Balkans).
Changes in the extreme precipitation and dry day indexes are lower in magnitude compared to the other indexes. The increasing tendency for the extreme precipitation rate (R90P) reaches up to 4% decade−1 over Iceland, Eastern Europe, the Balkans, the south of Italy, and the southwest and the northeast of Turkey. The rest of the precipitation indexes exhibit a tendency of less than 1% decade−1 across the EURO–MED.
Figure 5 shows the time series of extreme indexes for the areal average over the EURO–MED region. During the study period, exposure of the warm extremes is between 6% and 15% and reaches the maxima in 2010. The cold extreme indexes vary between 5% and 16% and make a peak in 1985. For extreme precipitation indexes, the extreme precipitation rate (R90P) is between 32% and 37%, and the fraction of extreme wet days (R90P_Days) varies between 8.5% and 10.4%. Both of the indexes reach the maxima in 2016. For dry day indexes, the R10P index is between 10.8–11.8%, and the ratio of dry days (R10P_Days) varies from 61% to 65.5%. R10P and R10P_Days peak in 1983 and 1996, respectively. For extreme moist conditions, scPDSI_90P ranges between 5% and 23% and reaches the maximum in 1981. In terms of aridity, scPDSI_10P varies between 2% and 22% and reaches its maximum in 2011.
As a trend analysis, we applied linear regression for extreme indexes and tested the significance of the trends by using the two-tailed Student’s t-test. Regression equations and the p-value of the trends are given in Table 2. For the warm extremes, TX90P and TN90P show a significant increase of 1.93% decade−1 and 1.68% decade−1 at 99% level of confidence, respectively. Changes in the cold extreme indexes are significant at the 99% confidence level. TX10P exhibits a decrease of −1.28% decade−1, while the decrease for TN10P is −1.1% decade−1. These results reveal that changes in the daytime temperature extremes are greater than the nighttime temperature extremes both for warm and cold conditions.
Extreme precipitation indexes, R90P and R90P_Days, increase at a rate of 0.31% decade−1 (at 95% confidence level) and 0.17% decade−1 (at 99% confidence level), respectively. The greater increase in the extreme precipitation rate compared to the annual count of extreme wet days implies an intensification in 1-day precipitation extremes. On the other hand, as a dry day index, R10P has a significant decreasing tendency of 0.11% decade−1 (at 99% confidence level), which indicates that the ratio of the precipitation amount during dry days (the days with precipitation amount less than 10th percentile threshold) to the total precipitation has increased. There is no significant change in the annual count of dry days.
In terms of extreme drought, scPDSI_10P increases significantly (at 99% confidence), and the trend reaches 3.87% decade−1. Although extreme moist conditions exhibit a decreasing tendency, it is statistically not significant. In addition, it is important to note that extreme drought events and extreme moist conditions are closely related to the temperature and precipitation variables. Thus, they should not be considered separately. Although there is an increasing signal both for warm and precipitation extremes, the increase in warm extremes is more prominent.
In order to improve our understanding of the spatiotemporal variability of the extreme indexes, we calculated zonal averages over the EURO–MED region (Figure 6). For the warm extremes, the increasing signal of the indexes is prominent between the 30° N and 55° N latitudes. In terms of extreme drought, at the beginning of the 21st century, the highest values of scPDSI_10P are localized in the latitude band of 30° N to 40° N. After 2010, the highest values of the index, exceeding 50%, are localized around the 50° N–55° N latitudes. Another hotspot for the warm extremes and the extreme drought is the higher latitudes, north of 65° N, of the EURO–MED region. The decrease in the cold extremes is apparent in the same region. scPDSI_90P and R90P_Days indexes do not have hotspots for the latitudinal effects. Among these indexes, the most significant latitudinal differences occur in the R10P_Days index. The highest index values are over the lower latitudes of the EURO–MED region, whereas the lowest ones are over the northern areas. On the other hand, although there is a significant latitudinal difference, R10P_Days do not change significantly during the study period for the whole latitude band (30° N–70° N) (Figure 6). Therefore, changes in the multivariate extremes do not depend on the changes in R10P_Days, and latitudinal differences are negligible.

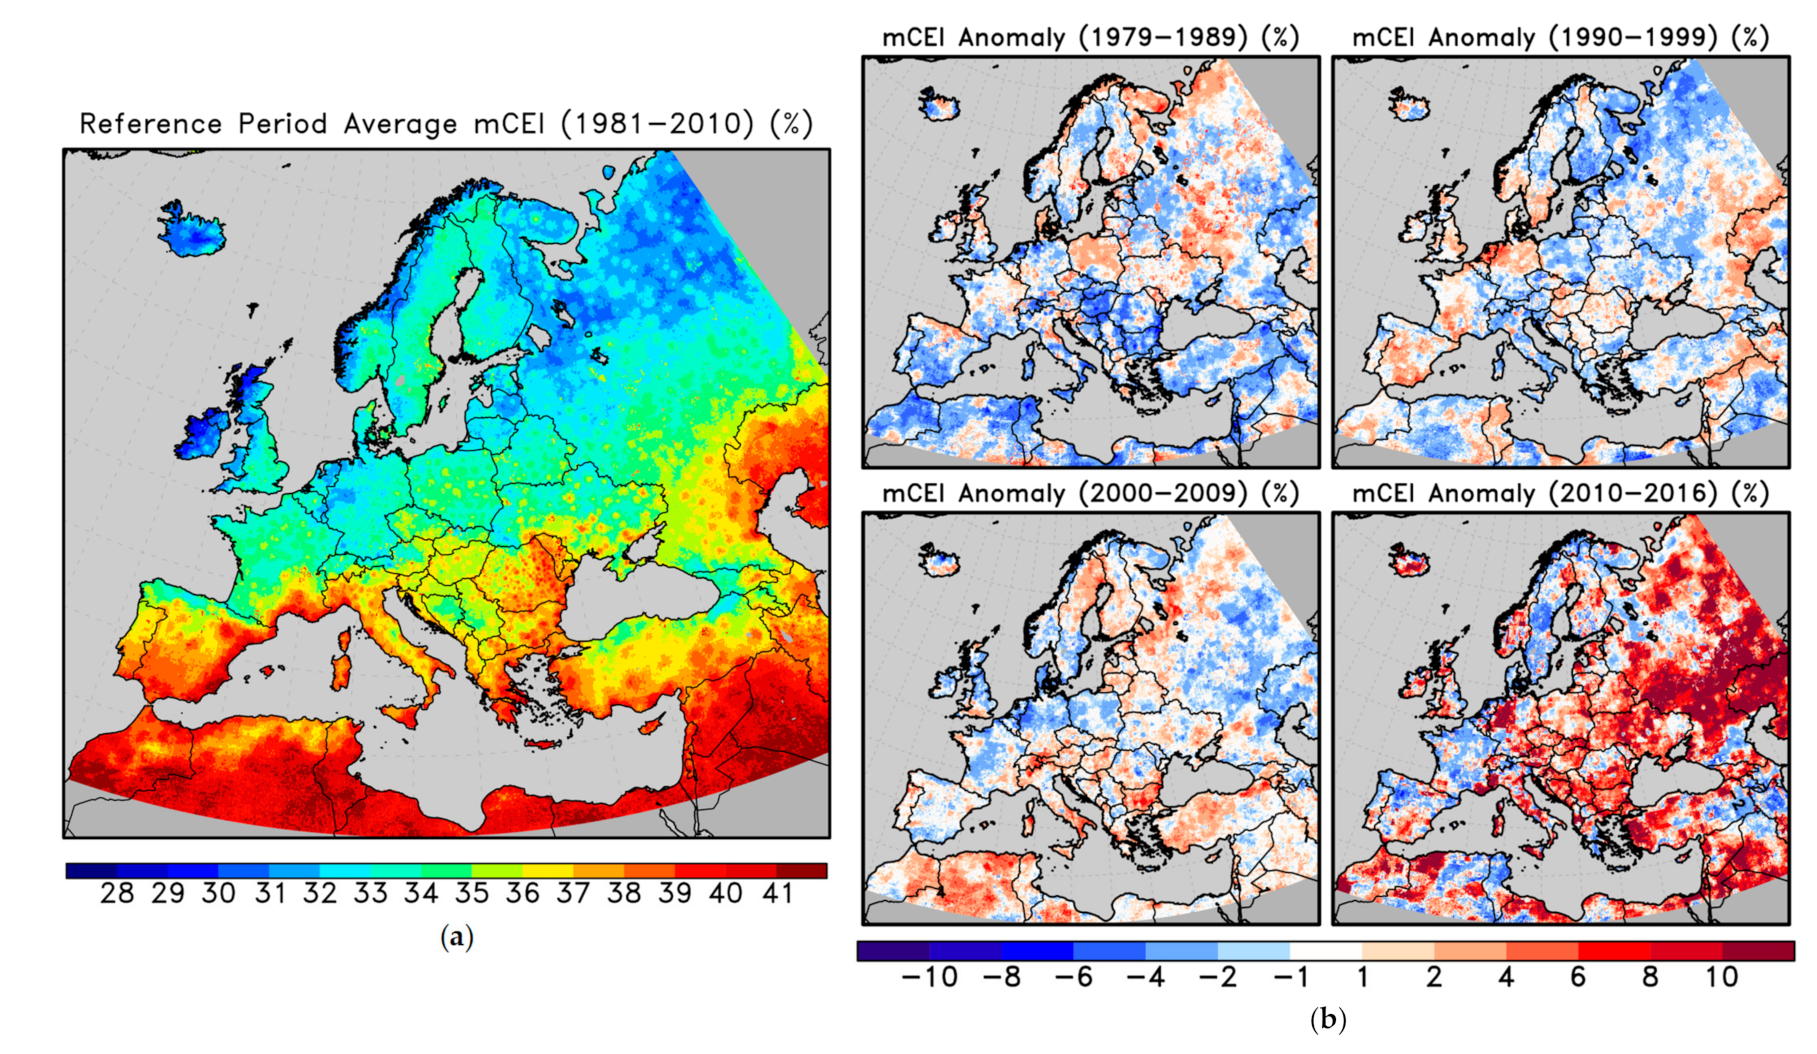
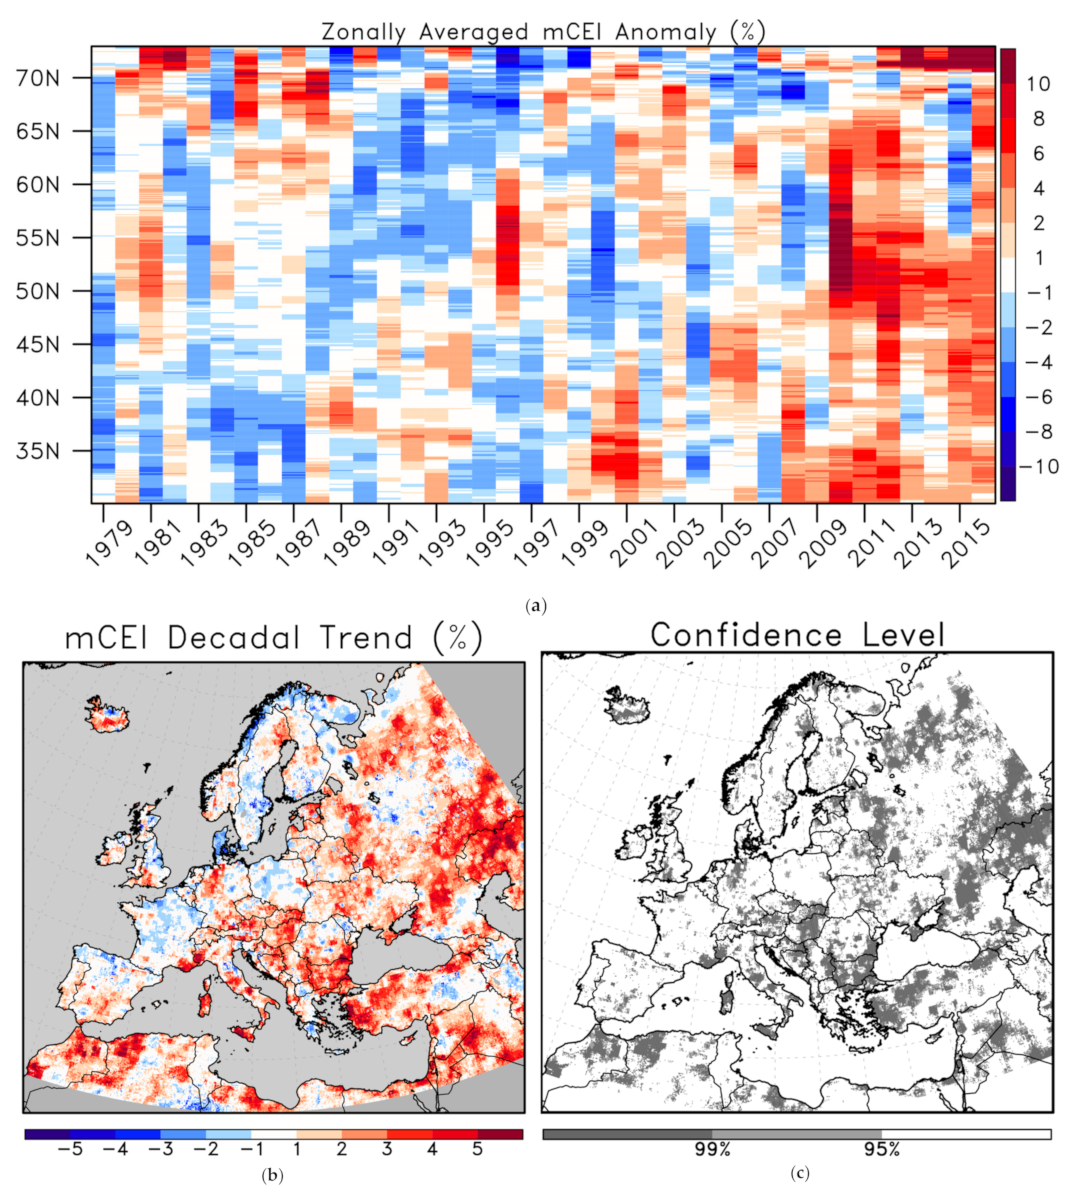
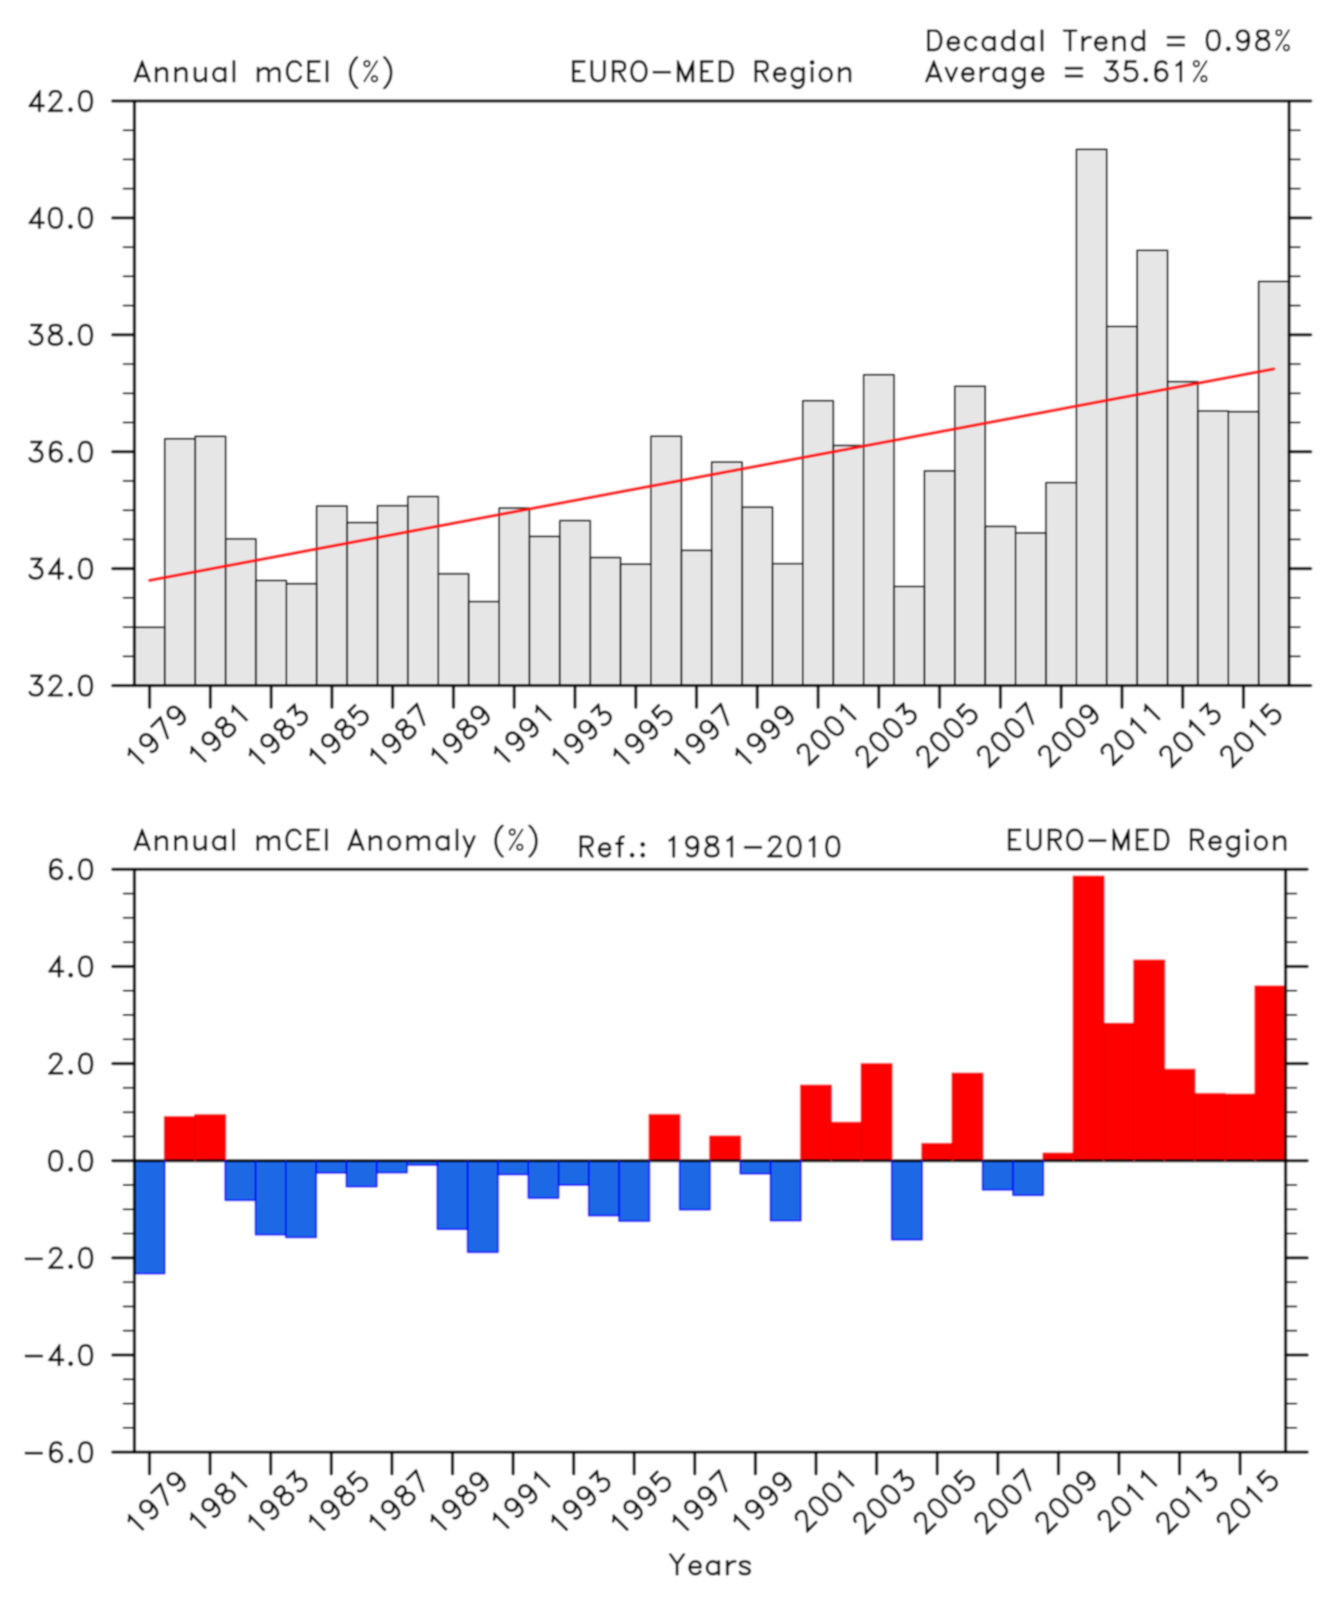
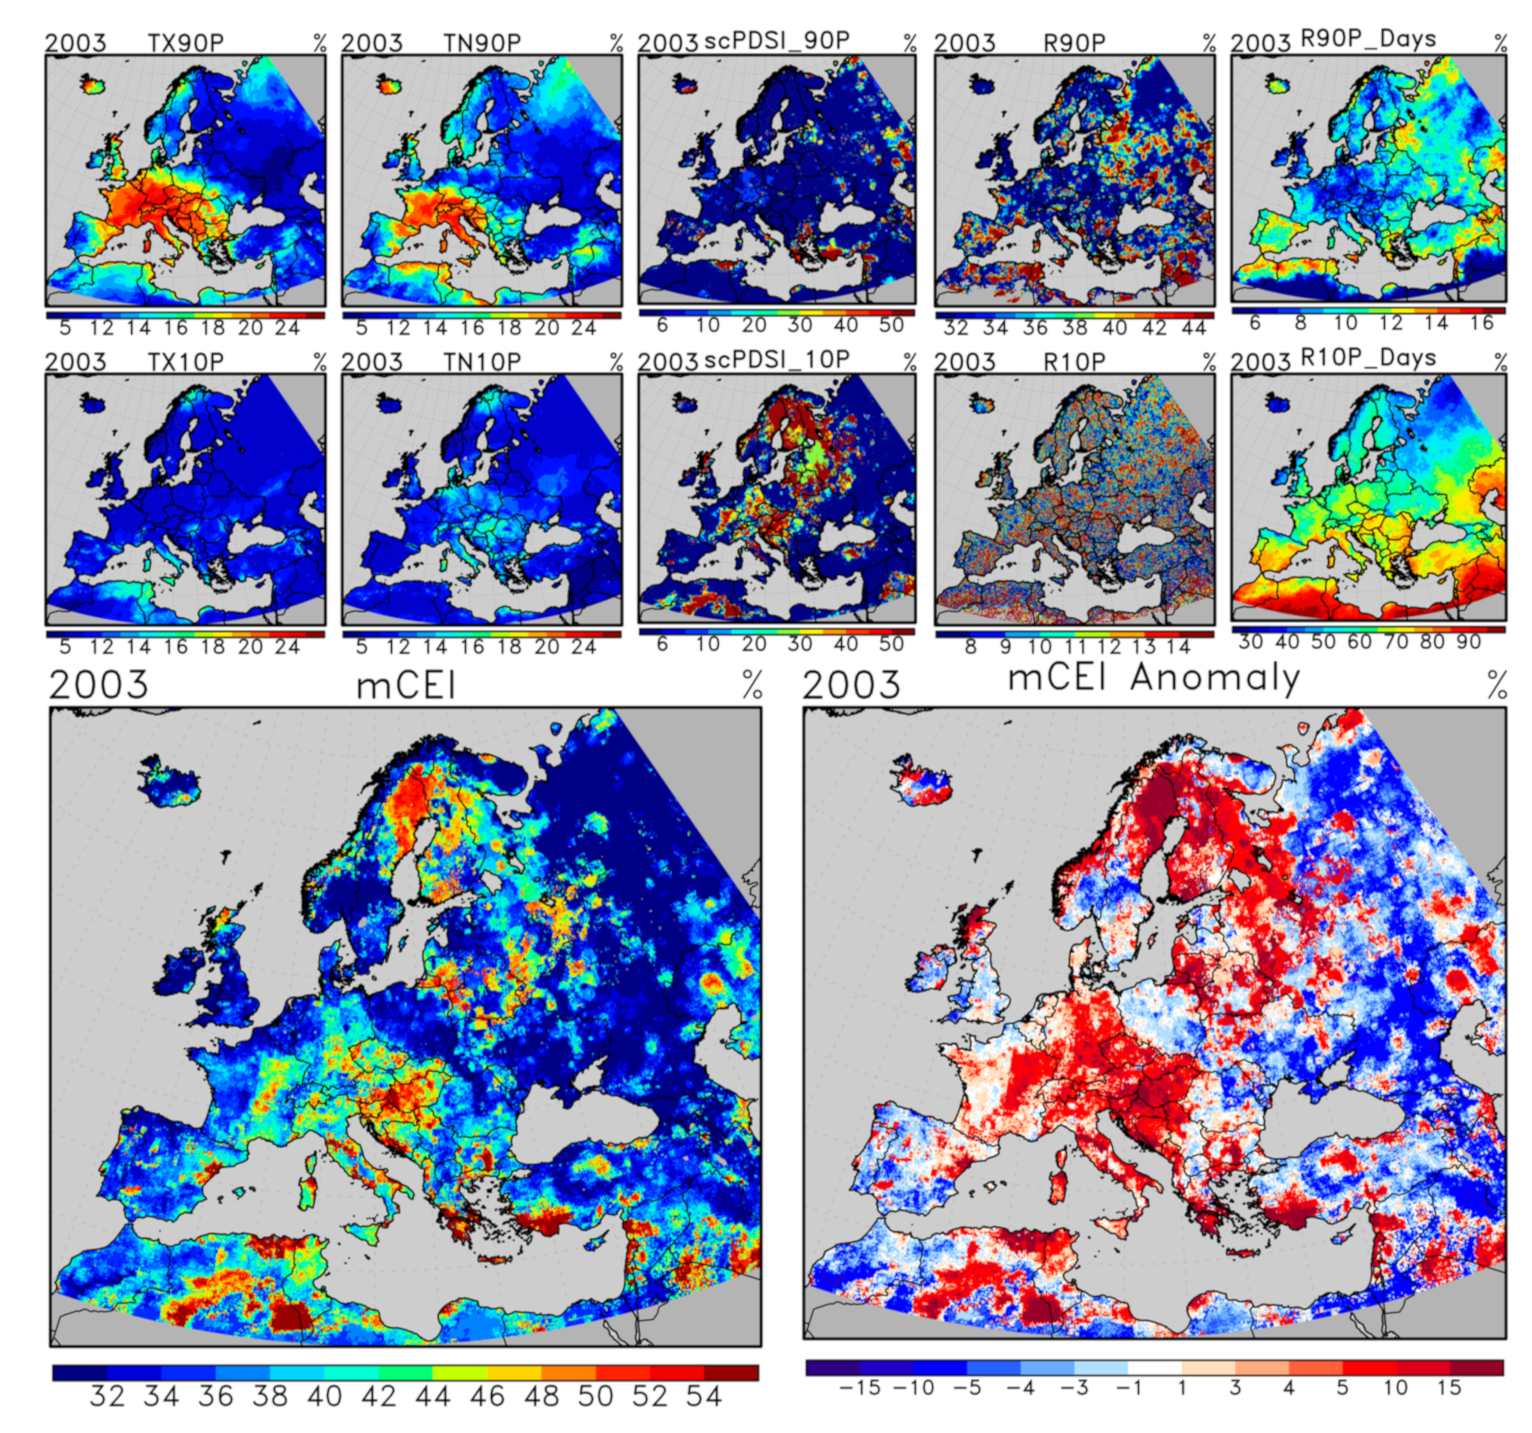
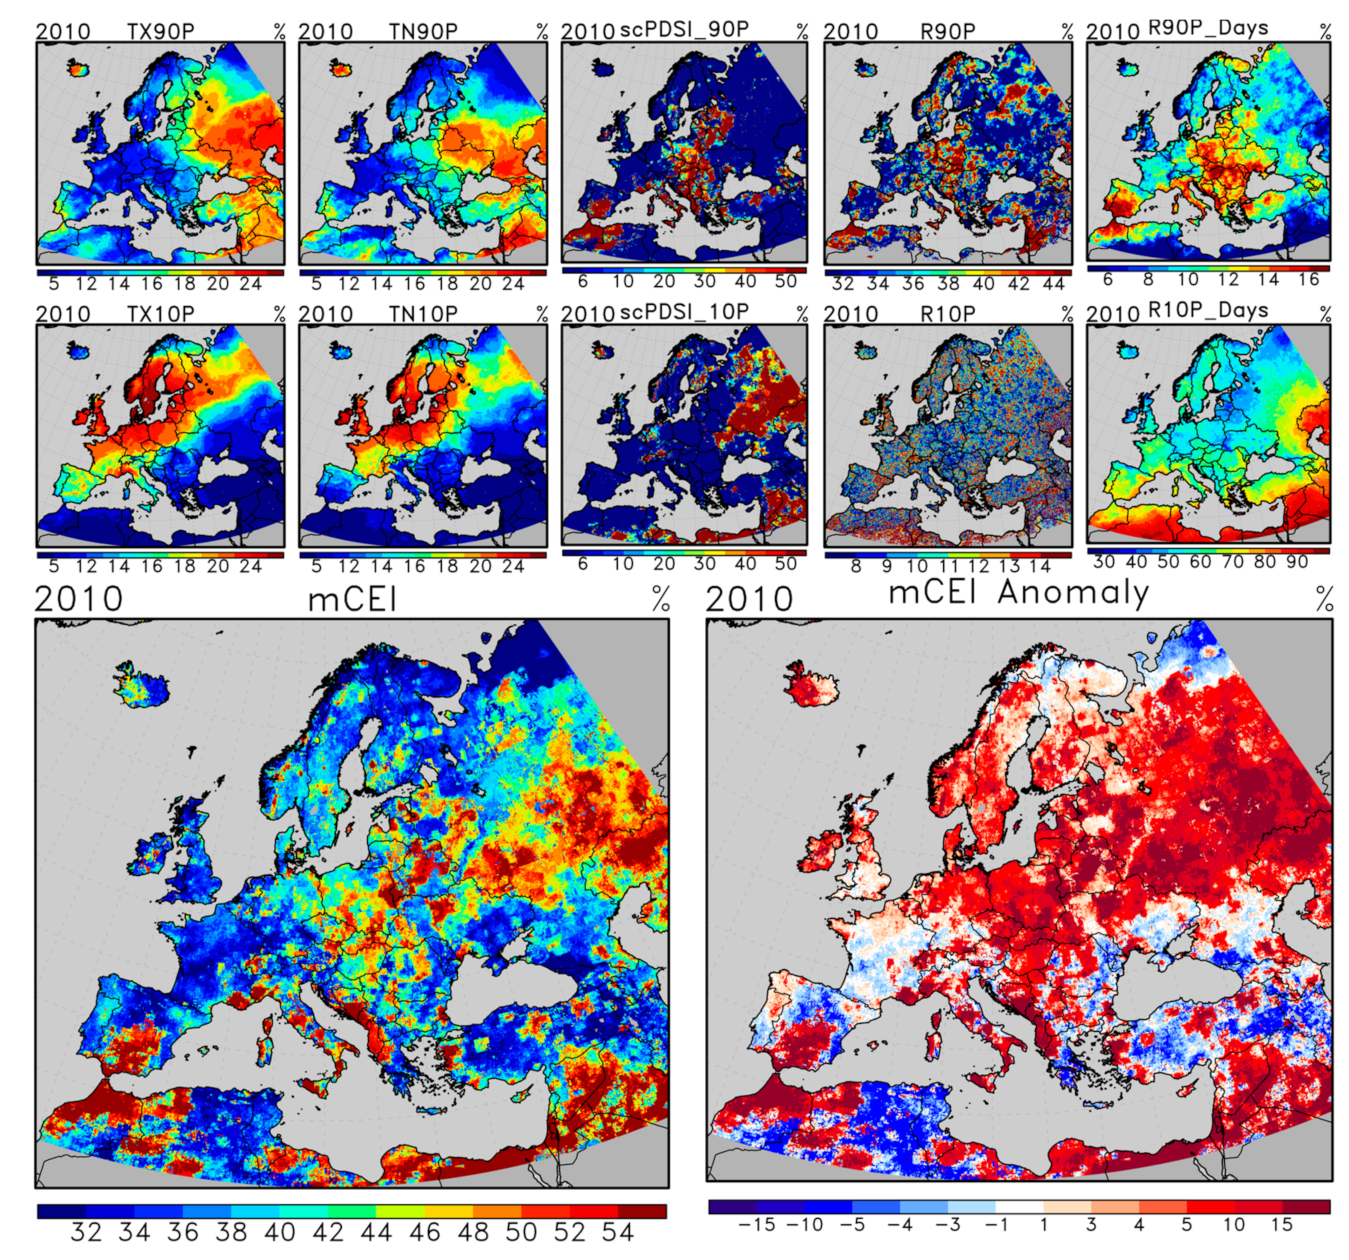
3.3. Modified Climate Extremes Index (mCEI): Analyses of Climatology, Decadal Anomalies, and Extreme Years

mCEI is an integral measure of the effects of extreme climatic conditions. As a holistic approach, it provides spatiotemporal information on an annual timescale. It combines 10 different extreme indexes to comprise the five main indicators to measure the combined temporal intensity of temperature and precipitation extremes and the drought or moisture surplus on an area of interest. Figure 7a shows the reference period (1981–2010) average of mCEI. Between 1981 and 2010, the mean of mCEI is between 29% and 41% over the EURO–MED region. In terms of spatial distribution, exposure to the combined extremes is more intense over the south of the study area. This north–south gradient is due to the higher values of annual counts of dry days over these regions, determined by the R10P_Days index. The climatological mean of the R10P_Days index is higher over the south of the EURO–MED region. Thus, although the components of the mCEI are equally weighted, it has a bias toward higher values over dry areas. However, since there is not a significant trend in the R10P_Days index across the EURO–MED region, its contribution to the temporal changes in mCEI can be neglected. Therefore, it is more appropriate to analyze the anomalies and trends in mCEI compared to its temporal averages for a meaningful spatial comparison. Thus, we calculated decadal anomalies of mCEI with respect to the reference period (Figure 7b). Between 1979 and 1989, negative anomalies of mCEI are dominant across Europe, yet there are positive anomalies between 2% and 6% over Eastern Europe, western Russia, the northwest of Norway, the United Kingdom, the Pyrenees, and the northeast of Italy. From 1990 to 1999, positive anomalies are around 4% over the south of Scandinavia, Western Europe, Tunisia, and the southeast of Turkey. Between 2000 and 2009, positive anomalies become prominent, especially over the Balkans, the Alps and Italy, the northwest of Africa, and Turkey (6–10%). During the 2010–2016 period, positive anomalies of mCEI are dominant across the EURO–MED region and are greater than 10%. Even so, there are negative anomalies over Scandinavia and Western Europe.
The zonally averaged anomalies and decadal trend of mCEI along with the confidence level are given in Figure 8. The spatial distribution of the change over the interested region is quite divergent. The most significant increase in the combined extremes is after 2010 in the latitude band 50° N to 55° N due to the rise of the warm extremes and extreme drought (Figure 6). It is important to note that the combined extreme increases at lower latitudes because of the more pronounced extreme drought which is captured by the positive mCEI anomalies exceeding 6–8%. Fleig et al. [43] studied the connections between severe hydrological droughts and weather types by using the Regional Drought Area Index (RDAI) and found that Denmark and Great Britain were exposed to a large-scale drought in the summer of 1996 due to the existence of a high-pressure system. Moreover, Spinoni et al. [44] developed a multi-indicator drought index comprising three different drought indexes to study the most prominent drought events over Europe. They found that 1996 was one of the most severe drought years due to the shortage of precipitation over Northern and Central Europe. In 1996, scPDSI_10P is at a maximum in the latitude band 50° N to 60° N and exceeds 40% (Figure 6). Additionally, the fraction of extreme dry days (R10P_Days) reaches 70% related to the arid conditions in the same latitude band. Furthermore, TX10P and TN10P exceeding 18% are the indicators of extreme cold conditions in 1996 between 50° N and 55° N latitudes. In the same year, the mCEI anomaly is greater than 8% and captures these combined extremes in the latitude band of 50° N to 60° N. Furthermore, the Mediterranean coasts, the Balkan countries, Eastern Europe, except for Poland and Moldova, the south of western Russia, the west and the northeast of Anatolian Peninsula, and western Iraq exhibit an increasing trend, reaching up to 5% decade−1 at 99% confidence level. In other words, these hotspot regions are exposed to an increase in the combined extreme conditions on an annual timescale.
The mCEI increase in the Arctic circle is mainly related to the Arctic amplification in the recent decades (Figure 8). The hotspot for the combined extremes is north of 60° N latitude with a significant positive trend of mCEI over Iceland, the north of Sweden, and the north of western Russia. Arctic sea ice cover exhibits a decreasing trend since 1979 with two minima in 2007 and 2012 [45] due to the rapid warming of the Arctic [46,47]. Donat et al. [48] and Dittus et al. [49] used sea surface temperature (SST) and sea-ice-driven model simulations to compare with the re-analyses and gridded observations of the extreme temperature and precipitation indexes. They stated that the interannual variability of the globally averaged temperature and precipitation extremes can partly be explained by the changes in the SSTs and sea ice. Anomalously high temperatures in the summer of 2014 resulted in a heatwave that affected the Baltic Sea region where the simultaneous coastal upwelling reduced but did not stop the heating effect [50]. Moreover, it is argued that the Arctic amplification may not only have regional impacts but also affects the mid-latitude extreme weather events [46].
Spatially averaged analysis of mCEI over the EURO–MED region for the period of 1979–2016 is given in Figure 9. Between 1979 and 2016, mCEI ranges between 33% and 41% and reaches the maximum in 2010, and its climatological mean is 35.61%. The trend analysis indicates that mCEI increases with a statistically significant trend of 0.98% decade−1 at 99% level of confidence. The decadal means of 1979–1989 and 1990–1999 periods are 34.7% and 34.76%, respectively. For the first two decades, only four years (1980, 1981, 1996, and 1998) show a positive signal. This positive signal is related to the cold extremes and extreme precipitation in 1980, 1981, and 1998, while it is related to cold extremes and extreme drought in 1996 (Figure 5). The increasing signal becomes more prominent after 2000, and positive anomalies become permanent for the eight consecutive years by 2016. The average for the 2000–2009 period is 35.57%. In the 2010–2016 period, the average is 38.32%. The increasing signal in the last decades is due to the increase in extreme high temperatures, extreme precipitation, and extreme drought (Figure 5).
In order to better illustrate how mCEI captures anomalous conditions, we performed snapshot analyses for 2003 and 2010. In the summer of 2003, Europe was affected by a heatwave, which was over the records [51,52]. A persistent ridge–trough couplet centred in the eastern Atlantic resulted in an atmospheric blocking and caused a heatwave over Scandinavia, which was followed by a Central European heatwave due to very weak synoptic-scale pressure gradients and winds [53]. Figure 10 shows 10 extreme indexes, the annual mean and the anomaly of mCEI for 2003. In this year, extreme daytime temperatures (TX90P) have a local hotspot between 45° N and 50° N latitudes (Figure 6). Warm extremes are greater than 20% over Central and Western Europe, and the annual intensity of extreme drought is greater than 50% over the north of Scandinavia and Central Europe. The extreme precipitation rate is, locally, greater than 44% over western Russia and the Mediterranean coasts. Extreme moist conditions are prominent over the southwest of Turkey, Greece, and Bulgaria. All of the extreme indexes are combined, and, consequently, the EURO–MED region averaged mCEI is calculated as 37.32% with a positive anomaly of 2.09%. The anomaly reaches up to 15% over Northern and Central Europe and the Mediterranean coasts.
As a second example, we investigated winter of 2010 anomalous cold conditions over Northern and Western Europe due to the extreme persistence of the negative phase of the North Atlantic Oscillation [54]. Figure 11 shows 10 extreme indexes, the annual mean and the anomaly of mCEI for 2010. The temporal intensity of cold extremes is around 20% in Northern Europe and reaches 24% over Scandinavia in 2010. Additionally, the persistence of an atmospheric blocking resulted in an intense heatwave over Eastern Europe and western Russia, which caused a great number of deaths and extensive wildfires in the summer of 2010 [55,56,57], just after the transition to the La Nina conditions [58]. In this year, warm extremes are intensified up to 22% over Eastern Europe and western Russia. The temporal intensity of extreme drought is greater than 50% over western Russia, Israel, Syria, and the northeast of Africa. The extreme precipitation rate is greater than 44%, the fraction of extremely wet days exceeds 16%, and the intensity of extreme moist conditions is greater than 50% over Central Europe, Italy, the south of Spain, and the north of Morocco. As a result, the intensity of the exposure to the combined extremes (mCEI) is 41.17% with a positive anomaly of 5.95% over the EURO–MED region in 2010. Positive anomalies reach up to 10% over the north of Europe and 15% over western Russia, Central Europe, the Adriatic coasts of the Balkans, Italy, Spain, the north of Morocco, and the Eastern Mediterranean coasts. As the zonal averages, cold extreme indexes (TX10P, TN10P) become the maximum for the whole study period between 55° N and 65° N latitudes, and warm extreme indexes indicate localized extreme conditions around 55° N in 2010 (Figure 6). At the same latitude band, the mCEI anomaly exceeds 10% (Figure 8a). It is clear that mCEI is able to capture anomalous conditions and is a convenient tool to obtain combined spatial and temporal information about different types of extremes.

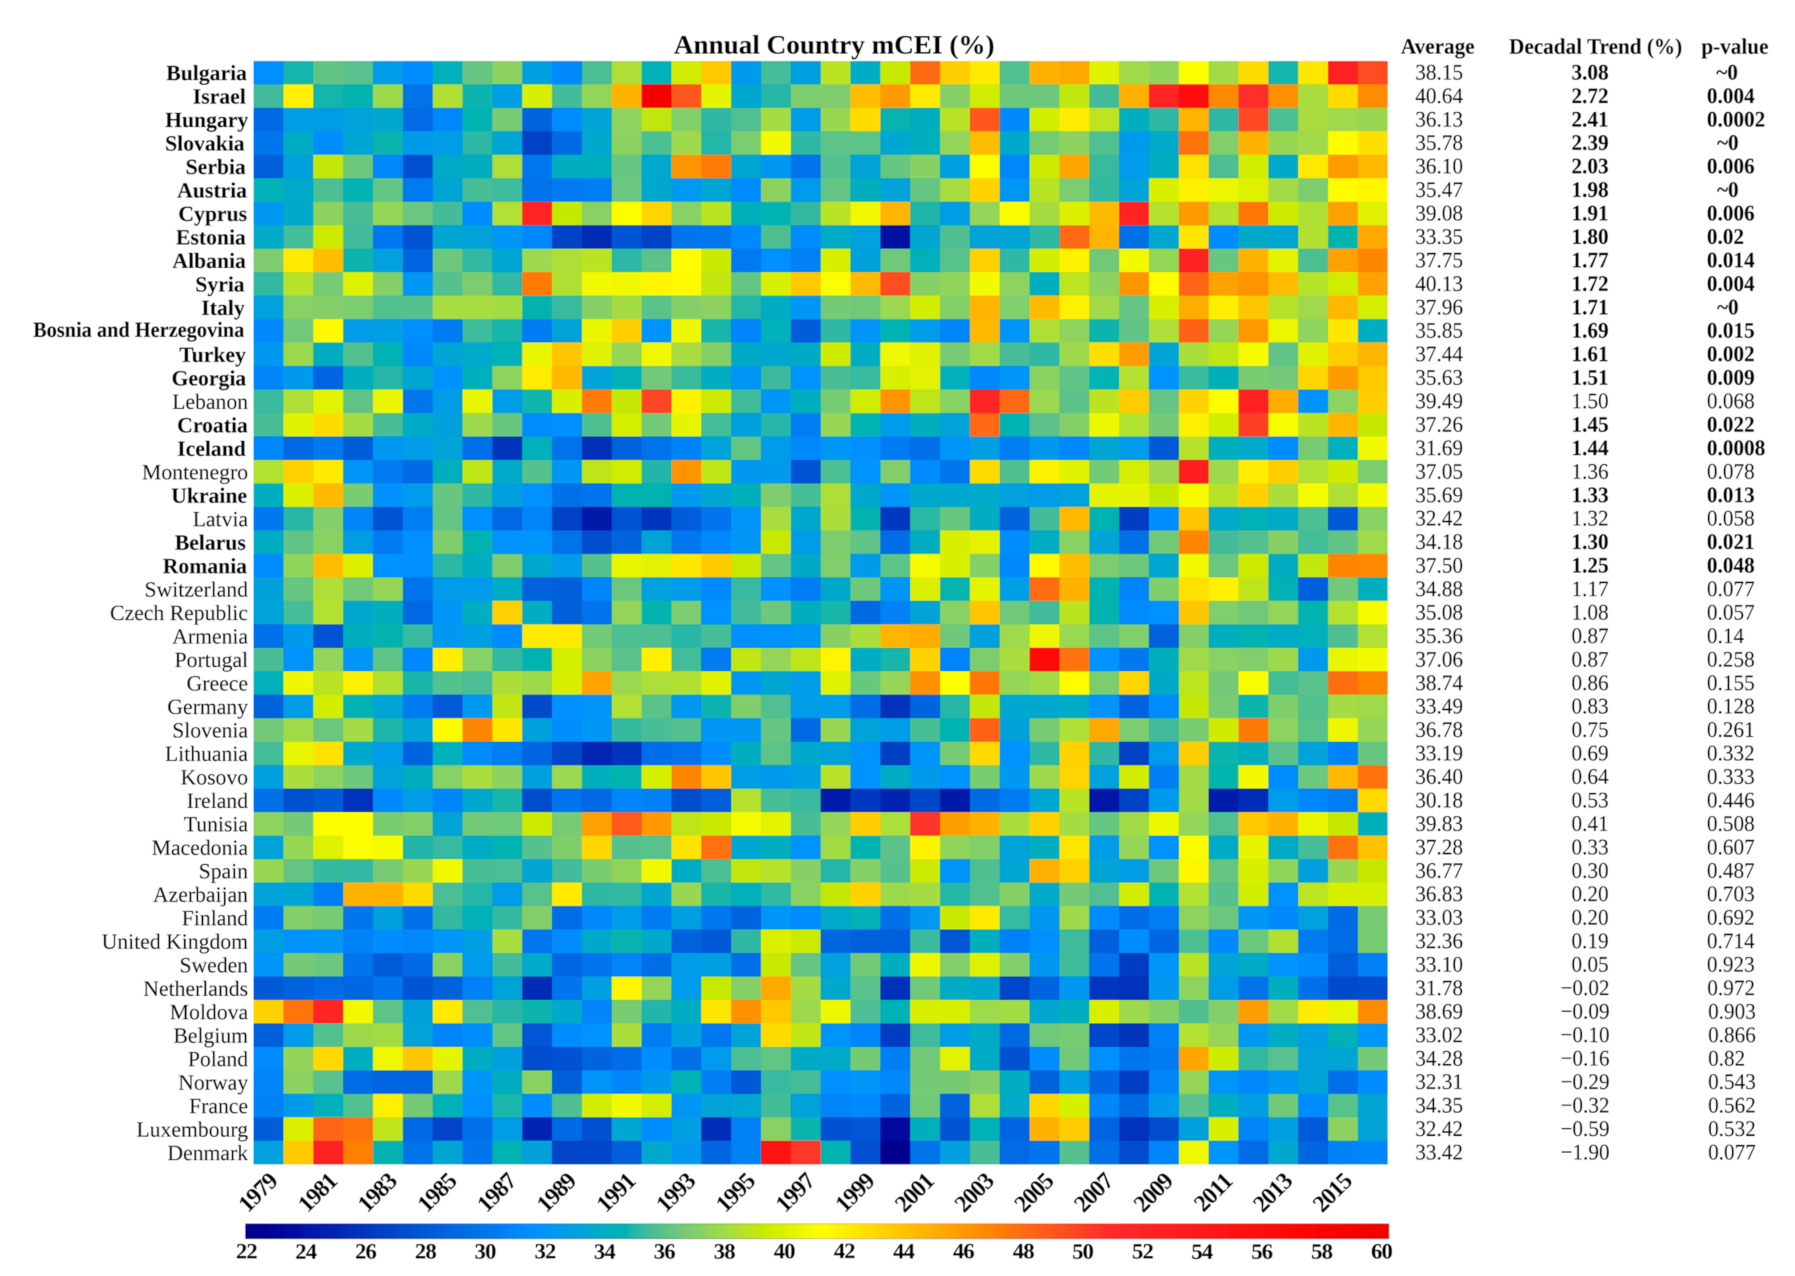
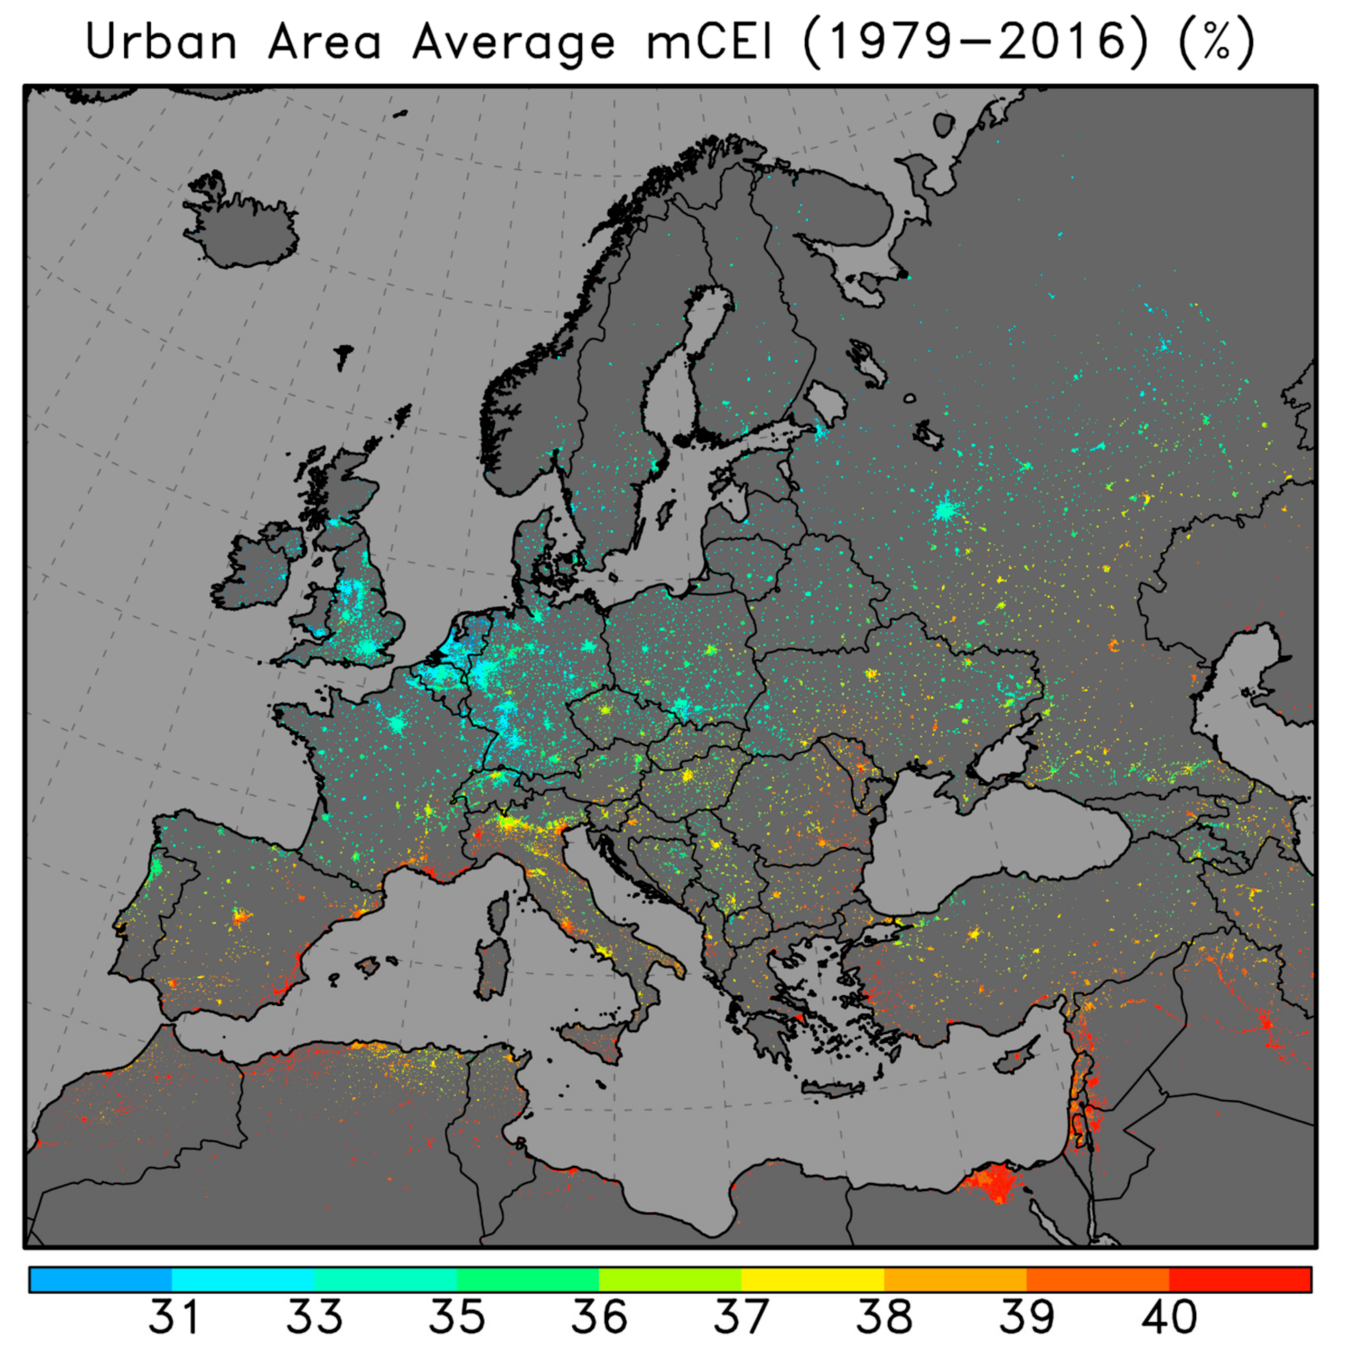
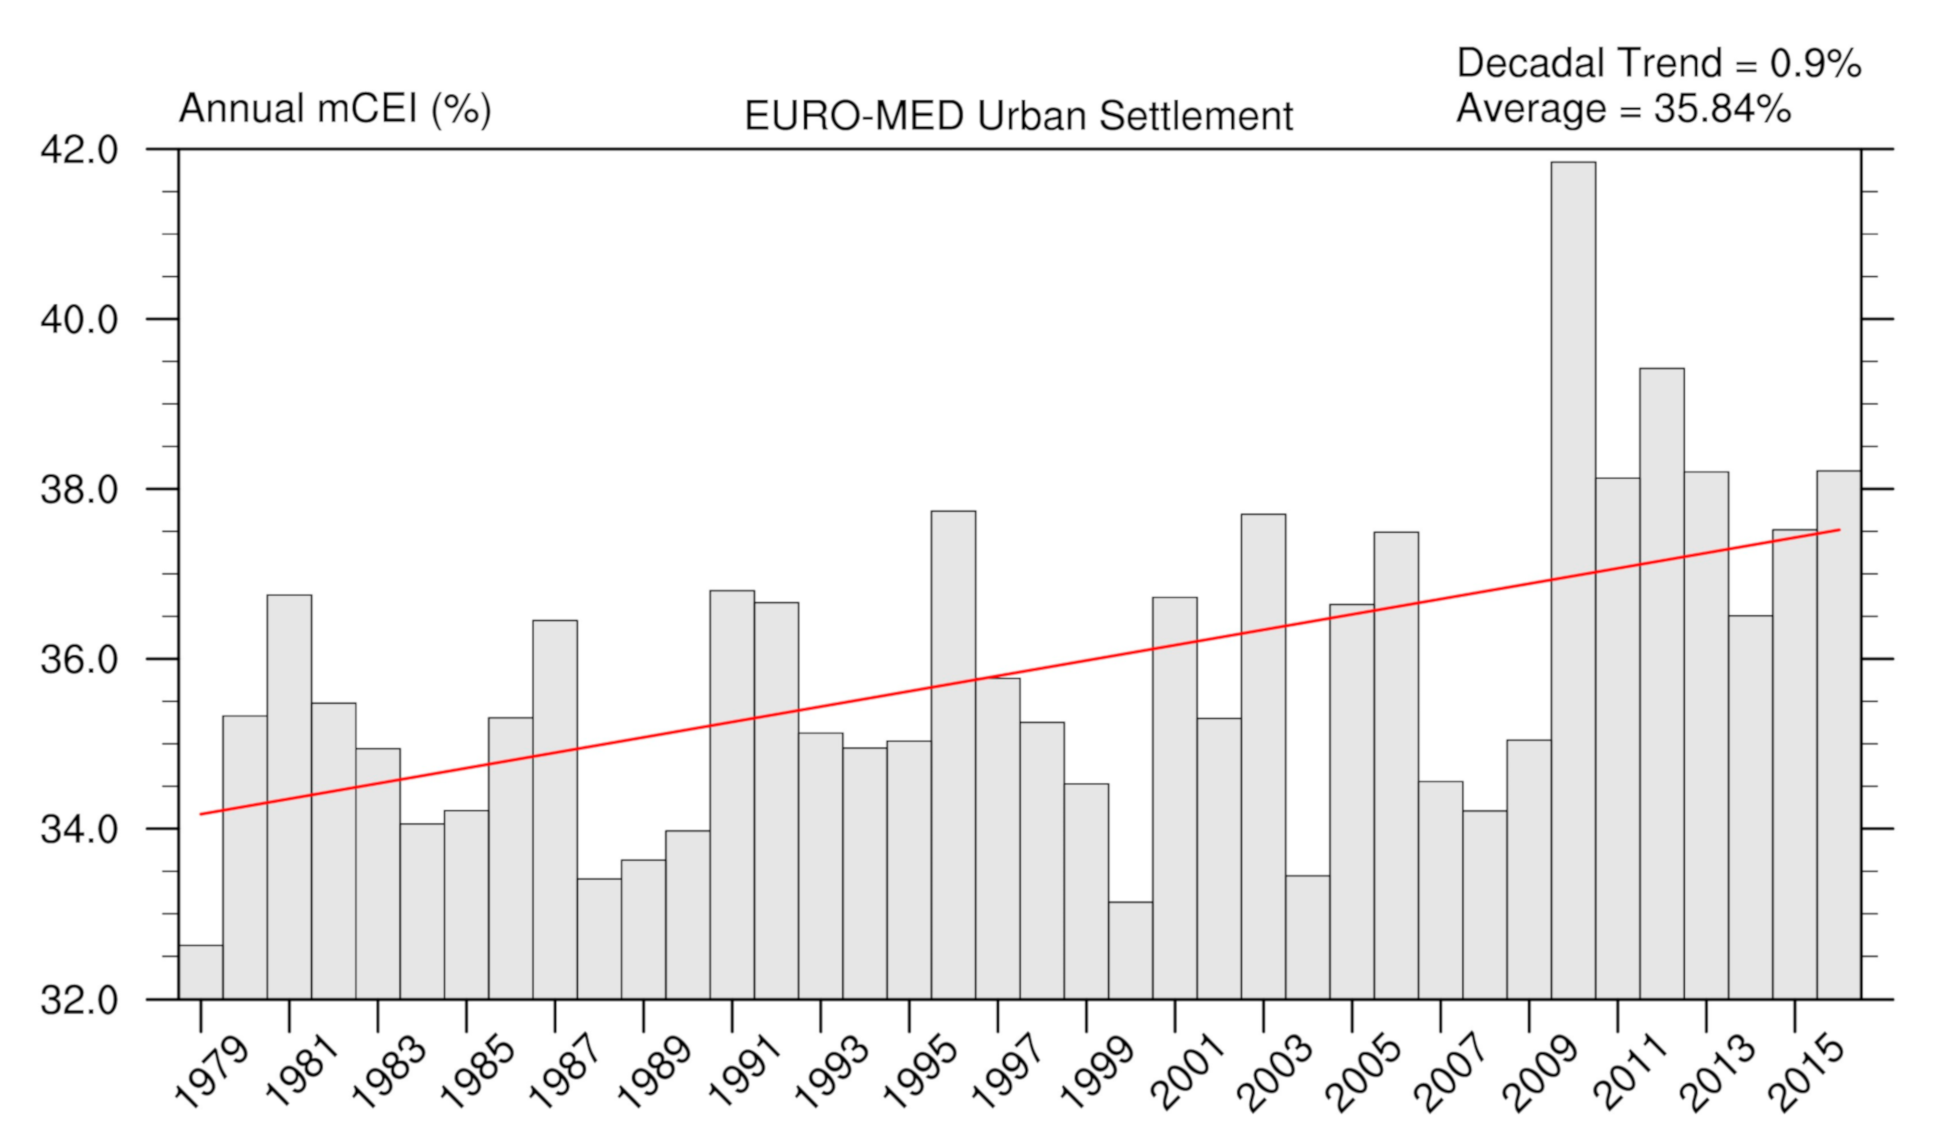
3.4. Countries and Cities Exposed to mCEI

Figure 12 presents the country-based annual mean of mCEI, climatological mean, decadal trend, and p-values for 47 EURO–MED countries as a matrix. The highest climatological means of mCEI, which are greater than the EURO–MED average (35.61%), are observed in Israel, Syria, Tunisia, Lebanon, Cyprus, Greece, Moldova, Bulgaria, Italy, Albania, Romania, Turkey, Macedonia, Croatia, Portugal, Montenegro, and Ukraine. Positive values of the decadal trend are higher than 1.24% decade−1 for Bulgaria, Israel, Hungary, Slovakia, Serbia, Austria, Cyprus, Estonia, Albania, Syria, Italy, Bosnia and Herzegovina, Turkey, Georgia, Croatia, Iceland, Ukraine, Belarus, and Romania. The trend for 12 of these countries is statistically significant at 99% confidence level. These countries are generally located in Eastern Europe, the Balkans, and the Mediterranean coasts and are exposed to an increase in combined extremes as climate hotspot countries (Figure 8). On the other hand, although there is a decreasing trend in eight countries, which are generally over the west and north of the EURO–MED domain, changes are not significant (p-value > 0.05).
For most countries in Europe, economic activities, employment, and wealth are concentrated in the urban areas [59]. The proportion of the people living in the urban areas of Europe was nearly 75% in 2015 [59,60], and this rate is projected to exceed 80% by 2050 [60]. Therefore, mCEI analyses focusing on densely populated urban areas are beneficial for taking action against the possible impacts of climate extremes on the human environment. Thus, we analysed mCEI over the urban settlements of the EURO–MED region in addition to country-based analyses. We calculated decadal trends of mCEI for the EURO–MED region cities with at least one million in population (except for Dnipro, Oslo, Donetsk, Thessaloniki, and Frankfurt). According to the population estimate of the United Nations Population Division for 2015 [61], these cities are classified as major urban agglomerations. Figure 13 presents the climatological mean of mCEI over the EURO–MED urban settlements. It is clearly seen that densely populated capitals and major cities, such as Madrid, Paris, London, Berlin, Milan, Istanbul, and Ankara, are captured by GHS-SMOD. The climatological mean over the major urban areas is 35.84%, and mCEI varies between 32.5% and 41.75% (Figure 14). There is an increasing trend of 0.9% decade−1, which is statistically significant at 99% confidence level.
Figure 15 shows city-based mCEI decadal trends for the major urban agglomerations of the EURO–MED region. Among these cities, Fes, Izmir, Marseille and Aix-en-Provence, Tel Aviv, Tbilisi, Rostov-on-Don, Turin, Haifa, Ankara, Budapest, Kiev, Casablanca, Beirut, Munich, Saint Petersburg, Hamburg, Zurich, Vienna, Bucharest, Alexandria, Gaziantep, Rome, Athens, Konya, Sofia, Antalya, Moscow, and Minsk are subject to increased combined extremes significantly at a 95% level of confidence. The decadal trend of these cities ranges from 1.64% to 5%. The only significant decreasing signal is for Frankfurt at the rate of −1.61% decade−1. These cities are generally in different geographical and climatic zones over the EURO–MED region. Even if they are in the same country, they can exhibit different tendencies, such as Hamburg and Frankfurt. Thus, mCEI analyses have a crucial role in revealing the combined effects of climate extremes, even in the regions with diverse climatic contrasts.

4. Conclusions

Combining different types of indexes in a single index provides holistic information. In this study, we developed mCEI, which is a convenient tool to obtain spatiotemporal information with a compact set of multivariate climate change indexes, and investigated spatial and temporal changes in extreme climatic conditions over the EURO–MED region with 10 climate change indexes. These extreme indexes were calculated using high-resolution gridded temperature, precipitation, and drought datasets for the 1979–2016 period. For the temperature extremes, there is a significant increasing trend in the warm extremes across the EURO–MED region. Additionally, the magnitude of change in the daytime extremes is higher compared to the night-time extremes. In terms of moisture surplus, there are regional contrasts in the tendencies. On the other hand, arid conditions are significantly on the rise over most of the study area, and there are regional increasing signals for the dry days. The decrease in the R10P index indicates that the ratio of precipitation amounts during dry days to the total precipitation has increased. In terms of extreme precipitation, the increasing trend is significant, albeit low.
The analyses of mCEI indicate that the combined intensity of the extremes increases significantly over the EURO–MED region at a rate of 0.98% decade−1. The major hotspots are the Mediterranean coasts, the Balkan countries, Eastern Europe, Iceland, western Russia, western Turkey, and western Iraq. The increasing trend in mCEI is significant in 19 countries. In addition, mCEI increases over the urban extent of the EURO–MED region at a rate of 0.9% decade−1. Among the major urban agglomerations, 28 cities exhibit a significant increasing trend greater than 1.5% decade−1. In particular, some of the Mediterranean cities become prominent based on the intensification of climate extremes, and the highest trends of mCEI (>3.5% decade−1) have been calculated for Fes (Morocco), Izmir (Turkey), Marseille and Aix-en-Provence (France), and Tel Aviv (Israel).
The results of this study support the previous findings on the recent shifts of extreme climatic conditions over the Europe–Mediterranean major climate hotspot regions. The Arctic sea ice extent has been decreasing since 1979 due to the warming in the Arctic circle. The positive anomalies of mCEI captured the recent impact of the Arctic amplification on the extremes at higher latitudes. In addition, snapshot analyses of 2003 and 2010 brought out the performance of mCEI in capturing the multiple anomalous conditions that are associated with different types of extremes and atmospheric conditions. mCEI provides valuable information regarding the multivariate extremes, but it has several drawbacks. The current indexes in mCEI may create a bias toward low or high values due to latitudinal effects. Indexes also differ in magnitude among themselves due to their different characteristics and may affect the final value of mCEI. However, the zonally averaged analysis applied in this study indicates that latitudinal divergence does not limit the mCEI results specifically for the trend analysis. In addition, the indexes composing mCEI should also be analysed individually to understand the drivers of the final mCEI. To overcome these problems, standardization or a weighing approach would be beneficial.
This study provides an overview of extreme climatic events and forms a base for assessing risk and take measures. The formulation of mCEI can be improved by implementing all the extremes that can pose a threat under climate change, such as wildfires and tornadoes. The use of high-resolution data makes mCEI a convenient tool for city-based analyses. The population living in the urban extent of Europe is projected to exceed 80% by the half of the 21st century. Utilizing mCEI with the IPCC-based future climate simulations would also be beneficial to develop risk assessment strategies considering the exposure, adaptation capacity, and sensitivity of the societies.

Author Contributions

Conceptualization, B.Ö.; methodology, B.Ö.; data curation, M.B.K.; writing—original draft preparation, M.B.K. and F.B.; writing—review and editing, B.Ö.; visualization, M.B.K.; supervision, B.Ö. All authors have read and agreed to the published version of the manuscript.

Funding

This study is partially funded by the Scientific Research Projects of Istanbul Technical University, Research Grant ID MGA-2018-41536.

Institutional Review Board Statement

Not applicable.

Informed Consent Statement

Not applicable.

Data Availability Statement

Not applicable.

Conflicts of Interest

The authors declare no conflict of interest.

References

  1. Pachauri, R.K.; Mayer, L. (Eds.) Climate Change 2014: Synthesis Report; Intergovernmental Panel on Climate Change: Geneva, Switzerland, 2014; ISBN 978-92-9169-143-2. [Google Scholar]
  2. Seneviratne, S.I.; Nicholls, N.; Easterling, D.; Goodess, C.M.; Kanae, S.; Kossin, J.; Luo, Y.; Marengo, J.; McInnes, K.; Rahimi, M.; et al. Changes in Climate Extremes and their Impacts on the Natural Physical Environment. In Managing the Risks of Extreme Events and Disasters to Advance Climate Change Adaptation; Field, C.B., Barros, V., Stocker, T.F., Dahe, Q., Eds.; Cambridge University Press: Cambridge, UK, 2012; pp. 109–230. ISBN 978-1-139-17724-5. [Google Scholar]
  3. Alexander, L.V.; Zhang, X.; Peterson, T.C.; Caesar, J.; Gleason, B.; Klein Tank, A.M.G.; Haylock, M.; Collins, D.; Trewin, B.; Rahimzadeh, F.; et al. Global observed changes in daily climate extremes of temperature and precipitation. J. Geophys. Res. 2006, 111, D05109. [Google Scholar] [CrossRef] [Green Version]
  4. Donat, M.G.; Alexander, L.V.; Yang, H.; Durre, I.; Vose, R.; Dunn, R.J.H.; Willett, K.M.; Aguilar, E.; Brunet, M.; Caesar, J.; et al. Updated analyses of temperature and precipitation extreme indices since the beginning of the twentieth century: The HadEX2 dataset. J. Geophys. Res. Atmos. 2013, 118, 2098–2118. [Google Scholar] [CrossRef]
  5. Frich, P.; Alexander, L.V.; Gleason, B.; Haylock, M.; Tank, A.M.G.K.; Peterson, T. Observed coherent changes in climatic extremes during the second half of the twentieth century. Clim. Res. 2002, 19, 193–212. [Google Scholar] [CrossRef] [Green Version]
  6. Klein Tank, A.M.G.; Können, G.P. Trends in Indices of Daily Temperature and Precipitation Extremes in Europe, 1946–99. J. Clim. 2003, 16, 3665–3680. [Google Scholar] [CrossRef]
  7. Moberg, A.; Jones, P.D.; Lister, D.; Walther, A.; Brunet, M.; Jacobeit, J.; Alexander, L.V.; Della-Marta, P.M.; Luterbacher, J.; Yiou, P.; et al. Indices for daily temperature and precipitation extremes in Europe analyzed for the period 1901–2000. J. Geophys. Res. 2006, 111, D22106. [Google Scholar] [CrossRef] [Green Version]
  8. Klein Tank, A.M.G.; Peterson, T.C.; Quadir, D.A.; Dorji, S.; Zou, X.; Tang, H.; Santhosh, K.; Joshi, U.R.; Jaswal, A.K.; Kolli, R.K.; et al. Changes in daily temperature and precipitation extremes in central and south Asia. J. Geophys. Res. 2006, 111, D16105. [Google Scholar] [CrossRef]
  9. You, Q.; Kang, S.; Aguilar, E.; Yan, Y. Changes in daily climate extremes in the eastern and central Tibetan Plateau during 1961–2005. J. Geophys. Res. 2008, 113, D07101. [Google Scholar] [CrossRef] [Green Version]
  10. Peterson, T.C.; Zhang, X.; Brunet-India, M.; Vázquez-Aguirre, J.L. Changes in North American extremes derived from daily weather data. J. Geophys. Res. 2008, 113, D07113. [Google Scholar] [CrossRef] [Green Version]
  11. Alexander, L.V.; Hope, P.; Collins, D.; Trewin, B.; Lynch, A.; Nicholls, N. Trends in Australia’s climate means and extremes: A global context. Aust. Meteorol. Mag. 2007, 56, 1–18. [Google Scholar]
  12. Aguilar, E.; Peterson, T.C.; Obando, P.R.; Frutos, R.; Retana, J.A.; Solera, M.; Soley, J.; García, I.G.; Araujo, R.M.; Santos, A.R.; et al. Changes in precipitation and temperature extremes in Central America and northern South America, 1961–2003. J. Geophys. Res. 2005, 110, D23107. [Google Scholar] [CrossRef]
  13. Vincent, L.A.; Peterson, T.C.; Barros, V.R.; Marino, M.B.; Rusticucci, M.; Carrasco, G.; Ramirez, E.; Alves, L.M.; Ambrizzi, T.; Berlato, M.A.; et al. Observed Trends in Indices of Daily Temperature Extremes in South America 1960–2000. J. Clim. 2005, 18, 5011–5023. [Google Scholar] [CrossRef]
  14. Zhang, X.; Aguilar, E.; Sensoy, S.; Melkonyan, H.; Tagiyeva, U.; Ahmed, N.; Kutaladze, N.; Rahimzadeh, F.; Taghipour, A.; Hantosh, T.H.; et al. Trends in Middle East climate extreme indices from 1950 to 2003. J. Geophys. Res. 2005, 110, D22104. [Google Scholar] [CrossRef]
  15. Kostopoulou, E.; Jones, P.D. Assessment of climate extremes in the Eastern Mediterranean. Meteorol. Atmospheric Phys. 2005, 89, 69–85. [Google Scholar] [CrossRef]
  16. Dai, A. Drought under global warming: A review. Wiley Interdiscip. Rev. Clim. Chang. 2011, 2, 45–65. [Google Scholar] [CrossRef] [Green Version]
  17. Zhang, X.; Alexander, L.; Hegerl, G.C.; Jones, P.; Tank, A.K.; Peterson, T.C.; Trewin, B.; Zwiers, F.W. Indices for monitoring changes in extremes based on daily temperature and precipitation data. Wiley Interdiscip. Rev. Clim. Chang. 2011, 2, 851–870. [Google Scholar] [CrossRef]
  18. Karl, T.R.; Knight, R.W.; Easterling, D.R.; Quayle, R.G. Indices of Climate Change for the United States. Bull. Am. Meteorol. Soc. 1996, 77, 279–292. [Google Scholar] [CrossRef] [Green Version]
  19. Palmer, W.C. Meteorological Drought; Research Paper No. 45; U.S. Department of Commerce: Washington, DC, USA, 1965.
  20. Gleason, K.L.; Lawrimore, J.H.; Levinson, D.H.; Karl, T.R.; Karoly, D.J. A Revised U.S. Climate Extremes Index. J. Clim. 2008, 21, 2124–2137. [Google Scholar] [CrossRef] [Green Version]
  21. Gallant, A.J.E.; Karoly, D.J.; Gleason, K.L. Consistent Trends in a Modified Climate Extremes Index in the United States, Europe, and Australia. J. Clim. 2014, 27, 1379–1394. [Google Scholar] [CrossRef]
  22. Dittus, A.J.; Karoly, D.J.; Lewis, S.C.; Alexander, L.V. A Multiregion Assessment of Observed Changes in the Areal Extent of Temperature and Precipitation Extremes. J. Clim. 2015, 28, 9206–9220. [Google Scholar] [CrossRef]
  23. Dittus, A.J.; Karoly, D.J.; Lewis, S.C.; Alexander, L.V.; Donat, M.G. A Multiregion Model Evaluation and Attribution Study of Historical Changes in the Area Affected by Temperature and Precipitation Extremes. J. Clim. 2016, 29, 8285–8299. [Google Scholar] [CrossRef]
  24. Batibeniz, F.; Ashfaq, M.; Diffenbaugh, N.S.; Key, K.; Evans, K.J.; Turuncoglu, U.U.; Önol, B. Doubling of U.S. Population Exposure to Climate Extremes by 2050. Earths Future 2020, 8. [Google Scholar] [CrossRef] [Green Version]
  25. Gallant, A.J.E.; Karoly, D.J. A Combined Climate Extremes Index for the Australian Region. J. Clim. 2010, 23, 6153–6165. [Google Scholar] [CrossRef]
  26. Lange, S.; Volkholz, J.; Geiger, T.; Zhao, F.; Vega, I.; Veldkamp, T.; Reyer, C.P.O.; Warszawski, L.; Huber, V.; Jägermeyr, J.; et al. Projecting Exposure to Extreme Climate Impact Events Across Six Event Categories and Three Spatial Scales. Earths Future 2020, 8. [Google Scholar] [CrossRef]
  27. Mora, C.; Spirandelli, D.; Franklin, E.C.; Lynham, J.; Kantar, M.B.; Miles, W.; Smith, C.Z.; Freel, K.; Moy, J.; Louis, L.V.; et al. Broad threat to humanity from cumulative climate hazards intensified by greenhouse gas emissions. Nat. Clim. Chang. 2018, 8, 1062–1071. [Google Scholar] [CrossRef]
  28. Ridder, N.N.; Pitman, A.J.; Ukkola, A.M. Do CMIP6 Climate Models Simulate Global or Regional Compound Events Skillfully? Geophys. Res. Lett. 2021, 48. [Google Scholar] [CrossRef]
  29. Forzieri, G.; Feyen, L.; Russo, S.; Vousdoukas, M.; Alfieri, L.; Outten, S.; Migliavacca, M.; Bianchi, A.; Rojas, R.; Cid, A. Multi-hazard assessment in Europe under climate change. Clim. Chang. 2016, 137, 105–119. [Google Scholar] [CrossRef] [Green Version]
  30. Lung, T.; Lavalle, C.; Hiederer, R.; Dosio, A.; Bouwer, L.M. A multi-hazard regional level impact assessment for Europe combining indicators of climatic and non-climatic change. Glob. Environ. Chang. 2013, 23, 522–536. [Google Scholar] [CrossRef]
  31. Vitolo, C.; Di Napoli, C.; Di Giuseppe, F.; Cloke, H.L.; Pappenberger, F. Mapping combined wildfire and heat stress hazards to improve evidence-based decision making. Environ. Int. 2019, 127, 21–34. [Google Scholar] [CrossRef]
  32. Kumar, N.; Kumar Goyal, M.; Kumar Gupta, A.; Jha, S.; Das, J.; Madramootoo, C.A. Joint behaviour of climate extremes across India: Past and future. J. Hydrol. 2021, 597, 126185. [Google Scholar] [CrossRef]
  33. Das, S.; Ghosh, A.; Hazra, S.; Ghosh, T.; Safra de Campos, R.; Samanta, S. Linking IPCC AR4 & AR5 frameworks for assessing vulnerability and risk to climate change in the Indian Bengal Delta. Prog. Disaster Sci. 2020, 7, 100110. [Google Scholar] [CrossRef]
  34. ERA5: Fifth Generation of ECMWF Atmospheric Reanalyses of the Global Climate. Available online: https://cds.climate.copernicus.eu/cdsapp#!/home (accessed on 22 January 2019).
  35. Beck, H.E.; Wood, E.F.; Pan, M.; Fisher, C.K.; Miralles, D.G.; van Dijk, A.I.J.M.; McVicar, T.R.; Adler, R.F. MSWEP V2 Global 3-Hourly 0.1° Precipitation: Methodology and Quantitative Assessment. Bull. Am. Meteorol. Soc. 2019, 100, 473–500. [Google Scholar] [CrossRef] [Green Version]
  36. Wells, N.; Goddard, S.; Hayes, M.J. A Self-Calibrating Palmer Drought Severity Index. J. Clim. 2004, 17, 17. [Google Scholar] [CrossRef]
  37. Webb, R.S.; Rosenzweig, C.E.; Levine, E.R. Specifying land surface characteristics in general circulation models: Soil profile data set and derived water-holding capacities. Glob. Biogeochem. Cycles 1993, 7, 97–108. [Google Scholar] [CrossRef]
  38. Thornthwaite, C.W. An Approach toward a Rational Classification of Climate. Geogr. Rev. 1948, 38, 55. [Google Scholar] [CrossRef]
  39. Pesaresi, M.; Florczyk, A.; Schiavina, M.; Melchiorri, M.; Maffenini, L. GHS settlement grid, updated and refined REGIO model 2014 in application to GHS-BUILT R2018A and GHS-POP R2019A, multitemporal (1975–1990–2000–2015), R2019A. Jt. Res. Cent. Data Cat. 2019. [Google Scholar] [CrossRef]
  40. Florczyk, A.J.; Corbane, C.; Ehrlich, D.; Freire, S.; Kemper, T.; Maffenini, L.; Melchiorri, L.; Pesaresi, L.; Politis, P.; Schiavina, M.; et al. GHSL Data Package 2019; Publications Office of the European Union: Luxembourg, 2019; ISBN 978-92-76-13186-1. [Google Scholar]
  41. U.S. Climate Extremes Index (CEI). Available online: https://www.ncdc.noaa.gov/extremes/cei (accessed on 18 November 2019).
  42. Bador, M.; Alexander, L.V.; Contractor, S.; Roca, R. Diverse estimates of annual maxima daily precipitation in 22 state-of-the-art quasi-global land observation datasets. Environ. Res. Lett. 2020, 15, 035005. [Google Scholar] [CrossRef]
  43. Fleig, A.K.; Tallaksen, L.M.; Hisdal, H.; Hannah, D.M. Regional hydrological drought in north-western Europe: Linking a new Regional Drought Area Index with weather types. Hydrol. Process. 2011, 25, 1163–1179. [Google Scholar] [CrossRef]
  44. Spinoni, J.; Naumann, G.; Vogt, J.V.; Barbosa, P. The biggest drought events in Europe from 1950 to 2012. J. Hydrol. Reg. Stud. 2015, 3, 509–524. [Google Scholar] [CrossRef]
  45. Serreze, M.C.; Stroeve, J. Arctic sea ice trends, variability and implications for seasonal ice forecasting. Philos. Trans. R. Soc. Math. Phys. Eng. Sci. 2015, 373, 20140159. [Google Scholar] [CrossRef] [Green Version]
  46. Cohen, J.; Screen, J.A.; Furtado, J.C.; Barlow, M.; Whittleston, D.; Coumou, D.; Francis, J.; Dethloff, K.; Entekhabi, D.; Overland, J.; et al. Recent Arctic amplification and extreme mid-latitude weather. Nat. Geosci. 2014, 7, 627–637. [Google Scholar] [CrossRef] [Green Version]
  47. Overland, J.E.; Wang, M. Recent Extreme Arctic Temperatures are due to a Split Polar Vortex. J. Clim. 2016, 29, 5609–5616. [Google Scholar] [CrossRef]
  48. Donat, M.G.; Alexander, L.V.; Herold, N.; Dittus, A.J. Temperature and precipitation extremes in century-long gridded observations, reanalyses, and atmospheric model simulations. J. Geophys. Res. Atmos. 2016, 121, 11174–11189. [Google Scholar] [CrossRef] [Green Version]
  49. Dittus, A.J.; Karoly, D.J.; Donat, M.G.; Lewis, S.C.; Alexander, L.V. Understanding the role of sea surface temperature-forcing for variability in global temperature and precipitation extremes. Weather Clim. Extrem. 2018, 21, 1–9. [Google Scholar] [CrossRef]
  50. Suursaar, Ü. Combined impact of summer heat waves and coastal upwelling in the Baltic Sea. Oceanologia 2020, 62, 511–524. [Google Scholar] [CrossRef]
  51. Fennessy, M.J.; Kinter, J.L. Climatic Feedbacks during the 2003 European Heat Wave. J. Clim. 2011, 24, 5953–5967. [Google Scholar] [CrossRef]
  52. Schär, C.; Vidale, P.L.; Lüthi, D.; Frei, C.; Häberli, C.; Liniger, M.A.; Appenzeller, C. The role of increasing temperature variability in European summer heatwaves. Nature 2004, 427, 332–336. [Google Scholar] [CrossRef]
  53. Spensberger, C.; Madonna, E.; Boettcher, M.; Grams, C.M.; Papritz, L.; Quinting, J.F.; Röthlisberger, M.; Sprenger, M.; Zschenderlein, P. Dynamics of concurrent and sequential Central European and Scandinavian heatwaves. Q. J. R. Meteorol. Soc. 2020, 146, 2998–3013. [Google Scholar] [CrossRef]
  54. Cattiaux, J.; Vautard, R.; Cassou, C.; Yiou, P.; Masson-Delmotte, V.; Codron, F. Winter 2010 in Europe: A cold extreme in a warming climate. Geophys. Res. Lett. 2010, 37. [Google Scholar] [CrossRef] [Green Version]
  55. Dole, R.; Hoerling, M.; Perlwitz, J.; Eischeid, J.; Pegion, P.; Zhang, T.; Quan, X.-W.; Xu, T.; Murray, D. Was there a basis for anticipating the 2010 Russian heat wave? Geophys. Res. Lett. 2011, 38. [Google Scholar] [CrossRef] [Green Version]
  56. Lau, W.K.M.; Kim, K.-M. The 2010 Pakistan Flood and Russian Heat Wave: Teleconnection of Hydrometeorological Extremes. J. Hydrometeorol. 2012, 13, 392–403. [Google Scholar] [CrossRef] [Green Version]
  57. Matsueda, M. Predictability of Euro-Russian blocking in summer of 2010. Geophys. Res. Lett. 2011, 38. [Google Scholar] [CrossRef]
  58. Trenberth, K.E.; Fasullo, J.T. Climate extremes and climate change: The Russian heat wave and other climate extremes of 2010. J. Geophys. Res. Atmos. 2012, 117. [Google Scholar] [CrossRef]
  59. Kotzeva, M.M.; Brandmüller, T.; Lupu, I.; Önnerfors, Å.; Corselli-Nordblad, L.; Coyette, C.; Johansson, A.; Strandell, H.; Wolff, P.; Europäische, K. (Eds.) Urban Europe: Statistics on Cities, Towns and Suburbs, 2016 ed.; Statistical Books/Eurostat; Publications Office of the European Union: Luxembourg, 2016; ISBN 978-92-79-60139-2. [Google Scholar]
  60. United Nations, Department of Economic and Social Affairs, Population Division. World Urbanization Prospects: The 2018 Revision (ST/ESA/SER.A/420); United Nations: New York, NY, USA, 2019; ISBN 978-92-1-004314-4. [Google Scholar]
  61. United Nations, Department of Economic and Social Affairs, Population Division. World Urbanization Prospects: The 2018 Revision, Online Edition. Available online: https://population.un.org/wup/Download/Files/WUP2018-F22-Cities_Over_300K_Annual.xls (accessed on 4 October 2019).
Figure 1. mCEI is the arithmetic average of five indicators that measure the annual temporal intensities of extreme climatic conditions.
Atmosphere 12 00633 g001
Figure 2. Spatial distribution of the thresholds for the extreme indexes.
Atmosphere 12 00633 g002
Figure 3. The climatological means (1979–2016) of the extreme indexes.
Atmosphere 12 00633 g003
Figure 4. Spatial distribution of the trends in the extreme indexes.
Atmosphere 12 00633 g004
Figure 5. Spatial averages of the extreme indexes over the EURO–MED region.
Atmosphere 12 00633 g005
Figure 6. Zonal average of the extreme indexes over the EURO–MED region.
Atmosphere 12 00633 g006
Figure 7. (a) Reference period (1981–2010) climatology, and (b) decadal anomalies of mCEI.
Atmosphere 12 00633 g007
Figure 8. (a) Zonally averaged mCEI anomaly, (b) decadal trend map of mCEI (% decade−1), and (c) confidence level of the trend.
Atmosphere 12 00633 g008
Figure 9. Spatially-average of mCEI (upper) and annual anomalies (bottom) over the EURO–MED region.
Atmosphere 12 00633 g009
Figure 10. Extreme indexes, mCEI, and mCEI anomaly for 2003.
Atmosphere 12 00633 g010
Figure 11. Extreme indexes, mCEI, and mCEI anomaly for 2010.
Atmosphere 12 00633 g011
Figure 12. Country-based annual and climatological means, and decadal trends of mCEI. Boldface country name indicates a statistically significant trend at 95% confidence level.
Atmosphere 12 00633 g012
Figure 13. mCEI climatology over the urban settlements of the EURO–MED region.
Atmosphere 12 00633 g013
Figure 14. Spatial averages of mCEI over the urban settlements of the EURO–MED region.
Atmosphere 12 00633 g014
Figure 15. City-based decadal trends and climatological means of mCEI over the major urban settlements of the EURO–MED region. Boldface city name indicates a statistically significant trend at 95% confidence level.
Atmosphere 12 00633 g015
Table 1. Comparison of the indicators of CEI [18] and mCEI.
Extreme Indicators of the Original CEIExtreme Indicators of mCEI
i.The sum of the fraction of area with maximum temperatures much below normal and the fraction of area with maximum temperatures much above normal.The sum of the percentage of daily maximum temperatures above the 90th percentile and percentage of daily maximum temperatures below the 10th percentile.
ii.The sum of the fraction of area with minimum temperatures much below normal and the fraction of area with minimum temperatures much above normal.The sum of the percentage of daily minimum temperatures above the 90th percentile and percentage of daily minimum temperatures below the 10th percentile.
iii.The sum of the fraction of area in severe drought and the fraction of area with severe moisture surplus based on the PDSI.The sum of the percentage of monthly scPDSI above the 90th percentile and percentage of monthly scPDSI below the 10th percentile.
iv.Twice the value of the fraction of area with a much greater than normal proportion of precipitation derived from extreme (more than 50.8 mm) 1-day precipitation events.The sum of the percentage of daily precipitation amount above the 90th percentile and percentage of daily precipitation amount below the 10th percentile.
v.The sum of the fraction of area with a much greater than normal number of days with precipitation and the fraction of area with a much greater than normal number of days without precipitation.The sum of the percentage of days with precipitation above the 90th percentile and percentage of days with precipitation below the 10th percentile (percentage of dry days).
Table 2. The significance of the trends in the extreme indexes is tested by using the Student’s t-test, and the p-value of the trend is given after the regression equation. Boldface index name indicates a statistically significant trend at 95% confidence level.
Extreme IndicatorRegression Equationp-Value of the Trend
TX90PY = −375.3237 + 0.1931X~0
TX10PY = 166.2249 − 0.1284X0.0004
TN90PY = −324.4909 + 0.1675X~0
TN10PY = 230.1151 − 0.1102X0.002
scPDSI_90PY = 146.045 − 0.068X0.256
scPDSI_10PY = −762.6373 + 0.3863X~0
R90PY = −29.6738 + 0.031X0.034
R10PY = 33.8355 − 0.011X0.002
R90P_DaysY = −25.3215 + 0.017X0.001
R10P_DaysY = 61.5985 + 0.0007X0.963
Publisher’s Note: MDPI stays neutral with regard to jurisdictional claims in published maps and institutional affiliations.

