
Mass Concentration, Chemical Composition, and Source Characteristics of PM2.5 in a Plateau Slope City in Southwest China

Abstract
1. Introduction
2. Methods
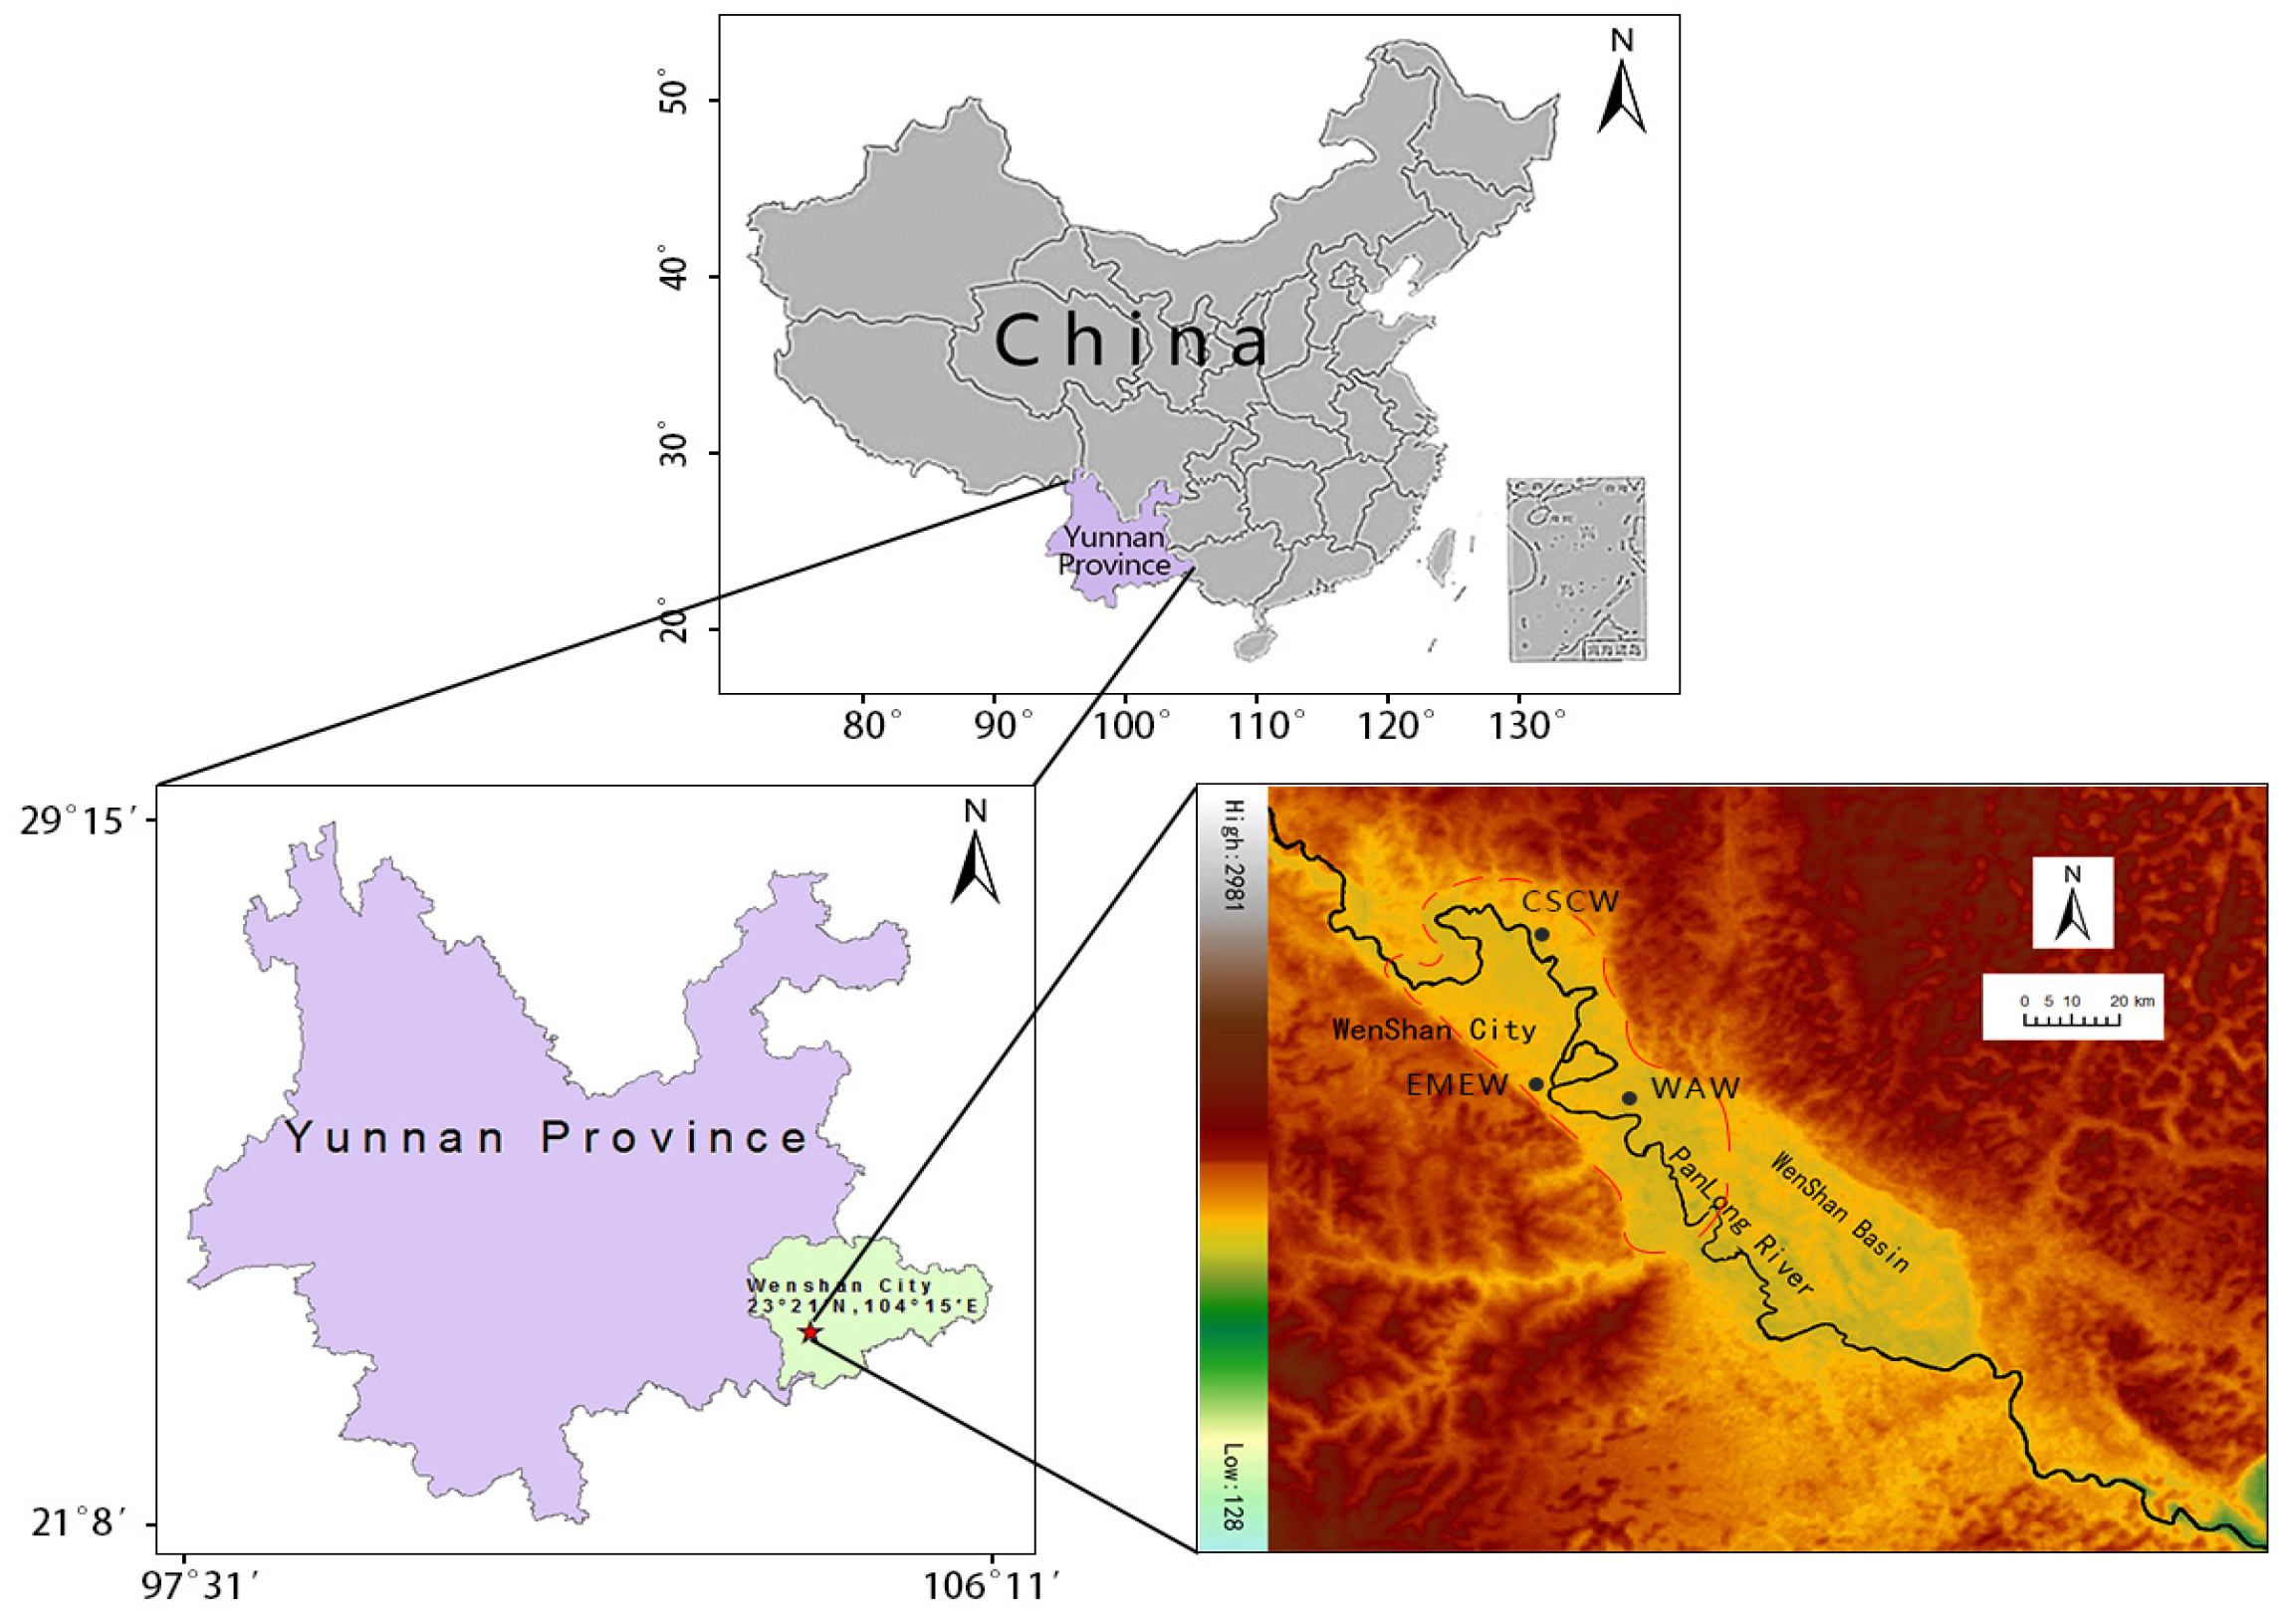
2.1. Sampling Site and Sample Collection
2.2. Chemical Analysis and Quality Control
2.2.1. WSII Analysis
2.2.2. Elements Analysis
2.2.3. OC and EC Analysis
2.2.4. Principal Component Analysis (PCA) Modeling
2.2.5. HYSPLIT4 Model
2.2.6. Quality Control
3. Results and Analyses
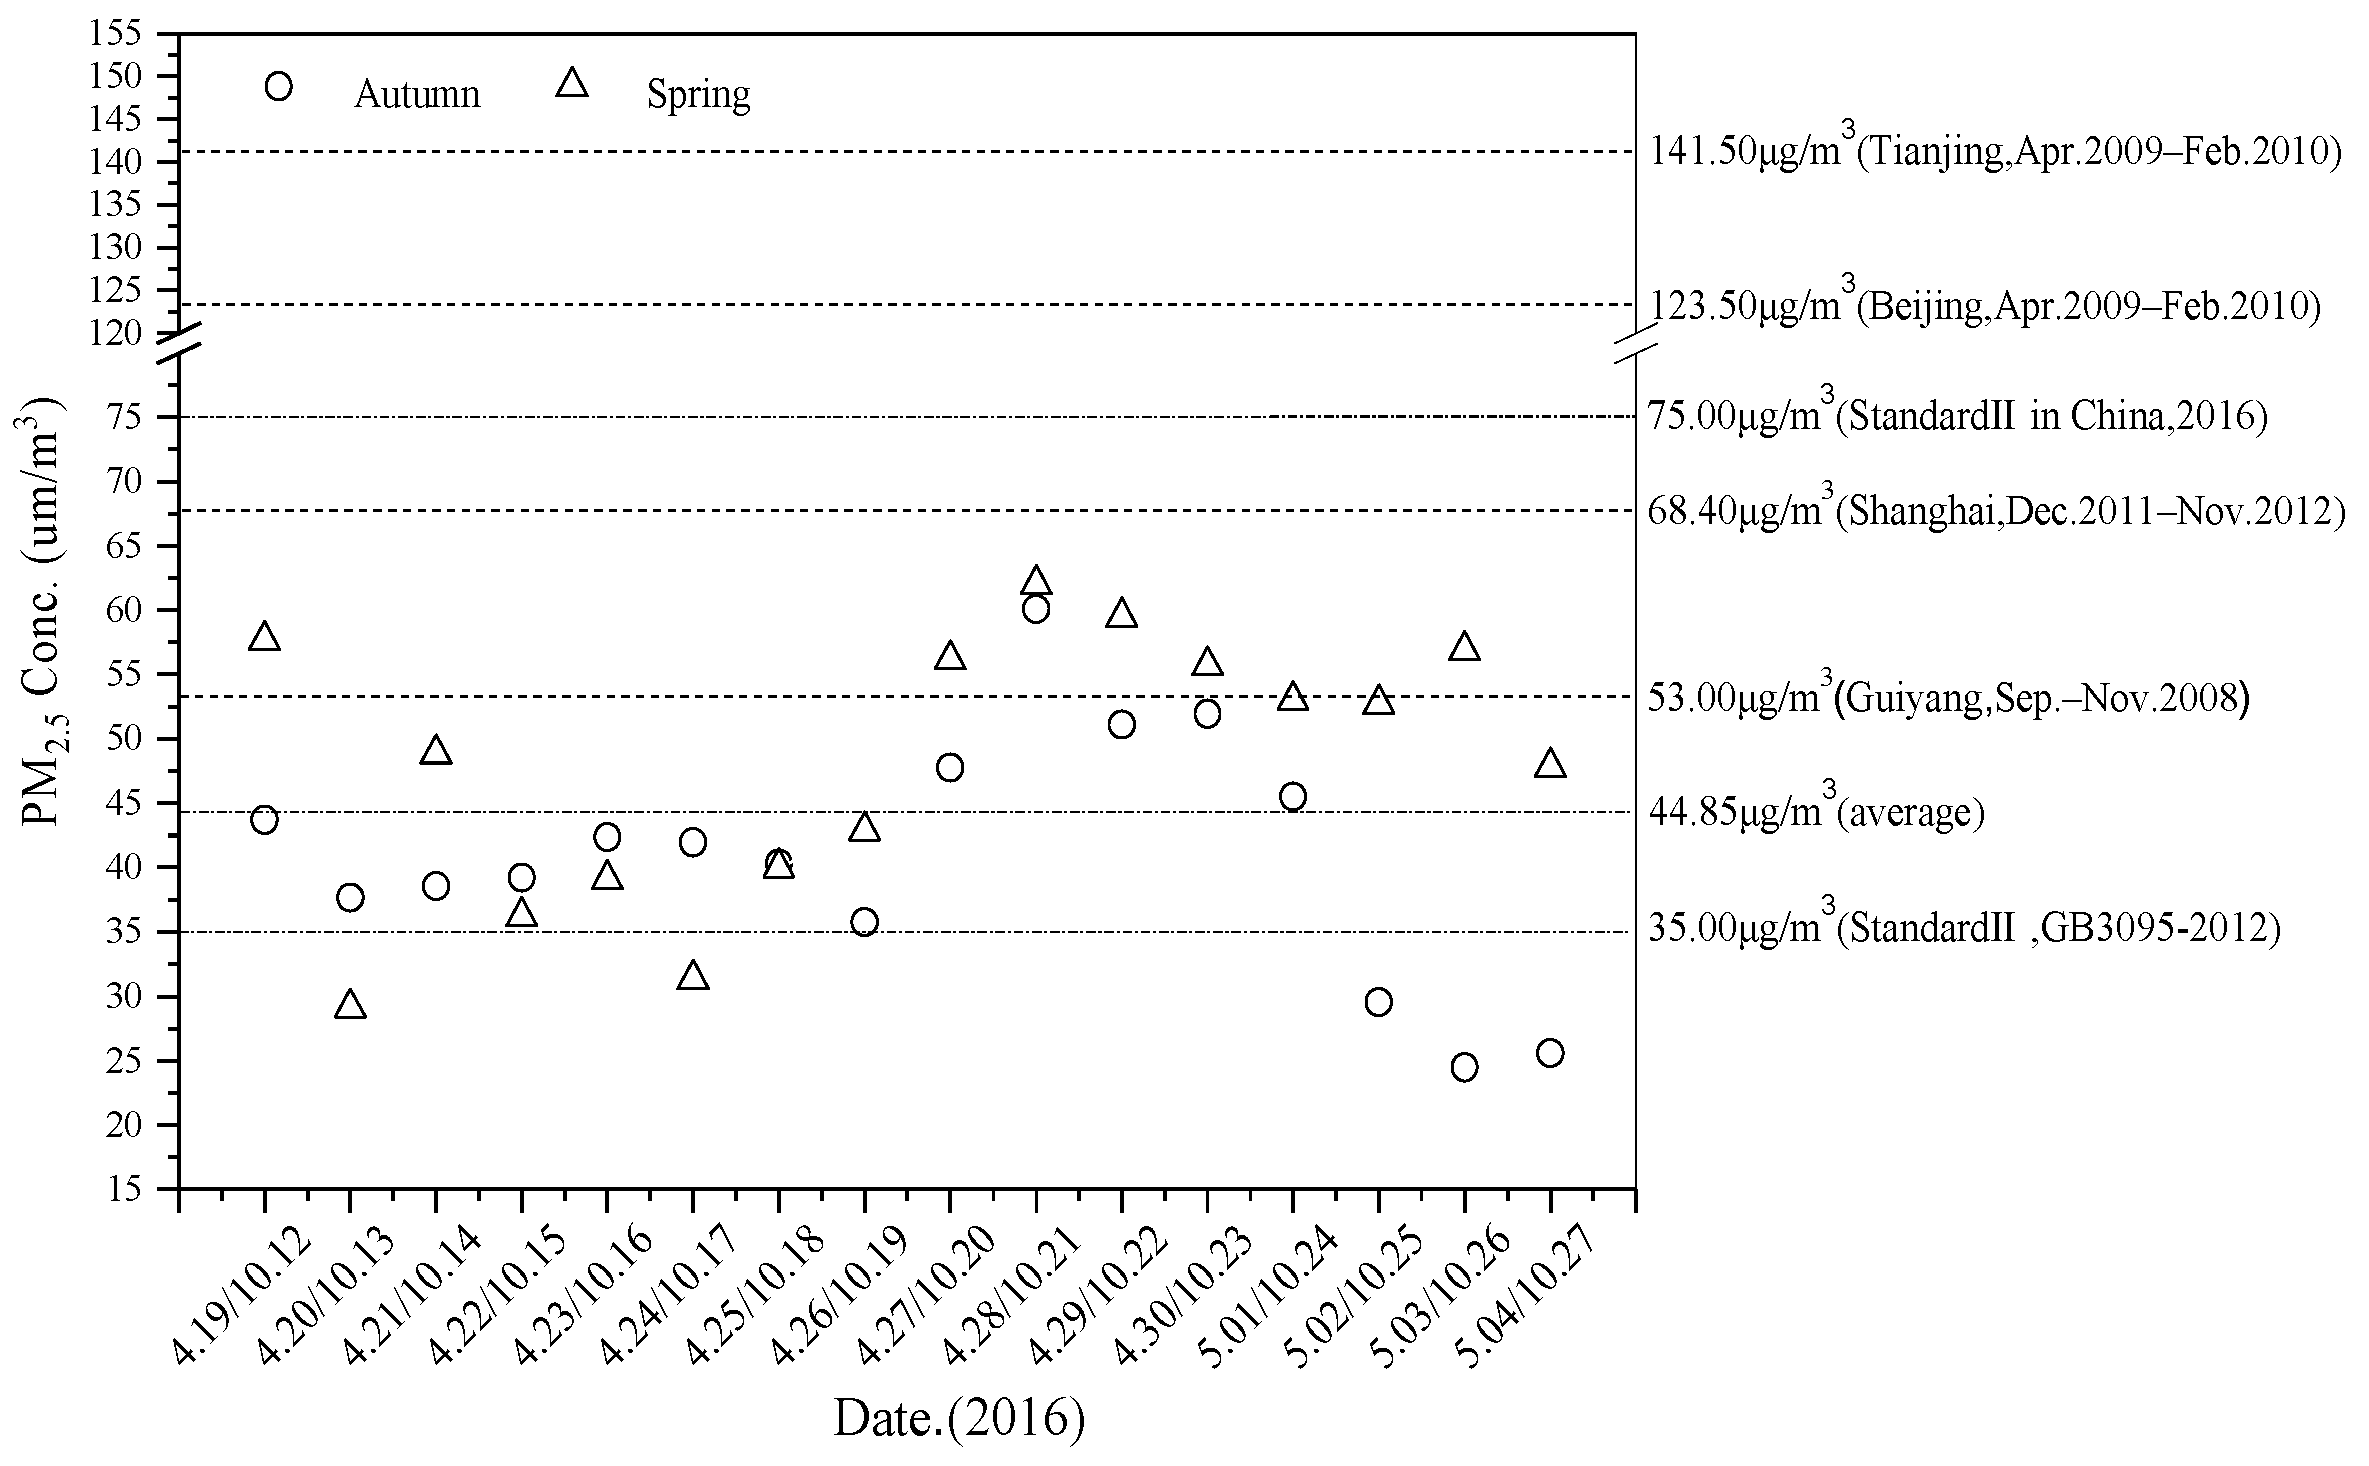
3.1. Concentration Characteristics of PM2.5
3.2. Chemical Composition Characteristic of PM2.5
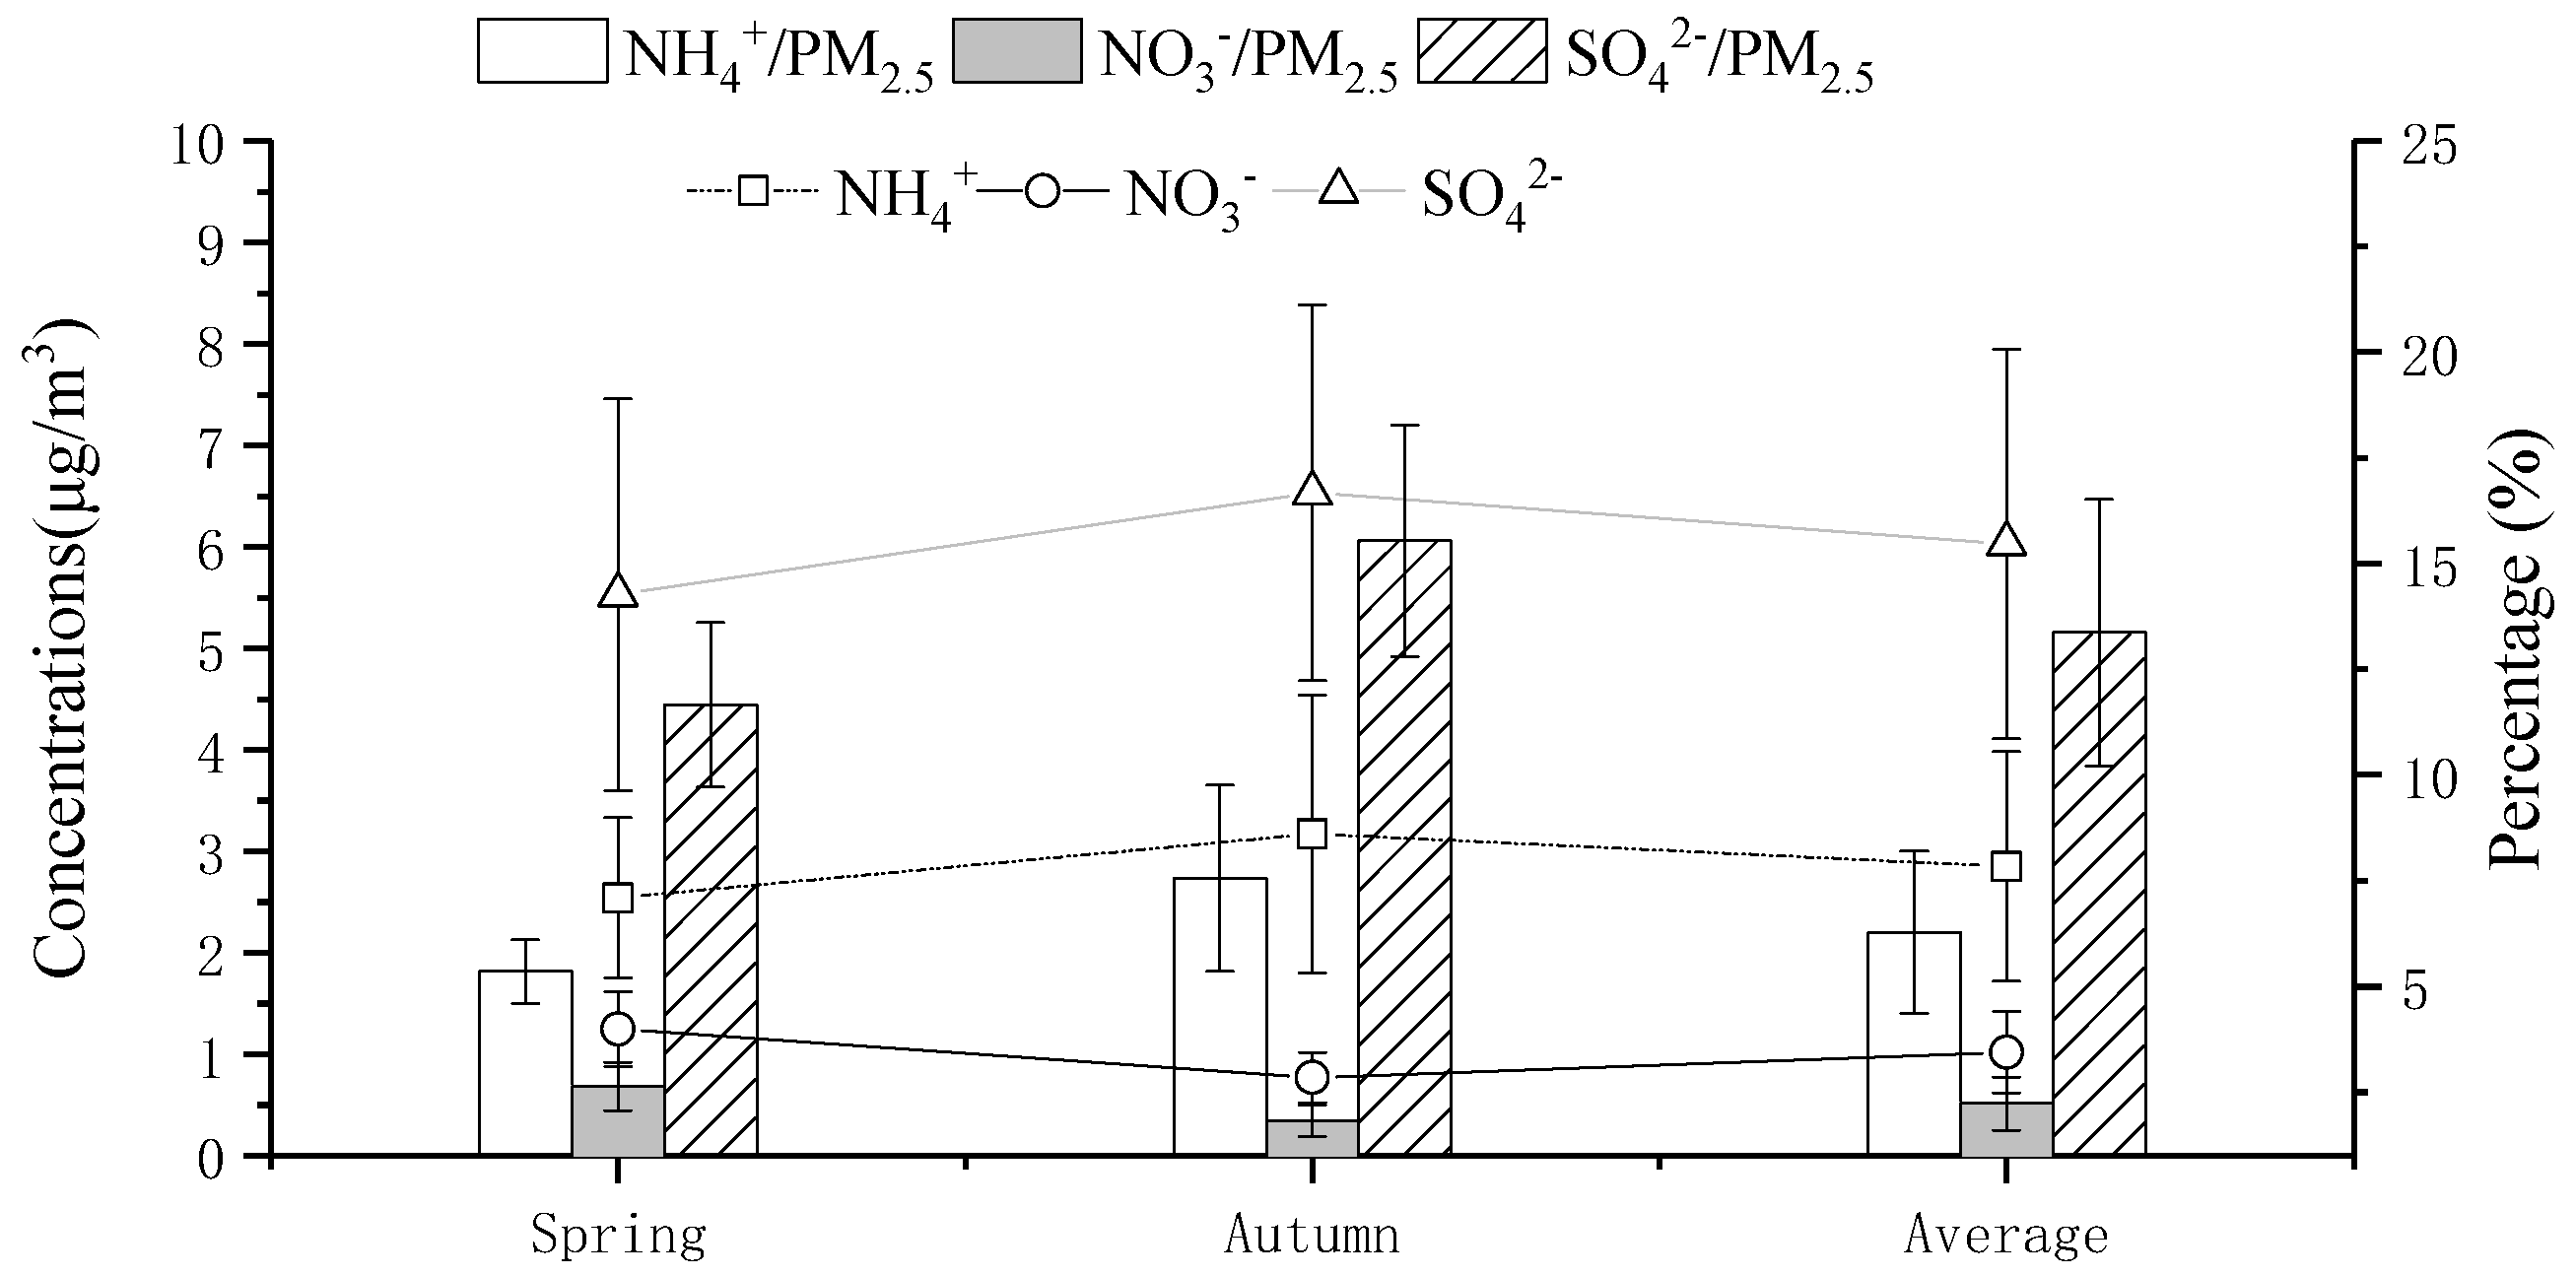
3.2.1. WSIIs Levels
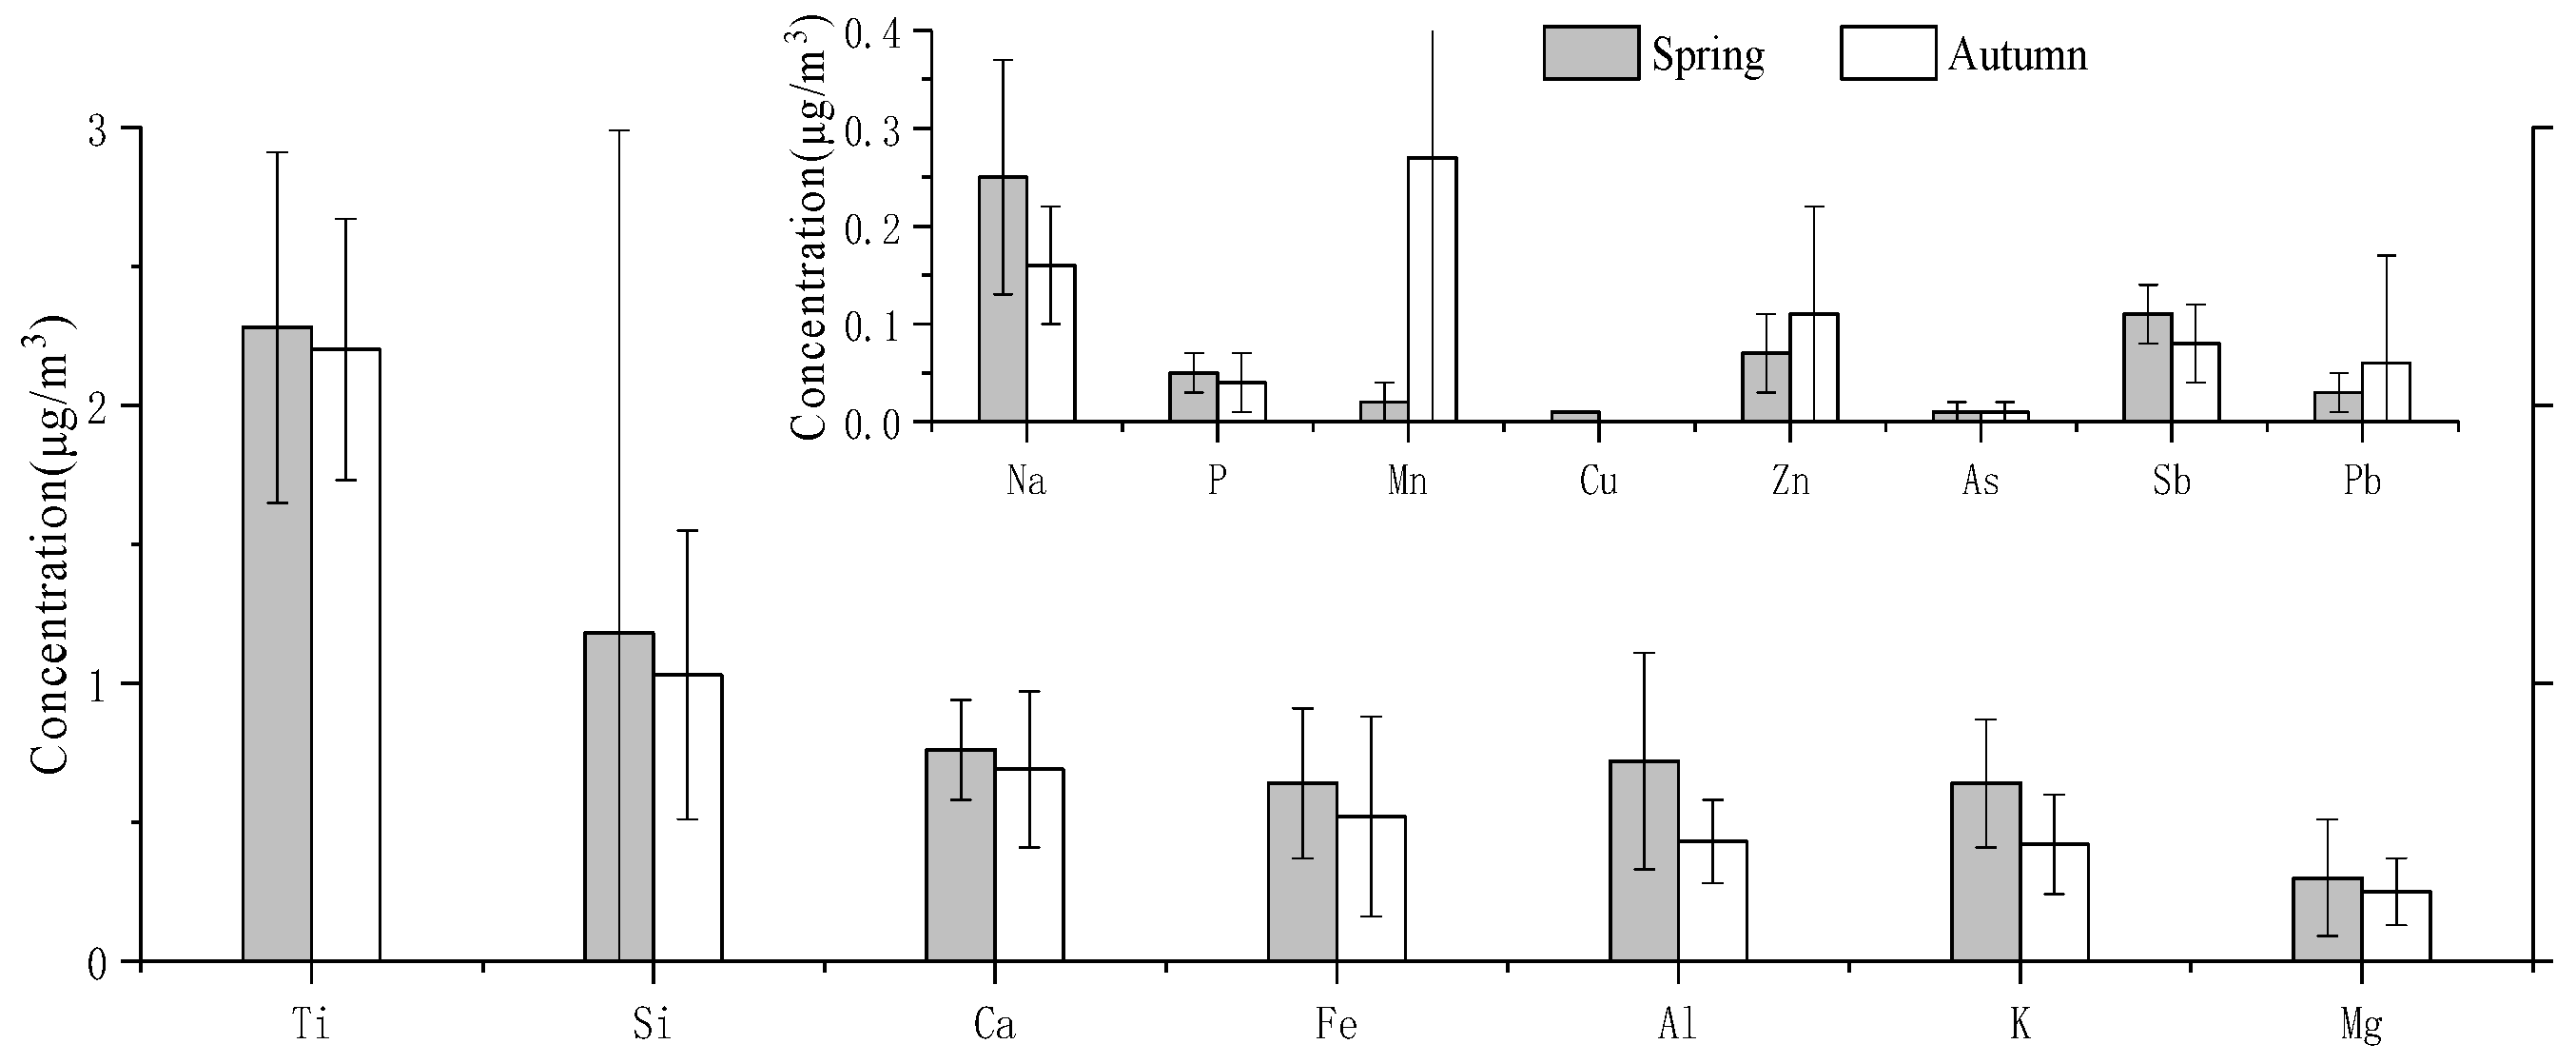
3.2.2. IEs Levels
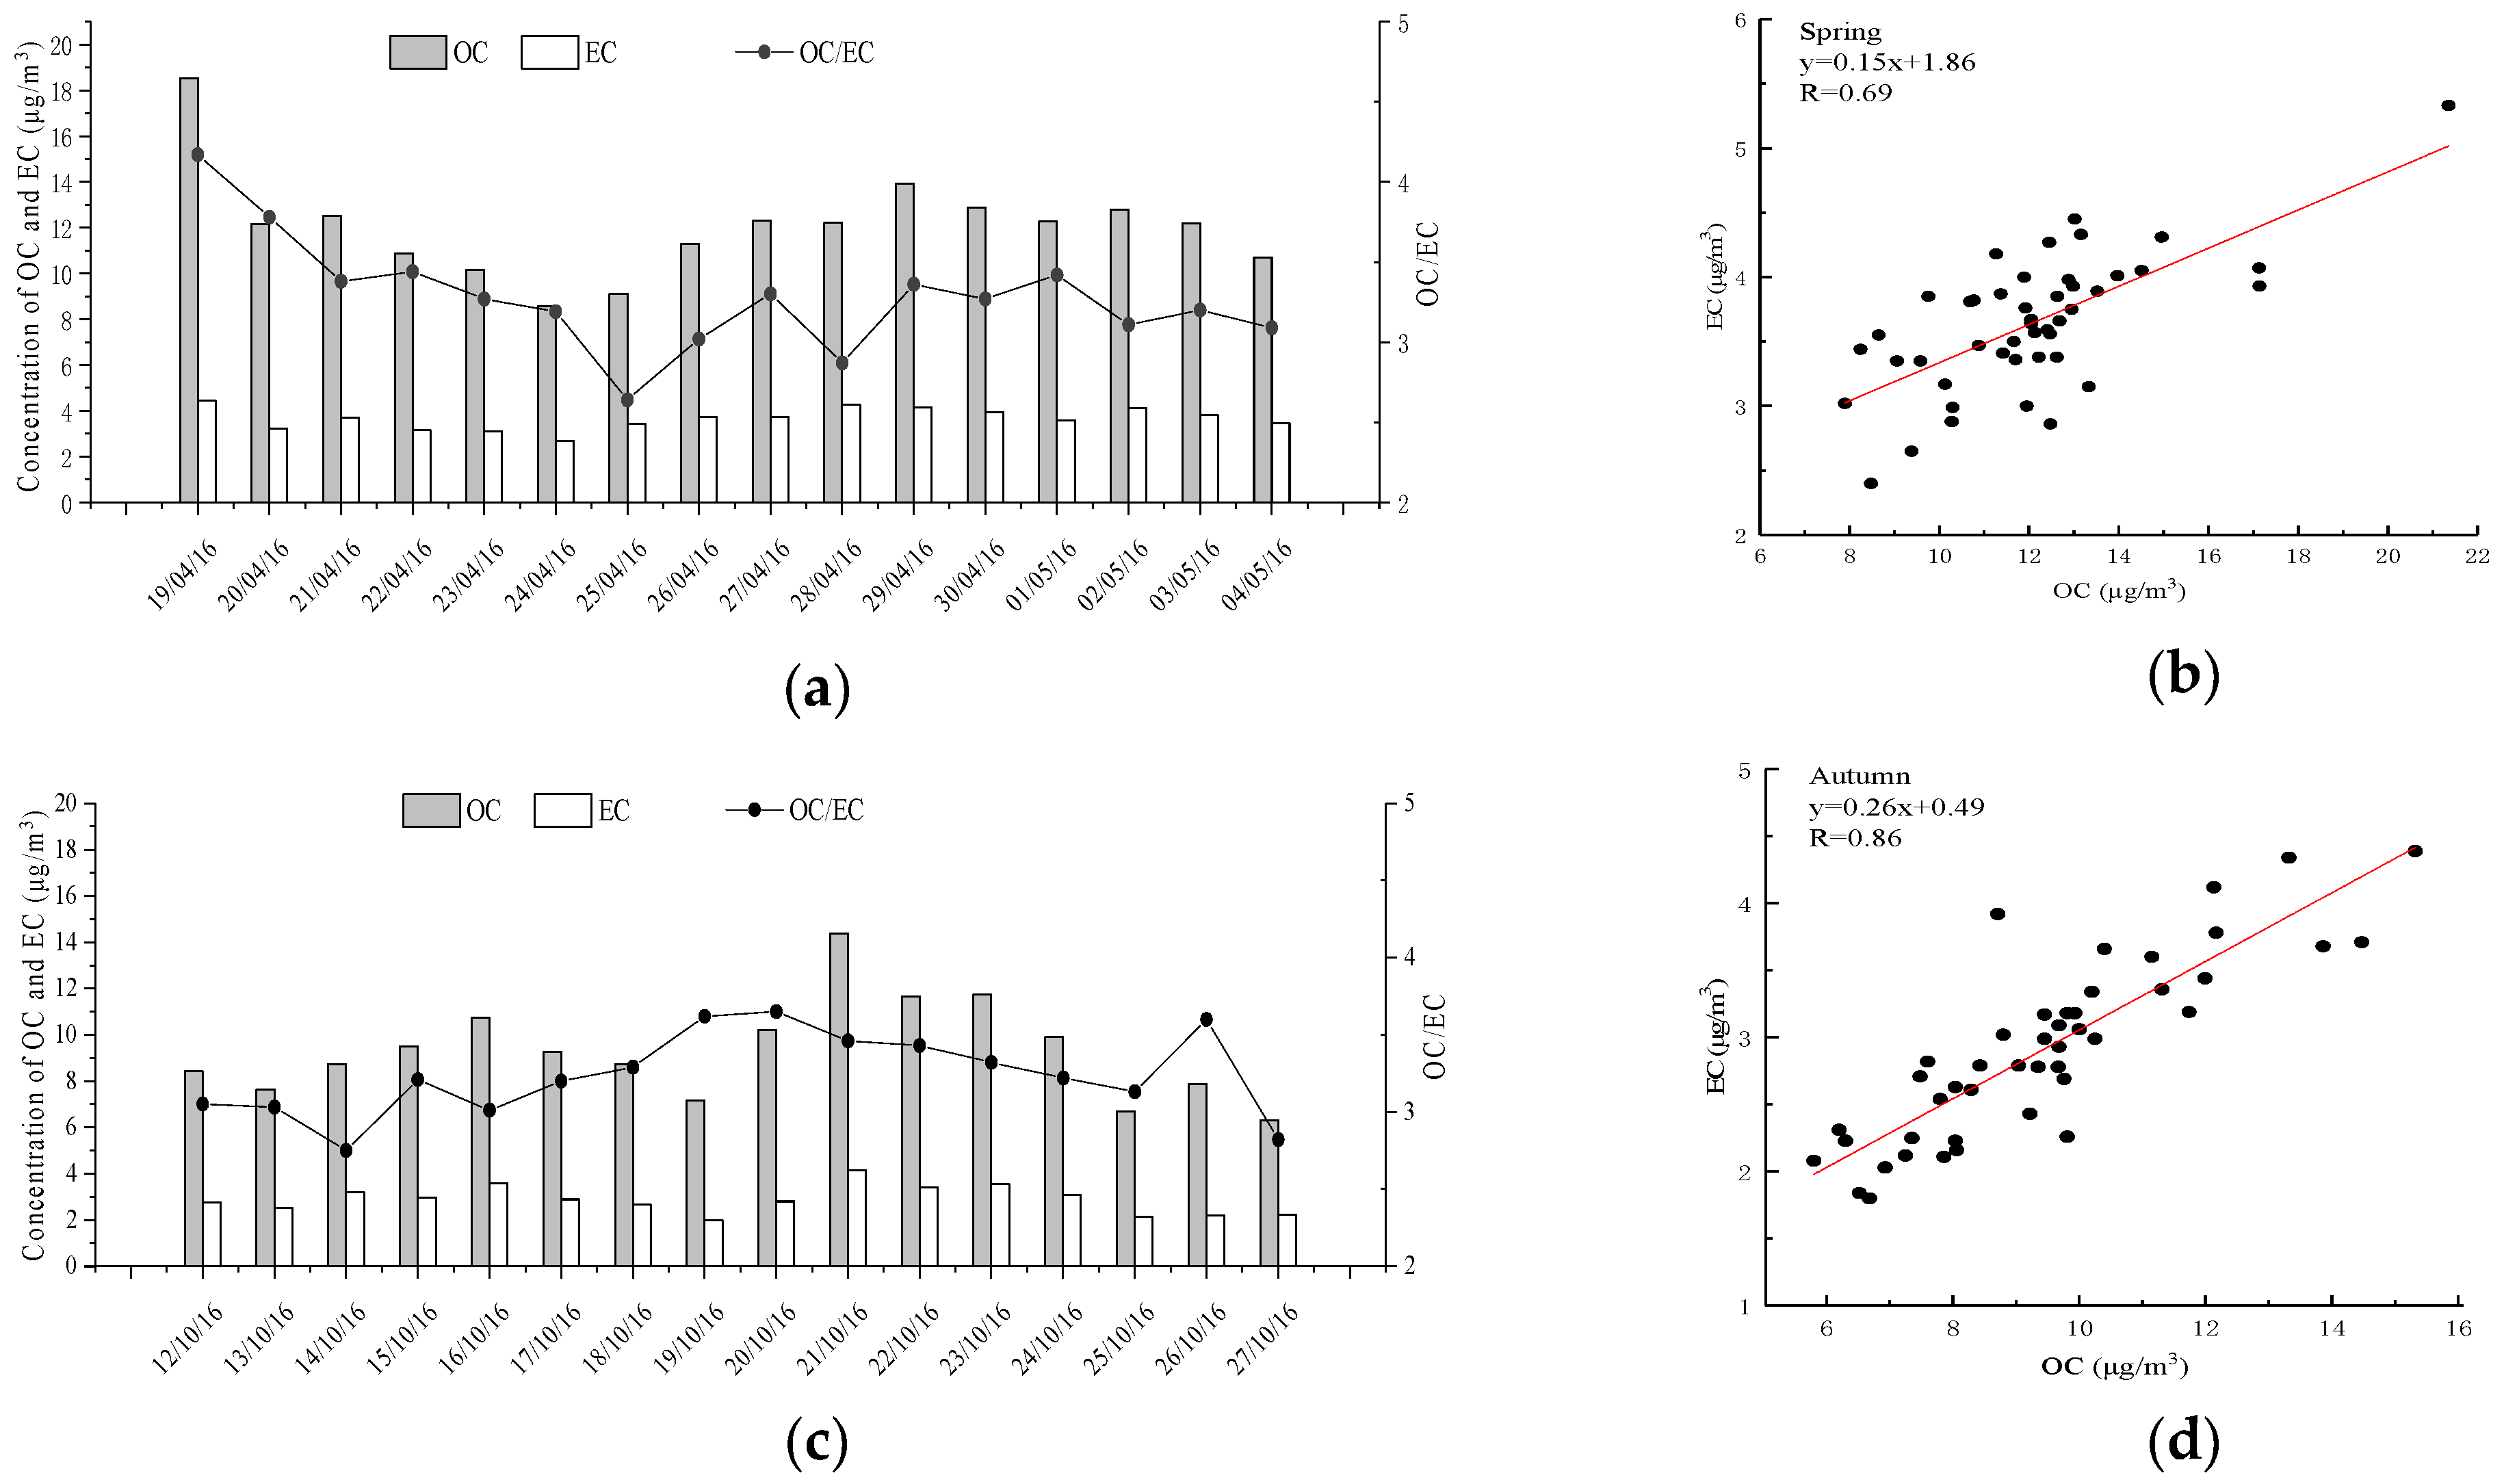
3.2.3. OC and EC Levels
3.3. Source Apportionment of PM2.5
3.3.1. Principal Component Analysis (PCA)
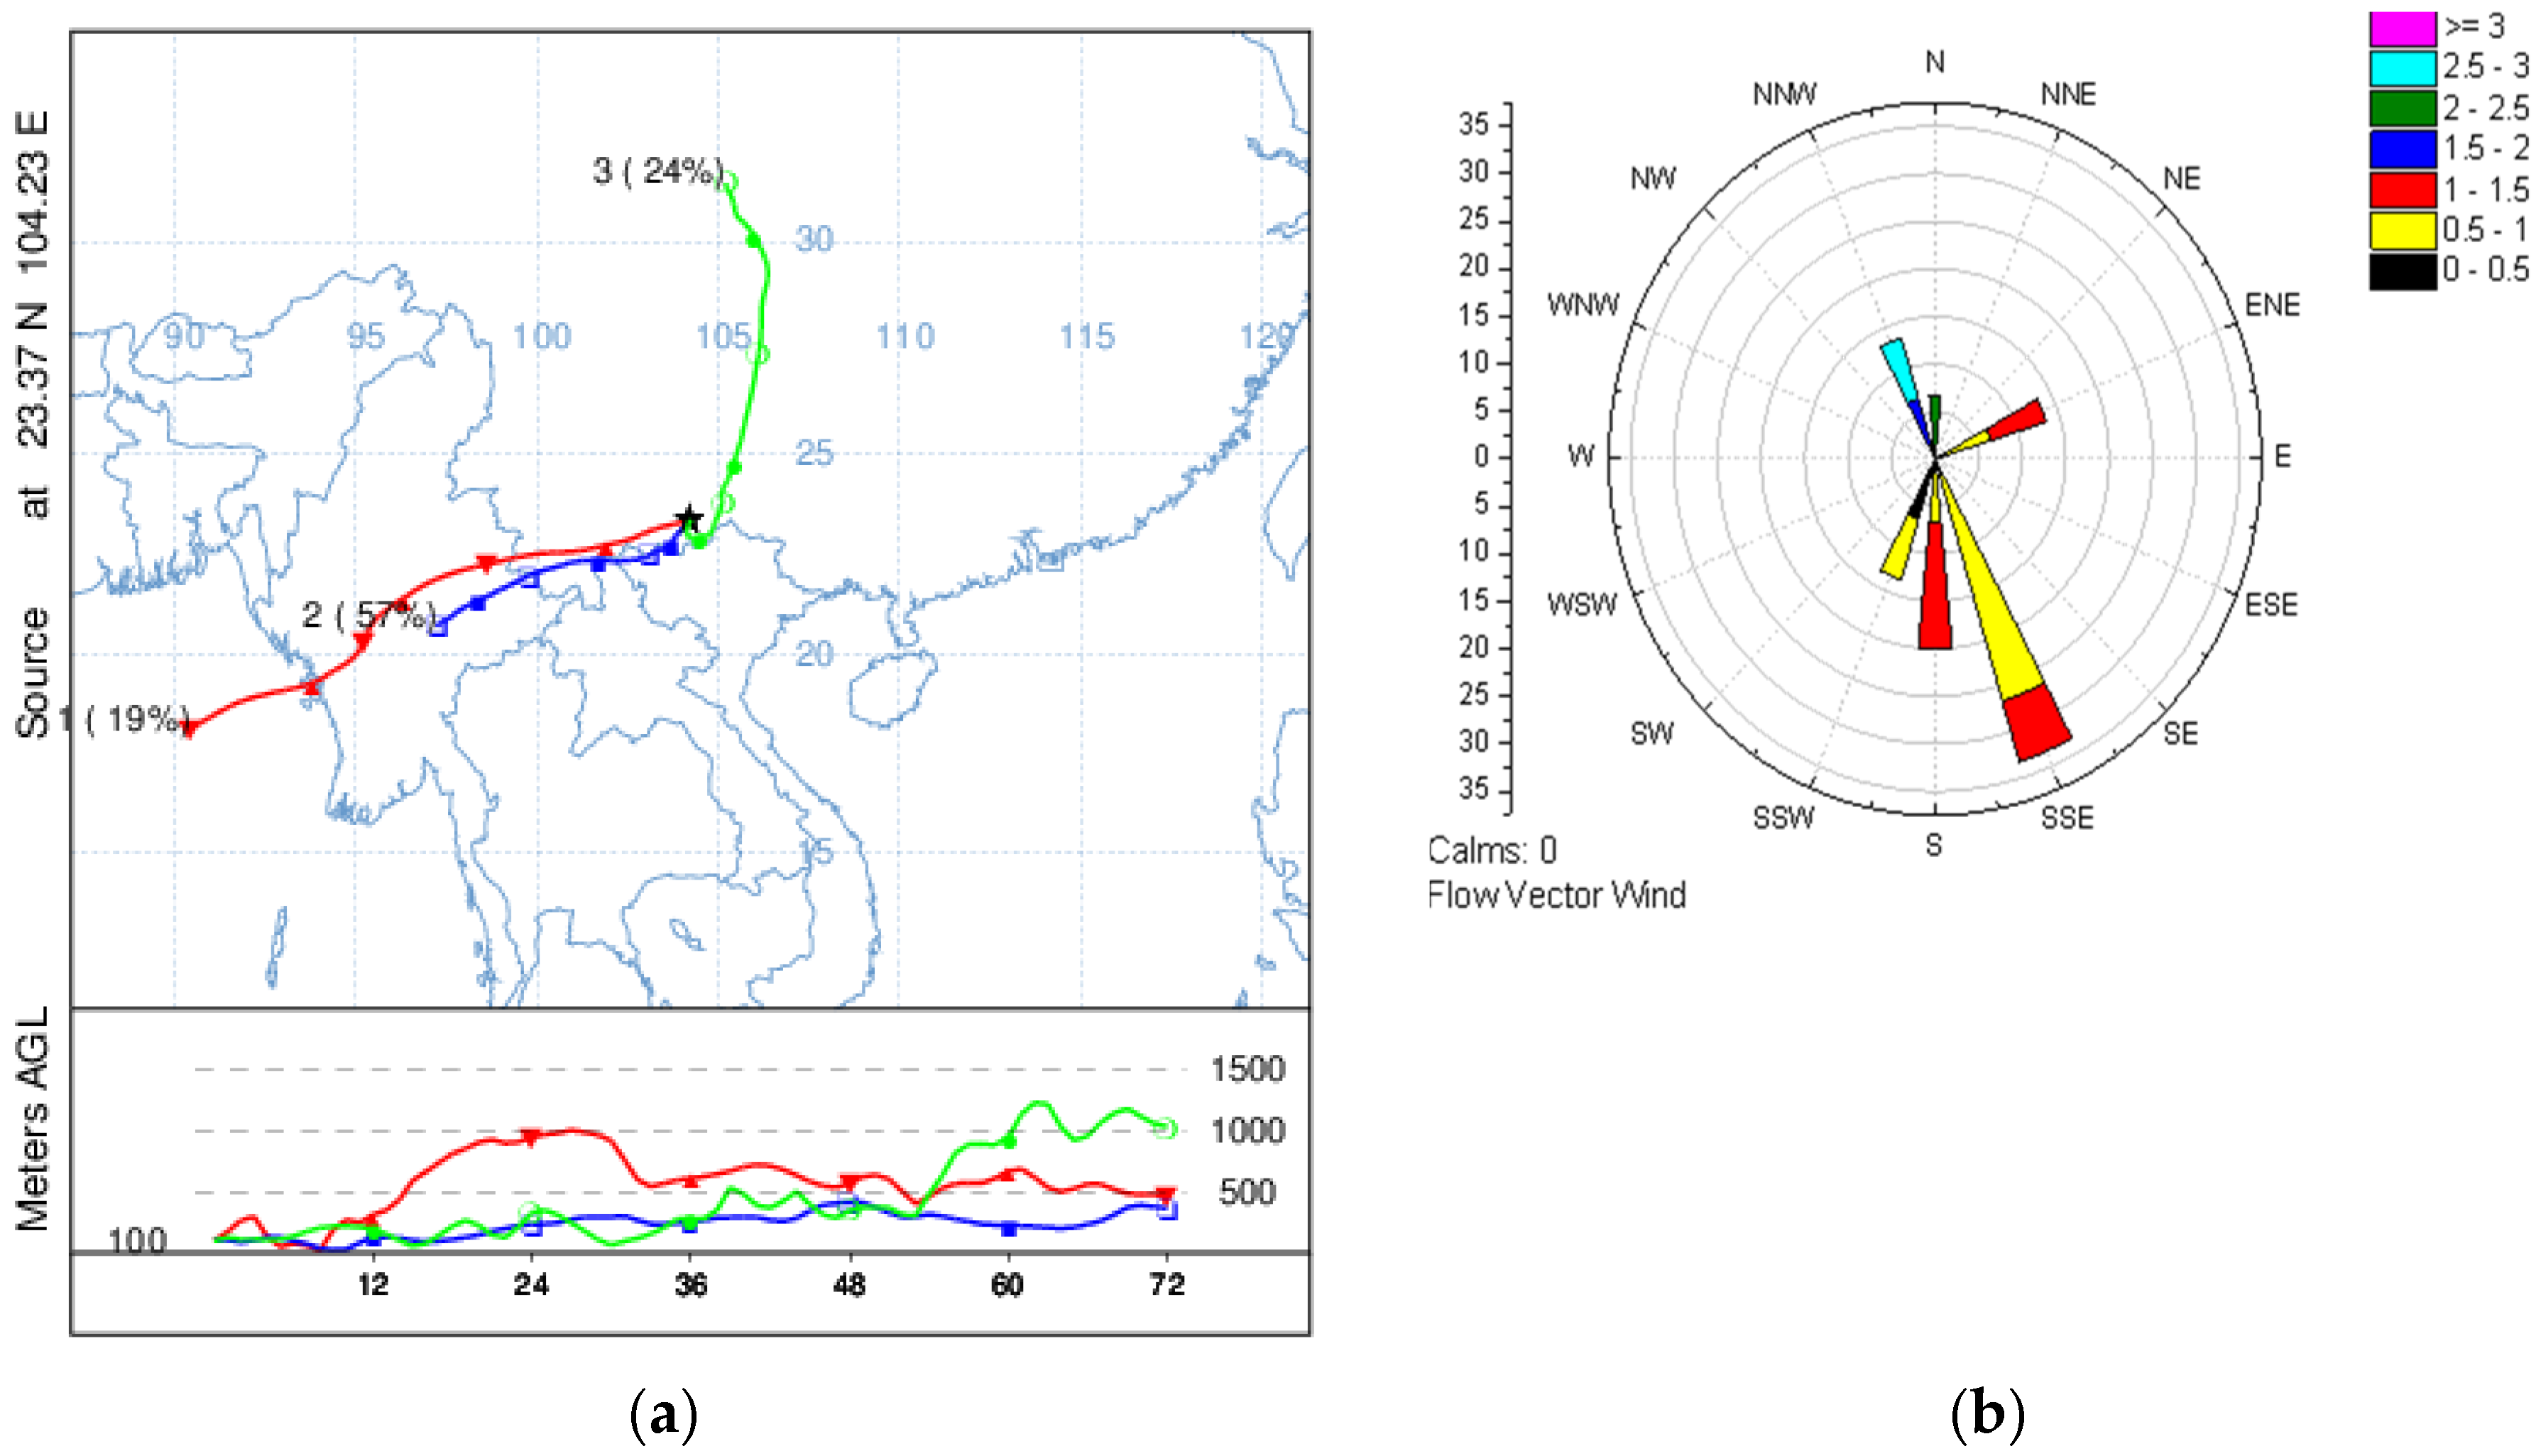
3.3.2. The Long-Range Transport
4. Conclusions
Author Contributions
Funding
Institutional Review Board Statement
Informed Consent Statement
Data Availability Statement
Acknowledgments
Conflicts of Interest
Nomenclature
| PM2.5 | Particulate matter with aerodynamic equivalent diameter less than or equal to 2.5 microns in ambient air |
| NOx | Refers to the sum of NO and NO2 |
| CCN | cloud condensation nuclei |
| WSIIs | Water-soluble inorganic ions |
| OC | organic carbon |
| EC | inorganic carbon |
| IEs | inorganic elements |
| PCA | Principal component analysis |
| UV | Ultraviolet |
| CSCW | Convenience Service Center of Wenshan |
| WAW | Water Authority of Wenshan |
| EMSW | Environmental Monitoring Station of Wenshan |
| ICP-AES | inductively coupled plasma-atomic emission spectrometry |
| DRI | Desert Institute |
| FID | Flame ion detector |
| OPC | Organic pyrolysis carbon |
| IMPROVE | Interagency Monitoring of Protected Visual Environments |
| SIAs | Secondary inorganic aerosols (including NO3−, SO42− and NH4+) |
| CE/AE | Cation/Anion concentration ratio |
| NCEP | National Centers for Environmental Prediction |
| GDAS | Global Data Assimilation System |
| QC/QA | Quality control and Quality assurance |
References
- Zong, Z.; Wang, X.; Tian, C.; Chen, Y.; Qu, L.; Ji, L.; Zhi, G.; Li, J.; Zhang, G. Source apportionment of PM2.5 at a regional background site in North China using PMF linked with radiocarbon analysis: Insight into the contribution of biomass burning. Atmos. Chem. Phys. 2016, 16, 11249–11265. [Google Scholar] [CrossRef]
- Li, L.; Wu, W.; Feng, J.; Zhang, D.; Li, H.; Gu, Z.; Wang, B.; Sheng, G.; Fu, J. Composition source mass closure of PM2.5 aerosols for four forests in eastern China. J. Environ. Sci. 2010, 22, 405–412. [Google Scholar] [CrossRef]
- Lu, D.; Xu, J.; Yang, D.; Zhao, J. Spatio-temporal variation and influence factors of PM2.5 concentrations in China from 1998 to 2014. Atmos. Pollut. Res. 2017, 8, 1151–1159. [Google Scholar] [CrossRef]
- Samresh, K.; Ramya, S.R. Inorganic ions in ambient fine particles over a National Park in central India: Seasonality, dependencies between SO42−, NO3− and NH4+, and neutralization of aerosol acidity. Atmos. Environ. 2016, 143, 152–163. [Google Scholar]
- Andreae, M.O.; Rosenfeld, D. Aerosol–cloud–precipitation interactions. Part 1. The nature and sources of cloud-active aerosols. Earth Sci. Rev. 2008, 89, 13–41. [Google Scholar] [CrossRef]
- Turap, Y.; Talifu, D.; Wang, X.; Abulizi, A.; Maihemuti, M.; Tursun, Y.; Ding, X.; Aierken, T.; Rekefu, S. Temporal distribution and source apportionment of PM2.5 chemical composition in Xinjiang, NW-China. Atmos. Res. 2019, 218, 257–268. [Google Scholar] [CrossRef]
- Qiao, B.; Chen, Y.; Tian, M.; Wang, H.; Yang, F.; Shi, G.; Zhang, L.; Peng, C.; Luo, Q.; Ding, S. Characterization of water soluble inorganic ions and their evolution processes during PM2.5 pollution episodes in a small city in southwest China. Sci. Total Environ. 2019, 650, 2605–2613. [Google Scholar] [CrossRef] [PubMed]
- Tian, S.; Liu, Y.; Wang, J.; Hou, L.; Lv, B.; Wang, X.; Zhao, X.; Yang, W.; Geng, C.; Han, B. Chemical Compositions and Source Analysis of PM2.5 during Autumn and Winter in a Heavily Polluted City in China. Atmosphere 2020, 11, 336. [Google Scholar] [CrossRef]
- Guo, W.; Long, C.; Zhang, Z.; Zheng, N.; Xiao, H.; Xiao, H. Seasonal Control of Water-Soluble Inorganic Ions in PM2.5 from Nanning, a Subtropical Monsoon Climate City in Southwestern China. Atmosphere 2019, 11, 5. [Google Scholar] [CrossRef]
- Zhang, J.; Tong, L.; Huang, Z.; Zhang, H.; He, M.; Dai, X.; Zheng, J.; Xiao, H. Seasonal variation and size distributions of water-soluble inorganic ions and carbonaceous aerosols at a coastal site in Ningbo, China. Sci. Total Environ. 2018, 639, 793–803. [Google Scholar] [CrossRef]
- Dong, Z.; Su, F.; Zhang, Z.; Wang, S. Observation of chemical components of PM2.5 and secondary inorganic aerosol formation during haze and sandy haze days in Zhengzhou, China. J. Environ. Sci. 2020, 88, 316–325. [Google Scholar] [CrossRef]
- Golly, B.; Waked, A.; Weber, S.; Samake, A.; Jacob, V.; Conil, S.; Rangognio, J.; Chrétien, E.; Vagnot, M.-P.; Robic, P.-Y.; et al. Organic markers and OC source apportionment for seasonal variations of PM2.5 at 5 rural sites in France. Atmos. Environ. 2019, 198, 142–157. [Google Scholar] [CrossRef]
- Jin, Q.; Fang, X.; Wen, B.; Shan, A. Spatio-temporal variations of PM2.5 emission in China from 2005 to 2014. Chemosphere 2017, 183, 429–436. [Google Scholar] [CrossRef]
- Siudek, P.; Frankowski, M. Atmospheric deposition of trace elements at urban and forest sites in central Poland–Insight into seasonal variability and sources. Atmos. Res. 2017, 198, 123–131. [Google Scholar] [CrossRef]
- Guan, Q.; Liu, Z.; Yang, L.; Luo, H.; Yang, Y.; Zhao, R.; Wang, F. Variation in PM2.5 source over megacities on the ancient Silk Road, northwestern China. J. Clean. Prod. 2019, 208, 897–903. [Google Scholar] [CrossRef]
- Pineda-Martínez, L.F.; Carbajal, N.; Campos-Ramos, A.; Aragón-Piña, A.; García, A.R. Dispersion of atmospheric coarse particulate matter in the San Luis Potosí, Mexico, urban area. Atmósfera 2014, 27, 5–19. [Google Scholar] [CrossRef][Green Version]
- Dai, Q.; Bi, X.; Liu, B.; Li, L.; Ding, J.; Song, W.; Bi, S.; Schulze, B.C.; Song, C.; Wu, J.; et al. Chemical nature of PM2.5 and PM10 in Xi’an, China: Insights into primary emissions and secondary particle formation. Environ. Pollut. 2018, 240, 155–166. [Google Scholar] [CrossRef]
- Wang, S.; Yu, R.; Shen, H.; Wang, S.; Hu, Q.; Cui, J.; Yan, Y.; Huang, H.; Hu, G. Chemical characteristics, sources, and formation mechanisms of PM2.5 before and during the Spring Festival in a coastal city in Southeast China. Environ. Pollut. 2019, 251, 442–452. [Google Scholar] [CrossRef] [PubMed]
- Xie, Y.; Liu, Z.; Wen, T.; Huang, X.; Liu, J.; Tang, G.; Yang, Y.; Li, X.; Shen, R.; Hu, B.; et al. Characteristics of chemical composition and seasonal variations of PM2.5 in Shijiazhuang, China: Impact of primary emissions and secondary formation. Sci. Total Environ. 2019, 677, 215–229. [Google Scholar] [CrossRef] [PubMed]
- Souto-Oliveira, C.E.; Babinski, M.; Araújo, D.F.; Weiss, D.J.; Ruiz, I.R. Multi-isotope approach of Pb, Cu and Zn in urban aerosols and anthropogenic sources improves tracing of the atmospheric pollutant sources in megacities. Atmos. Environ. 2019, 198, 427–437. [Google Scholar] [CrossRef]
- Li, R.; Hardy, R.; Zhang, W.; Reinbold, G.L.; Strachan, S.M. Chemical Characterization and Source Apportionment of PM2.5 in a Nonattainment Rocky Mountain Valley. J. Environ. Qual. 2018, 47, 238–245. [Google Scholar] [CrossRef] [PubMed]
- Wang, H.L.; Qiao, L.P.; Lou, S.R.; Zhou, M.; Ding, A.J.; Huang, H.Y.; Chen, J.M.; Wang, Q.; Tao, S.K.; Chen, C.H.; et al. Chemical composition of PM2.5 and meteorological impact among three years in urban Shanghai, China. J. Clean. Prod. 2016, 112, 1302–1311. [Google Scholar] [CrossRef]
- Cao, L.; Zhu, Q.; Huang, X.; Deng, J.; Chen, J.; Hong, Y.; Xu, L.; He, L. Chemical characterization and source apportionment of atmospheric submicron particles on the western coast of Taiwan Strait, China. J. Environ. Sci. 2017, 52, 293–304. [Google Scholar] [CrossRef]
- Zhu, W.; Xu, X.; Zheng, J.; Yan, P.; Wang, Y.; Cai, W. The characteristics of abnormal wintertime pollution events in the Jing-Jin-Ji region and its relationships with meteorological factors. Sci. Total Environ. 2018, 626, 887–898. [Google Scholar] [CrossRef]
- Li, J.; Bi, L.; Han, X.; Shi, J.; Yang, J.; Shi, Z.; Ning, P. Characteristics and source apportionment of the water soluble inorganic ions in PM2.5 of Kunming. J. Yunnan Univ. 2017, 39, 63–70. (In Chinese) [Google Scholar]
- Bi, L.; Hao, J.; Ning, P.; Shi, J.; Shi, Z.; Xu, X. Characteristics and sources apportionment of PM2.5-bound PAHs in Kunming. China Environ. Sci. 2015, 35, 659–667. (In Chinese) [Google Scholar]
- Wang, C.H.; Yan, K.; Han, X.Y.; Shi, Z.; Bi, L.M.; Xiang, F.; Ning, P.; Shi, J.W. Physico-chemical Characteristic Analysis of PM2.5 in the Highway Tunnel in the Plateau City of Kunming. Environ. Sci. 2017, 38, 4968–4975. (In Chinese) [Google Scholar]
- Han, L.; Huang, J.; Han, X.; Yang, J.; Shi, J.; Zhang, C.; Ning, P. Characteristics and Sources of Heavy Metals in Atmospheric PM2.5 Research during the Dry Season in Kunming. J. Kunming Univ. Sci. Technol. Nat. Sci. 2019, 44, 99–110. (In Chinese) [Google Scholar]
- Sun, Z.-R.; Ji, Z.-Y.; Han, X.-Y.; Shi, J.-W.; Zhang, J.; Zhang, C.-N.; Ning, P. Spatial and temporal characteristics of atmospheric VOCs and other pollutants concentrations in urban air of Yuxi City. J. Yunnan Univ. 2018, 40, 705–715. (In Chinese) [Google Scholar]
- Shi, Z.; Bi, L.; Shi, J.; Xiang, F.; Qian, L.; Ning, P. Characterization and Source Identification of PM2.5 in Ambient Air of Kunming in Windy Spring. Environ. Sci. Technol. 2014, 37, 143–147, 153. (In Chinese) [Google Scholar]
- Jain, S.; Sharma, S.; Mandal, T.; Saxena, M. Source apportionment of PM10 in Delhi, India using PCA/APCS, UNMIX and PMF. Particuology 2018, 37, 107–118. [Google Scholar] [CrossRef]
- Dallarosa, J.; Teixeira, E.C.; Meira, L.; Wiegand, F. Study of the chemical elements and polycyclic aromatic hydrocarbons in atmospheric particles of PM10 and PM2.5 in the urban and rural areas of South Brazil. Atmos. Res. 2008, 89, 76–92. [Google Scholar] [CrossRef]
- Lara, L.; Artaxo, P.; Martinelli, L.; Victoria, R.; Camargo, P.; Krusche, A.; Ayers, G.; Ferraz, E.; Ballester, M. Chemical composition of rainwater and anthropogenic influences in the Piracicaba River Basin, Southeast Brazil. Atmos. Environ. 2001, 35, 4937–4945. [Google Scholar] [CrossRef]
- Lee, B.K.; Hong, S.H.; Lee, N.S. Chemical composition of precipitation and wet deposition of major ions on the Korean peninsula. Atmos. Environ. 2000, 34, 563–575. [Google Scholar]
- Chan, T.W.; Mozurkewich, M. Application of absolute principal component analysis to size distribution data: Identification of particle origins. Atmos. Chem. Phys. Discuss. 2007, 7, 887–897. [Google Scholar] [CrossRef]
- Gupta, S.; Gadi, R.; Sharma, S.; Mandal, T. Characterization and source apportionment of organic compounds in PM10 using PCA and PMF at a traffic hotspot of Delhi. Sustain. Cities Soc. 2018, 39, 52–67. [Google Scholar] [CrossRef]
- Zhao, P.S.; Dong, F.; He, D.; Zhao, X.J.; Zhang, X.L.; Zhang, W.Z.; Yao, Q.; Liu, H.Y. Characteristics of concentrations and chemical compositions for PM2.5 in the region of Beijing, Tianjin, and Hebei, China. Atmos. Chem. Phys. 2013, 13, 4631–4644. [Google Scholar] [CrossRef]
- Zhao, M.; Huang, Z.; Qiao, T.; Zhang, Y.; Xiu, G.; Yu, J. Chemical characterization, the transport pathways and potential sources of PM2.5 in Shanghai: Seasonal variations. Atmos. Res. 2015, 158, 66–78. [Google Scholar] [CrossRef]
- Liu, N.; Feng, X.; Matthew, L.; Chen, Z.; Qiu, G. Pollution Characteristics of PM2.5 in Guiyang and Its Influence on Meteorological Parameters. Earth Environ. 2014, 42, 311–315. (In Chinese) [Google Scholar]
- Xiao, J.; Tang, X.; Hu, Y. Initial interpretation on the source of atmospheric PM2.5 in Guiyang city. Environ. Prot. Technol. 2014, 5, 1–18. (In Chinese) [Google Scholar]
- Yang, Y.; Zhou, R.; Wu, J.; Yu, Y.; Ma, Z.; Zhang, L. Seasonal variations and size distributions of water-soluble ions in atmospheric aerosols in Beijing, 2012. J. Environ. Sci. 2015, 34, 197–205. [Google Scholar] [CrossRef]
- Xue, G.Q.; Zhu, B.; Wang, H.L. Size Distributions and Source Apportionment of Soluble Ions in Aerosol in Nanjing. Environ. Sci. 2014, 5, 1633–1643. (In Chinese) [Google Scholar]
- Li, W.; Wang, X.; Zhang, Y. Influence of PRD Industrial Emission Variation on Concentrations of SO2, NOx and their Secondary Pollutants. Res. Environ. Sci. 2009, 22, 207–214. (In Chinese) [Google Scholar]
- Wang, H.; An, J.; Cheng, M.; Shen, L.; Zhu, B.; Li, Y.; Wang, Y.; Duan, Q.; Sullivan, A.; Xia, L. One year online measurements of water-soluble ions at the industrially polluted town of Nanjing, China: Sources, seasonal and diurnal variations. Chemosphere 2016, 148, 526–536. [Google Scholar] [CrossRef]
- Wang, Y.; Zhuang, G.; Zhang, X.; Huang, K.; Xu, C.; Tang, A.; Chen, J.; An, Z. The ion chemistry, seasonal cycle, and sources of PM2.5 and TSP aerosol in Shanghai. Atmos. Environ. 2006, 40, 2935–2952. [Google Scholar] [CrossRef]
- He, Q.; Yan, Y.; Guo, L.; Zhang, Y.; Zhang, G.; Wang, X. Characterization and source analysis of water-soluble inorganic ionic species in PM2.5 in Taiyuan city, China. Atmos. Res. 2017, 184, 48–55. [Google Scholar] [CrossRef]
- Rengarajan, R.; Sudheer, A.K.; Sarin, M.M. Wintertime PM2.5 and PM10 carbonaceous and inorganic constituents from urban site in western India. Atmos. Res. 2011, 102, 420–431. [Google Scholar] [CrossRef]
- Favez, O.; Cachier, H.; Sciare, J.; Alfaro, S.C.; El-Araby, T.M.; Harhash, M.A.; Abdelwahab, M.M. Seasonality of major aerosol species and their transformations in Cairo megacity. Atmos. Environ. 2008, 42, 1503–1516. [Google Scholar] [CrossRef]
- Qiu, T.; Zhou, J.; Xiao, J.; Guo, H.; Yu, W. Characteristics and sources apportionment of water-soluble ions in PM2.5 in autumn and winter of Wuhan. Environ. Pollut. Prev. 2015, 37, 17–20. (In Chinese) [Google Scholar]
- Sun, Y.; Zhuang, G.; Wang, Y.; Han, L.; Guo, J.; Dan, M.; Zhang, W.; Wang, Z.; Hao, Z. The air-borne particulate pollution in Beijing—concentration, composition, distribution and sources. Atmos. Environ. 2004, 38, 5991–6004. [Google Scholar] [CrossRef]
- Zhang, T.; Cao, J.; Tie, X.; Shen, Z.; Liu, S.; Ding, H.; Han, Y.; Wang, G.; Ho, K.; Qiang, J.; et al. Water-soluble ions in atmospheric aerosols measured in Xi’an, China: Seasonal variations and sources. Atmos. Res. 2011, 102, 110–119. [Google Scholar] [CrossRef]
- Wang, P.; Cao, J.-J.; Shen, Z.-X.; Han, Y.-M.; Lee, S.-C.; Huang, Y.; Zhu, C.-S.; Wang, Q.-Y.; Xu, H.-M.; Huang, R.-J. Spatial and seasonal variations of PM2.5 mass and species during 2010 in Xi’an, China. Sci. Total Environ. 2015, 508, 477–487. [Google Scholar] [CrossRef]
- Yao, X.; Chan, C.K.; Fang, M.; Cadle, S.; Chan, T.; Mulawa, P.; He, K.; Ye, B. The water-soluble ionic composition of PM2.5 in Shanghai and Beijing, China. Atmos. Environ. 2002, 36, 4223–4234. [Google Scholar] [CrossRef]
- Hu, M.; He, L.-Y.; Zhang, Y.-H.; Wang, M.; Kim, Y.P.; Moon, K. Seasonal variation of ionic species in fine particles at Qingdao, China. Atmos. Environ. 2002, 36, 5853–5859. [Google Scholar] [CrossRef]
- Fang, G.-C.; Chang, C.-N.; Wu, Y.-S.; Fu, P.P.-C.; Yang, C.-J.; Chen, C.-D.; Chang, S.-C. Ambient suspended particulate matters and related chemical species study in central Taiwan, Taichung during 1998–2001. Atmos. Environ. 2002, 36, 1921–1928. [Google Scholar] [CrossRef]
- Bhuyan, P.; Deka, P.; Prakash, A.; Balachandran, S.; Hoque, R.R. Chemical characterization and source apportionment of aerosol over mid Brahmaputra Valley, India. Environ. Pollut. 2018, 234, 997–1010. [Google Scholar] [CrossRef]
- Meng, C.; Wang, L.; Zhang, F.; Wei, Z.; Ma, S.; Ma, X.; Yang, J. Characteristics of concentrations and water-soluble inorganic ions in PM2.5 in Handan City, Hebei province, China. Atmos. Res. 2016, 171, 133–146. [Google Scholar] [CrossRef]
- Yang, Y.; Zhou, R.; Yu, Y.; Yan, Y.; Liu, Y.; Wu, D.; Zhang, W. Size-resolved aerosol water-soluble ions at a regional background station of Beijing, Tianjin, and Hebei, North China. J. Environ. Sci. 2017, 55, 146–156. [Google Scholar] [CrossRef]
- Huang, L.; Wang, G. Chemical characteristics and source apportionment of atmospheric particles during heating period in Harbin, China. J. Environ. Sci. 2014, 26, 2475–2483. [Google Scholar] [CrossRef] [PubMed]
- Lv, S.; Shao, L.; Wu, M. Characteristics of Chemical Elements in Beijing PM10 and Their Source Apportionment. J. China Univ. Min. Technol. 2006, 35, 685–688. (In Chinese) [Google Scholar]
- Pakkanen, T.A.; Loukkola, K.; Korhonen, C.H.; Aurela, M.; Mäkelä, T.; Hillamo, R.E.; Aarnio, P.; Koskentalo, T.; Kousa, A.; Maenhaut, W. Sources and chemical composition of atmospheric fine and coarse particles in the Helsinki area. Atmos. Environ. 2001, 35, 5381–5391. [Google Scholar] [CrossRef]
- Chu, S.H. Stable estimate of primary OC/EC ratios in the EC tracer method. Atmos. Environ. 2005, 39, 1383–1392. [Google Scholar] [CrossRef]
- Wang, T.; Nie, W.; Gao, J.; Xue, L.K.; Gao, X.M.; Wang, X.F.; Qiu, J.; Poon, C.N.; Meinardi, S.; Blake, D.; et al. Air quality during the 2008 Beijing Olympics: Secondary pollutants and regional impact. Atmos. Chem. Phys. 2010, 10, 7603–7615. [Google Scholar] [CrossRef]
- Rotivit, L.; Jacobsen, D. Temperature increase and respiratory performance of macroinvertebrates with different tolerances to organic pollution. Limnologica 2013, 43, 510–515. [Google Scholar] [CrossRef]
- Cheng, S.-Y.; Liu, C.; Han, L.-H.; Li, Y.; Wang, Z.; Tian, C. Characteristics and Source Apportionment of Organic Carbon and Elemental Carbon in PM2.5 During the Heating Season in Beijing. J. Beijing Univ. Technol. 2014, 40, 586–591. (In Chinese) [Google Scholar]
- Tan, J.; Duan, J.; He, K.; Ma, Y.; Duan, F.; Chen, Y.; Fu, J. Chemical characteristics of PM2.5 during a typical haze episode in Guangzhou. J. Environ. Sci. 2009, 21, 774–781. [Google Scholar] [CrossRef]
- Zhang, C.; Lu, X.; Zhai, J.; Chen, H.; Yang, X.; Zhang, Q.; Zhao, Q.; Fu, Q.; Sha, F.; Jin, J. Insights into the formation of secondary organic carbon in the summertime in urban Shanghai. J. Environ. Sci. 2018, 72, 118–132. [Google Scholar] [CrossRef]
- Zhang, Q.; Sarkar, S.; Wang, X.; Zhang, J.; Mao, J.; Yang, L.; Shi, Y.; Jia, S. Evaluation of factors influencing secondary organic carbon (SOC) estimation by CO and EC tracer methods. Sci. Total Environ. 2019, 686, 915–930. [Google Scholar] [CrossRef] [PubMed]
- Cusack, M.; Perez, N.; Pey, J.; Alastuey, A.; Querol, X. Source apportionment of fine PM and sub-micron particle number concentrations at a regional background site in the western Mediterranean: A 2.5 year study. Atmos. Chem. Phys. Discuss. 2013, 13, 5173–5187. [Google Scholar] [CrossRef]
- Song, Y.; Xie, S.; Zhang, Y.; Zeng, L.; Salmon, L.G.; Zheng, M. Source apportionment of PM2.5 in Beijing using principal component analysis/absolute principal component scores and UNMIX. Sci. Total Environ. 2006, 372, 278–286. [Google Scholar] [CrossRef] [PubMed]
- Morera-Gómez, Y.; Elustondo, D.; Lasheras, E.; Alonso-Hernández, C.M.; Santamaría, J.M. Chemical characterization of PM10 samples collected simultaneously at a rural and an urban site in the Caribbean coast: Local and long-range source apportionment. Atmos. Environ. 2018, 192, 182–192. [Google Scholar] [CrossRef]
- Qiu, X.; Duan, L.; Gao, J.; Wang, S.; Chai, F.; Hu, J.; Zhang, J.; Yun, Y. Chemical composition and source apportionment of PM10 and PM2.5 in different functional areas of Lanzhou, China. J. Environ. Sci. 2016, 40, 75–83. [Google Scholar] [CrossRef]
- Jiang, N.; Yin, S.; Guo, Y.; Li, J.; Kang, P.; Zhang, R.; Tang, X. Characteristics of mass concentration, chemical composition, source apportionment of PM2.5 and PM10 and health risk assessment in the emerging megacity in China. Atmos. Pollut. Res. 2018, 9, 309–321. [Google Scholar] [CrossRef]
- Maenhaut, W.; Karnieli, A.; Andreae, M.O. Ten-year study of fine aerosol at Sde Boker, Israel, using PIXE: Time trends, seasonal variation, correlations, and source areas for anthropogenic elements. Nucl. Instrum. Methods Phys. Res. 2014, 318, 119–124. [Google Scholar] [CrossRef]
- Li, X.; Wang, L.; Ji, D.; Wen, T.; Pan, Y.; Sun, Y.; Wang, Y. Characterization of the size-segregated water-soluble inorganic ions in the Jing-Jin-Ji urban agglomeration: Spatial/temporal variability, size distribution and sources. Atmos. Environ. 2013, 77, 250–259. [Google Scholar] [CrossRef]


| Ion | Wenshan | Kunming [30] | Guiyang [40] | Beijing [41] | Nanjing [42] |
|---|---|---|---|---|---|
| K+ | 0.63 ± 0.24 | 0.77 | 0.41 | 1.90 | 1.2 |
| Ca2+ | 1.04 ± 0.5 | 2.83 | 1.77 | 3.92 | 0.7 |
| Mg2+ | 0.07 ± 0.02 | 0.30 | 0.20 | 0.76 | 0.2 |
| NH4+ | 2.81 ± 1.16 | 0.52 | 4.29 | 12.47 | 4.5 |
| Cl− | 0.31 ± 0.19 | 0.72 | 1.30 | 6.76 | 1.9 |
| F− | 0.19 ± 0.07 | 0.54 | 0.03 | - | 0.2 |
| SO42− | 5.98 ± 2.07 | 9.72 | 17.43 | 21.60 | 5.1 |
| NO3− | 1.00 ± 0.40 | 0.51 | 1.34 | 20.552 | 9.1 |
| Spring | Autumn | ||||||||||
|---|---|---|---|---|---|---|---|---|---|---|---|
| Element | F1 | F2 | F3 | F4 | F5 | F6 | F1 | F2 | F3 | F4 | F5 |
| Li | 0.52 | 0.86 | |||||||||
| Na | 0.80 | 0.52 | |||||||||
| K | 0.56 | 0.83 | |||||||||
| Mn | 0.93 | 0.94 | |||||||||
| Cu | 0.77 | 0.76 | |||||||||
| Zn | 0.71 | 0.88 | |||||||||
| Pb | 0.94 | 0.96 | |||||||||
| Al | 0.62 | 0.68 | |||||||||
| Mg | 0.91 | 0.79 | |||||||||
| Ca | 0.64 | 0.55 | 0.56 | ||||||||
| Ba | 0.95 | ||||||||||
| Fe | 0.56 | 0.55 | 0.82 | ||||||||
| Si | 0.93 | 0.78 | |||||||||
| Ti | 0.62 | 0.76 | |||||||||
| NH4+ | 0.90 | 0.90 | |||||||||
| NO3− | 0.87 | 0.92 | |||||||||
| SO42− | 0.90 | 0.83 | |||||||||
| OC | 0.82 | 0.74 | |||||||||
| EC | 0.70 | 0.65 | |||||||||
| Eigenvalue | 3.40 | 3.09 | 2.69 | 2.19 | 2.06 | 1.82 | 5.59 | 3.56 | 2.34 | 1.77 | 1.69 |
| Variance contribution % | 18.15 | 16.28 | 14.15 | 11.55 | 10.83 | 9.58 | 29.40 | 18.73 | 12.33 | 9.30 | 8.91 |
Publisher’s Note: MDPI stays neutral with regard to jurisdictional claims in published maps and institutional affiliations. |
© 2021 by the authors. Licensee MDPI, Basel, Switzerland. This article is an open access article distributed under the terms and conditions of the Creative Commons Attribution (CC BY) license (https://creativecommons.org/licenses/by/4.0/).
Share and Cite
Shi, J.; Feng, Y.; Ren, L.; Lu, X.; Zhong, Y.; Han, X.; Ning, P. Mass Concentration, Chemical Composition, and Source Characteristics of PM2.5 in a Plateau Slope City in Southwest China. Atmosphere 2021, 12, 611. https://doi.org/10.3390/atmos12050611
Shi J, Feng Y, Ren L, Lu X, Zhong Y, Han X, Ning P. Mass Concentration, Chemical Composition, and Source Characteristics of PM2.5 in a Plateau Slope City in Southwest China. Atmosphere. 2021; 12(5):611. https://doi.org/10.3390/atmos12050611
Chicago/Turabian StyleShi, Jianwu, Yinchuan Feng, Liang Ren, Xiuqing Lu, Yaoqian Zhong, Xinyu Han, and Ping Ning. 2021. "Mass Concentration, Chemical Composition, and Source Characteristics of PM2.5 in a Plateau Slope City in Southwest China" Atmosphere 12, no. 5: 611. https://doi.org/10.3390/atmos12050611
APA StyleShi, J., Feng, Y., Ren, L., Lu, X., Zhong, Y., Han, X., & Ning, P. (2021). Mass Concentration, Chemical Composition, and Source Characteristics of PM2.5 in a Plateau Slope City in Southwest China. Atmosphere, 12(5), 611. https://doi.org/10.3390/atmos12050611