
Temperature of Paved Streets in Urban Mockups and Its Implication of Reflective Cool Pavements


Abstract
1. Introduction
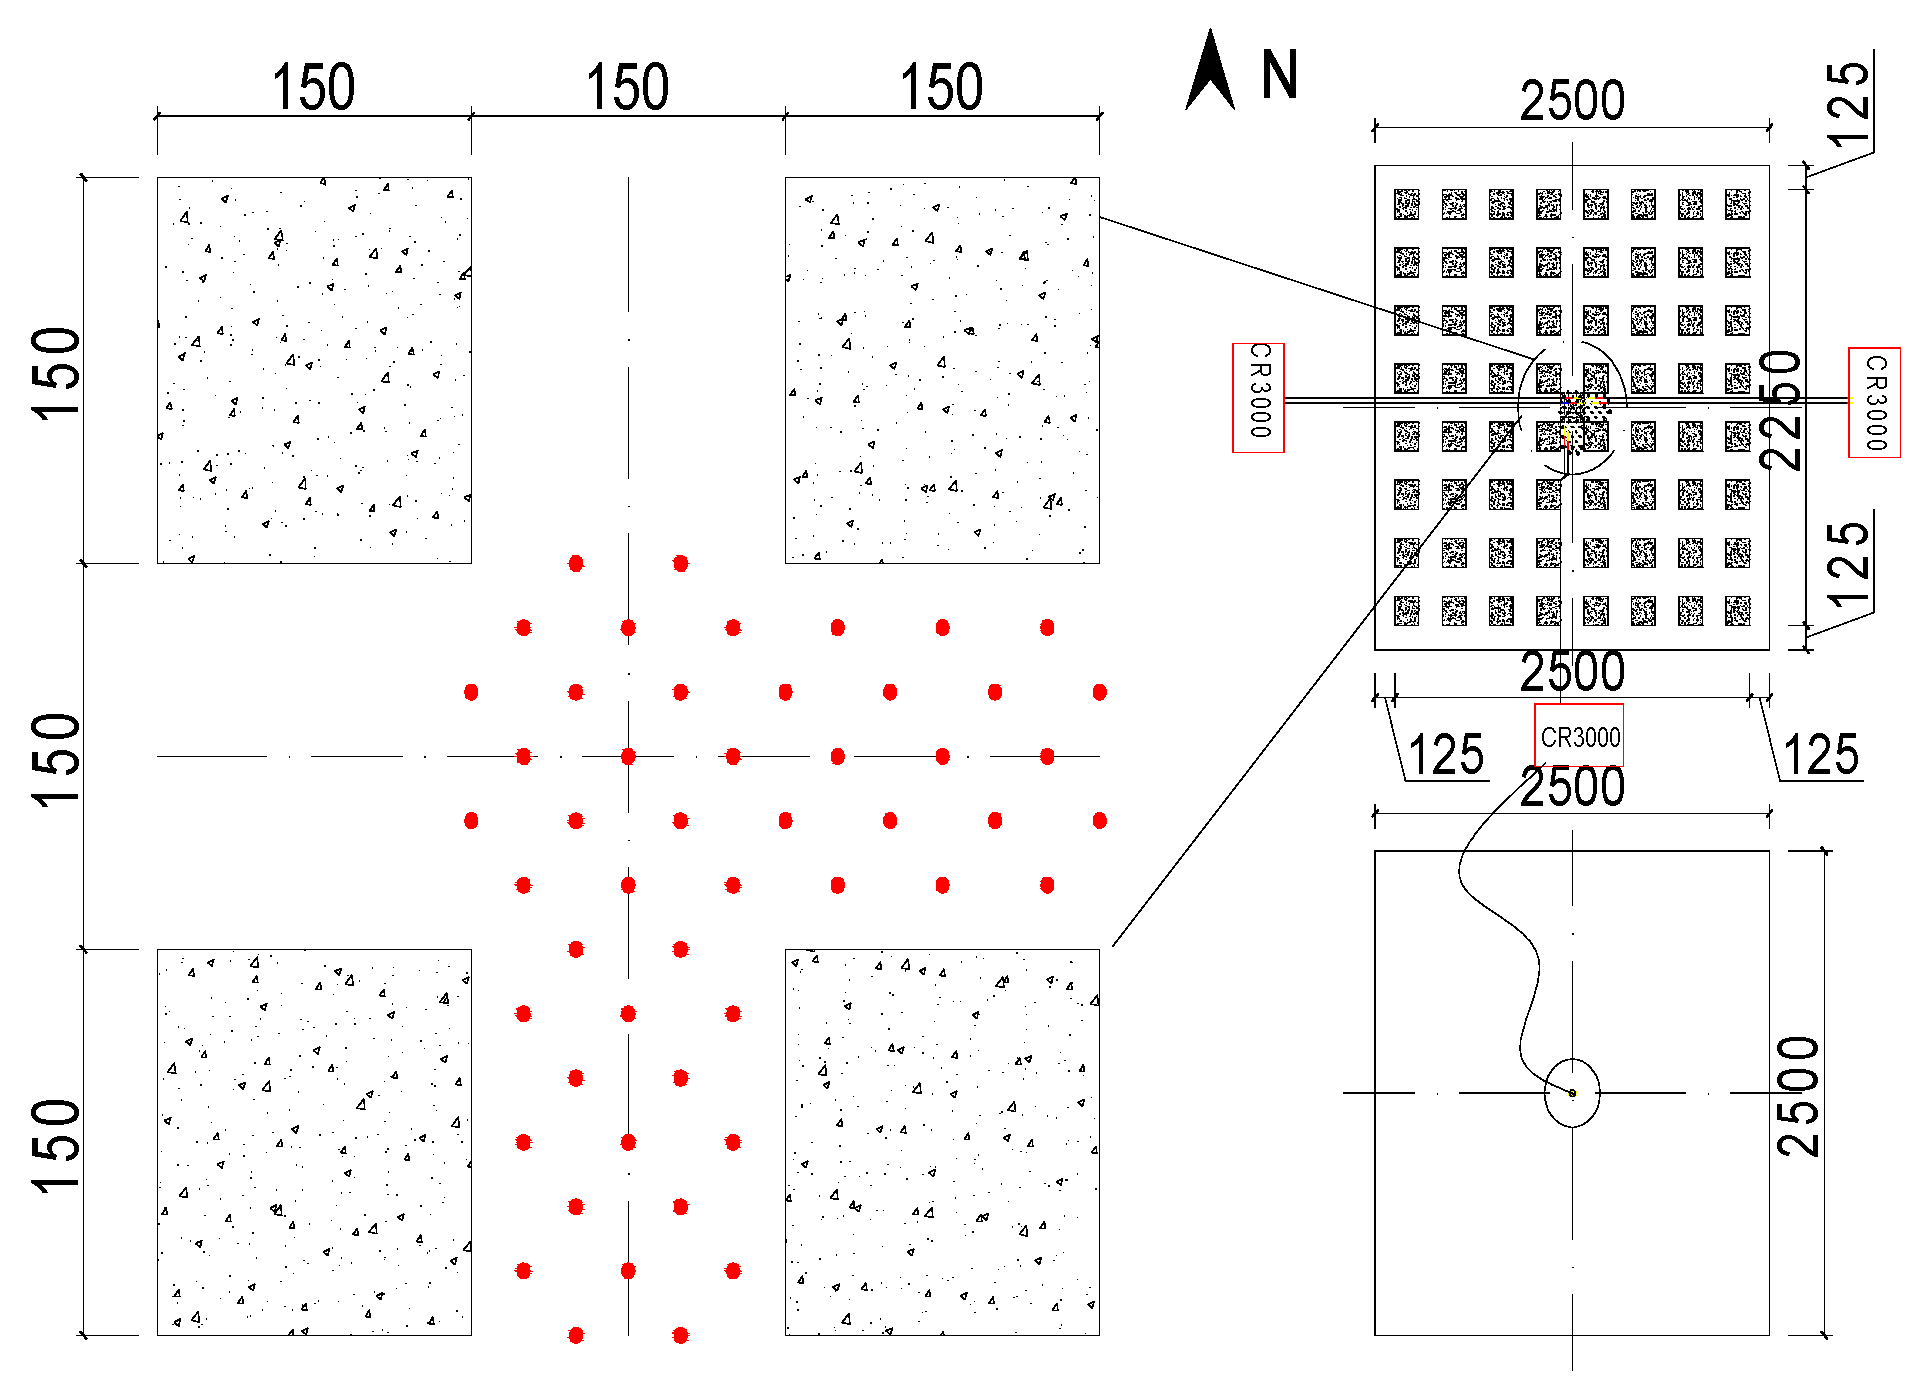
2. Experiments
3. Results
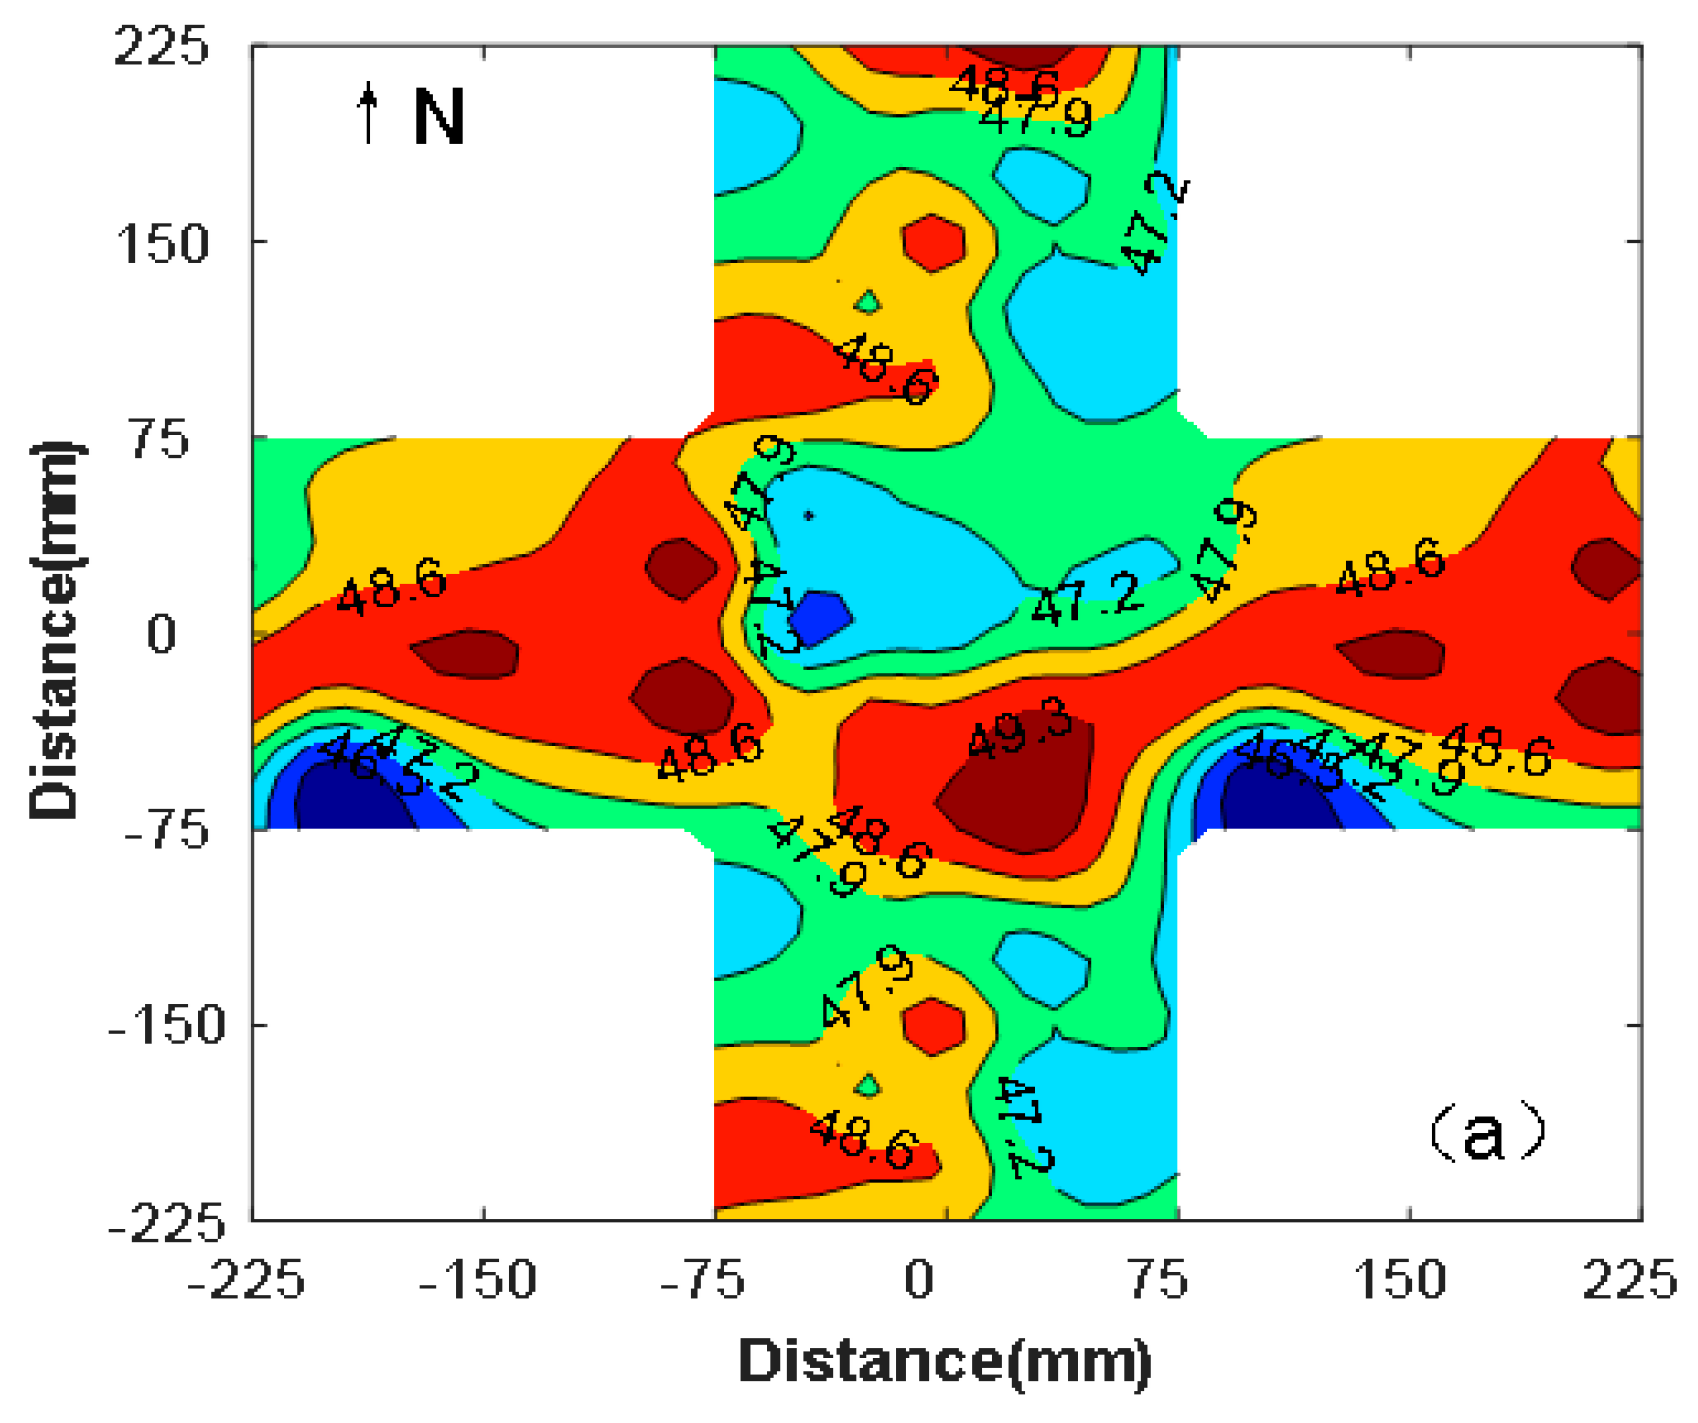
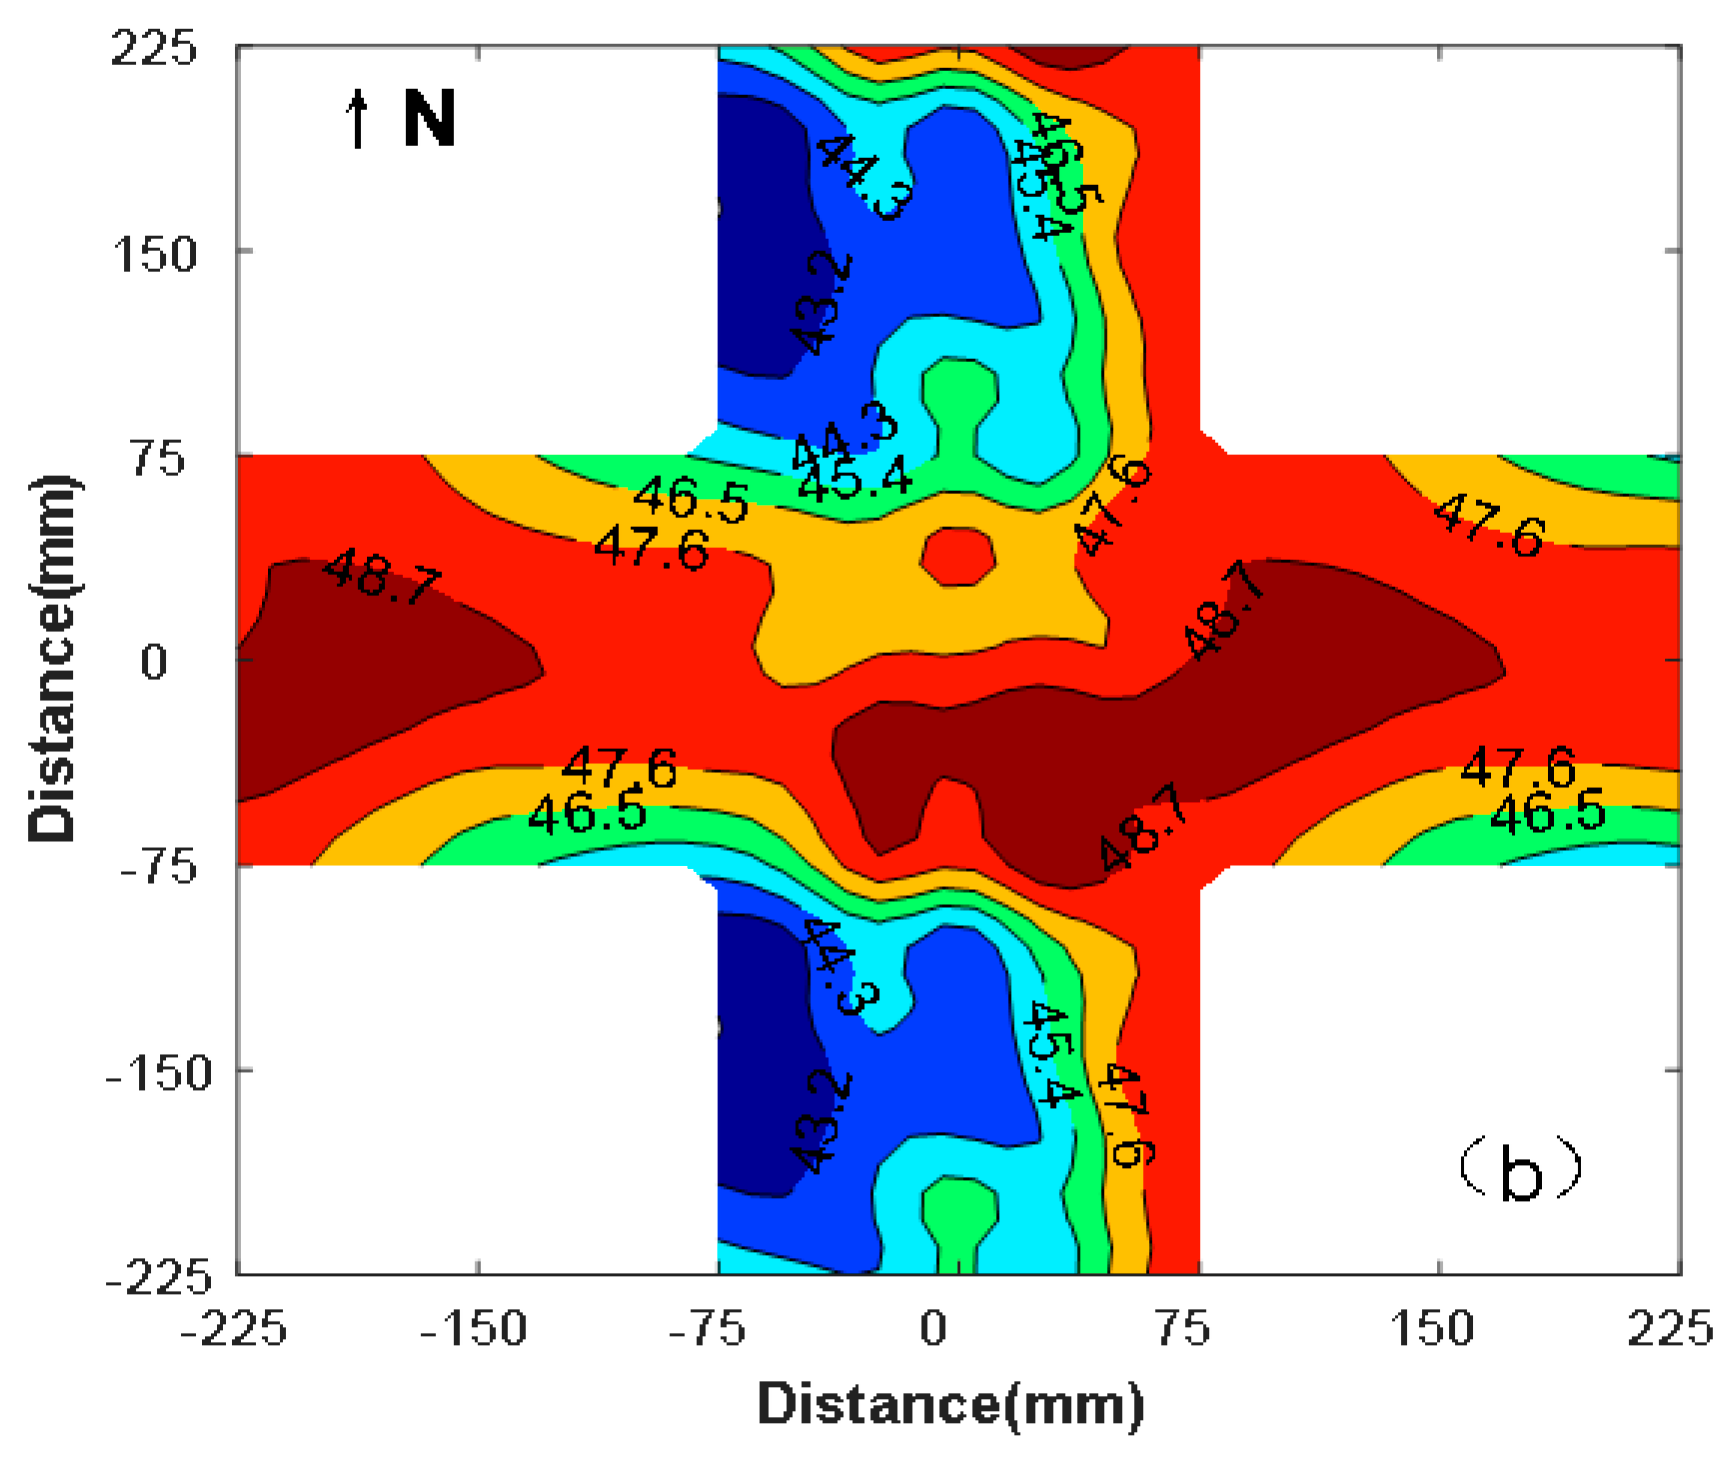
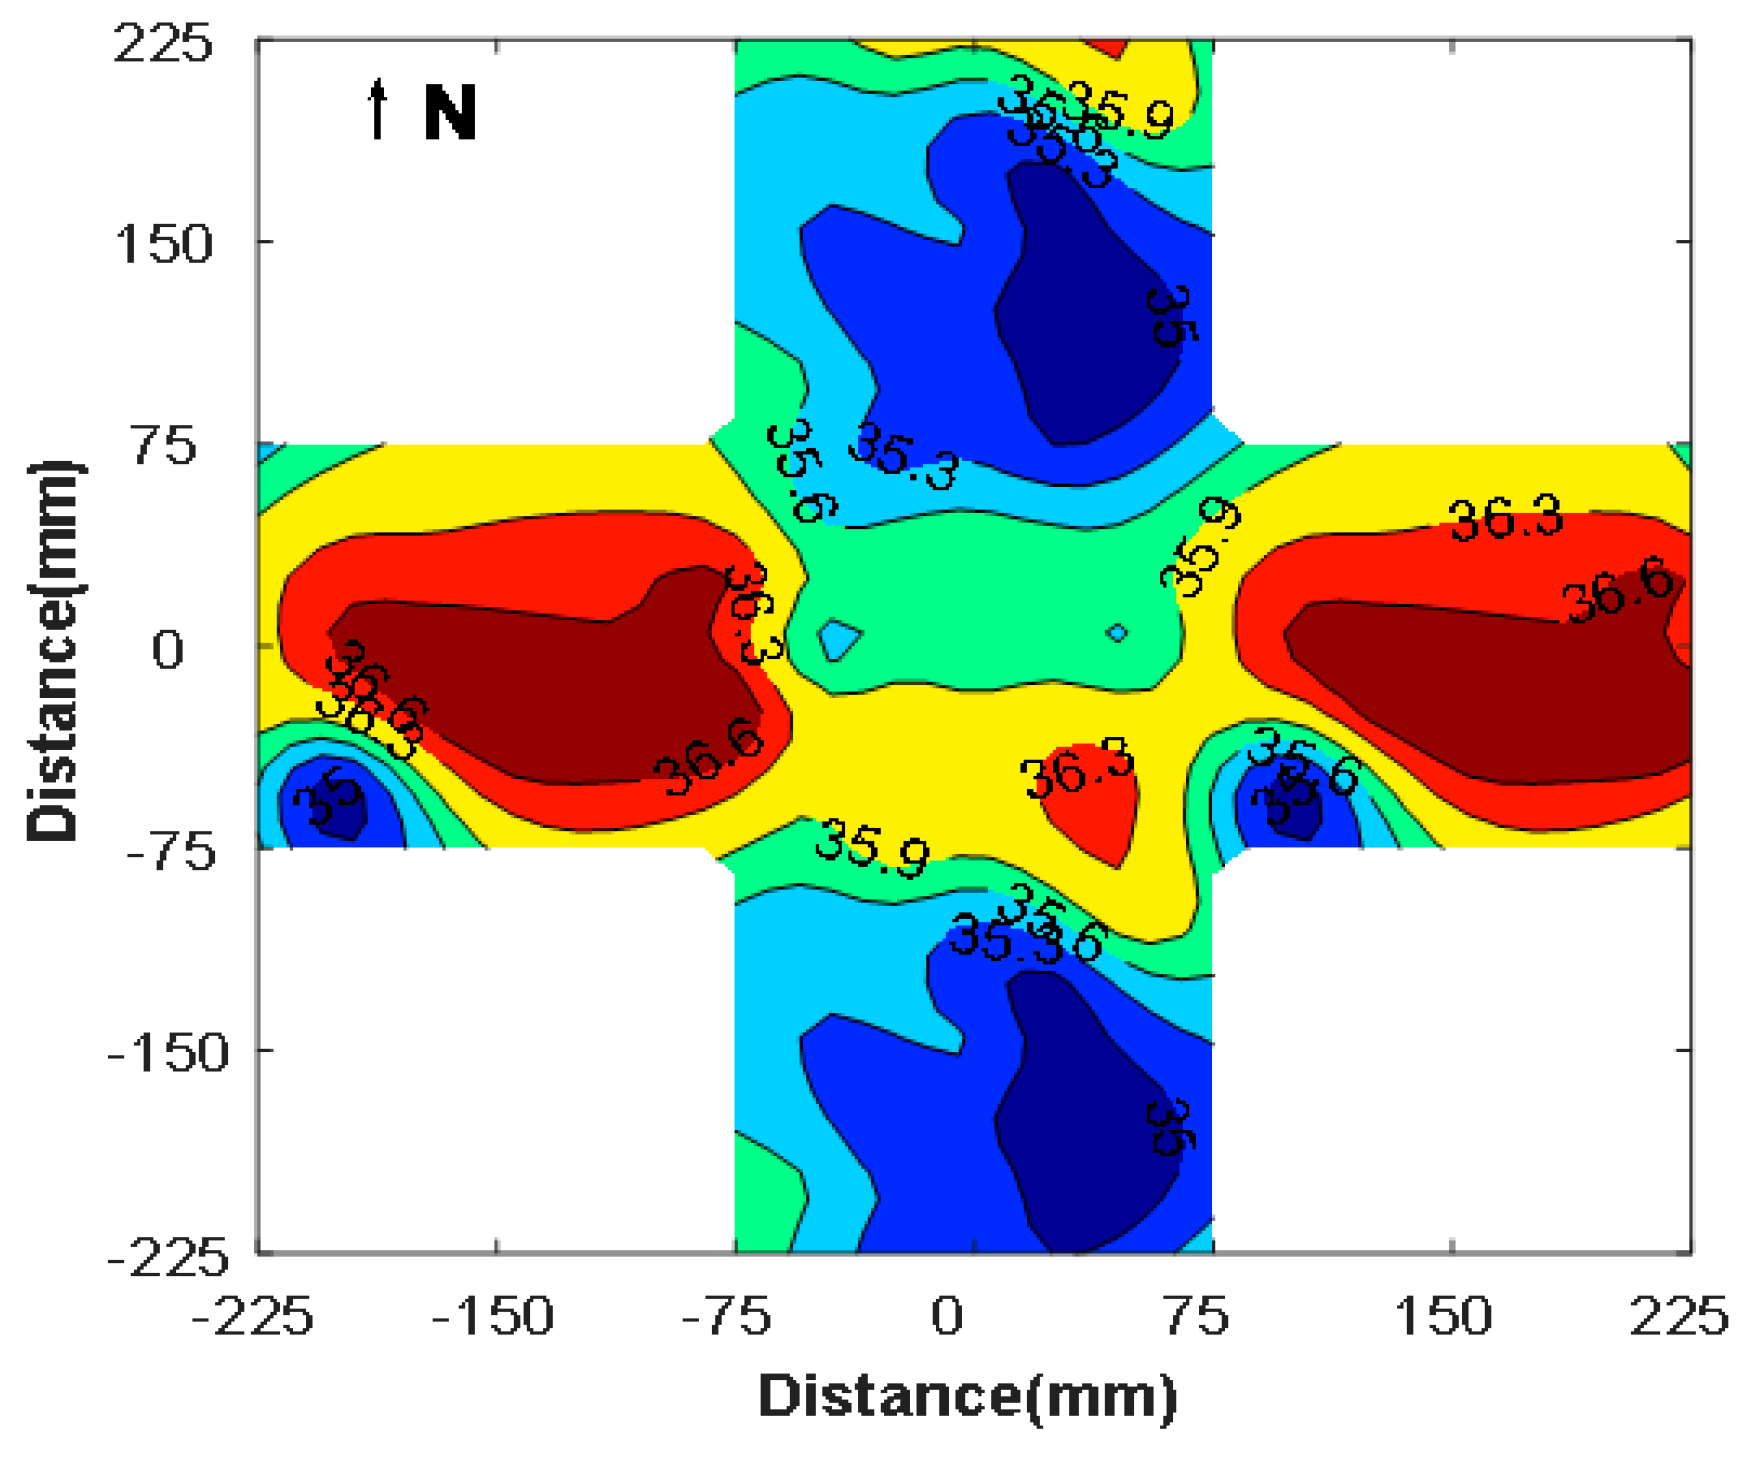
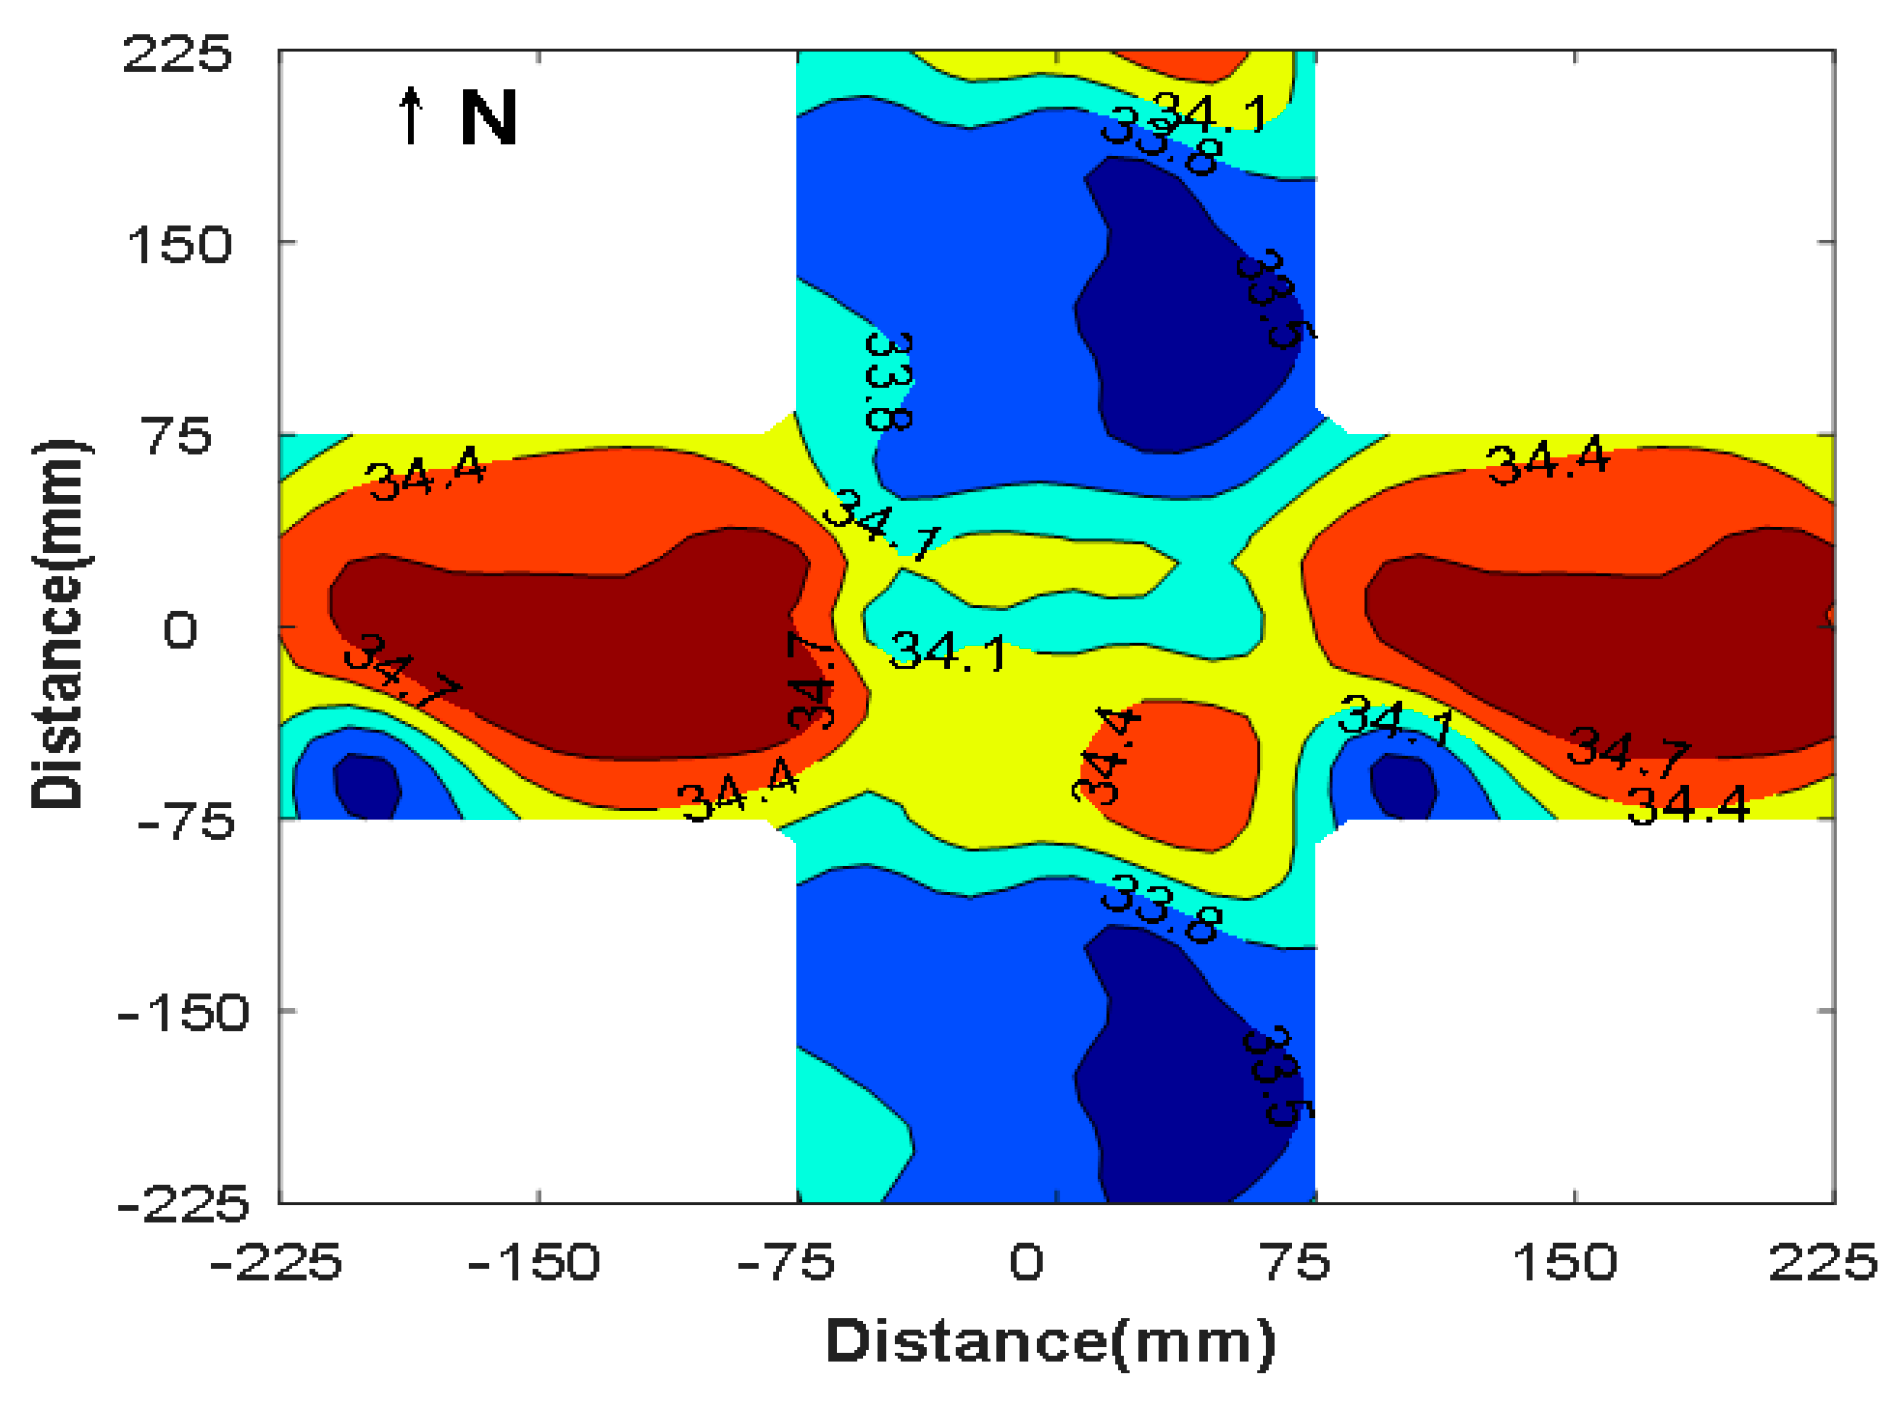
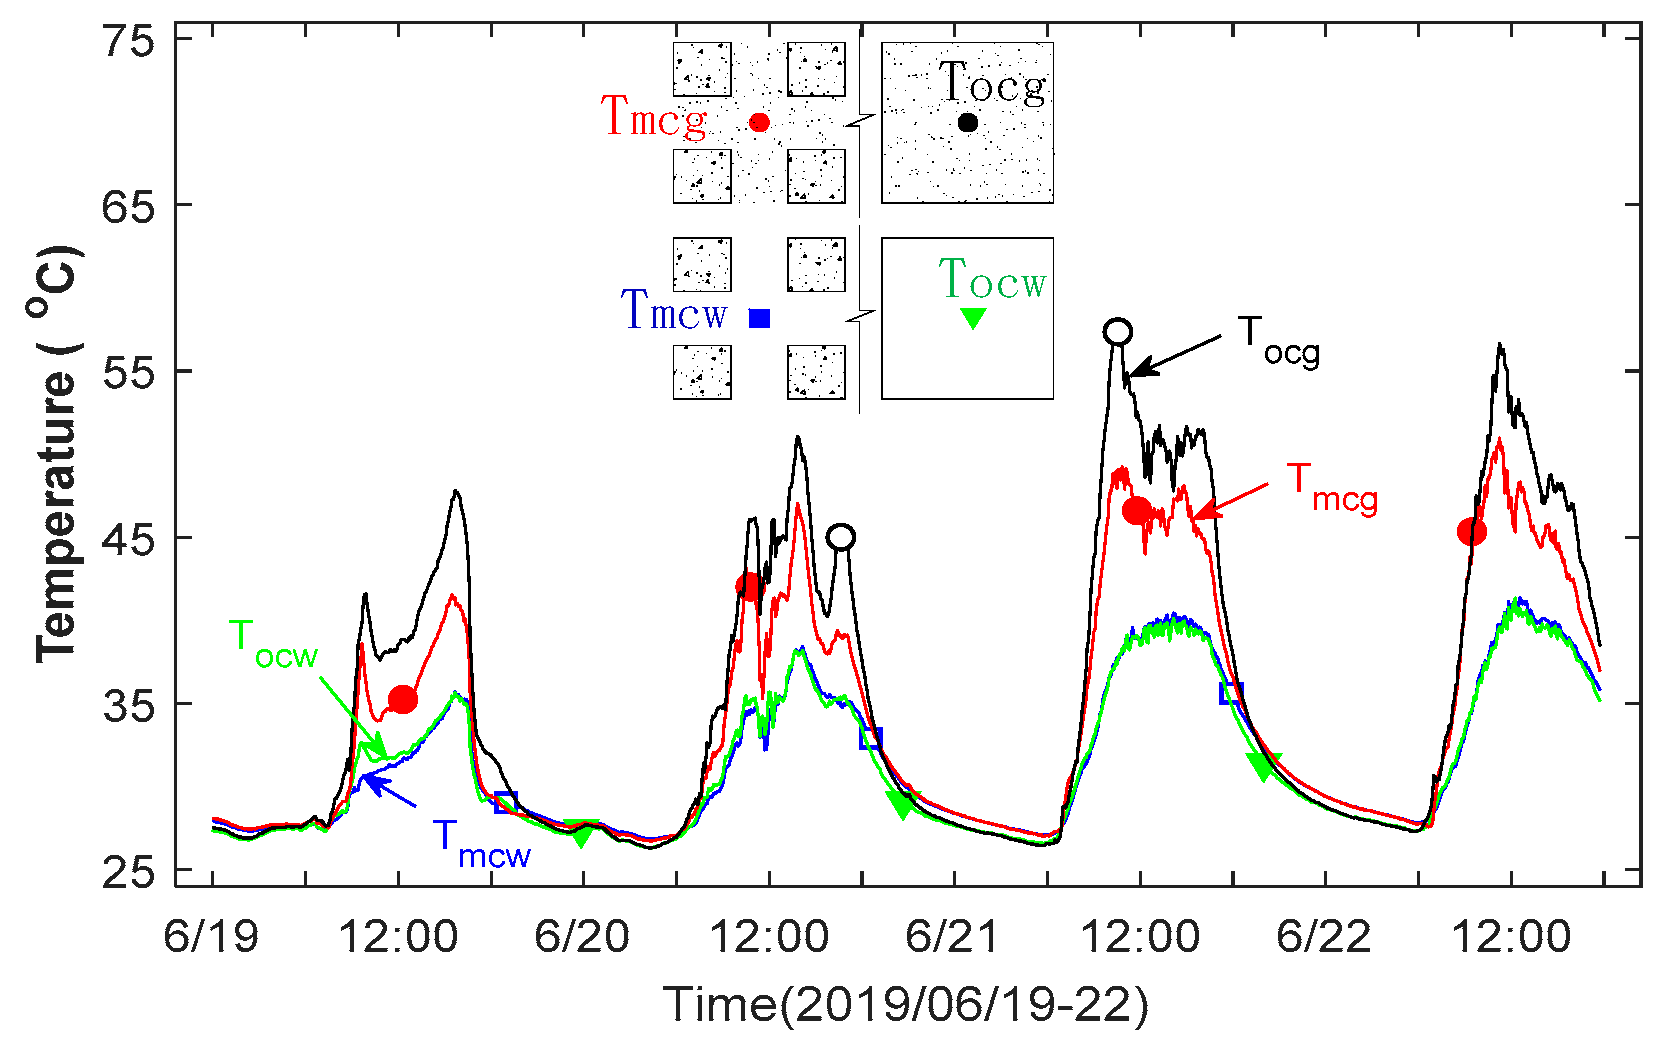
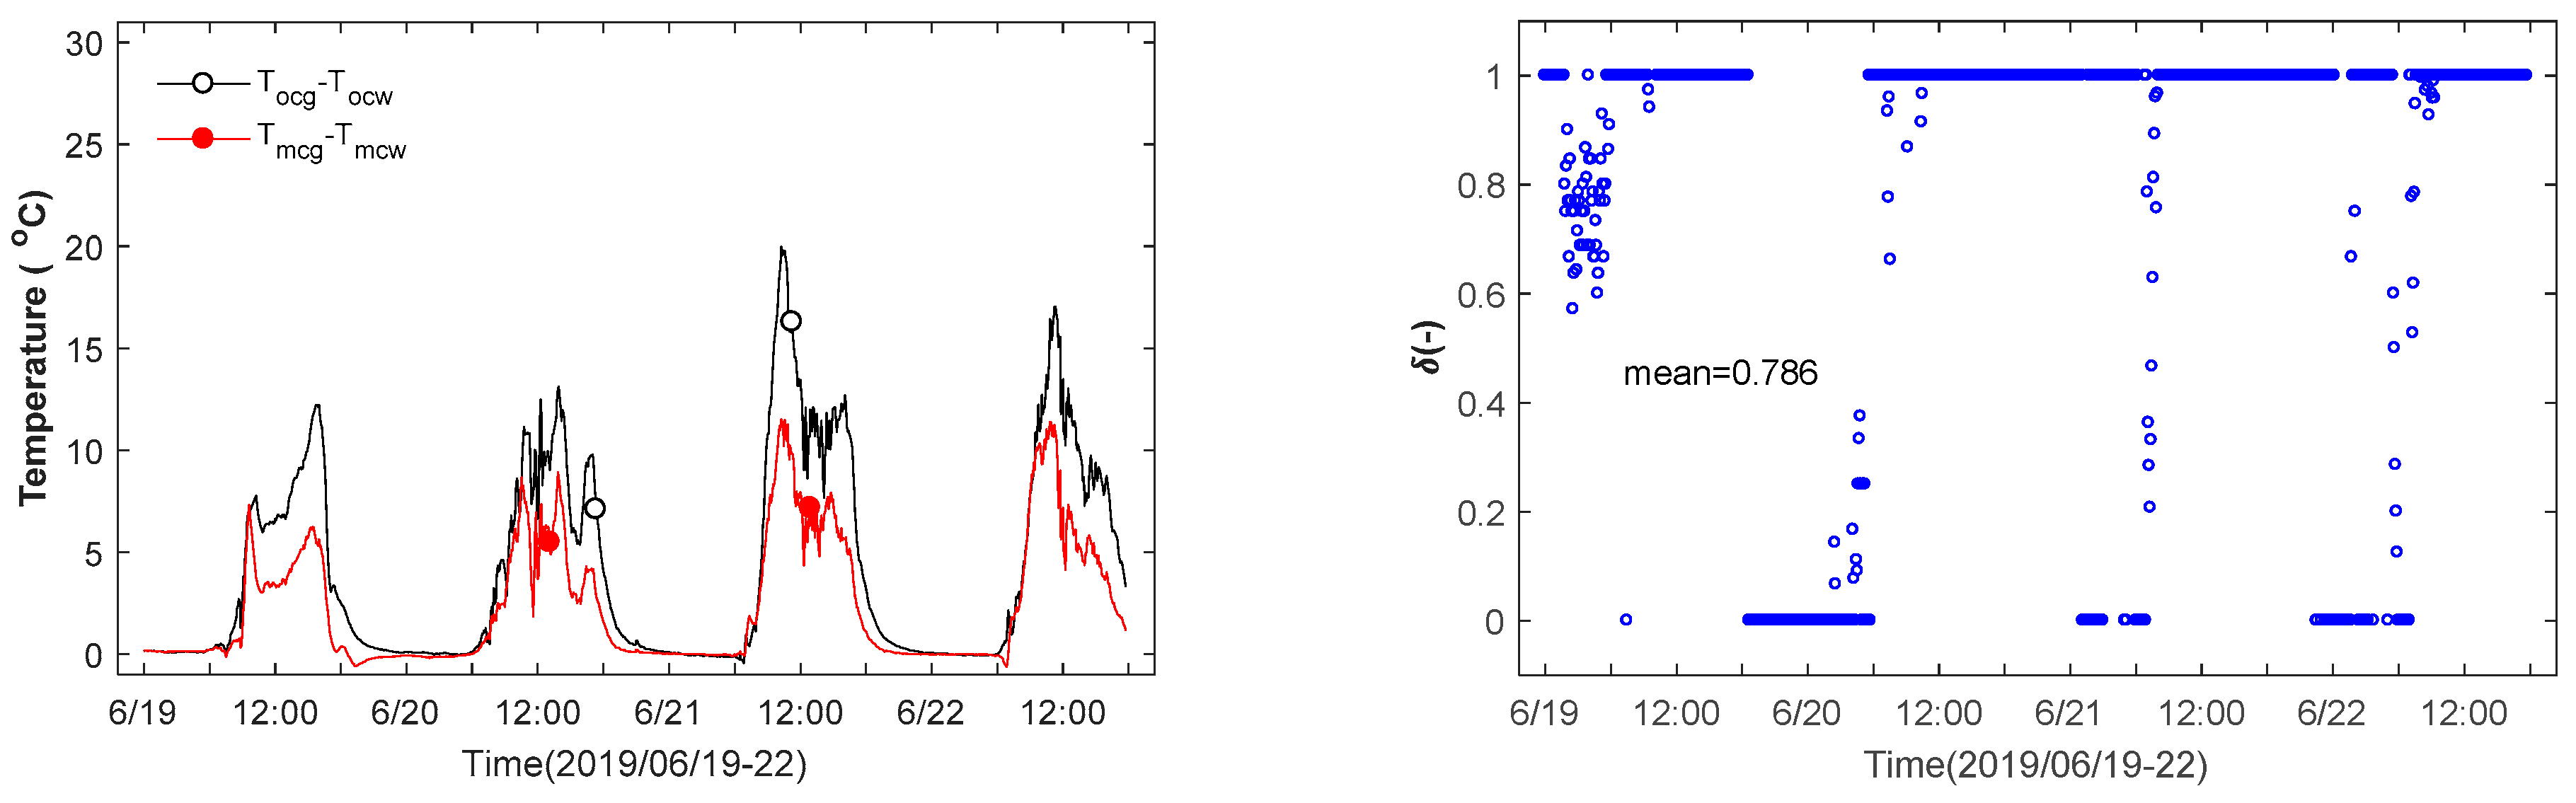
3.1. Skin Temperatures of an Urban Street
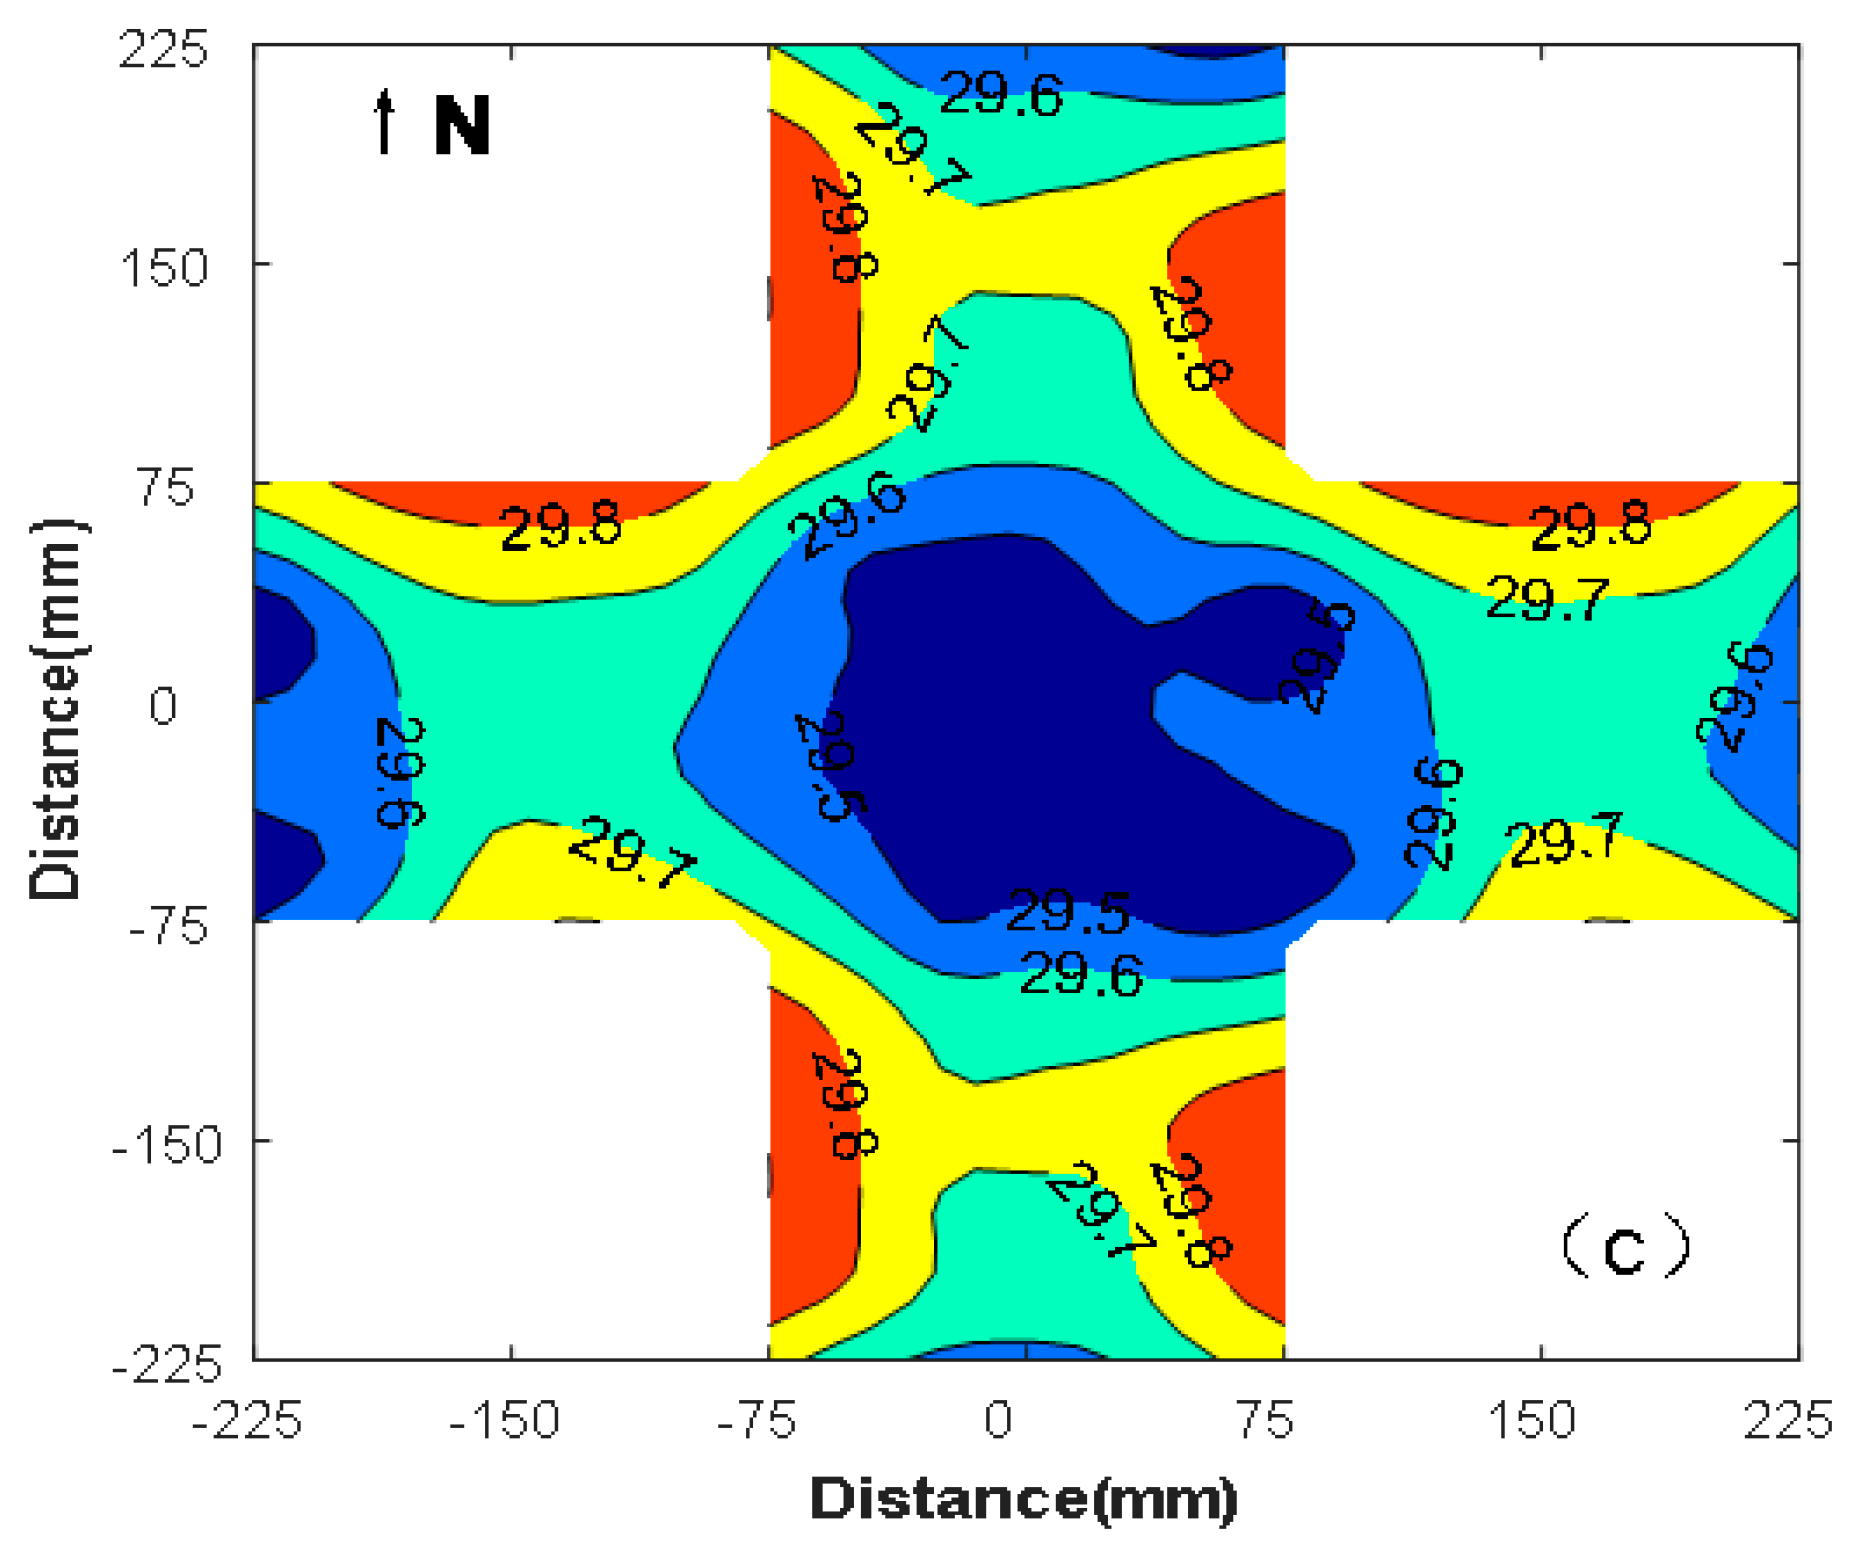
3.2. Reducing Skin Temperature by Increasing the Street Albedo
4. Discussion
5. Conclusions
Author Contributions
Funding
Institutional Review Board Statement
Informed Consent Statement
Data Availability Statement
Acknowledgments
Conflicts of Interest
Appendix A

References
- Qin, Y. Urban canyon albedo and its implication on the use of reflective cool pavements. Energy Build. 2015, 96, 86–94. [Google Scholar] [CrossRef]
- Aida, M. Urban albedo as a function of the urban structure—A model experiment. Bound. Layer Meteorol. 1982, 23, 405–413. [Google Scholar] [CrossRef]
- Chen, J.; Wang, H.; Zhu, H. Analytical approach for evaluating temperature field of thermal modified asphalt pavement and urban heat island effect. Appl. Therm. Eng. 2017, 113, 739–748. [Google Scholar] [CrossRef]
- Panão, M.N.O.; Gonçalves, H.P.; Ferrão, P.C. A matrix approach coupled with Monte Carlo techniques for solving the net radiative balance of the urban block. Bound. Layer Meteorol. 2007, 122, 217–241. [Google Scholar] [CrossRef]
- Santillán-Soto, N.; Garcia-Cueto, R.; Haro-Rincon, Z.; Ojeda-Benitez, S.; Quintero-Nunez, M.; Velazquez-Limon, N. Radiation balance of urban materials and their thermal impact in semi-desert region: Mexicali, México study case. Atmosphere 2015, 6, 1578–1589. [Google Scholar] [CrossRef]
- Parker, J. The Leeds urban heat island and its implications for energy use and thermal comfort. Energy Build. 2021, 235, 110636. [Google Scholar] [CrossRef]
- Sharma, R.; Pradhan, L.; Kumari, M.; Bhattacharya, P. Assessing urban heat islands and thermal comfort in Noida City using geospatial technology. Urban Clim. 2021, 35, 100751. [Google Scholar] [CrossRef]
- He, B.-J.; Wang, J.; Liu, H.; Ulpiani, G. Localized synergies between heat waves and urban heat islands: Implications on human thermal comfort and urban heat management. Environ. Res. 2021, 193, 110584. [Google Scholar] [CrossRef]
- Qaid, A.; Lamit, H.B.; Ossen, D.R.; Shahminan, R.N.R. Urban heat island and thermal comfort conditions at micro-climate scale in a tropical planned city. Energy Build. 2016, 133, 577–595. [Google Scholar] [CrossRef]
- Fahed, J.; Kinab, E.; Ginestet, S.; Adolphe, L. Impact of urban heat island mitigation measures on microclimate and pedestrian comfort in a dense urban district of Lebanon. Sustain. Cities Soc. 2020, 61, 102375. [Google Scholar] [CrossRef]
- Ballinas, M.; Barradas, V.L. The Urban Tree as a tool to mitigate the urban heat island in Mexico City: A simple phenomenological model. J. Environ. Qual. 2016, 45, 157–166. [Google Scholar] [CrossRef]
- Nichol, J.; Wong, M.S. Modeling urban environmental quality in a tropical city. Landsc. Urban Plan. 2005, 73, 49–58. [Google Scholar] [CrossRef]
- Henao, J.J.; Rendón, A.M.; Salazar, J.F. Trade-off between urban heat island mitigation and air quality in urban valleys. Urban Clim. 2020, 31, 100542. [Google Scholar] [CrossRef]
- Yuan, J.; Farnham, C.; Emura, K. Inter-building effect and its relation with highly reflective envelopes on building energy use: Case study for cities of Japan. Atmosphere 2017, 8, 211. [Google Scholar] [CrossRef]
- Kubilay, A.; Allegrini, J.; Strebel, D.; Zhao, Y.; Derome, D.; Carmeliet, J. Advancement in urban climate modelling at local scale: Urban heat island mitigation and building cooling demand. Atmosphere 2020, 11, 1313. [Google Scholar] [CrossRef]
- Shahmohamadi, P.; Che-Ani, A.I.; Etessam, I.; Maulud, K.N.A.; Tawil, N.M. Healthy environment: The need to mitigate urban heat island effects on human health. Procedia Eng. 2011, 20, 61–70. [Google Scholar] [CrossRef]
- Heaviside, C.; Macintyre, H.; Vardoulakis, S. The urban heat island: Implications for health in a changing environment. Curr. Environ. Health Rep. 2017, 4, 296–305. [Google Scholar] [CrossRef]
- Dong, W.; Liu, Z.; Zhang, L.; Tang, Q.; Liao, H.; Li, X. Assessing heat health risk for sustainability in Beijing’s urban heat island. Sustainability 2014, 6, 7334–7357. [Google Scholar] [CrossRef]
- Wang, J.; Meng, Q.; Zhang, L.; Zhang, Y.; He, B.-J.; Zheng, S.; Santamouris, M. Impacts of the water absorption capability on the evaporative cooling effect of pervious paving materials. Build. Environ. 2019, 151, 187–197. [Google Scholar] [CrossRef]
- Bao, T.; Liu, Z.; Zhang, X.; He, Y. A drainable water-retaining paver block for runoff reduction and evaporation cooling. J. Clean. Prod. 2019, 228, 418–424. [Google Scholar] [CrossRef]
- Li, H. Evaluation of Cool Pavement Strategies for Heat Island Mitigation; University of California: Davis, CA, USA, 2012; p. 387. [Google Scholar]
- Cao, X.; Tang, B.; Zhu, H.; Zhang, A. Cooling principle analyses and performance evaluation of heat-reflective coating for asphalt pavement. J. Mater. Civ. Eng. 2011, 23, 1067–1075. [Google Scholar] [CrossRef]
- Takebayashi, H.; Moriyama, M. Relationships between the properties of an urban street canyon and its radiant environment: Introduction of appropriate urban heat island mitigation technologies. Solar Energy 2012, 86, 2255–2262. [Google Scholar] [CrossRef]
- Touchaei, A.G.; Wang, Y. Characterizing urban heat island in Montreal (Canada)–Effect of urban morphology. Sustain. Cities Soc. 2015, 19, 395–402. [Google Scholar] [CrossRef]
- Qaid, A.; Ossen, D.R. Effect of asymmetrical street aspect ratios on microclimates in hot, humid regions. Int. J. Biometeorol. 2015, 59, 657–677. [Google Scholar] [CrossRef]
- Krüger, E.L.; Minella, F.O.; Rasia, F. Impact of urban geometry on outdoor thermal comfort and air quality from field measurements in Curitiba, Brazil. Build. Environ. 2011, 46, 621–634. [Google Scholar] [CrossRef]
- Bourbia, F.; Boucheriba, F. Impact of street design on urban microclimate for semi arid climate (Constantine). Renew. Energy 2010, 35, 343–347. [Google Scholar] [CrossRef]
- Sun, T.; Wang, Z.-H.; Ni, G.-H. Revisiting the hysteresis effect in surface energy budgets. Geophys. Res. Lett. 2013, 40, 1741–1747. [Google Scholar] [CrossRef]
- Abreu-Harbich, L.V.; Labaki, L.C.; Matzarakis, A. Thermal bioclimate in idealized urban street canyons in Campinas, Brazil. Theor. Appl. Climatol. 2014, 115, 333–340. [Google Scholar] [CrossRef]
- Achour-Younsi, S.; Kharrat, F. Outdoor thermal comfort: Impact of the geometry of an urban street Canyon in a Mediterranean subtropical climate—Case study Tunis, Tunisia. Procedia Soc. Behav. Sci. 2016, 216, 689–700. [Google Scholar] [CrossRef]
- Andreou, E. Thermal comfort in outdoor spaces and urban canyon microclimate. Renew. Energy 2013, 55, 182–188. [Google Scholar] [CrossRef]
- Ali-Toudert, F.; Mayer, H. Numerical study on the effects of aspect ratio and orientation of an urban street canyon on outdoor thermal comfort in hot and dry climate. Build. Environ. 2006, 41, 94–108. [Google Scholar] [CrossRef]
- Ketterer, C.; Matzarakis, A. Human-biometeorological assessment of heat stress reduction by replanning measures in Stuttgart, Germany. Landsc. Urban Plan. 2014, 122, 78–88. [Google Scholar] [CrossRef]
- Rodríguez Algeciras, J.A.; Gómez Consuegra, L.; Matzarakis, A. Spatial-temporal study on the effects of urban street configurations on human thermal comfort in the world heritage city of Camagüey-Cuba. Build. Environ. 2016, 101, 85–101. [Google Scholar] [CrossRef]
- Taleghani, M.; Kleerokoper, L.; Tenpierik, M.; van den Dobbelsteen, A. Outdoor thermal comfort within five different urban forms in The Netherlands. Build. Environ. 2015, 83, 65–78. [Google Scholar] [CrossRef]
- Herrmann, J.; Matzarakis, A. Mean radiant temperature in idealised urban canyons–Examples from Freiburg, Germany. Int. J. Biometeorol. 2012, 56, 199–203. [Google Scholar] [CrossRef]
- Rohinton, E.; Erik, J. Influence of urban morphology and sea breeze on hot humid microclimate: The case of Colombo, Sri Lanka. Clim. Res. 2006, 30, 189–200. [Google Scholar]
- Yuan, J.; Emura, K.; Farnham, C. Is urban albedo or urban green covering more effective for urban microclimate improvement?: A simulation for Osaka. Sustain. Cities Soc. 2017, 32, 78–86. [Google Scholar] [CrossRef]
- Salata, F.; Golasi, I.; de Lieto Vollaro, A.; de Lieto Vollaro, R. How high albedo and traditional buildings’ materials and vegetation affect the quality of urban microclimate. A case study. Energy Build. 2015, 99, 32–49. [Google Scholar] [CrossRef]
- Watanabe, S.; Ishii, J. Effect of outdoor thermal environment on pedestrians’ behavior selecting a shaded area in a humid subtropical region. Build. Environ. 2016, 95, 32–41. [Google Scholar] [CrossRef]
- Yang, F.; Lau, S.S.Y.; Qian, F. Urban design to lower summertime outdoor temperatures: An empirical study on high-rise housing in Shanghai. Build. Environ. 2011, 46, 769–785. [Google Scholar] [CrossRef]
- Martinelli, L.; Lin, T.-P.; Matzarakis, A. Assessment of the influence of daily shadings pattern on human thermal comfort and attendance in Rome during summer period. Build. Environ. 2015, 92, 30–38. [Google Scholar] [CrossRef]


| Reference and Location | Results |
|---|---|
| [34] Camaguey, Caba | Thermal comfort of a street is dictated by aspect ratio and street orientation; South-North streets provide better thermal comfort than East-West ones. |
| [35] De Bilt, Netherlands | Urban form determines duration of direct sun and mean radiant temperature, with the hottest situation on the East-West street. |
| [33] Stuttgart, Germany | The sky view factor of urban streets in the Northern hemisphere is decisive to the heat stress of the urban canyon. A street canyon with an H/W-ratio of at least 1.5 seems to be the best option to reduce heat stress. |
| [29] Campinas, Brazil | An H/W ratio up to 2 increases shade and improves thermal comfort during the daytime more than other ratios. Forestry management and green areas increase the shade on façades and pedestrian routes and enhance the microclimate, particularly for H/W less than 0.5. |
| [42] Rome, Italy | Shaded areas are directly correlated to thermal comfort values, which are depicted by the physiologically equivalent temperature. |
| [30] Tunis, Tunisia | For all configurations, a South-North street exhibits the best thermal comfort, while the thermal comfort of an East-West street is the worst. |
| [31] Island of Tinos, Greece | South-North streets exhibit good thermal comfort in cases of H/W < 1.3, but in case of H/W > 2.0 show similar thermal conditions to other streets. |
| [36] Freiburg, Germany | North–South and East-West streets are the two extrema, with the highest mean radiant temperature for North–South and the lowest values for East-West. |
| [37] Colombo, Sri Lanka | The temperature differences between sunlit and shaded urban surfaces reached 20 °C, highlighting shade as the main strategy for lowering air and radiant temperatures. |
| [25] Putrajaya Boulevard, Malaysia | The sky view factor of an urban street is not the decisive factor influencing urban canyon microclimates or heat islands, unless the orientation of the urban street is considered. |
| [26] Curitiba, Brazil | The sky view factor correlates strongly to the nocturnal heat island but weakly to the daytime temperature, which is dominated by solar irradiance. |
| [32] Ghardaia, Algeria | South-North streets cause less heat stress in its duration and intensity, whereas East-West streets are thermally uncomfortable for a much longer time. |
| [38] Osaka, Japan | Increasing the urban green covering around a city up to 40% improves the urban microclimate, but further increments are compromised of the air convection. |
| [41] Shanghai, China | At daytime the shading factor overwhelms the green ratio and surface albedo; at nighttime, anthropogenic heat and sky view factors control thermal comfort. |
| [23] Osaka, Japan | Aspect ratio W/H dominates daily net solar-irradiance gains on roads. Reflective cool pavements should be considered on the North sides of East-West streets and at the centers of North–South streets. |
| [27] Constantine, Algeria | H/W ratio and the sky view factor are decisive factors for the observed air temperature in urban areas. |
Publisher’s Note: MDPI stays neutral with regard to jurisdictional claims in published maps and institutional affiliations. |
© 2021 by the authors. Licensee MDPI, Basel, Switzerland. This article is an open access article distributed under the terms and conditions of the Creative Commons Attribution (CC BY) license (https://creativecommons.org/licenses/by/4.0/).
Share and Cite
Zhang, Y.; Wei, P.; Wang, L.; Qin, Y. Temperature of Paved Streets in Urban Mockups and Its Implication of Reflective Cool Pavements. Atmosphere 2021, 12, 560. https://doi.org/10.3390/atmos12050560
Zhang Y, Wei P, Wang L, Qin Y. Temperature of Paved Streets in Urban Mockups and Its Implication of Reflective Cool Pavements. Atmosphere. 2021; 12(5):560. https://doi.org/10.3390/atmos12050560
Chicago/Turabian StyleZhang, Yi, Peiyuan Wei, Lei Wang, and Yinghong Qin. 2021. "Temperature of Paved Streets in Urban Mockups and Its Implication of Reflective Cool Pavements" Atmosphere 12, no. 5: 560. https://doi.org/10.3390/atmos12050560
APA StyleZhang, Y., Wei, P., Wang, L., & Qin, Y. (2021). Temperature of Paved Streets in Urban Mockups and Its Implication of Reflective Cool Pavements. Atmosphere, 12(5), 560. https://doi.org/10.3390/atmos12050560