Article

Effect of Urban Heat Island and Global Warming Countermeasures on Heat Release and Carbon Dioxide Emissions from a Detached House

1
Graduate School of Environmental and Information Sciences, Yokohama National University, Yokohama 240-8501, Japan
2
Heat Island Group, Lawrence Berkeley National Laboratory, Berkeley, CA 94720, USA
3
Division of Sustainable Energy and Environmental Engineering, Osaka University, Suita 565-0871, Japan
*
Author to whom correspondence should be addressed.
Atmosphere 2021, 12(5), 572; https://doi.org/10.3390/atmos12050572
Submission received: 24 March 2021 / Revised: 23 April 2021 / Accepted: 23 April 2021 / Published: 28 April 2021
(This article belongs to the Special Issue Urban Design Guidelines for Climate Change)

Abstract

:
Urban air temperature rises induced by the urban heat island (UHIE) effect or by global warming (GW) can be beneficial in winter but detrimental in summer. The SCIENCE-Outdoor model was used to simulate changes to sensible heat release and CO2 emissions from buildings yielded by four UHIE countermeasures and five GW countermeasures. This model can evaluate the thermal condition of building envelope surfaces, both inside and outside. The results showed that water-consuming UHIE countermeasures such as evaporative space cooling and roof water showering provided positive effects (decreasing sensible heat release and CO2 emissions related to space conditioning) in summer. Additionally, they had no negative (unwanted cooling) effects in winter since they can be turned off in the heating season. Roof greening can provide the greatest space- conditioning CO2 emissions reductions among four UHIE countermeasures, and it reduces the amount of heat release slightly in the heating season. Since the effect on reducing carbon dioxide (CO2) emissions by UHIE countermeasures is not very significant, it is desirable to introduce GW countermeasures in order to reduce CO2 emissions. The significance of this study is that it constructed the new simulation model SCIENCE-Outdoor and applied it to show the influence of countermeasures upon both heat release and CO2 emissions.

1. Introduction

Recently, increasing urban temperatures due to the urban heat island effect (UHIE) and global warming (GW) have become remarkable around the world. During the 20th century, GW increased the annual average air temperature in Japan by about 1 K [1]. During the same period, high temperatures in the summer have risen about 1–2 K, and low temperatures in winter have risen about 3–6 K in some large cities [1]. These extreme temperature rises in some large cities result from UHIE and GW, but currently, the influence of UHIE in Japan is larger than that of GW. Based on past trends, it is easy to imagine that the temperature rise will continue for some time into the future [2]. UHIE and GW do more than increase temperatures; they also have other diverse impacts on urban dwellers that affect energy and resources [3,4], human health [5,6], and air pollution [7,8]. Therefore, we must take action to mitigate these two phenomena.
Under such circumstances, it is highly desirable that countermeasures reduce both UHIE and GW. However, some measures taken to mitigate UHIE can affect carbon dioxide (CO2) emissions negatively, and measures taken to mitigate GW can affect heat release negatively. For this reason, it is necessary to evaluate the efficacies of UHIE countermeasures and GW countermeasures, and then examine whether UHIE countermeasures will increase GW and whether GW countermeasures will increase the UHIE. In this study, we used a simulation model to quantify the effect of UHIE countermeasures and GW countermeasures upon heat release and CO2 emissions, respectively, and investigated features of various countermeasures related to a detached house.
Here, it is necessary to consider the implications of reducing heat release during winter where winter temperatures are low (like East Asian countries). It has been shown that temperature rise during winter in Japan helps to reduce the adverse effects of energy consumption and health impacts [9,10,11]. To maintain these indirect benefits, it is not desirable to reduce the amount of heat released during winter.
Much research has been conducted on the relationship between UHIE and energy consumption, and it is roughly divided into three groups. The first focuses on the influence of UHIE on energy consumption, and many studies have been conducted to obtain the temperature sensitivity from seasonal energy consumption data [12,13,14,15]. The second group investigates the influence of energy consumption as a cause of UHIE, and much research has been done to calculate the anthropogenic waste heat from the detailed energy consumption of the region and to evaluate the temperature effect by the climate model, especially in Japan [16,17,18,19]. The last group investigates the influence of UHIE countermeasures on regional temperature by reducing energy consumption. Numerous studies have been conducted thanks to the development of user-friendly models typified by MM5 (Fifth-Generation Penn State/NCAR Mesoscale Model) [20] and WRF (Weather Research and Forecasting Model) [21], as well as the improvement of computer performance in recent years [22,23,24,25]. While the impacts on CO2 emissions from reducing energy consumption are well analyzed in GW studies [26,27,28], most researchers do not pay attention to reducing heat release by implementing GW countermeasures.
Most UHIE and GW studies have only examined the effects of UHIE and GW countermeasures individually. Some advanced studies have examined both effects of UHIE and GW when evaluating roof greening [29] or air source heat pump water heaters [30] or photovoltaic panels [31], but few have evaluated heat release to the atmosphere and energy consumption simultaneously with a single simulation model. Ihara et al. used the CM-BEM model to quantify the impacts of various measures on annual energy consumption and ambient temperature for typical Japanese office blocks [32]; we are unaware of any such study targeting residential buildings. To successfully implement urban and regional planning measures to address these issues, it is important to examine not only the positive effects of countermeasures but also their potential adverse effects and to use the same model to compare heat release and CO2 emissions on an equal footing.
From the above background, in this study, through an examination using the SCIENCE-Outdoor simulation model, we quantify the effect of UHIE countermeasures and GW countermeasures on heat release and CO2 emissions. This study’s purpose is to evaluate various technologies for their potential to mitigate UHIE and GW, primarily in houses, and then to propose their proper implementation.

2. Methods

2.1. Simulation Model

In this study, the SCIENCE-Outdoor model was used for evaluation. This model is based on the computational fluid dynamics (CFD) SCIENCE model [33] that can evaluate thermal and fluid conditions inside a building. This model was modified to yield the SCIENCE-Vent model by expanding the fluid and radiant analysis outside the building and by adding an indoor climate control behavior model [34,35]. The SCIENCE-Vent model can predict energy consumption of space conditioning (SC) and lighting for a building. It also considers the relationship between the inside and outside environments, as well as occupant indoor thermal environment control behavior (e.g., cross-ventilation by opening windows and space conditioning use).
For this study, we modified the SCIENCE-Vent model to yield the SCIENCE-Outdoor model by adding outside heat release analysis and by omitting fluid analysis. Because the SCIENCE-Outdoor model was developed based on the CFD model, it can evaluate the thermal condition of building surfaces both inside and outside at each detailed mesh. As shown in Figure 1, the SCIENCE-Outdoor model consists of the three submodels: (1) radiant, (2) inside thermal environment, and (3) outside heat release.
The radiant submodel calculates the radiation field both inside and outside buildings by considering the influence of surrounding buildings and trees. To evaluate radiation outside of buildings, it can obtain the sky view factor of each building’s outer surface, the shape factor between each outer surface and the ground or surrounding buildings, and the reception ratio for direct solar radiation. To evaluate radiation inside buildings, it can obtain the sky factor of the building’s inner surface, the shape configuration of the ground and surrounding buildings, the Gebhart absorption coefficient [36] for solar radiation, and long-wavelength components. These data are used to calculate the envelope surface temperature and radiant heat flux for the inside thermal environment submodel.
The inside thermal environment submodel is used to predict an indoor thermal environment and to calculate energy consumption of the space conditioning and water heating (WH) by using the space conditioning heat load calculation model, the heat pump model [37], the hot water supply model [38], and the indoor climate control behavior model [39]. The space conditioning heat load calculation model assumes complete mixing of indoor air. The thermal conduction calculation through the envelopes uses a one-dimensional finite difference method. In the heat pump model, the coefficient of performance (COP) is corrected in consideration of the outdoor air temperature and the amount of space conditioning heat load [40]. Space conditioning energy consumption is calculated from the corrected COP and the space conditioning heat load. In the hot water supply model, it is necessary to know the supply water temperature, the amount of water used, and the temperature of that water. In the indoor climate control behavior model, the standard effective temperature (SET*) at 1.2 m above the room center floor is used as an evaluation index of the comfort of the indoor thermal environment, and the heating, ventilation, and air conditioning (HVAC) method (e.g., cross-ventilation by opening windows and space conditioning use) in each room is determined.
In the outside heat release submodel, the sensible heat release derived from the building outer envelope and glass surface is calculated based on the data provided by the inside thermal environment submodel and the outdoor air temperature obtained from weather data. The sensible heat release derived from the envelope surface is calculated from the outdoor air temperature, the outer envelope and glass surface temperature, and the convective heat transfer coefficient. Here, the indoor convective heat transfer coefficient was constant at 5 W/m2, and the outdoor convective heat transfer coefficient was set as a value that depends on the external wind speed according to the Jurges empirical formula [41].
In this study, the heat release is defined as the total amount of convective sensible heat transfer from the building envelope, plus waste sensible heat produced outside the building by heat pumps used to condition the occupied space, plus waste sensible heat produced by the water heater used to make hot water. Since the latent heat does not directly affect the air temperature change near the ground, it was not evaluated in this paper. Figure 2 shows the schematic diagram of the heat release defined in this study.
To determine the effect of countermeasures on UHIE mitigation, we calculated the change of sensible heat release when applying countermeasures. Because the influence of the decrease in heat release on ambient air temperature varies with time and place [42], it is difficult to evaluate its effectiveness on temperature precisely. To determine the effect of countermeasures on GW mitigation, we calculated the change of energy consumption and CO2 emissions when applying countermeasures. Here, energy consumption included both space conditioning and water heating. The details of each countermeasure targeted in this research are described in Section 2.3. Regarding the CO2 emission change by introduction of various measures mentioned above, 0.512 kg CO2/kWh was used for site electricity [43] and 0.05 kg CO2/MJ was used for site gas [44].

2.2. Building and Weather Condition

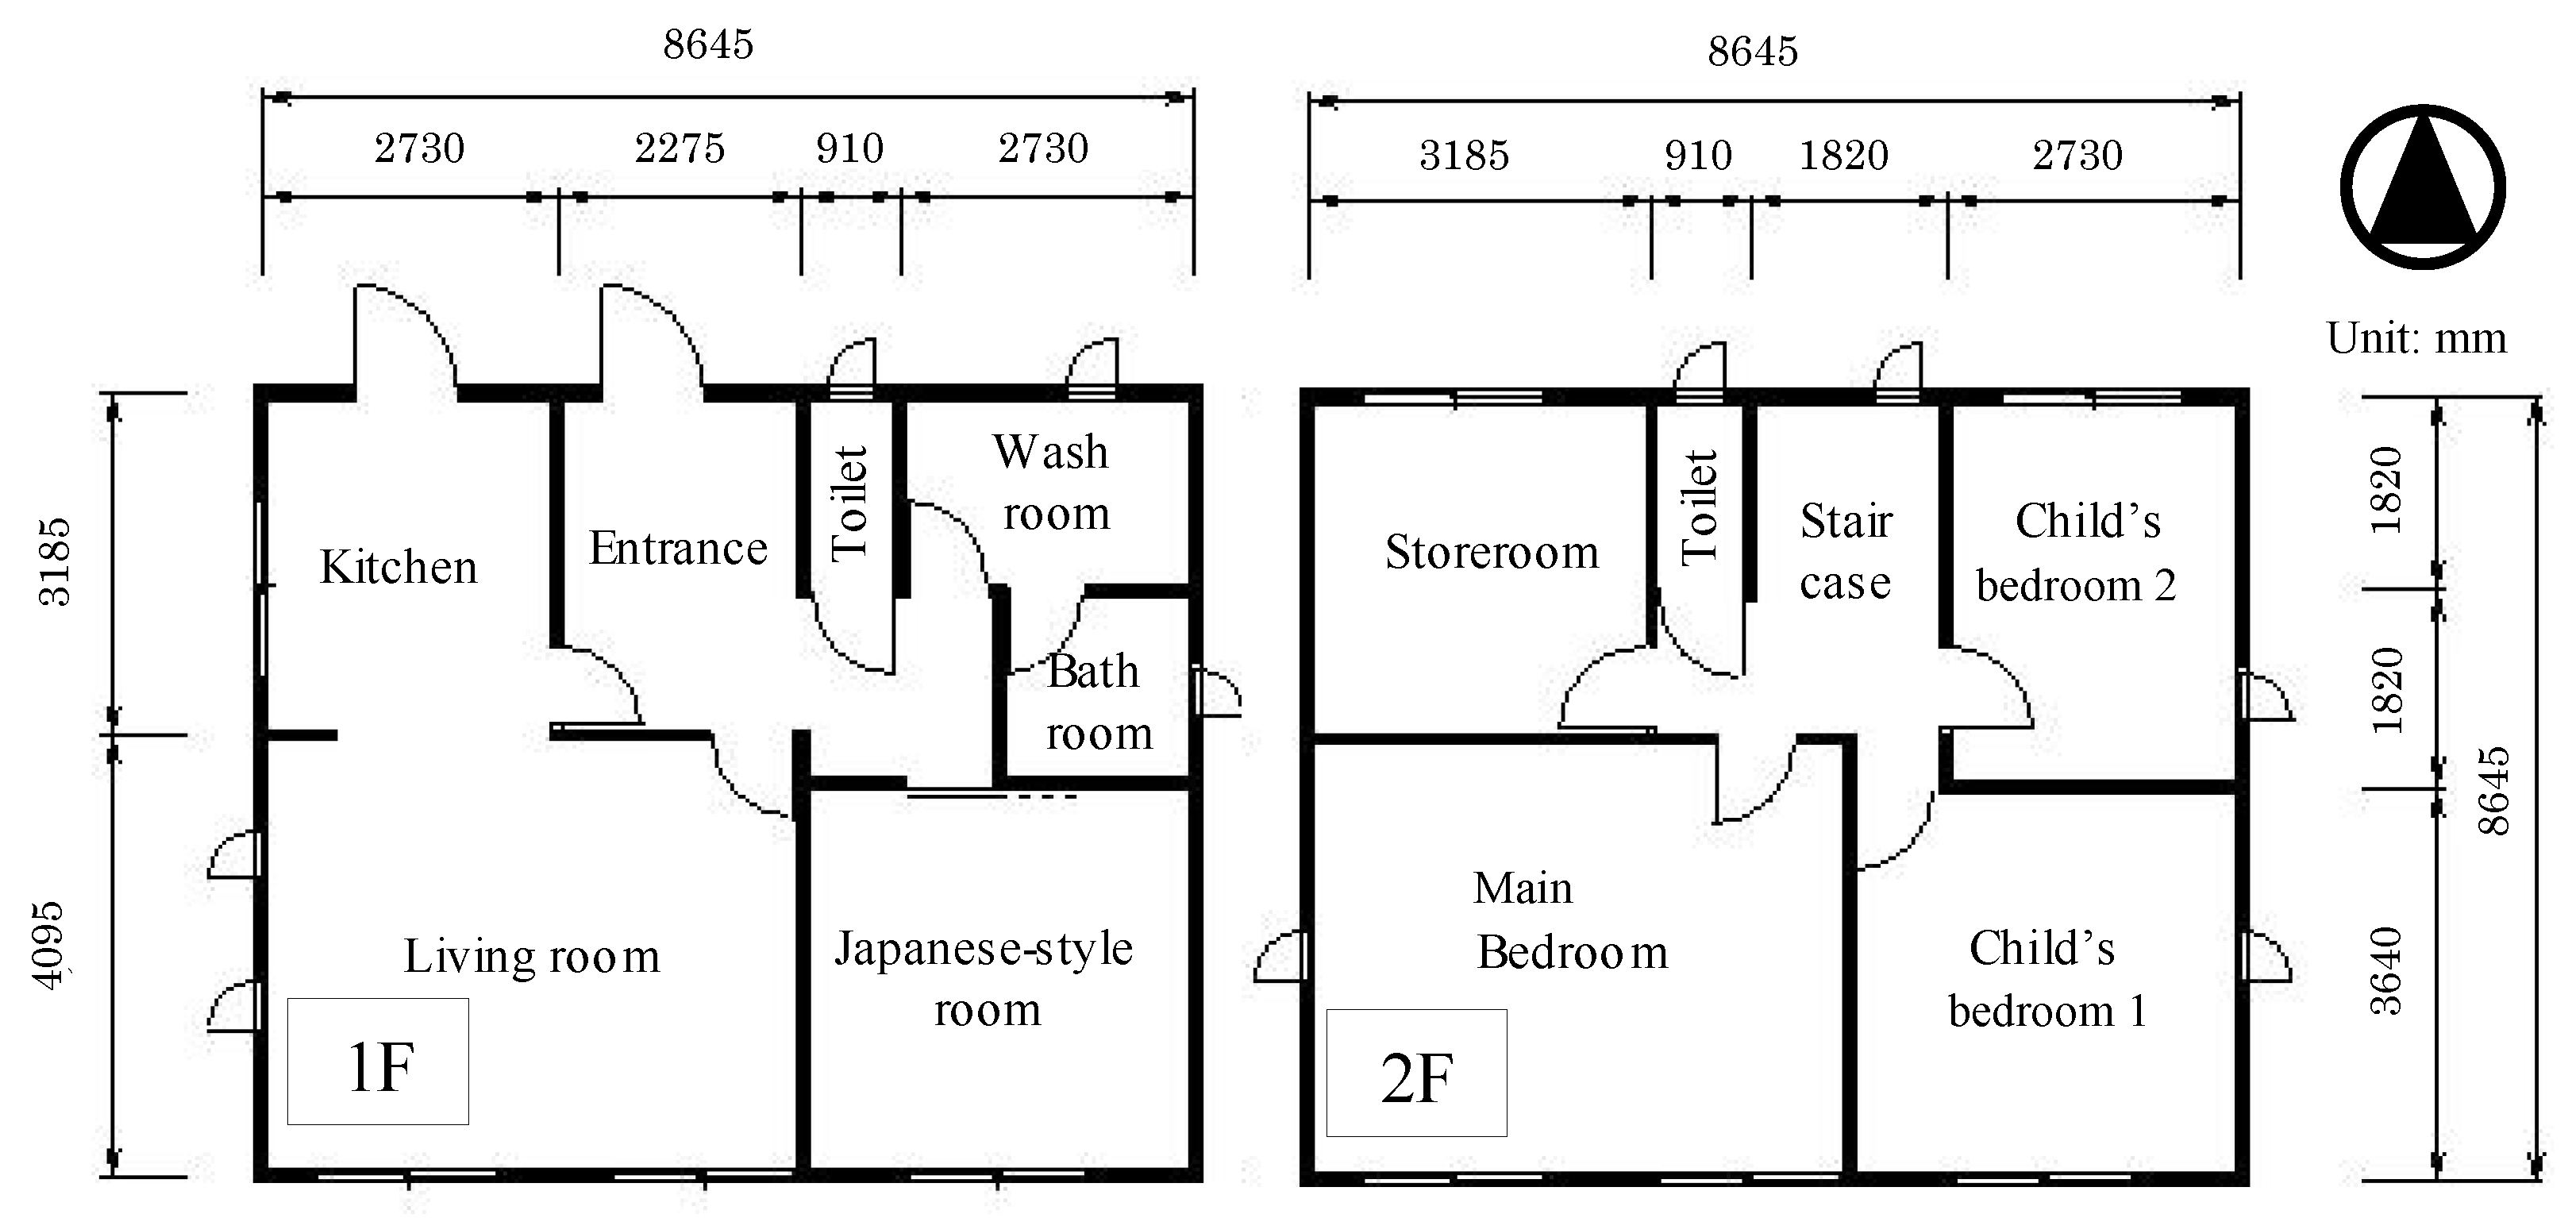
This simulation used the Japanese prototype detached house model by the Architectural Institute of Japan (AIJ) [45]. Figure 3 shows the plan view of this house model. The total floor area of the house is about 125 m2. The house includes a living room (including dining area) and three individual rooms.
Table 1 shows the computational condition and Table 2 shows the wall composition of the buildings to be evaluated. Two kinds of building structures were evaluated: wooden and reinforced concrete (RC). Three levels of insulation performance were considered: (1) no insulation (where thermal transmittance of the wooden outer wall is 2.5 W/m2·K, with single-pane windows); (2) low insulation, equivalent to the old 1980 Japanese energy-saving code (where the thermal transmittance of the wooden outer wall is 0.9 W/m2·K and windows are single-paned); and (3) high insulation, equivalent to the current 1999 Japanese energy-saving code (where the thermal transmittance of the wooden outer wall is 0.3 W/m2·K and windows are double-paned). An air-cooled heat pump system was set to provide the living room (cooling capacity: 3.6 kW), main bedroom (cooling capacity: 3.6 kW), and both child bedrooms (cooling capacity: 2.2 kW). The solar reflectance (albedo) of the outer envelope for the base condition was set to 0.20.
The household was considered to be a family of four: two adults (one employed outside the home, the other a homemaker) and two schoolchildren. The schedule of occupancy and heat generation were set by applying “SCHEDULE” [47], which was an automatic setup scheduling program. An air-cooled heat pump system was used for the cooling and heating, with temperature setpoints of 27 °C in the cooling season and 22 °C in the heating season. The relative humidity setpoint was 60% in the cooling season; relative humidity was not controlled in the heating season.
Expanded AMeDAS (Automated Meteorological Data Acquisition System) weather data for HVAC systems [46] were used for the climate condition. The interval time of the calculation can be set arbitrarily; in this study, the interval was set to 15 min. However, since AMeDAS data are provided in 1-h intervals, it was interpolated at 15-min intervals (calculation time-step) using a Lagrange polynomial interpolation. The targeted area was set in Osaka, the second-largest city in Japan, located near the center of the country. Osaka has very severe weather conditions in the summer and is one of the hottest metropolises in Japan.

2.3. Countermeasures

Table 3 outlines the countermeasures evaluated in this study. For this research, the countermeasures for UHIE and GW that are expected to become common in the near future were selected. High-albedo roof, roof greening, roof water showering, and evaporative space cooling were selected as the UHIE countermeasures. Condensing water heater, heat pump water heater, gas engine cogeneration system, solid oxide fuel cell, and photovoltaic power generation were selected as the GW countermeasures.
A high-albedo roof can reduce both sensible heat release from a rooftop and cooling energy consumption in the building by using reflective paint or material to reflect solar radiation. Although its effect is largest on summer afternoons, there is some concern about an increase in heating energy consumption during the heating season [48]. For this calculation, the rooftop surface albedo was changed to 0.60 from 0.20 throughout the year.
Roof greening—placing greenery (vegetation) on the roof—can reduce sensible heat release from the rooftop, as well as cooling energy consumption. The greenery can reduce the roof surface temperature via evaporation and transpiration; greening units can also provide insulation [49]. For this calculation, layers of vegetation and soil were added on the rooftop surface (with a thermal conductivity of 1.85 W/m·K). Rooftop surface evaporation efficiency was changed to 0.3 from 0.0, and the rooftop surface albedo was changed to 0.25 from 0.20 [50,51]. The roof greenery was assumed to be withered in winter. The evaporation efficiency while withered was set at 0.05, and only the soil layer was considered. Roof greening was evaluated only on the reinforced concrete structure because the greenery was too heavy for the roof of the wooden house.
Installing a roof water shower (RWS) can reduce the amount of sensible heat release from a rooftop, as well as cooling energy consumption. Showering water can reduce the roof surface temperature via evaporation. It is not necessary to use a motor pump since the waterdrops can be large. Because this system is not used in winter, there is no concern about an increase in heating energy consumption [52]. For this calculation, the RWS was set to represent showering water on the rooftop surface only in the daytime until 5 p.m., when its surface temperature exceeds 40 °C in the cooling season. Evaporation efficiency of the rooftop surface was set at 0.7 while showering, gradually decreasing after stopping the shower [52].
An evaporative space cooling system can reduce sensible heat release from space conditioning, as well as cooling energy consumption, by installing a fine fog jetting outside windows on an outer wall and taking the fog into the room. It can reduce the indoor air temperature and atmospheric sensible heat through evaporation. Because the particles of the mist are exceptionally fine, they evaporate immediately. However, it is necessary to use a motor pump to increase the water pressure and reduce mist size. Because this system is not used during winter, there is no concern about an increase in heating energy consumption [52]. For this calculation, it was installed only in the air-conditioned room—nine nozzles each in the living room and the main bedroom, and four nozzles each in the child bedrooms. Each nozzle delivers water at the rate of 1.34 L/min. In the cooling season, it was assumed that this system would operate as needed to cool occupants. If unable to maintain occupant comfort, the system would be stopped and mechanical cooling would be turned on. Based on the results of our feasibility study [52], the cooling effect was almost equivalent to a 1 K decrease in SET*, and the reduction of cooling time and the heat absorption from the atmosphere due to evaporation were considered.
A condensing water heater can reduce water heating energy consumption and heat release from water heating by using waste-heat recovery at the secondary heat exchanger to improve heat exchange efficiency [38]. This system does not require installation of a hot water storage tank. In recent years, condensing water heaters have become standard in Japan. For this calculation, the heat exchange efficiency was improved to 0.95 from 0.78.
A heat pump water heater can reduce water heating energy consumption and heat release from water heating by absorbing atmospheric heat with a compression heat pump. It can obtain a large reduction effect of atmospheric sensible heat, especially at night, because this system usually works during the night by utilizing low-rate midnight power [38]. In recent years, the share of this system has been increasing rapidly as a substitute for a normal electric-resistance water heater in Japan. There is a concern about heat release from the hot water storage tank to the atmosphere. For this calculation, the rated generation output of the hot water was set at 4.5 kW. The effect of improvement in energy efficiency compared to conventional water heater and heat absorption from the ambient atmosphere was considered. Regarding the COP, the characteristic change due to outdoor air temperature was considered.
A gas engine cogeneration system can reduce consumption of water heating energy, as well as grid electricity consumption, by generating onsite electricity with a gas engine. This system is operated in accordance with the heat demand. The number of operations per day is unlimited, but excessive start/stop must be restricted [38]. There is some concern about heat release from the hot water storage tank and heat release from the engine to burn the fuel on site. For this calculation, the rated power generation output was set at 1.0 kW. The rated power generation efficiency was set at 20%, and the exhaust heat utilizing efficiency was set at 57%.
A solid oxide fuel cell (SOFC) can reduce the amount of water heating energy, as well as grid power consumption, by generating onsite electricity. Hourly power generation will be set to fit the electricity load without start/stop. Heat demand that is not supplemented by this system will be handled by an auxiliary heat source [38]. There is a concern about heat release from the hot water storage tank and generator. For this calculation, as a result of determining the optimum capacity from the thermal demand and the electric power demand, the rated power generation output was set at 0.7 kW. The rated power generation efficiency was set at 45%, and the exhaust heat utilizing efficiency was set at 36%, and they were changed depending on the operation status from moment to moment.
Photovoltaic power generation (PV) can reduce the amount of grid electricity consumption by generating electricity from solar energy. In addition, due to its small heat capacity, the surface temperature of PV will decrease during the night. There is a concern about the surface temperature of PV rising during the daytime, as the solar reflectance is lower than the general building surface. For this calculation, the installed capacity was 3.0 kW. It was assumed that all the generated electric power could lead to a reduction of the grid power supply. The rated power generation (conversion) efficiency was set at 13%. The influence of decreasing the albedo on the rising temperature of the rooftop surface and increasing heat release was taken into consideration [31].

3. Results

3.1. Base Condition (No Countermeasure)

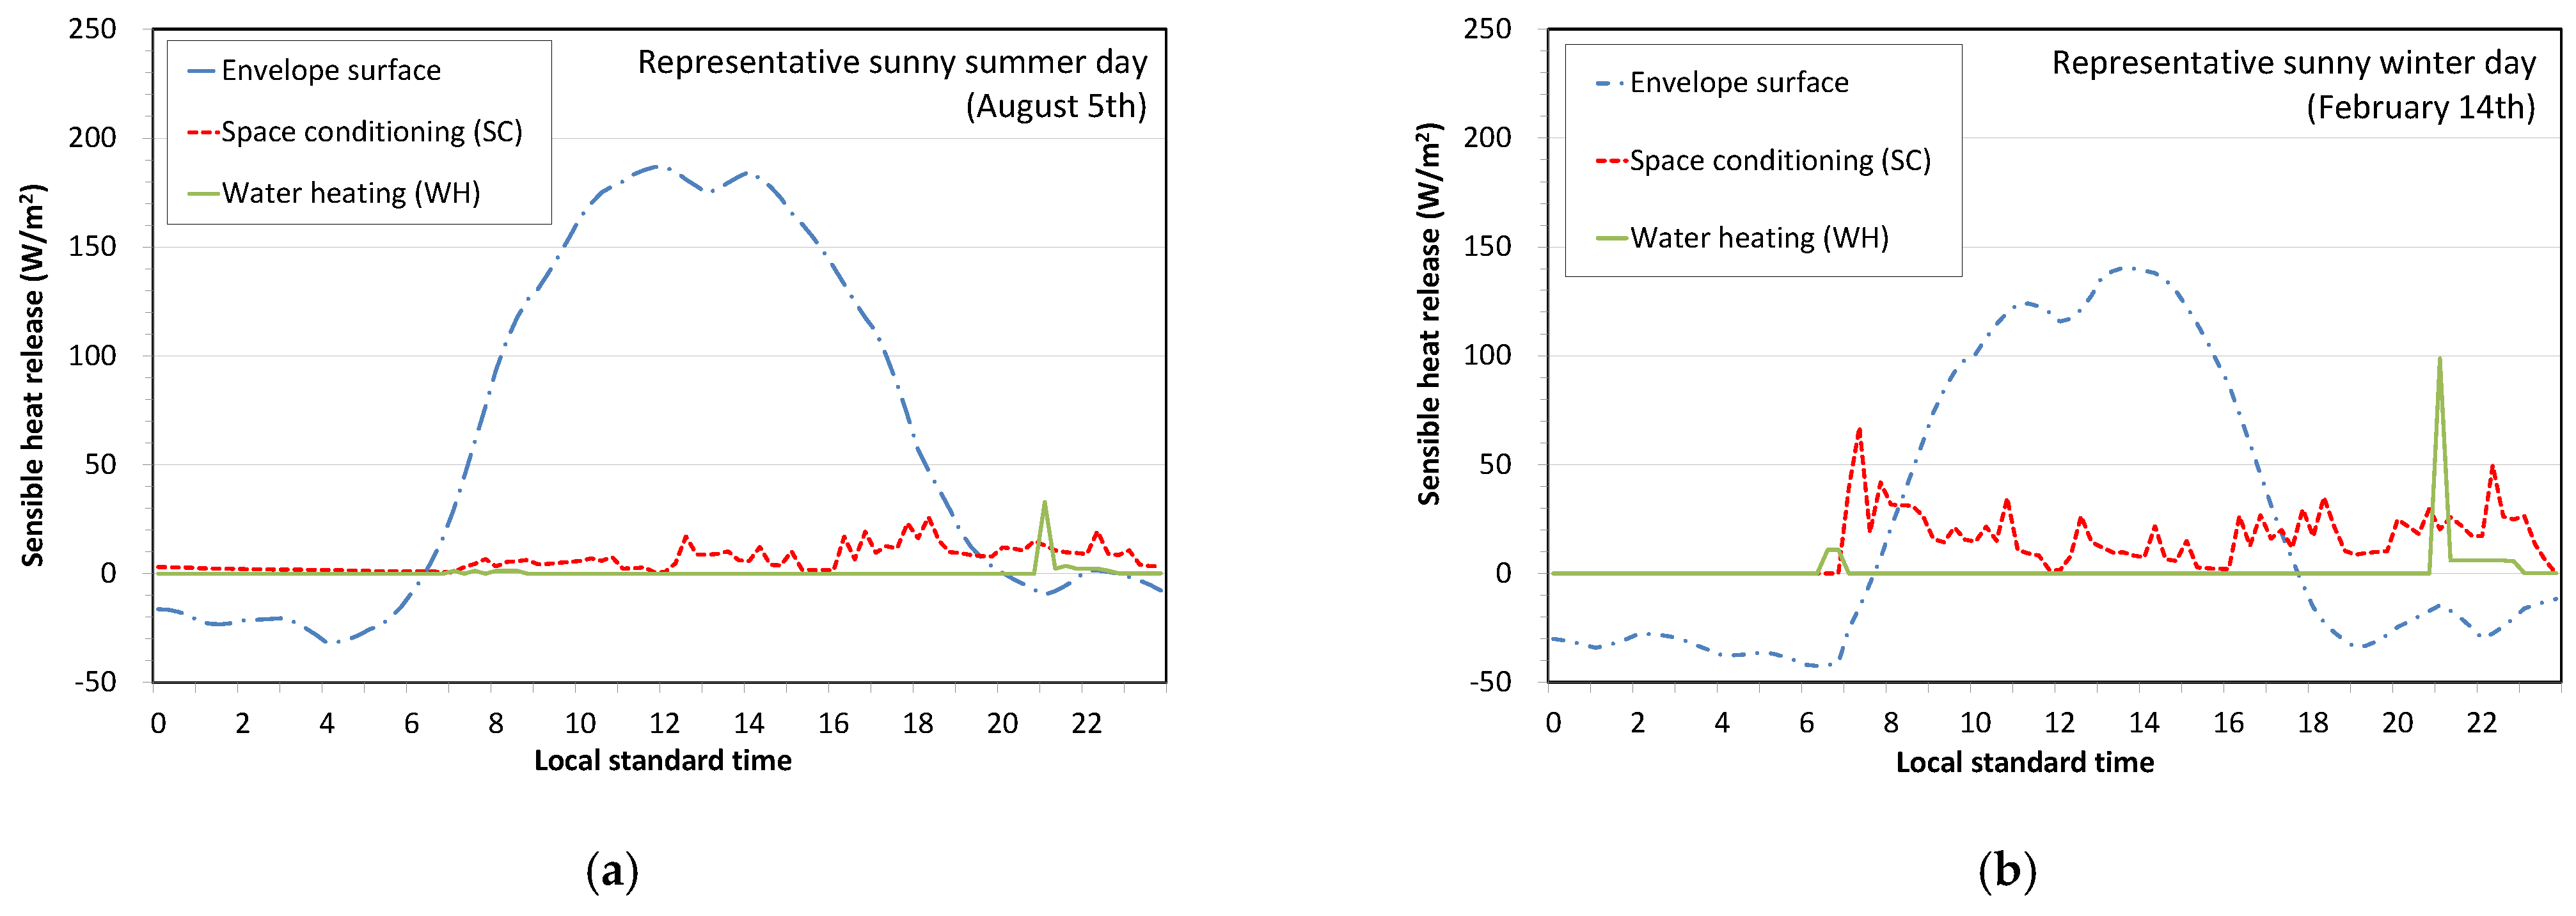
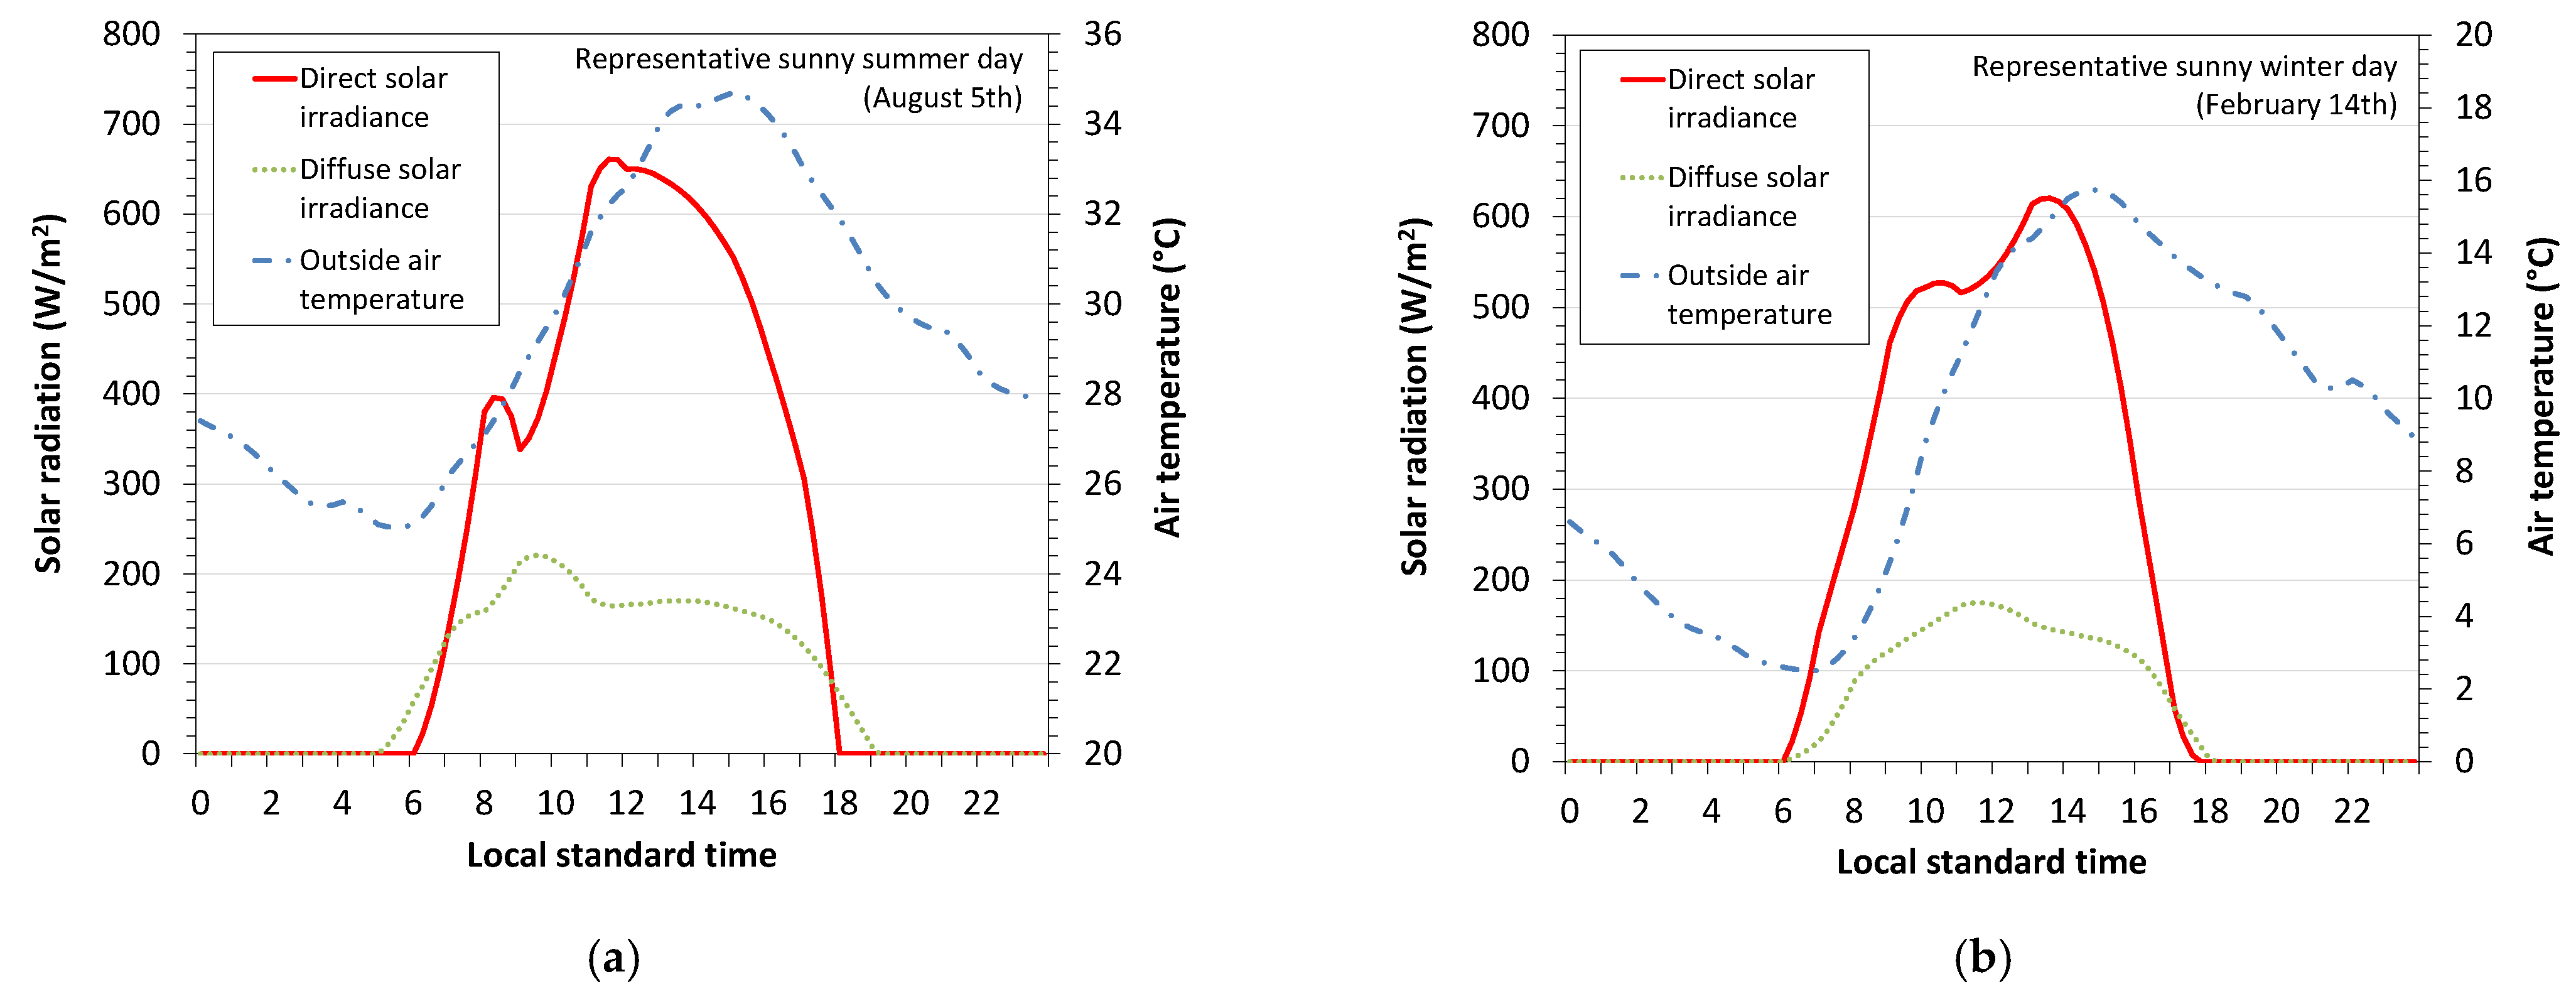
Figure 4a shows the sensible heat release from each path on a representative sunny summer day (August 5) for the wooden structure with the low insulation level. Figure 5a shows the weather condition. For the base condition, the heat from space conditioning is the sum of the cooling load and the consumption energy for space conditioning; it is equivalent to the amount of heat release to the outside through the heat pump outdoor unit, as shown in Figure 2. The heat from the water heating equals the total amount of heat released to the outside through the water heating and inside the house at the time of hot water use. Hereafter, the basis area is equal to the building area.
The maximum rate of sensible heat release during the daytime was 180 W/m2. The daily heat from the envelope surface was by far the largest contribution, accounting for about 87% of the total. The anthropogenic heat was very slight; the space conditioning accounted for 12% and the water heating accounted for only 1%. However, when the heat from the envelope surface decreased in the evening, the proportion of anthropogenic heat became much greater than it was in the daytime. Because on the representative hot summer days the indoor climate control behavior model showed the space conditioning being used for almost the entire day, the heat from the space conditioning system occurred even at midnight. The exhaust heat from the water heating rose temporarily around 9 p.m. because of hot water needed for bathing. Due to the atmospheric radiation cooling, the heat release from the envelope surface showed a negative value at night until dawn.
Figure 4b shows the sensible heat release from each path on a representative sunny winter day (14 February). Figure 5b shows the weather condition. Here, the heat from space conditioning is the sum of the heating load and the space conditioning consumption energy; it is equivalent to the amount of heat release to the inside through the heat pump outdoor unit, as shown in Figure 2.
The maximum sensible heat release rate during winter daytime was 150 W/m2. The heat release from the envelope surface was relatively low throughout the day, compared to daytime release in summer, and it showed a negative value from evening to dawn. The heat absorption through the space conditioning increased, especially during the period when the heat load was great in the morning and at night. Since the space conditioning is not used during sleeping hours in the heating season, no heat absorption occurs at night. The heat release from the water heating showed a large value compared to the summer, as the hot water demand increased in winter.

3.2. Variation of the Heat Release by Applying Countermeasures

3.2.1. Envelope Surface

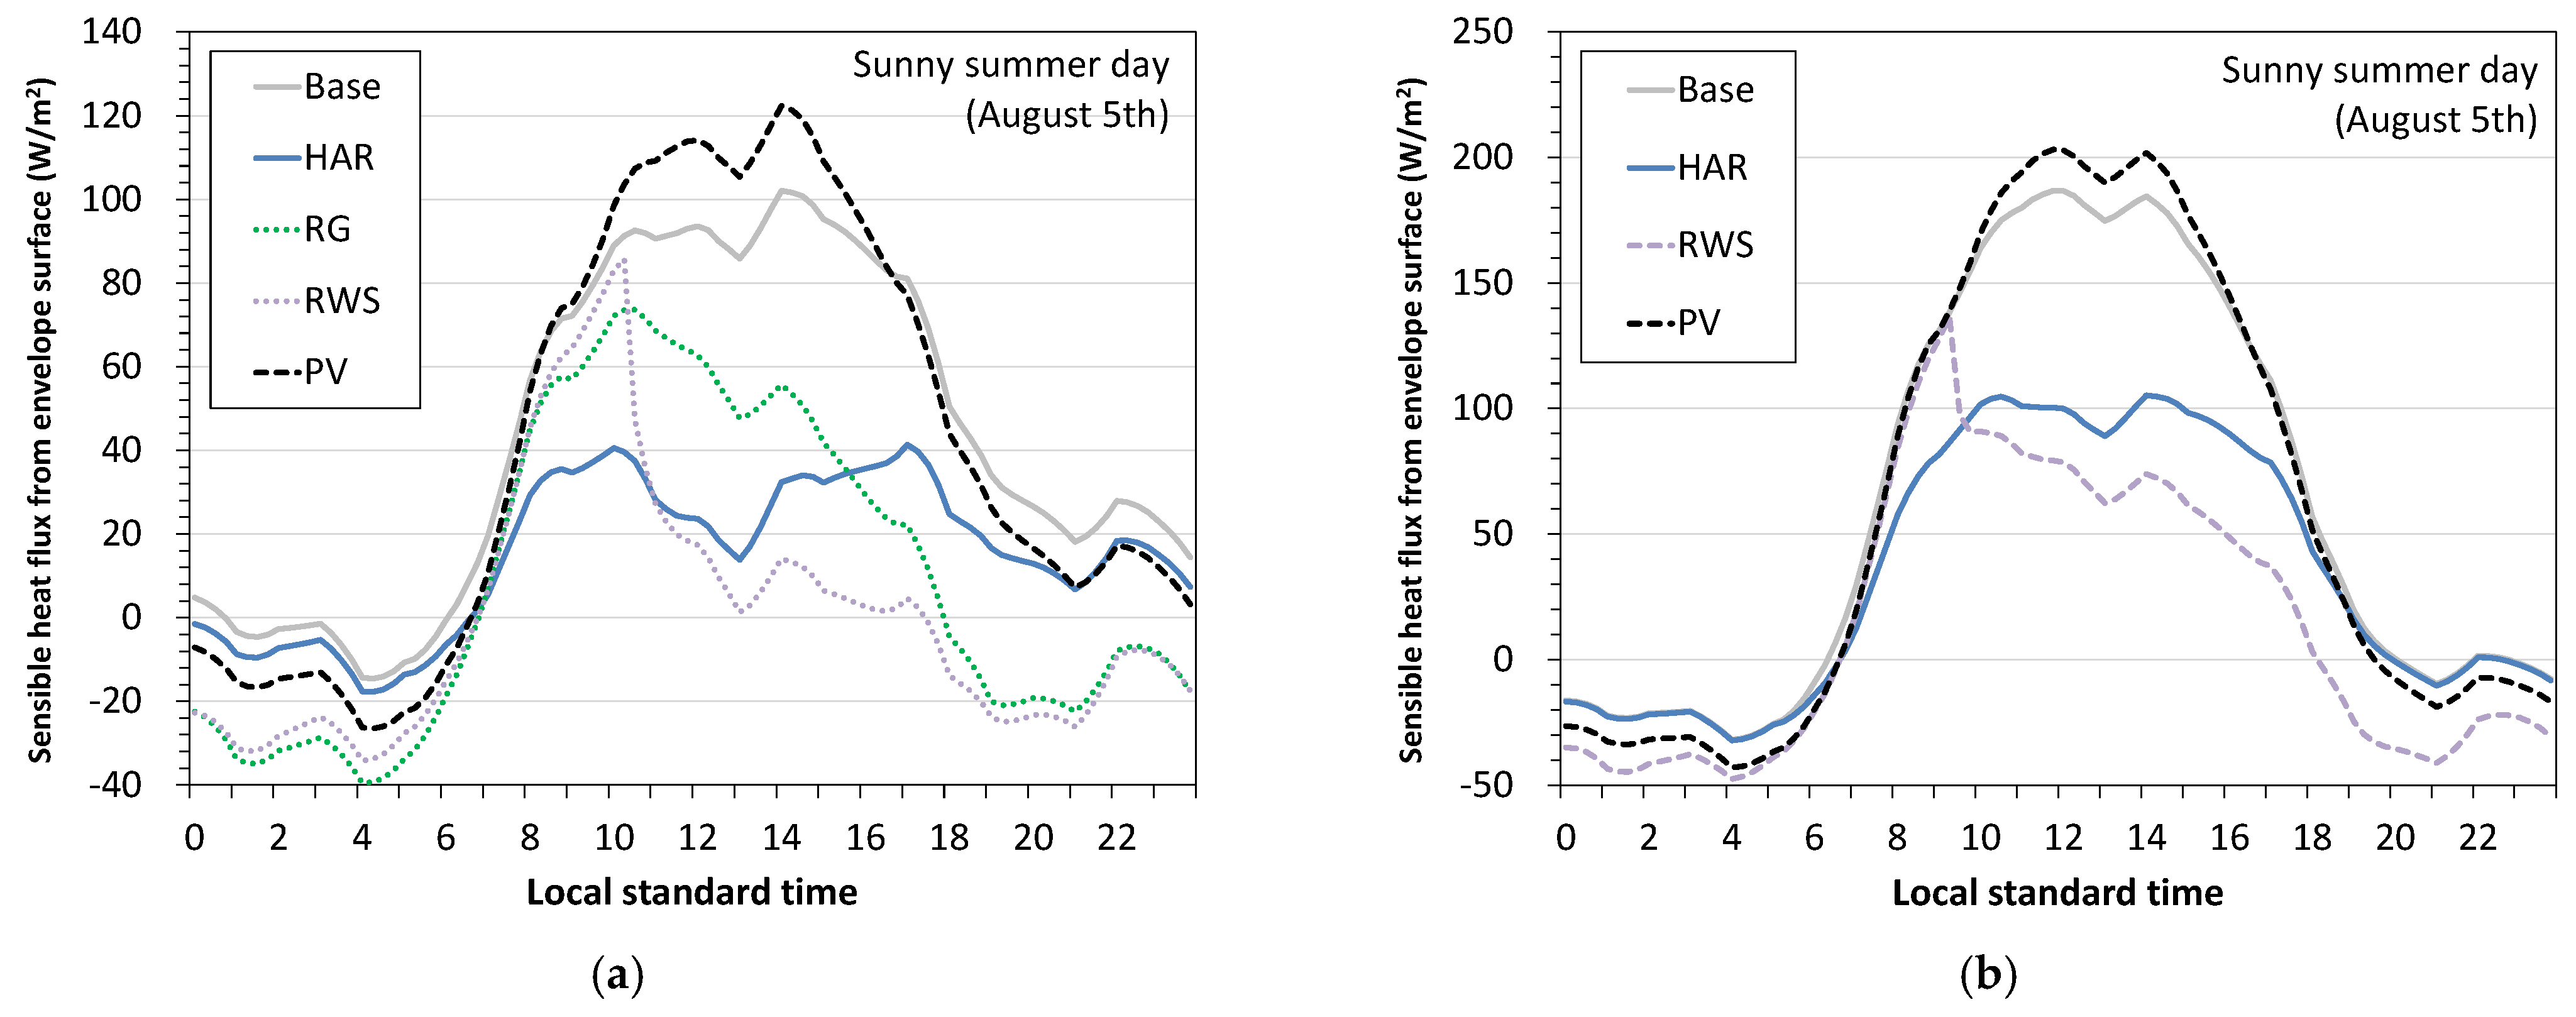
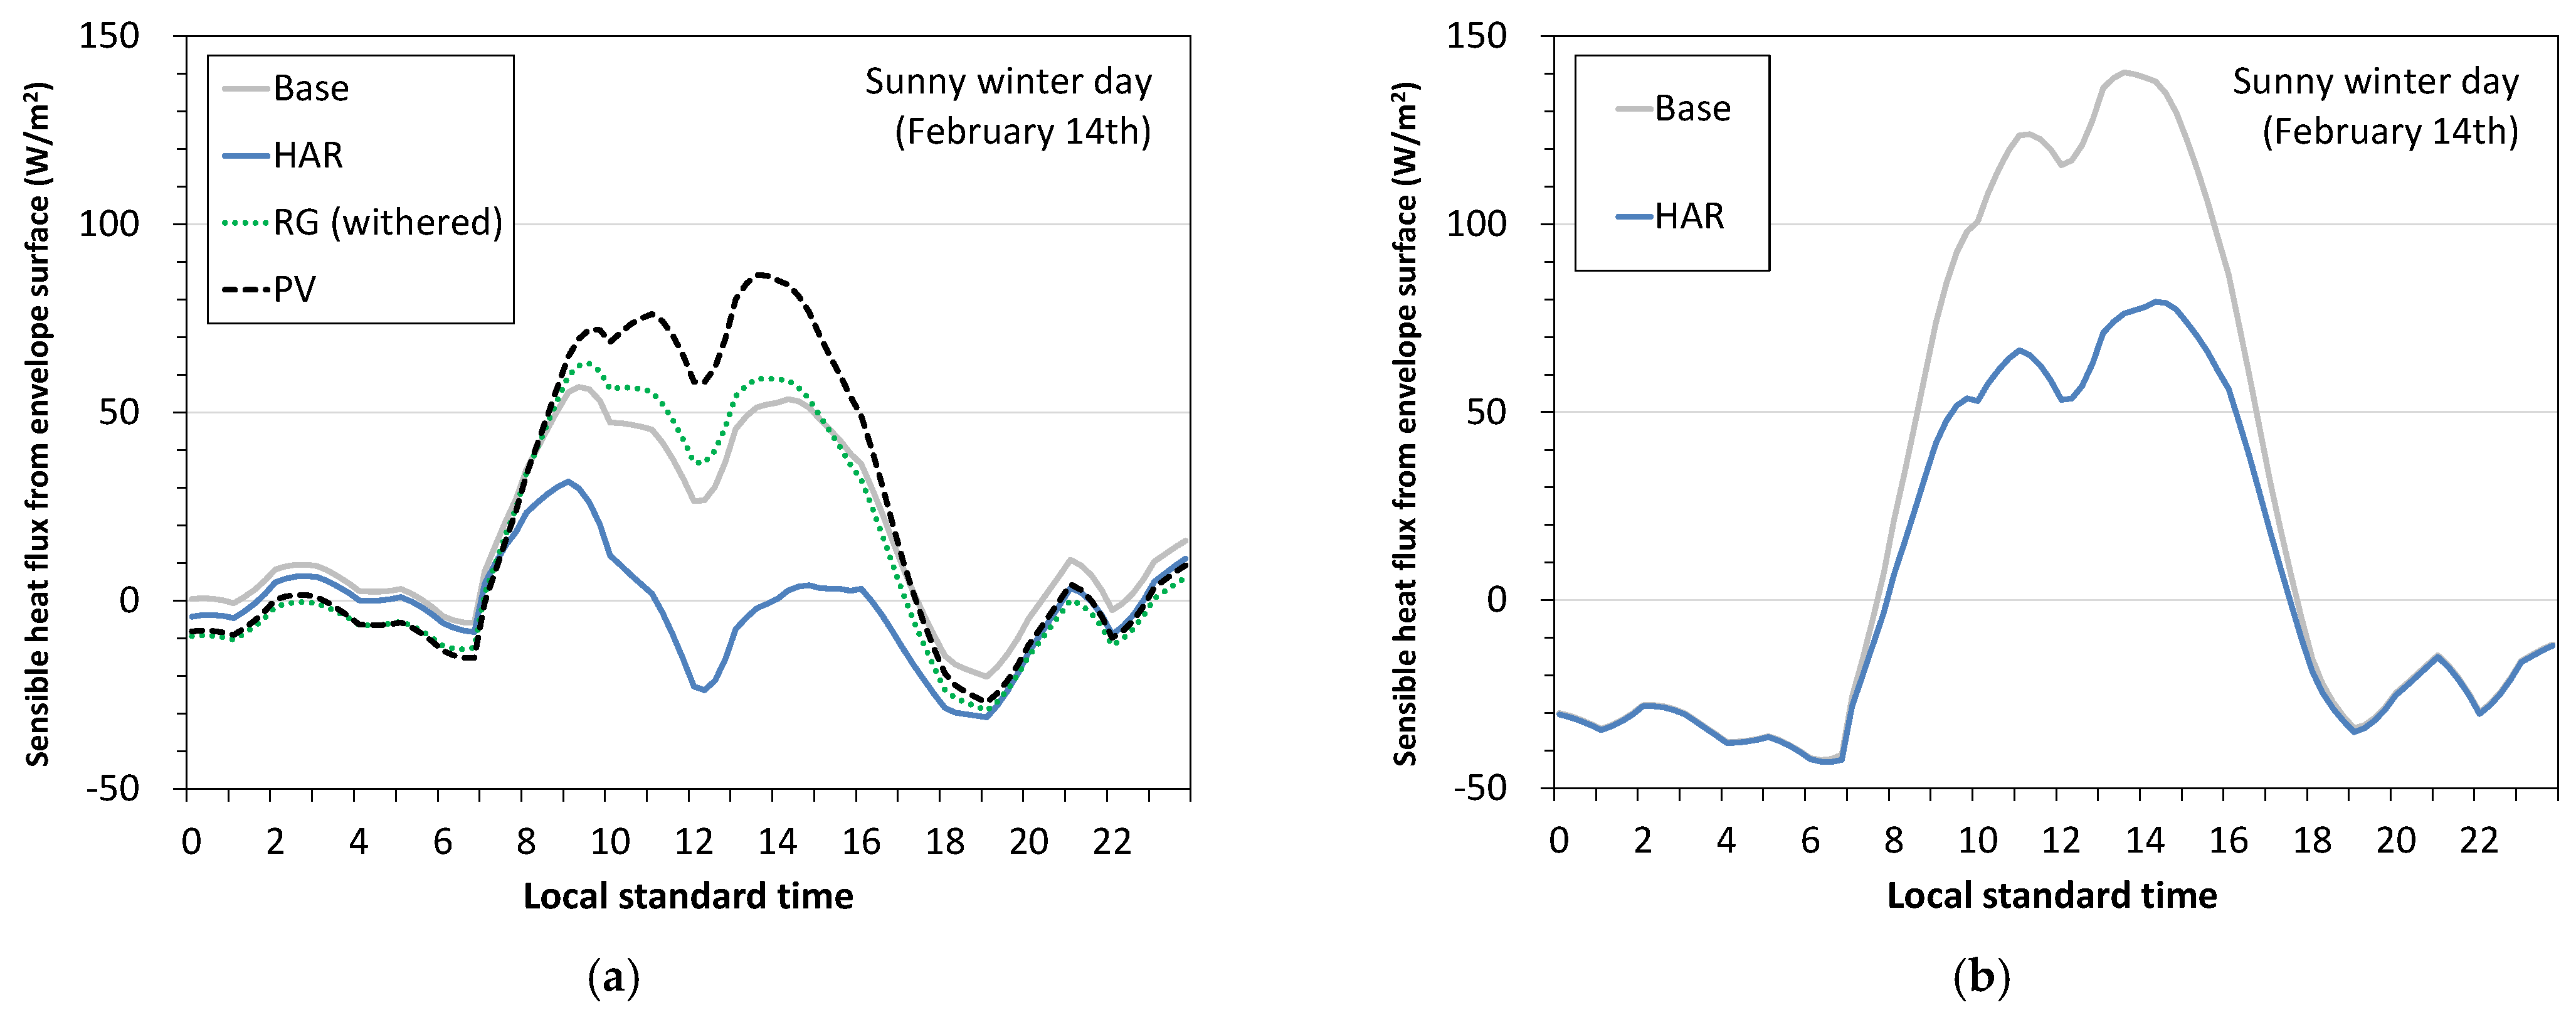
Figure 6 shows the effectiveness of countermeasures influencing the heat release from the envelope surface on a representative sunny summer day (August 5). Compared to the base condition, the heat release from the envelope surface of reinforced concrete structure decreased for high-albedo roof (HAR), roof greening (RG), and roof water showering (RWS), but increased for photovoltaic power generation (PV). The reduction rate for the whole day became larger, with roof water showering providing the largest reductions, then roof greening, then high-albedo roof, in declining order. When looking at daytime reduction alone, the largest reduction rate was from roof water showering, then high-albedo roof, and then roof greening. In contrast, at nighttime, the reduction rate was largest with roof greening, then roof water showering, then high-albedo roof. When comparing the wooden structure with a low insulation level to the reinforced concrete structure, there was no significant difference in results; the reduction rate for the whole day was largest with roof water showering, and then high-albedo roof.
The roof water showering scenario that achieved the maximum effect had water showering starting at 10 a.m., when the roof surface temperature exceeded 40 °C, and the sensible heat release decreased rapidly. At 6 p.m., the heat release almost reached zero. Although the showering was stopped at 5 p.m., the effect continued throughout the night. As for the high-albedo roof that achieved a notable effect during the daytime, the heat release decreased considerably from the early morning toward evening, and it slightly continued at night due to the high thermal mass of the roofing material. For the roof greening, the effect was approximately in the middle between roof water showering and high-albedo roof in the daytime, and almost the same as that of roof water showering at night. Because of the large solar absorptance (1—solar reflectance—conversion efficiency) of the PV material, the heat release increased during the day and decreased at night.
Figure 7 shows the effectiveness of countermeasures influencing heat release from the envelope surface on a representative sunny winter day (14 February). Since the soil layer of withered roof greening has less thermal mass and higher thermal resistance than a normal concrete roof, the amount of heat release during the day increased compared to the base condition. The other countermeasures show almost the same change compared to the summer result, so detailed consideration is omitted.

3.2.2. Space Conditioning System

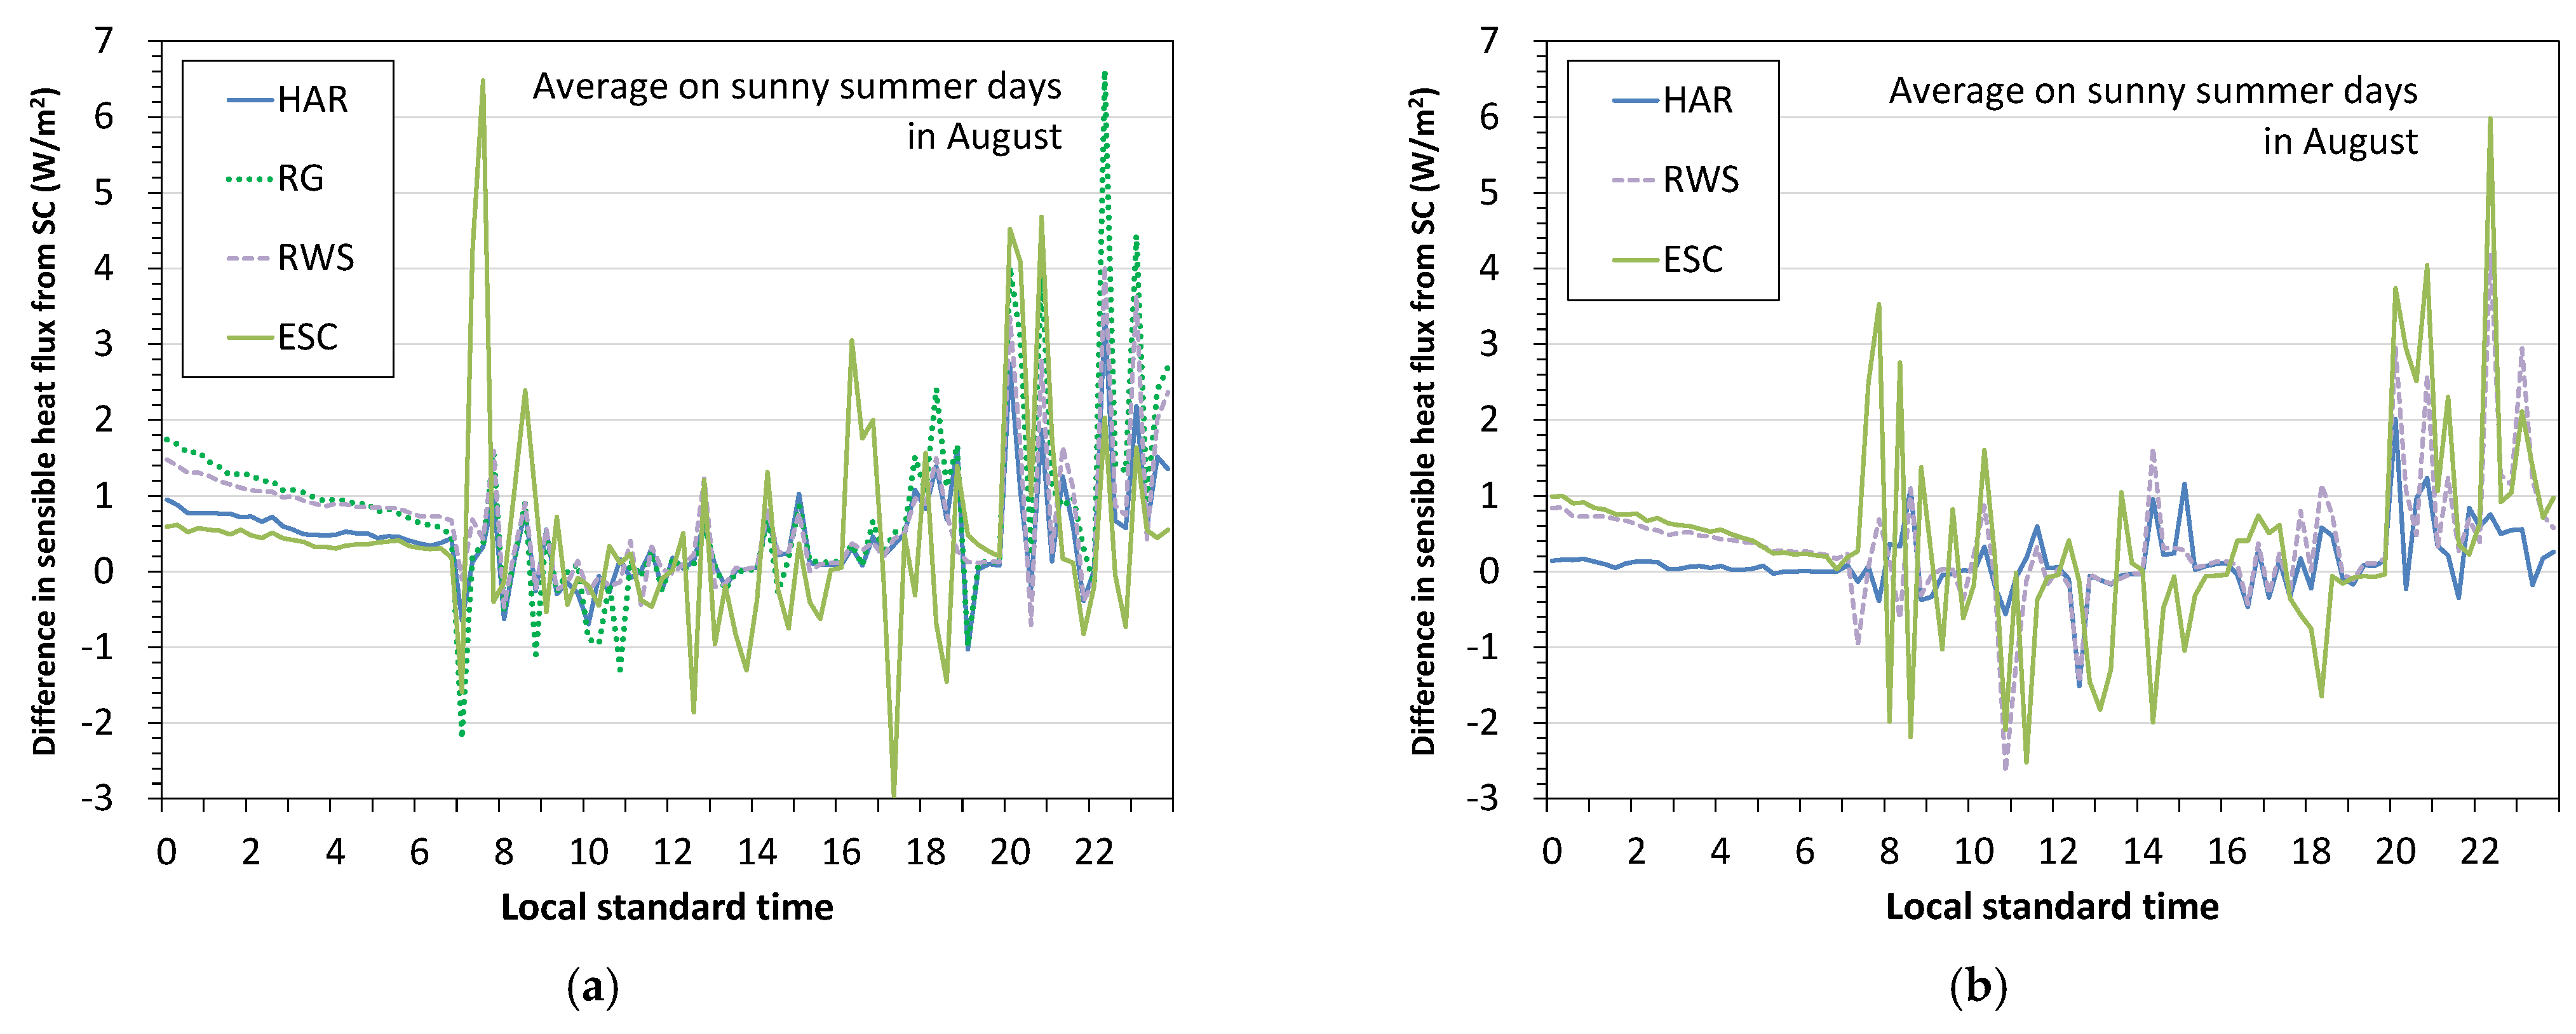
Figure 8 shows the effectiveness of countermeasures on heat release from a space conditioning system, showing heat release with each countermeasure minus heat release without countermeasures, averaging each hourly value over sunny days in August. Compared with the base condition, the heat release from space conditioning decreased for all countermeasures used with the reinforced concrete structure. The reduction rate for the whole day became largest with roof greening (RG), then roof water showering (RWS), evaporative space cooling (ESC), and high-albedo roof (HAR), in declining order. The reduction rate for the whole day for the wooden structure with low insulation level was the largest with evaporative space cooling, then roof water showering, and then high-albedo roof.
The reduction rate of roof greening was the largest, due to the improved insulation provided by installing the greening and soil layer. The reduction rate reached up to only 11%, so there was not much effect, especially in the daytime. Most countermeasures (except evaporative space cooling) were targeted at the roof, but the occupants were on the first floor when the space cooling load was relatively large compared to the nighttime, so the countermeasures were not effective. Moreover, because the outdoor air temperature was very high during the summer in Osaka, space conditioning was required even if countermeasures were implemented, and the duration of time the space conditioning was used could not be reduced. For that reason, the countermeasure was less effective. Although it was slight, the effect of evaporative space cooling exceeded that of roof water showering in the wooden structure. The wooden structure has a low thermal mass, so room air temperature tended to drop at night, and the effect of reducing cooling time of evaporative space cooling was relatively large. Figure 8 only shows the heat reduction from space conditioning, but because the fine jet fog sprayed can convert the sensible heat into latent heat, it is expected that a large heat reduction effect could be obtained with evaporative space cooling. Concerning the total number of hours of space conditioning operation during August by time of day, roof greening was the most effective. The reduction rate for the whole day and night was 28%; for the nighttime, it was 44%.
Figure 9 shows the effectiveness of countermeasures influencing heat release from the space conditioning system (with countermeasure minus without countermeasures), averaging each hourly value over sunny days in February. In both the reinforced concrete and wooden structures, the amount of heat absorbed from the roof surface decreased as a result of the high-albedo roof, and the amount of absorbed heat through the space conditioning increased slightly. In any case, the impact, including the withered roof greening, was negligible.

3.2.3. Water Heater System

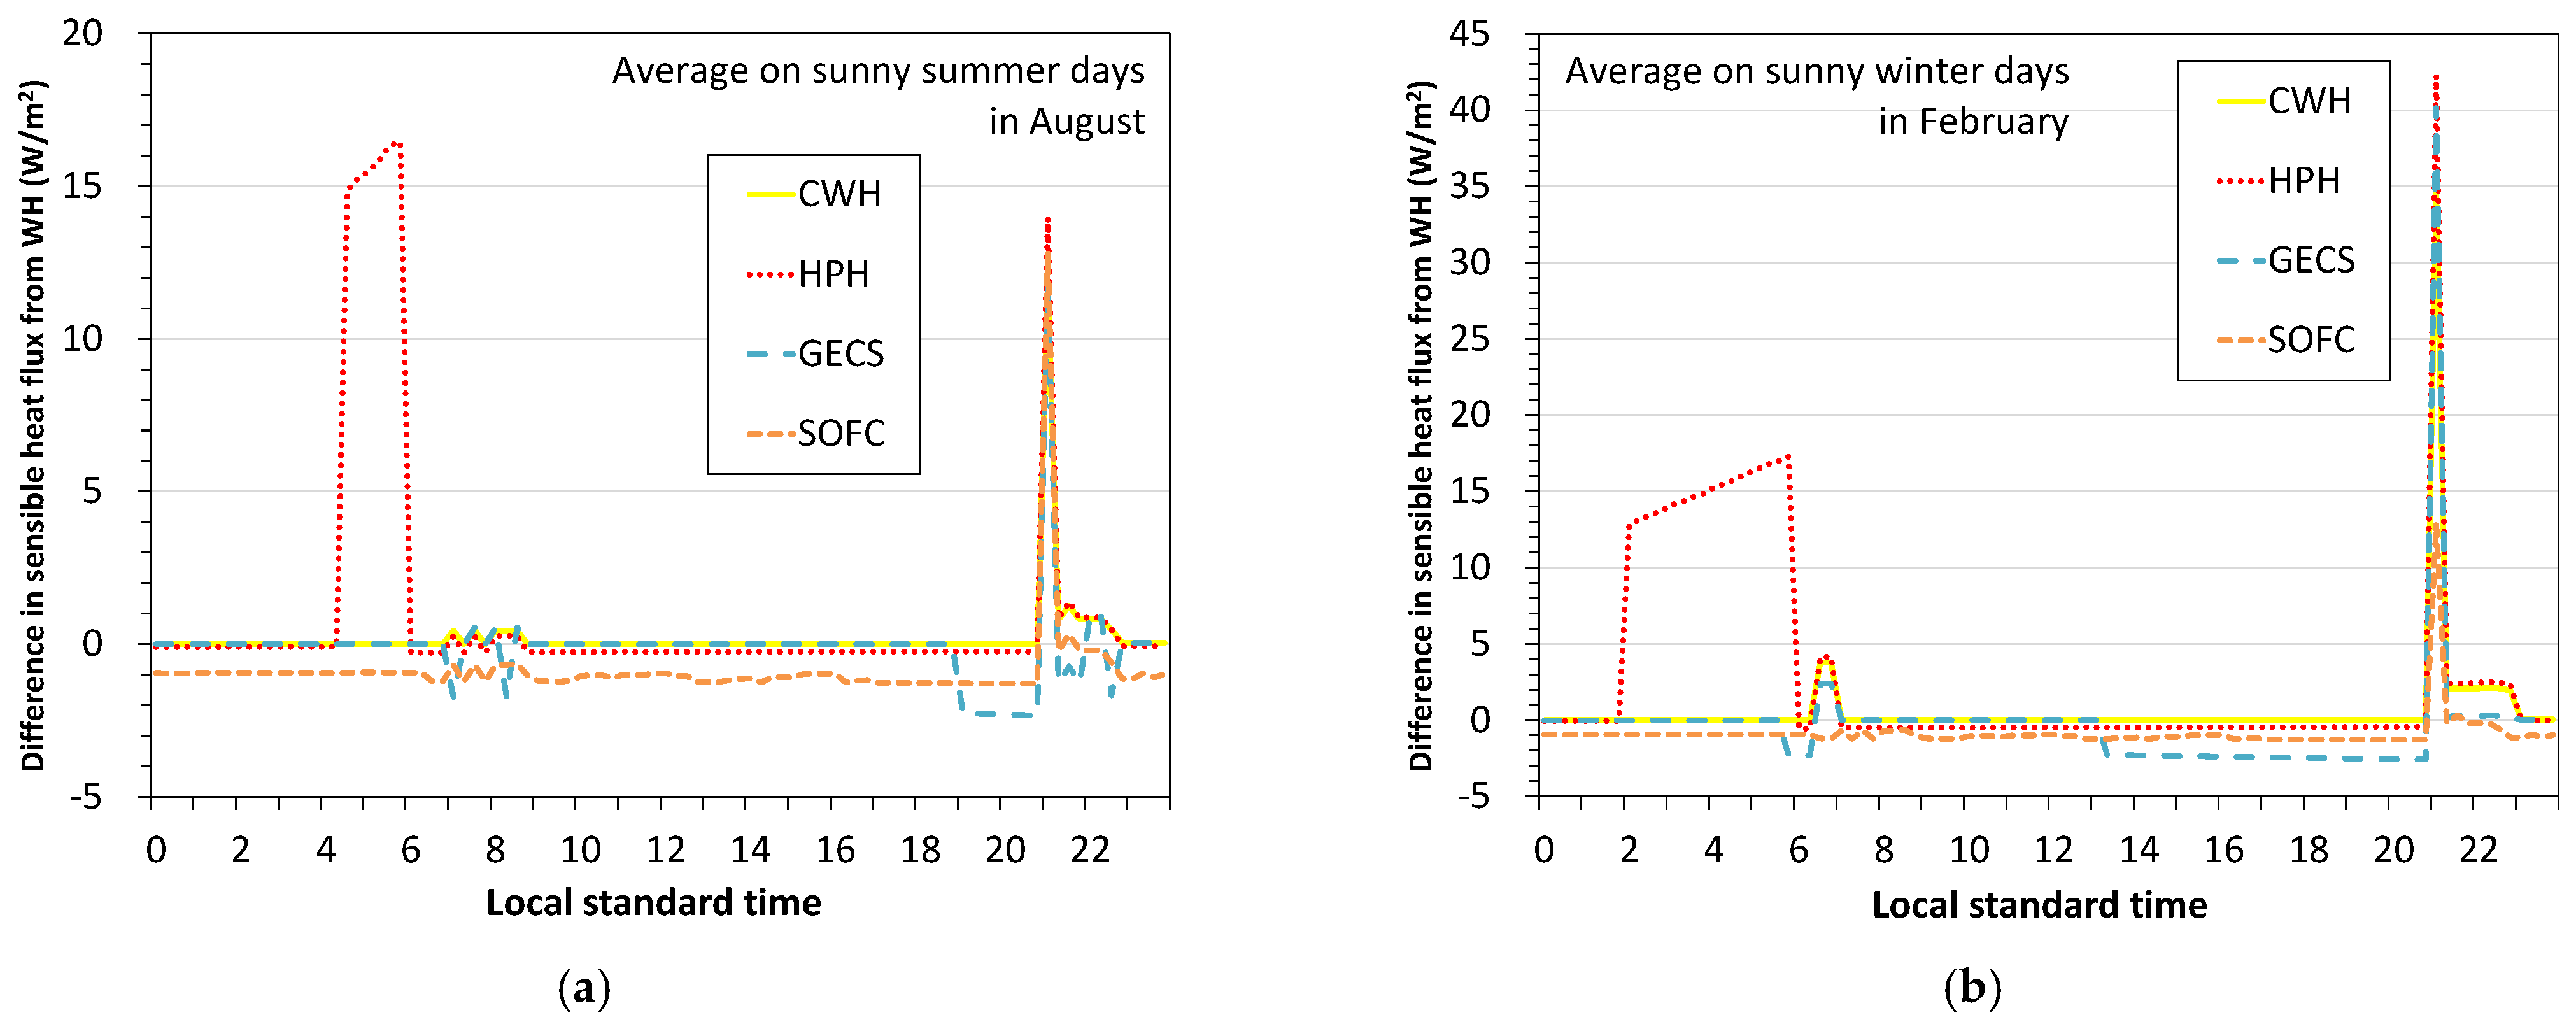
Figure 10ashows the result of the effectiveness of countermeasures on heat release from the water heating system (with countermeasure minus without countermeasures), averaging each hourly value over sunny days in August. Compared with the base condition, heat release from the water heating system decreased for heat pump water heater (HPH) and condensing water heater (CWH). The reduction rate for the whole day was larger for the heat pump water heater than for the condensing water heater. Since the heat pump absorbs and accumulates heat from the atmosphere, clearly a large reduction was seen around dawn, but a slight heat release from the hot water tank increased during the day. The condensing water heater always reduced heat loss by improving efficiency, but the effect was minimal.
Heat was always released during the operation of the gas engine cogeneration system (GECS) and solid oxide fuel cell (SOFC) equipment, so the heat release from the system was increased compared to the base condition. The solid oxide fuel cell without start/stop always generated heat release, but the gas engine cogeneration system operated in accordance with the heat demand generated heat release, especially during times with great heat demand. However, the effects for both were slightly small; neither system had a significant impact on the total heat release.
Figure 10b shows the result of the effectiveness of countermeasures on heat release from the water heating system (with countermeasure minus without countermeasures), averaging each hourly value over sunny days in February. As for the heat pump water heater, since the hot water demand was larger during winter than in summer, it influenced heat release more during the winter season. The number of hours the hot water system operates became greater due to an increased hot water demand (the absorbed heat started at around 2 a.m.). As for the gas engine cogeneration system, the effect of prolonged operation time was also seen. The temperature of the water being used rose during winter season, so the amount of heat released through the ventilation during that time also increased overall.

3.3. Performance Evaluation Concerning the Heat Release and Carbon Dioxide Emissions

3.3.1. Cooling Season

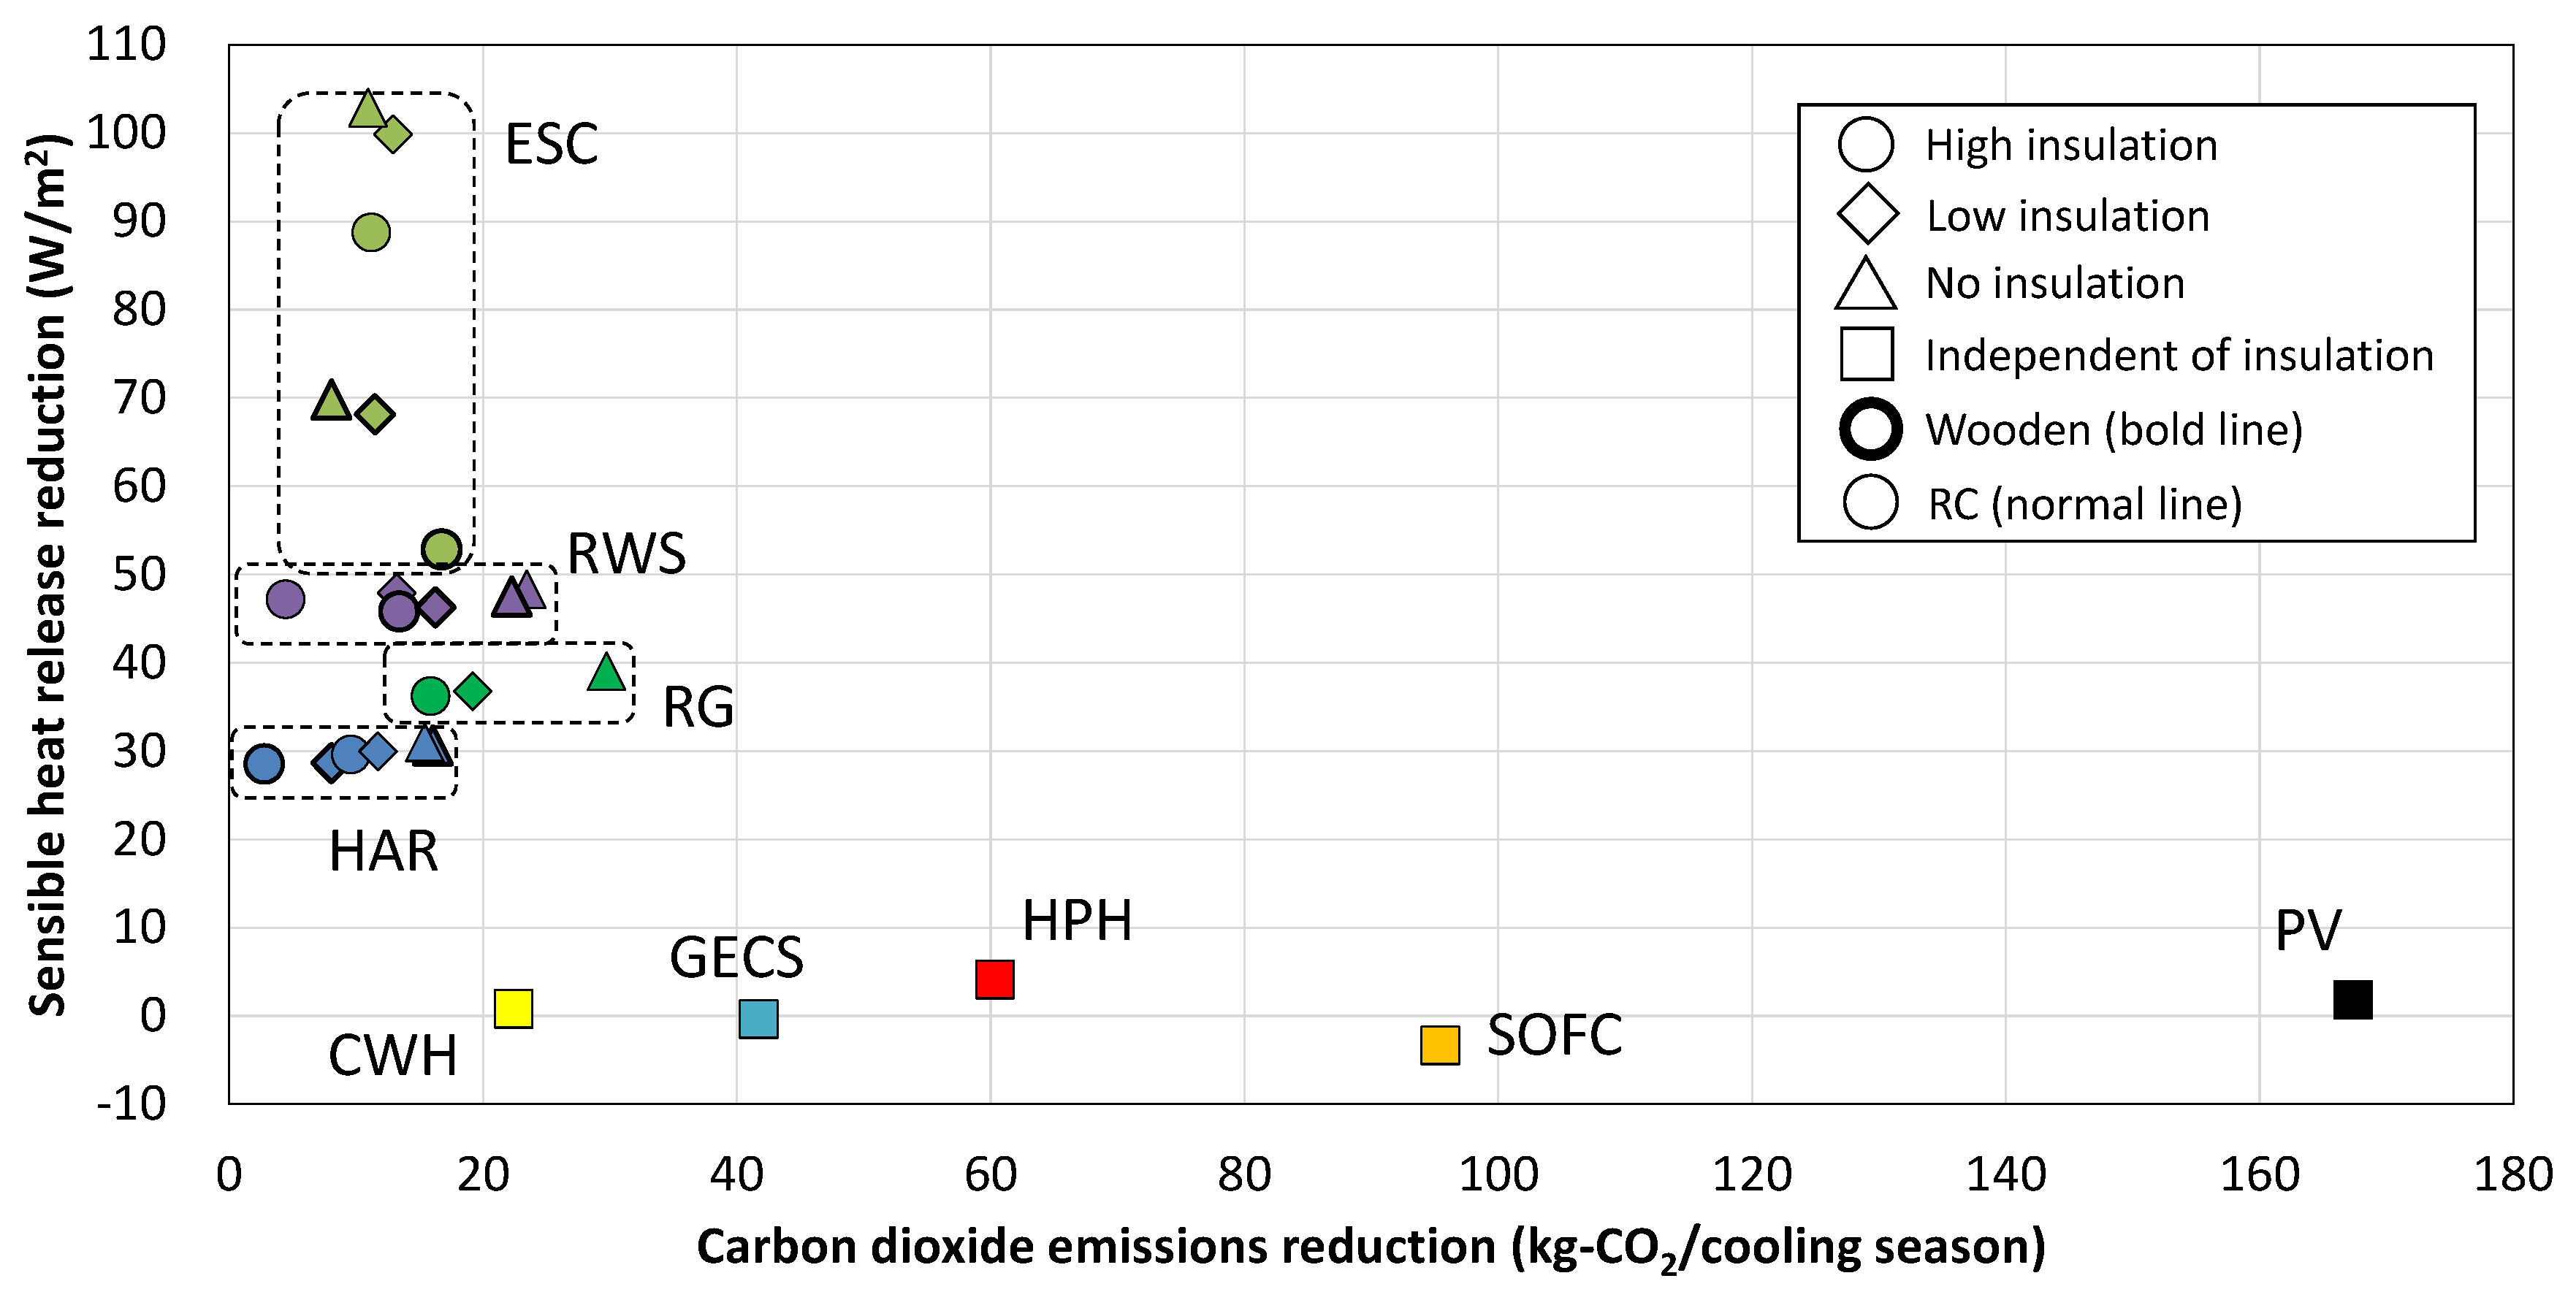
Figure 11 shows the relationship between the sensible heat release reduction and the CO2 emissions reduction by applying each countermeasure for the cooling season during daytime and nighttime. The plot color varies according to the evaluated countermeasures. This graph is helpful when considering UHIE and GW adaptation, as it offers the chance to examine both the amount of heat release and the amount of CO2 emissions, using the same calculation model. The reduction of sensible heat release (vertical axis) sums contributions from the envelope, space conditioning, and water heating per building area, and that sum is time averaged over sunny days in August. For the CO2 emissions (horizontal axis), the effects of UHIE countermeasures incorporate reduction of space conditioning energy only, while the effects of GW countermeasures incorporate energy reductions achieved by atmospheric heat absorption, power generation, waste heat utilization, and other factors. The value of the horizontal axis shows the reduction of total CO2 emissions during cooling season (from July to September). For photovoltaic power generation, all of the generated electric power can be available, and it is evaluated on the premise that the same amount of system power supply can be reduced.
Based on the results, the plots were roughly classified into two technology groups: (1) effective for heat release reduction and (2) effective for CO2 emissions reduction. No countermeasure served both ends. As mentioned above, evaporative space cooling (ESC) contributed most to the reduction of heat release, then roof water showering (RWS), roof greening (RG), and high-albedo roof (HAR). However, no GW countermeasure contributed considerably to heat release reduction. Although evaporative space cooling contributed the most to reduce the amount of time the space conditioning was used, the building structure and the insulation level also influenced the result significantly, because the amount of heat release reduction was dependent on the space conditioning time and load.
Among the GW countermeasures, photovoltaic power generation (PV) contributed most to reduce CO2 emissions, followed by solid oxide fuel cell (SOFC), heat pump water heater (HPH), gas engine cogeneration system (GECS), and condensing water heater (CWH), in order of reductions. Among the UHIE countermeasures, roof greening with no insulation level reduced CO2 emissions the most, although the reduction was almost the same compared with the gas engine cogeneration system and condensing water heater. Regarding the UHIE countermeasures, heat insulation and building structure somewhat influenced the CO2 emissions reductions, but they had no considerable influence on reducing heat release. Meanwhile, although some GW countermeasures (e.g., heat pump water heater) reduced the heat release, the amount of change was very small, and it was less than that of high-albedo roof, which was the least effective of the UHIE countermeasures. Some GW countermeasures (e.g., solid oxide fuel cell) increased the heat release, but the amount of change was very small as well.
During the day, the overall trend is roughly the same as it was in Figure 11, but the effect of evaporative space cooling, in particular, was considerably smaller. Evaporative space cooling is used as the substitute equipment for cooling, but because the thermal environmental condition is severe during the daytime, space conditioning is required because it is unpleasant to use only evaporative space cooling, so the effect is reduced. High-albedo roof was a more effective countermeasure than roof greening. Although it had little influence on GW countermeasures, photovoltaic power generation increased the amount of heat release, and heat pump water heater had almost no effect. At night, the effect of the evaporative space cooling was much larger. Unlike in the daytime, this was because the space conditioning is used many fewer hours when evaporative space cooling is used. The high-albedo roof was less effective than the evaporative space cooling. Regarding the GW countermeasures, photovoltaic power generation changed from increasing heat release to decreasing heat release, and heat pump water heater had a considerable effect.

3.3.2. Heating Season

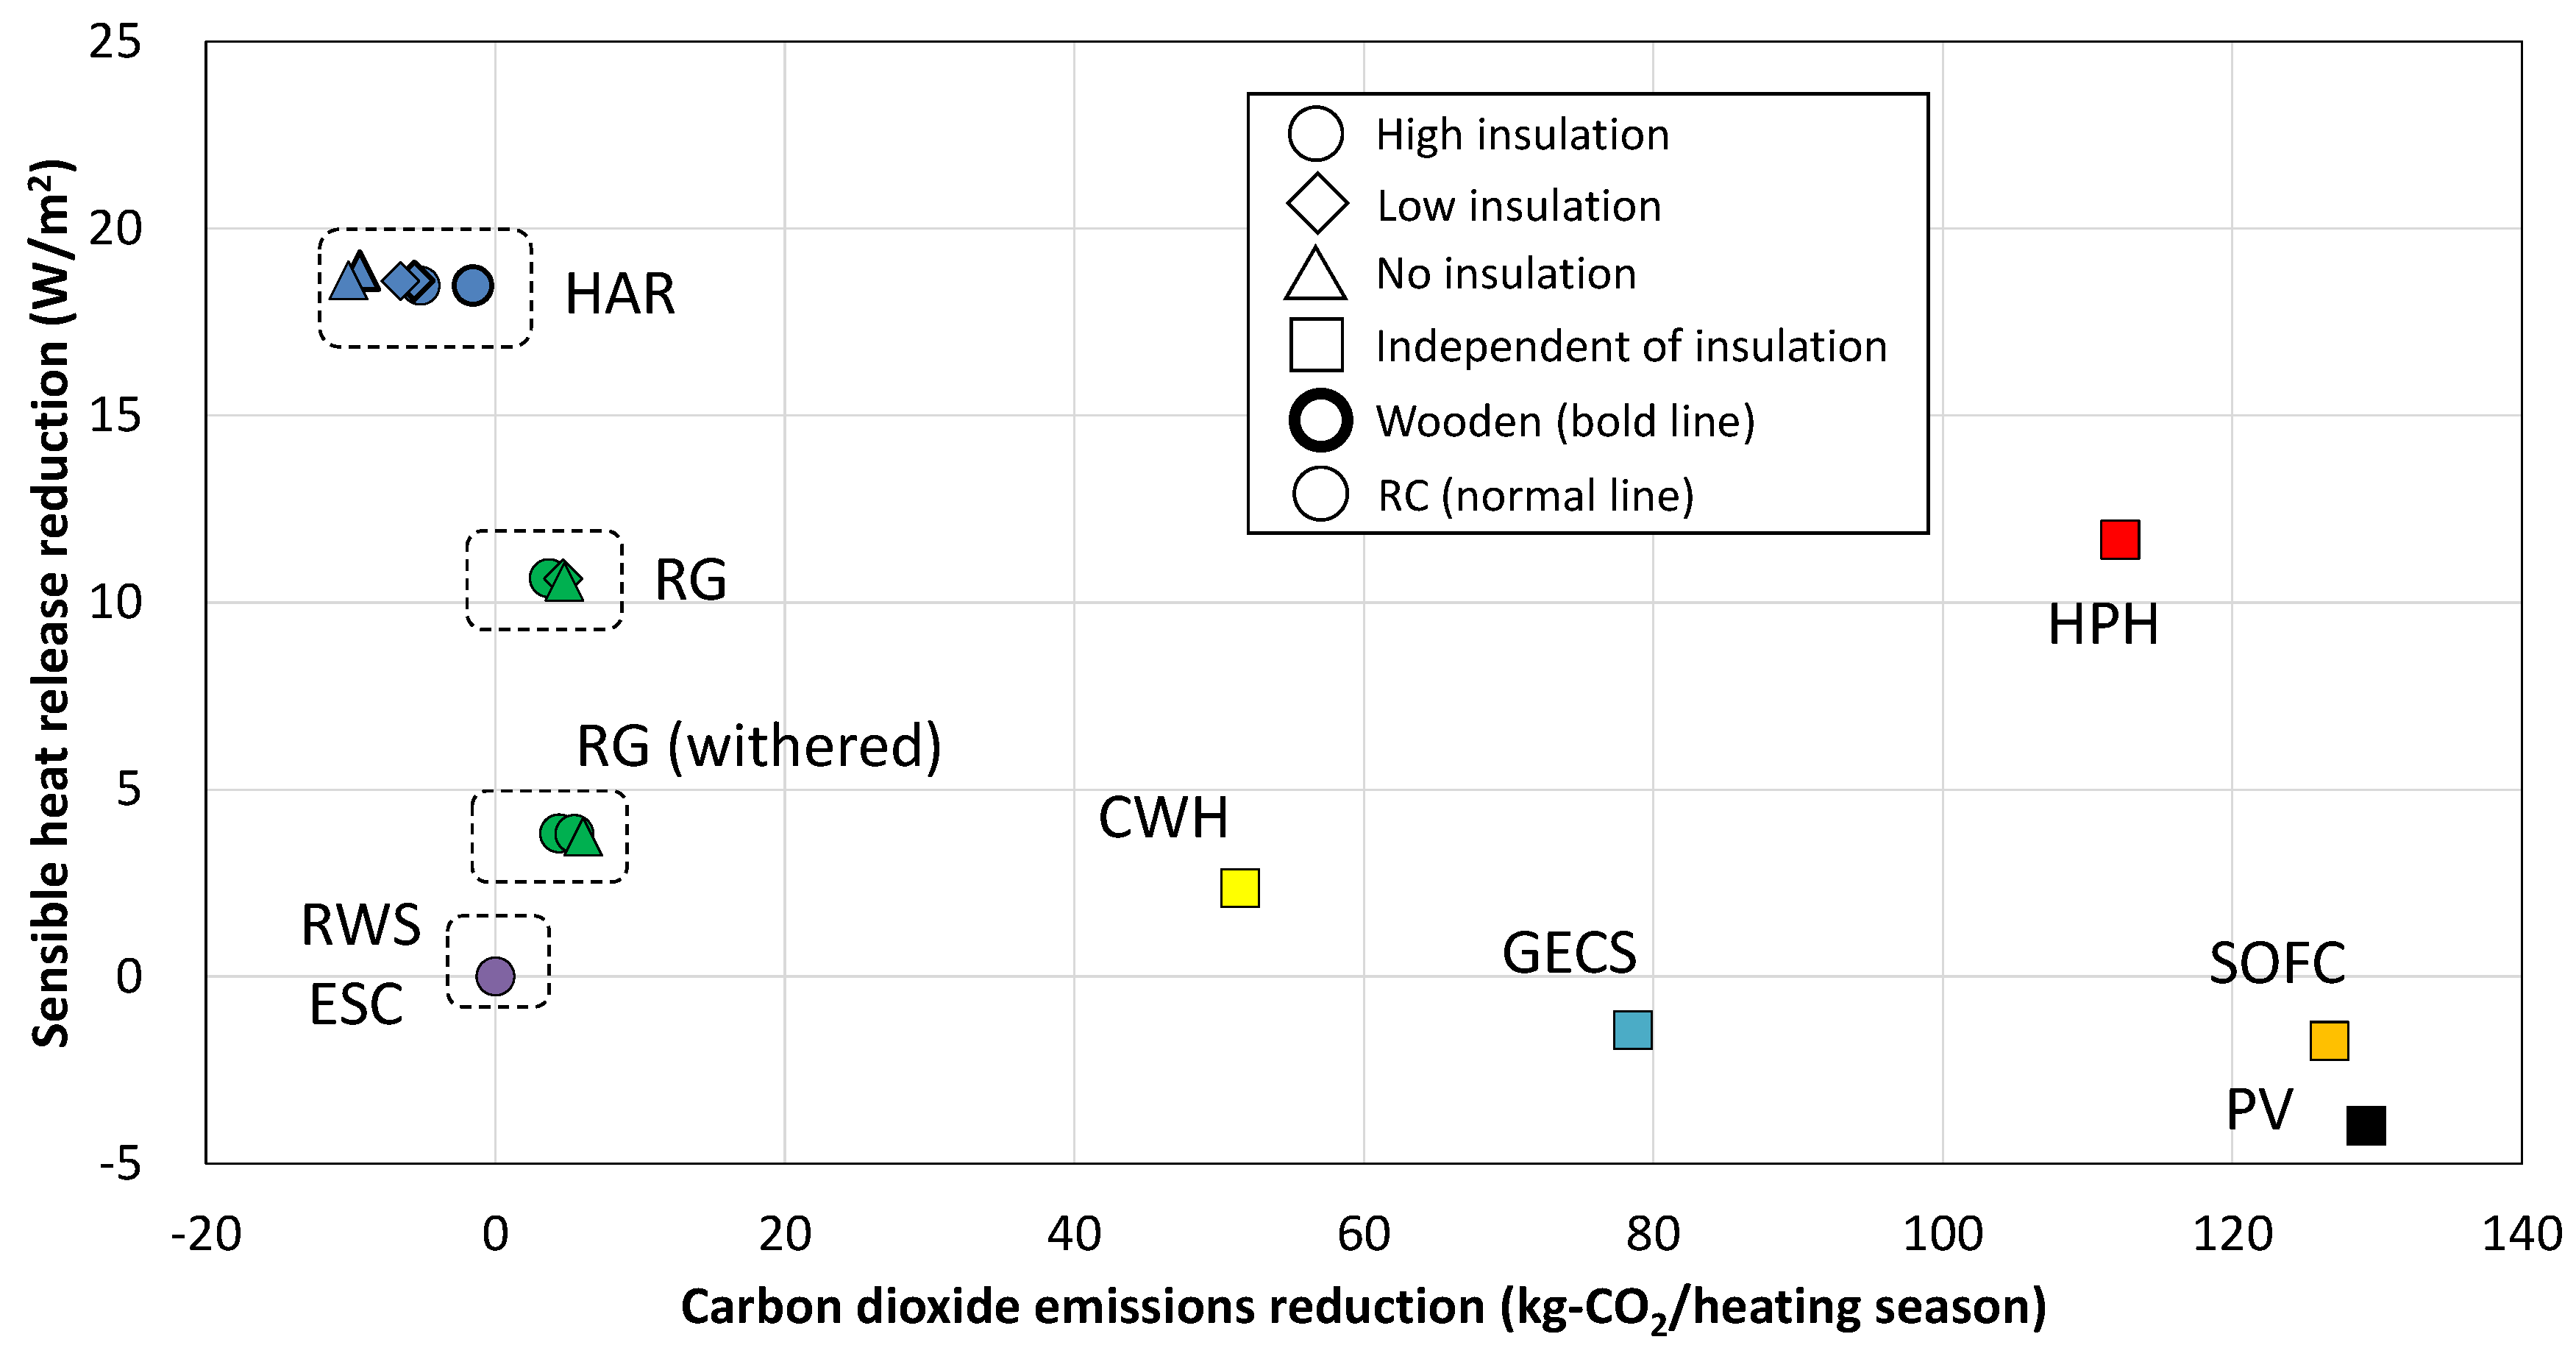
Figure 12 shows the relationship between the sensible heat release reduction and the CO2 emissions reduction by applying each countermeasure for the heating season during daytime and nighttime. The reduction of sensible heat release (vertical axis) is averaged over sunny days in February. The CO2 emissions (horizontal axis) show sum reductions over the heating season (from December to February). The meaning of the graph and its effectiveness are the same as those for the cooling season graph.
Based on the results, the plots were roughly classified into two groups: (1) effective for heat release reduction and (2) effective for CO2 emissions reduction, just as they were for the cooling season. However, only the heat pump water heater countermeasure reduced both heat release reduction and CO2 emissions. High-albedo roof contributed most to the reduction of heat release, followed by heat pump water heater, roof greening (withered), and condensing water heater. However, high-albedo roof increased CO2 emissions due to an increase in heating load. Since roof water showering and evaporative space cooling stopped operation in the heating season, they had no influence on heat release or CO2 emissions during heating season. Since the hot water demand was greater in winter, the water heating systems had greater influence in winter than in summer. Some GW countermeasures (e.g., photovoltaic power generation) increased the heat release. Since the overall trend is the same as it was in the cooling season, the result of separating during daytime and nighttime in winter season is omitted.
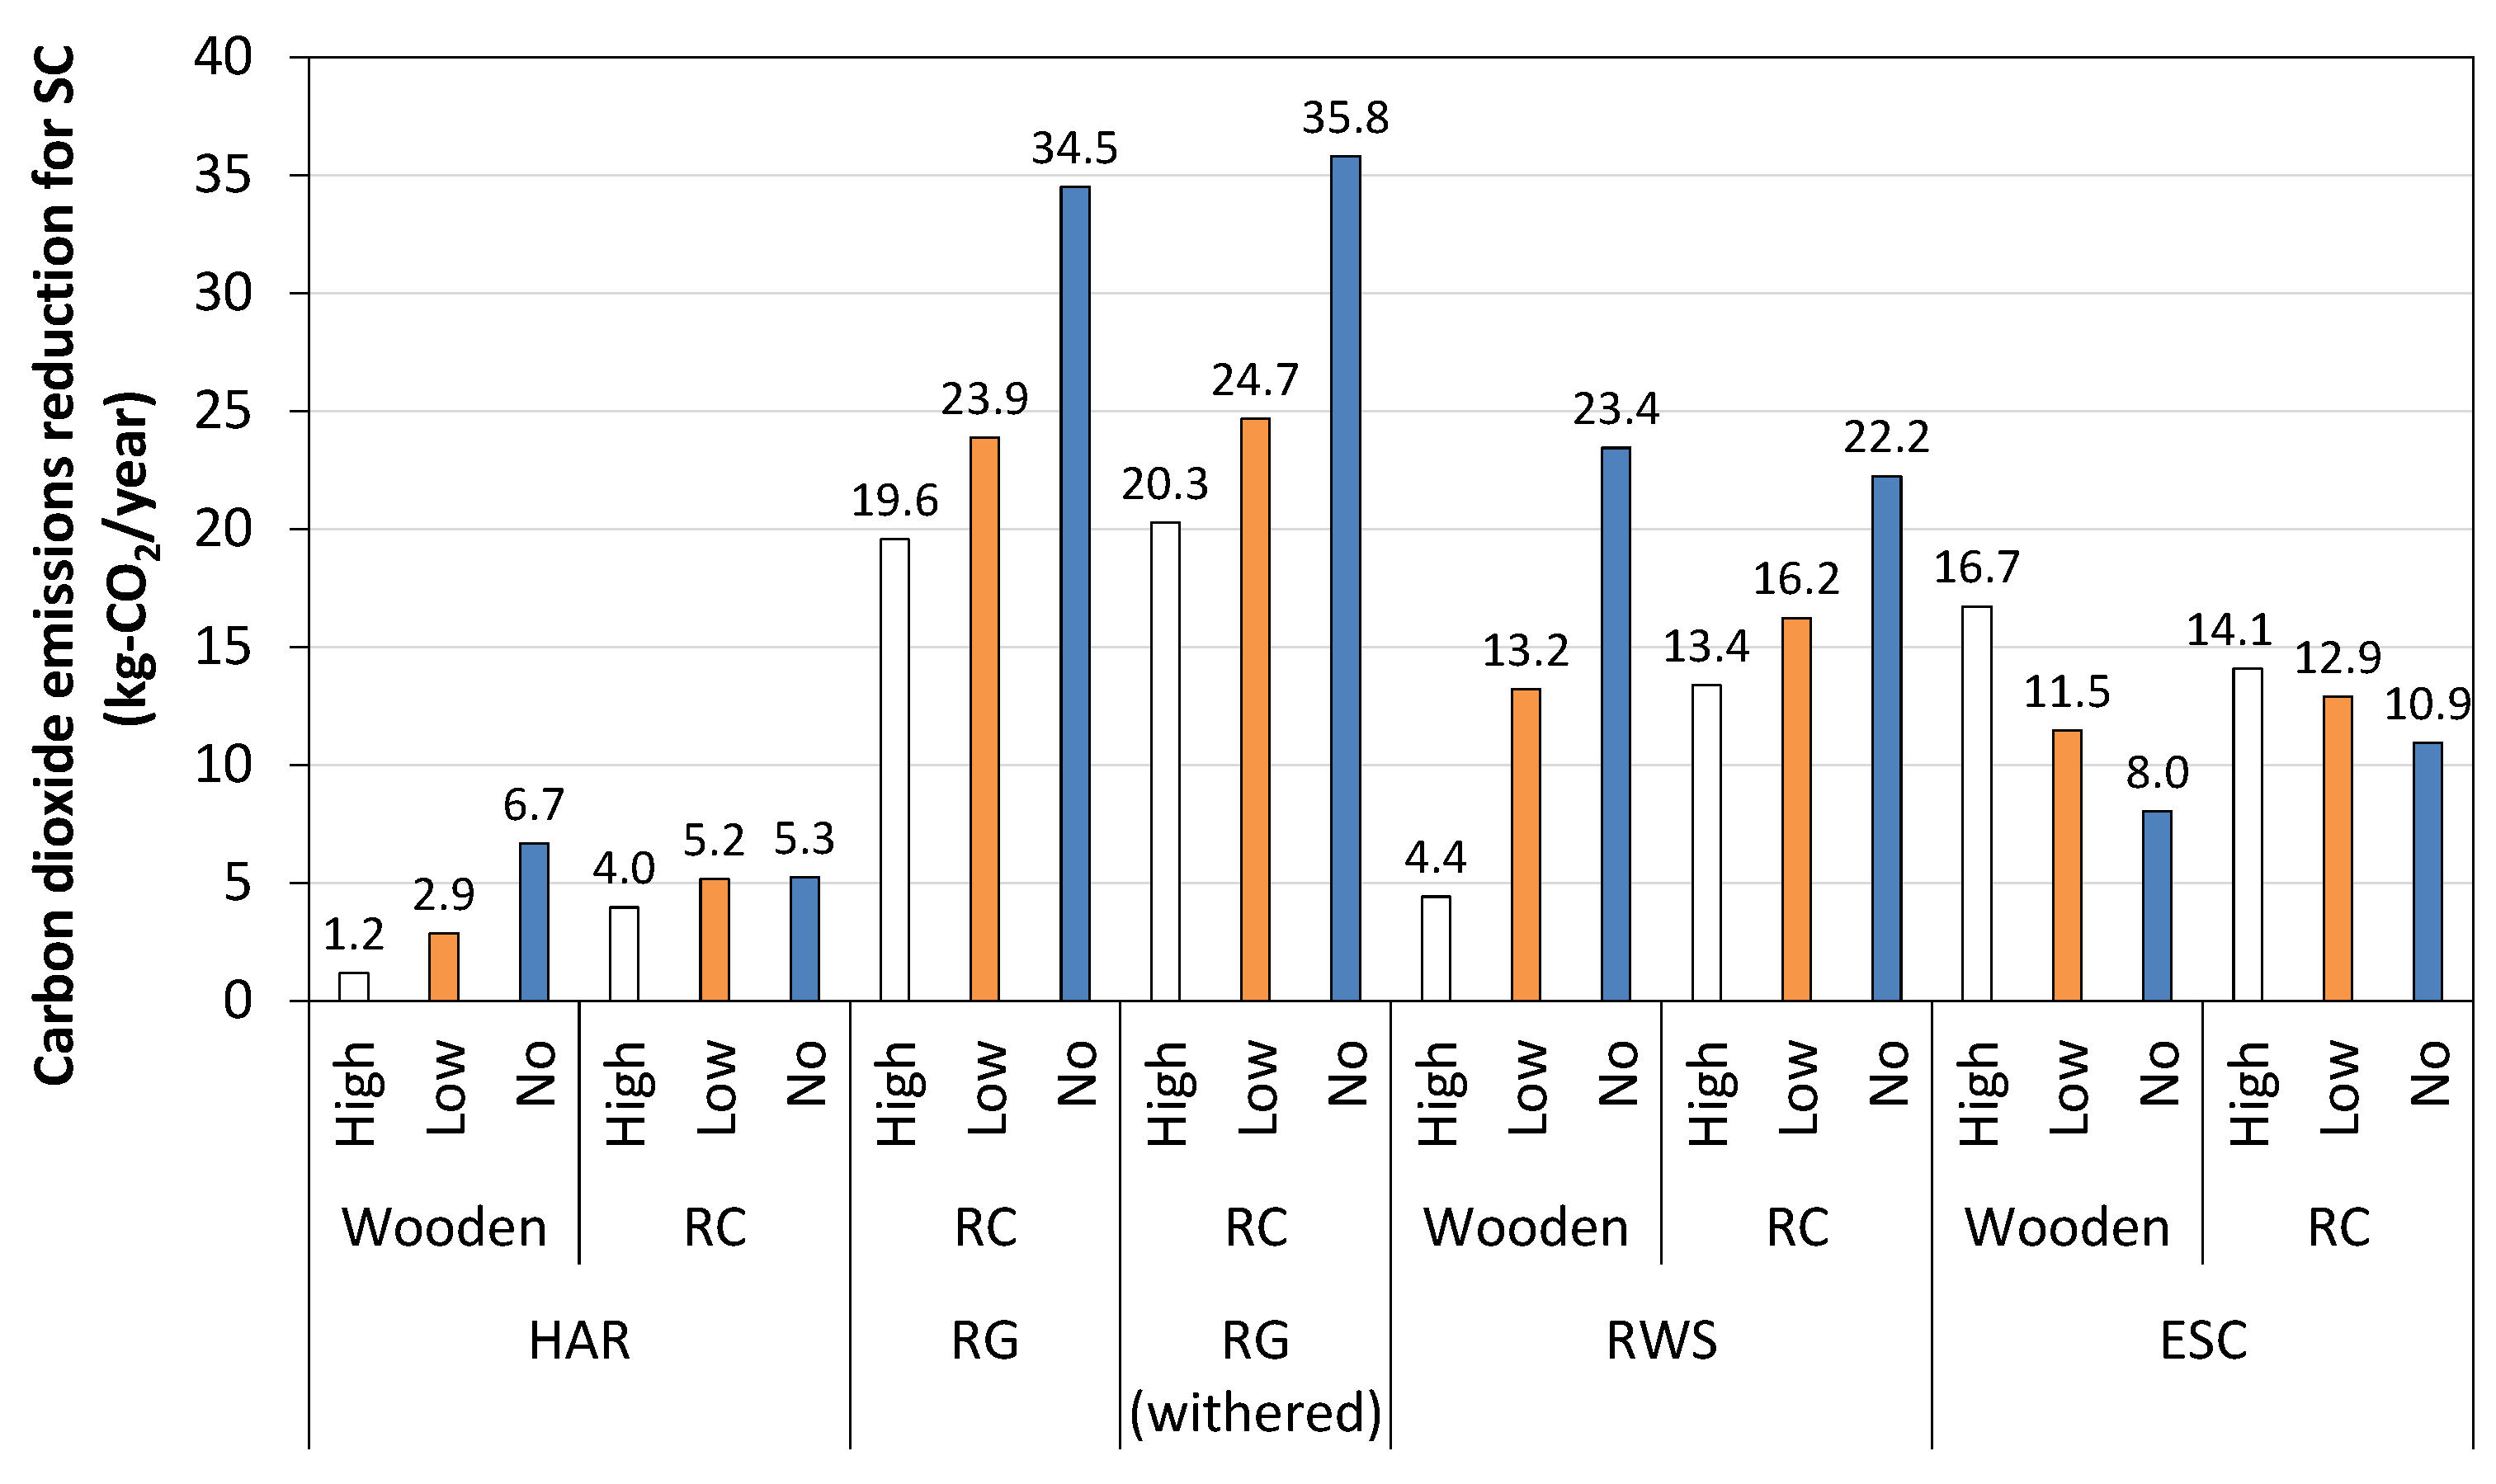
Figure 13 shows the annual reduction of CO2 emissions from space conditioning by applying the UHIE countermeasure. Roof water showering and evaporative space cooling were not operated during the heating season, so only benefits for the cooling season are shown. Since roof greening has merits throughout the year, the sums of benefits for the cooling and heating seasons are shown. As for high-albedo roof, there is a demerit in the heating season, so the offsets of benefits for the cooling season and demerits for the heating season are shown. As a result, roof greening achieved the largest reduction effect of CO2 emissions, followed by measures using water, such as roof water showering and evaporative space cooling. The effect of the high-albedo roof was positive but slight.

4. Discussion

Based on the results obtained up to Section 3.3, we propose some guidelines for designing a detached house that considers the benefits and impacts of both UHIE and GW. These are especially effective where summer temperature is high (like East or Southeast Asian countries).
For the cooling season, it is desirable to introduce measures to achieve both heat release and CO2 emissions reductions, but this study did not identify any measures that were very effective in both areas at the same time. Therefore, it is necessary to apply countermeasures for each purpose individually. It was shown that countermeasures using an evaporative cooling effect, such as evaporative space cooling and roof water showering, are desirable to reduce heat release. Countermeasures such as photovoltaic power generation and solid oxide fuel cell are effective in reducing CO2 emissions. The UHIE countermeasure that can reduce CO2 emissions the most is roof greening with no insulation; in fact, this can reduce CO2 emissions more than condensing water heater. Regarding UHIE countermeasures for the envelope surface, it was shown that the heat insulation level of the building greatly affects the CO2 emissions reduction, but not the heat release reduction. A difference in the heat release reduction was seen between the insulation levels only in the case of evaporative space cooling. A larger heat release reduction effect was obtained with the low insulation level due to the long use time of evaporative space cooling.
For the heating season, only the heat pump water heater countermeasure had effects on both heat release reduction and CO2 emissions, so the heat pump water heater is positioned as an effective countermeasure to reduce both heat release and CO2 emissions. However, although heat pump water heaters are effective in reducing CO2 emissions, it is counterproductive to reduce heat release in the winter season. Moreover, high-albedo roofs should not be adopted as much as measures such as roof greening and roof water showering in Japan because the heat release from high-albedo roofs is greater than the heat releases from roof greening and roof water showering during the heating season. However, from the results shown in Figure 13, since the winter penalty does not exceed the summer merit, it is not a countermeasure that should be avoided. In this regard, countermeasures that use water, such as evaporative space cooling and roof water showering, can stop during winter, so there is an advantage in that they do not affect the amount of heat release and CO2 emissions in winter at all.
These results show that the water-using UHIE countermeasures (such as evaporative space cooling or roof water showering) can provide positive effects during the cooling season and no negative effects during the heating season. Although roof greening reduces the amount of heat release slightly in the heating season, it has the most potential to reduce CO2 emissions due to changes in space conditioning. However, since their effects on reducing CO2 emissions are not very significant, it is desirable to introduce GW countermeasures such as solid oxide fuel cells and photovoltaic power generation, which significantly effect CO2 emissions reduction.
As described above, we have provided guidelines that take into consideration the benefits and impacts of both UHIE and GW. However, it is necessary to show the constraints on the results obtained in this study.
First of all, the examined area, Osaka, has a particularly high temperature in summer, but also a very large demand for heating in winter. Therefore, UHIE countermeasures chosen for Osaka must avoid negative effects (overcooling) in winter. However, winter penalties are less important in the other regions such as the West Coast of the United States, East Asia, and Australia, where the weather is warm throughout the year. It is necessary to clearly indicate that the guidelines presented in the current study are suitable for weather conditions like Japan where the four seasons are distinct. In addition, there are differences in lifestyles of the people around the world. For example, in Japan, people often take baths every day, so the demand for hot water supply is greater than in other countries. Moreover, in this study, we have simulated assuming a four-person household, but differences in family composition greatly affect the amount of energy consumption and time patterns. For example, in households of young, single persons, who are often absent during the daytime, the effect of high-reflection material is expected to be particularly small because space conditioning would not be operated when a home is unoccupied.
Regarding the restrictions of the model constructed in this study, as described in Section 2, this model uses the empirical formula of Jurges [41]. This formula is a model customarily used in the field of building environmental engineering as the convective heat transfer coefficient from the indoor and outdoor walls to the surrounding atmosphere. This formula is related to heat transfer on a single horizontal plane, so this model is not sufficient to evaluate heat transfer from complex exterior surfaces of the building. In assessing the absolute amount of flux reduction and its impact on the ambient temperature in the future, it is desirable to make an evaluation considering the complexity of the airflow around the buildings [53]. In regard to this issue, this study assumed a space with no other buildings around. However, in general, there are various buildings in the surroundings, and the above-mentioned complicated airflow and radiant environment with surrounding buildings affect heat release from the building surface and energy consumption in the building. It should be noted that the simulation of this study has been carried out without assuming such conditions. In the future, it is necessary to extend to a calculation model that can assume urban blocks using a convective heat transfer coefficient that takes into account the complex airflow around the building.
Finally, regarding the area and period to be evaluated in this study, Sangiorgio et al. [54] showed that not only the land cover but also various parameters such as population density, spatial geometry, and daily weather conditions influence the heat island intensity. The current study evaluates the heat release and energy consumption in a single standard detached house on a representative sunny day, as well as the effects of various countermeasure technologies. However, since the effects are likely to vary with the above parameters, these guidelines could be made more versatile by simulating other regions with varying urban geometries, densities, and climates.

5. Conclusions

In this study, through an examination using the SCIENCE-Outdoor simulation model, we quantified the effect of urban heat island (UHIE) countermeasures and global warming (GW) countermeasures on heat release and CO2 emissions, and we investigated various features of countermeasures related to buildings. This study’s purpose was to evaluate various technologies for their potential to mitigate UHIE and GW and then to propose their proper implementation. The results of this research are described below.
(1)
We constructed the SCIENCE-Outdoor model for evaluating UHIE countermeasures and GW countermeasures. This model can evaluate the thermal condition of building envelope surfaces, both inside and outside, and consists of the three submodels: (a) radiant, (b) inside thermal environment, and (c) outside heat release.
(2)
The maximum heat release rate for a wooden detached house with a low insulation level, on a representative sunny summer day for the base condition (no countermeasures), was 180 W/m2. The breakdown of the cumulative daily heat was almost all from the envelope surface, accounting for about 87% of the total. The anthropogenic heat was very slight: space conditioning accounted for 12% and the water heating system accounted for only 1%.
(3)
Concerning the effectiveness of countermeasures influencing the heat from envelope surface, the reduction rate of heat release for day and nighttime was largest with roof water showering, then roof greening, and then high-albedo roof in the cooling season.
(4)
Concerning the effectiveness of countermeasures influencing the heat from space conditioning, the reduction rate for day and nighttime was largest with roof greening, then roof water showering, then evaporative space cooling, and then high-albedo roof in the cooling season. In the heating season, the amount of absorbed heat through the space conditioning increased slightly under the high-albedo roof countermeasure.
(5)
The effectiveness of countermeasures influencing the heat from the water heating system decreased for heat pump water heaters and condensing water heaters but increased for gas engine cogeneration systems and solid oxide fuel cells in the cooling season. During the heating season, hot water demand rose, so water heating had a greater influence than in the cooling season.
(6)
As the result of evaluating the relationship between heat release reduction and CO2 emissions reduction, and by applying each countermeasure for the cooling season, the plots were roughly classified into two technology groups: those effective for heat release reduction and those effective for CO2 emissions reduction.
(7)
As the result of evaluating the same relationship used for the heating season, the plots were roughly classified into the same two groups as those for the cooling season, but only the heat pump water heater countermeasure was found to effect heat release reduction and CO2 emissions reduction.
(8)
The results showed that it is best to introduce water-using countermeasures (evaporative space cooling and roof water showering), which can provide positive effects during summer but no negative effects during winter, to plan for UHIE and GW considerations. However, since water-based countermeasures do not significantly reduce CO2 emissions, it is desirable to introduce GW countermeasures such as solid oxide fuel cell and photovoltaic power generation that substantially decrease CO2 emissions.
This study modeled a detached house in Osaka, Japan. Since results will vary with building construction, building operation, building equipment, and climate, it is difficult to make a final judgment on the superiority or inferiority of countermeasures to be adopted in the future based on this study’s research results. However, further studies should recognize that it is important to evaluate both heat release and CO2 emissions with the same model. The significance of this study is that it constructed the simulation model and showed the influence of countermeasures upon both heat release and CO2 emissions. The results can be used when considering the implementation of urban and regional building planning that is considering UHIE and GW adaptation by examining the amount of both heat release and CO2 emissions. Potential tasks for future study include establishing a database that supports selection of countermeasures, targeting further countermeasures, evaluating the impact of local climate characteristics, and evaluating the impacts of building use or size.

Author Contributions

Conceptualization, Y.S. and D.N.; methodology, validation, investigation, and data curation, D.N.; writing—original draft preparation, D.N.; writing—review and editing, R.L.; supervision, Y.S. and R.L.; funding acquisition, D.N. and R.L. All authors have read and agreed to the published version of the manuscript.

Funding

This work was supported by JSPS KAKENHI Grant Number JP18KK0123. It was also supported by the Assistant Secretary for Energy Efficiency and Renewable Energy, Building Technologies Office of the U.S. Department of Energy under Contract No. DE-AC02-05CH11231.

Institutional Review Board Statement

Not applicable.

Informed Consent Statement

Not applicable.

Data Availability Statement

Data sharing not applicable.

Conflicts of Interest

The authors declare no conflict of interest.

References

  1. Japan Meteorological Agency. Climate Change Monitoring Report 2016; Chapter 2 Climate Change; Japan Meteorological Agency: Tokyo, Japan, 2017. [Google Scholar]
  2. Japan Meteorological Agency. Global Warming Forecast Information; Global Warming Forecast Information; Japan Meteorological Agency: Tokyo, Japan, 2017; Volume 9. [Google Scholar]
  3. Narumi, D.; Niurao, Y.; Shimoda, Y.; Mizuno, M. Effects of increasing temperature on the regional energy consumption in Osaka Pref. J. Environ. Eng. Trans. AIJ 2007, 72, 71–78. [Google Scholar] [CrossRef]
  4. Santamouris, M.; Papanikolaou, N.; Livada, I.; Koronakis, I.; Georgakis, C.; Argiriou, A.; Assimakopoulos, D.N. On the impact of urban climate on the energy consuption of building. Sol. Energy 2001, 70, 201–216. [Google Scholar] [CrossRef]
  5. Fujii, H.; Fukuda, S.; Narumi, D.; Ihara, T.; Watanabe, Y. Fatigue and sleep under large summer temperature differences. Environ. Res. 2015, 138, 17–21. [Google Scholar] [CrossRef]
  6. Narumi, D.; Ihara, T.; Fukuda, S. Study on the impact for sleep disturbance due to changing urban outdoor temperature. AIJ J. Technol. Des. 2016, 52, 1045–1048. [Google Scholar] [CrossRef] [Green Version]
  7. Narumi, D.; Kondo, A.; Shimoda, Y. The effect of the increase in urban temperature on the concentration of photochemical oxidants. Atmos. Environ. 2009, 43, 2348–2359. [Google Scholar] [CrossRef]
  8. Sarrat, C.; Lemonsu, A.; Masson, V.; Guedalia, D. Impact of urban heat island on regional atmospheric pollution. Atmos. Environ. 2006, 40, 1743–1758. [Google Scholar] [CrossRef]
  9. Kiyokawa, Y.; Narumi, D. Regional and secular characteristics on temperature sensitivity of power supply. J. Environ. Eng. Trans. AIJ 2018, 83, 1015–1024. [Google Scholar] [CrossRef]
  10. Narumi, D.; Ihara, T.; Fukuda, S.; Shimoda, Y. Comprehensive evaluation of the influence of outdoor temperature change on human health around the urban area. J. Environ. Eng. Trans. AIJ 2019, 84, 205–214. [Google Scholar] [CrossRef]
  11. Shimoda, Y.; Narumi, D.; Mizuno, M. Environmental impact of urban heat island phenomena—Cause-effect chain and evaluation in Osaka City. J. Life Cycle Assess. Jpn. 2005, 1, 144–148. [Google Scholar] [CrossRef] [Green Version]
  12. Franco, G.; Sanstad, A.H. Climate change and electricity demand in California. Clim. Chang. 2008, 87, 139–151. [Google Scholar] [CrossRef]
  13. Hirano, Y.; Fujita, T. Evaluation of the impact of the urban heat island on residential and commercial energy consumption in Tokyo. Energy 2012, 37, 371–383. [Google Scholar] [CrossRef]
  14. Sailor, D.J. Relating residential and commercial sector electricity loads to climate—Evaluating state level sensitivities and vulnerabilities. Energy 2001, 26, 645–657. [Google Scholar] [CrossRef]
  15. Santamouris, M.; Cartalis, C.; Synnefa, A.; Kolokotsa, D. On the impact of urban heat island and global warming on the power demand and electricity consumption of buildings—A review. Energy Build. 2015, 98, 119–124. [Google Scholar] [CrossRef]
  16. Ashie, Y.; Tokairin, T.; Kono, T. High resolution numerical simulation on the urban heat island in a ten-kilometer square area of central Tokyo by using the earth simulator. J. Environ. Eng. Trans. AIJ 2007, 72, 67–74. [Google Scholar] [CrossRef] [Green Version]
  17. Ichinose, T.; Shimodozono, K.; Hanaki, K. Impact of anthropogenic heat on urban climate in Tokyo. Atmos. Environ. 1999, 33, 3897–3909. [Google Scholar] [CrossRef]
  18. Kondo, H.; Tokairin, T.; Kikegawa, Y. Calculation of wind in a Tokyo urban area with a mesoscale model including a multi-layer urban canopy model. J. Wind Eng. Ind. Aerodyn. 2008, 96, 1655–1666. [Google Scholar] [CrossRef]
  19. Narumi, D.; Kondo, A.; Shimoda, Y. Effects of anthropogenic heat release upon the urban climate in a Japanese megacity. Environ. Res. 2009, 109, 421–431. [Google Scholar] [CrossRef]
  20. Chen, F.; Dudhia, J. Coupling an advanced land surface–hydrology model with the Penn State–NCAR MM5 modeling system. Part I: Model implementation and sensitivity. Mon. Weather Rev. 2001, 129, 569–585. [Google Scholar] [CrossRef] [Green Version]
  21. Skarmaeock, W.C.; Klemp, J.B.; Dudhia, J.; Gill, D.O.; Barker, D.M.; Wang, W.; Powers, J.G. A Description of the Advanced Research WRF Version 2; NCAR Techniacal Note TN-468+STR; Defense Technical Information Center: Fort Belvoir, VA, USA, 2005; p. 88. [Google Scholar]
  22. Akbari, H.; Konopacki, S. Energy effects of heat-island reduction strategies in Toronto, Canada. Energy 2004, 29, 191–210. [Google Scholar] [CrossRef] [Green Version]
  23. Ohashi, Y.; Ihara, T.; Kikegawa, Y.; Sugiyama, N. Numerical simulations of influence of heat island countermeasures on outdoor human heat stress in the 23 wards of Tokyo, Japan. Energy Build. 2016, 114, 104–111. [Google Scholar] [CrossRef]
  24. Sailor, D.J.; Dietsch, N. The urban heat island Mitigation Impact Screening Tool (MIST). Environ. Model. Softw. 2007, 22, 1529–1541. [Google Scholar] [CrossRef] [Green Version]
  25. Santamouris, M. Cooling the cities—A review of reflective and green roof mitigation technologies to fight heat island and improve comfort in urban environments. Sol. Energy 2014, 103, 682–703. [Google Scholar] [CrossRef]
  26. Shimoda, Y.; Yamaguchi, Y.; Okamura, T.; Taniguchi, A.; Yamaguchi, Y. Prediction of greenhouse gas reduction potential in Japanese residential sector by residential energy end-use model. Appl. Energy 2010, 87, 1944–1952. [Google Scholar] [CrossRef]
  27. Iwata, T.; Kuwasawa, Y.; Murakami, S.; Ikaga, T. Study on Scenarios towards Low Carbon Society in Residential Sector. J. Environ. Eng. Trans. AIJ 2011, 76, 839–846. [Google Scholar] [CrossRef] [Green Version]
  28. Wakiyama, T.; Kuromochi, T. Scenario analysis of energy saving and CO2 emissions reduction potentials to ratchet up Japanese mitigation target in 2030 in the residential sector. Energy Policy 2017, 103, 1–15. [Google Scholar] [CrossRef]
  29. Hirano, Y.; Ihara, T.; Gomi, K.; Fujita, T. Simulation-Based Evaluation of the Effect of Green Roofs in Office Building Districts on Mitigating the Urban Heat Island Effect and Reducing CO2 Emissions. Sustainability 2019, 11, 2055. [Google Scholar] [CrossRef] [Green Version]
  30. Yamaguchi, K.; Yamada, K.; Masumura, H.; Endo, Y.; Ihara, T. Evaluation for heat island mitigation potential of air source heat pump water heaters. In Proceedings of the Renewable Energy 2010 Conference and Exhibition, Berlin, Germany, 22–24 November 2010. [Google Scholar]
  31. Genchi, Y.; Ishisaki, M.; Ohashi, Y.; Kikegawa, Y.; Takahashi, H.; Inaba, A. Impacts of large scale photovoltaic panel installation on the heat island effect in Tokyo. In Proceedings of the 5th International Conference on Urban Climatology, Lodz, Poland, 1–5 September 2003; pp. 1–4. [Google Scholar]
  32. Ihara, T.; Kikegawa, Y.; Asahi, K.; Genchi, Y.; Kondo, H. Changes in year-round air temperature and annual energy consumption in office building areas by urban heat-island countermeasures and energy-saving measures. Appl. Energy 2008, 85, 12–25. [Google Scholar] [CrossRef]
  33. Onishi, J.; Takeya, N.; Mizuno, M. Study on numerical prediction methods for indoor air-flow and thermal environments Part 1 calculation procedures used in the simulation code “SCIENCE”. Trans. Soc. Heat. Air-Cond. Sanit. Eng. Jpn. 1995, 20, 23–34. [Google Scholar] [CrossRef]
  34. Habara, H.; Narumi, D.; Kobayashi, S.; Shimoda, Y.; Mizuno, M. Development of a method to estimate indoor thermal condition and air conditioning energy consumption in residential house using natural ventilation. J. Environ. Eng. Trans. AIJ 2004, 69, 107–114. [Google Scholar] [CrossRef] [Green Version]
  35. Narumi, D.; Taketa, A.; Shimoda, Y. Development of a method to estimate indoor climate and air conditioning energy consumption in residential house considering the influence of cross ventilation. In Proceedings of the 29th Air Infiltration and Ventilation Centre Conference, Kyoto, Japan, 14–16 October 2008. [Google Scholar]
  36. Gebhart, B. A new method for calculating radiant exchanges. ASHRAE Trans. 1959, 65, 321–332. [Google Scholar]
  37. Fujii, T.; Shimoda, Y.; Morikawa, T.; Mizuno, M. Development of city scale residential energy end-use model including heat load calculation: Development and application of city scale residential energy end-use model by considering with various household categories part 1. J. Environ. Eng. Trans. AIJ 2005, 70, 51–58. [Google Scholar] [CrossRef] [Green Version]
  38. Shimoda, Y.; Okamura, T.; Yamaguchi, Y.; Yamaguchi, Y.; Taniguchi, A.; Morikawa, T. City-level energy and CO2 reduction effect by introducing new residential water heaters. Energy 2010, 35, 4880–4891. [Google Scholar] [CrossRef]
  39. Habara, H.; Narumi, D.; Shimoda, Y.; Mizuno, M. A study on determinants of air conditioning on/off control in dwellings based on survey. J. Environ. Eng. Trans. AIJ 2005, 70, 83–90. [Google Scholar] [CrossRef] [Green Version]
  40. Shimoda, Y.; Fujii, T.; Morikawa, T.; Mizuno, M. Residential end-use energy simulation at city scale. Build. Environ. 2004, 39, 956–967. [Google Scholar] [CrossRef]
  41. Watanabe, K. Architectural Planning Principles Part 2; Maruzen: Tokyo, Japan, 1964. [Google Scholar]
  42. Narumi, D.; Shimoda, Y.; Habara, K.; Mizuno, M.; Kondo, A. Development of an environmental thermal load evaluation system for the purpose of mitigating urban thermal environment: Part 1: Effects of differences in environmental thermal load discharge conditions on temperature change near the ground surface. Trans. Soc. Heat. Air-Cond. Sanit. Eng. Jpn. 2006, 31, 71–78. [Google Scholar] [CrossRef]
  43. Ministry of the Environment & Ministry of Economy, Trade and Industry. Emission Factor for Each Electric Utility (for Calculating Total GreenHouse Gas Emissions in the Government and Local Government Action Plan)—FY2016 Results; EPA: Washington, DC, USA, 2018. [Google Scholar]
  44. Ministry of the Environment. Guidelines for Calculating Total Greenhouse Gas Emissions Version 1; EPA: Washington, DC, USA, 2017. [Google Scholar]
  45. Udagawa, M. Proposal of a standard calculation condition for a residential house. In Proceedings of the 15th Heat Transfer Symposium of AIJ, Nagoya, Japan, 28–29 November 1985; pp. 23–33. [Google Scholar]
  46. Architectural Institute of Japan Expanded AMeDAS Weather Data 1981–2000. Available online: https://www.metds.co.jp/product/ea/ (accessed on 14 March 2015).
  47. Ishida, K. Program for scheduling of indoor heat generation rate due to livelihood. In Proceedings of the SHASE Symposium, Japan, 23 October 1996. [Google Scholar]
  48. Global Cool Cities Alliance and R20 Regions of Climate Action. Practical Guide to Cool Roofs and Cool Pavements; CC Alliance: Washington, DC, USA, 2012. [Google Scholar]
  49. Castleton, H.F.; Stovin, V.; Beck, S.B.M.; Davison, J.B. Green roofs; Building energy savings and the potential for retrofit. Energy Build. 2010, 42, 1582–1591. [Google Scholar] [CrossRef]
  50. Matsushita, I.; Hatano, S.; Narumi, D. Evaluation on the ability of roofing unit covered with greens in mitigating outdoor thermal environment and reducing energy consumption for air-conditioning system. Pap. Environ. Inf. Sci. 2005, 19, 117–122. [Google Scholar] [CrossRef]
  51. Yamaguchi, T.; Yokoyama, H.; Ishii, K. Mitigating the urban heat island effect by light and thin rooftop greening. J. Jpn. Inst. Landsc. Archit. 2005, 509–512. [Google Scholar] [CrossRef] [Green Version]
  52. Narumi, D.; Shigematsu, K.; Shimoda, Y. Effect of the evaporative cooling techniques by spraying mist water on reducing urban heat flux and saving energy in an apartment house. J. Heat. Isl. Inst. Int. 2012, 7, 175–181. [Google Scholar]
  53. Hagishima, A.; Tanimoto, J.; Narita, K. Review of the former research on the convective heat transfer coefficient of urban surfaces. J. Jpn. Soc. Hydol. Water Resour. 2004, 17, 536–554. [Google Scholar] [CrossRef] [Green Version]
  54. Sangiorgio, V.; Fiorito, F.; Santamouris, M. Development of a holistic urban heat island evaluation methodology. Sci. Rep. 2020, 10. [Google Scholar] [CrossRef]
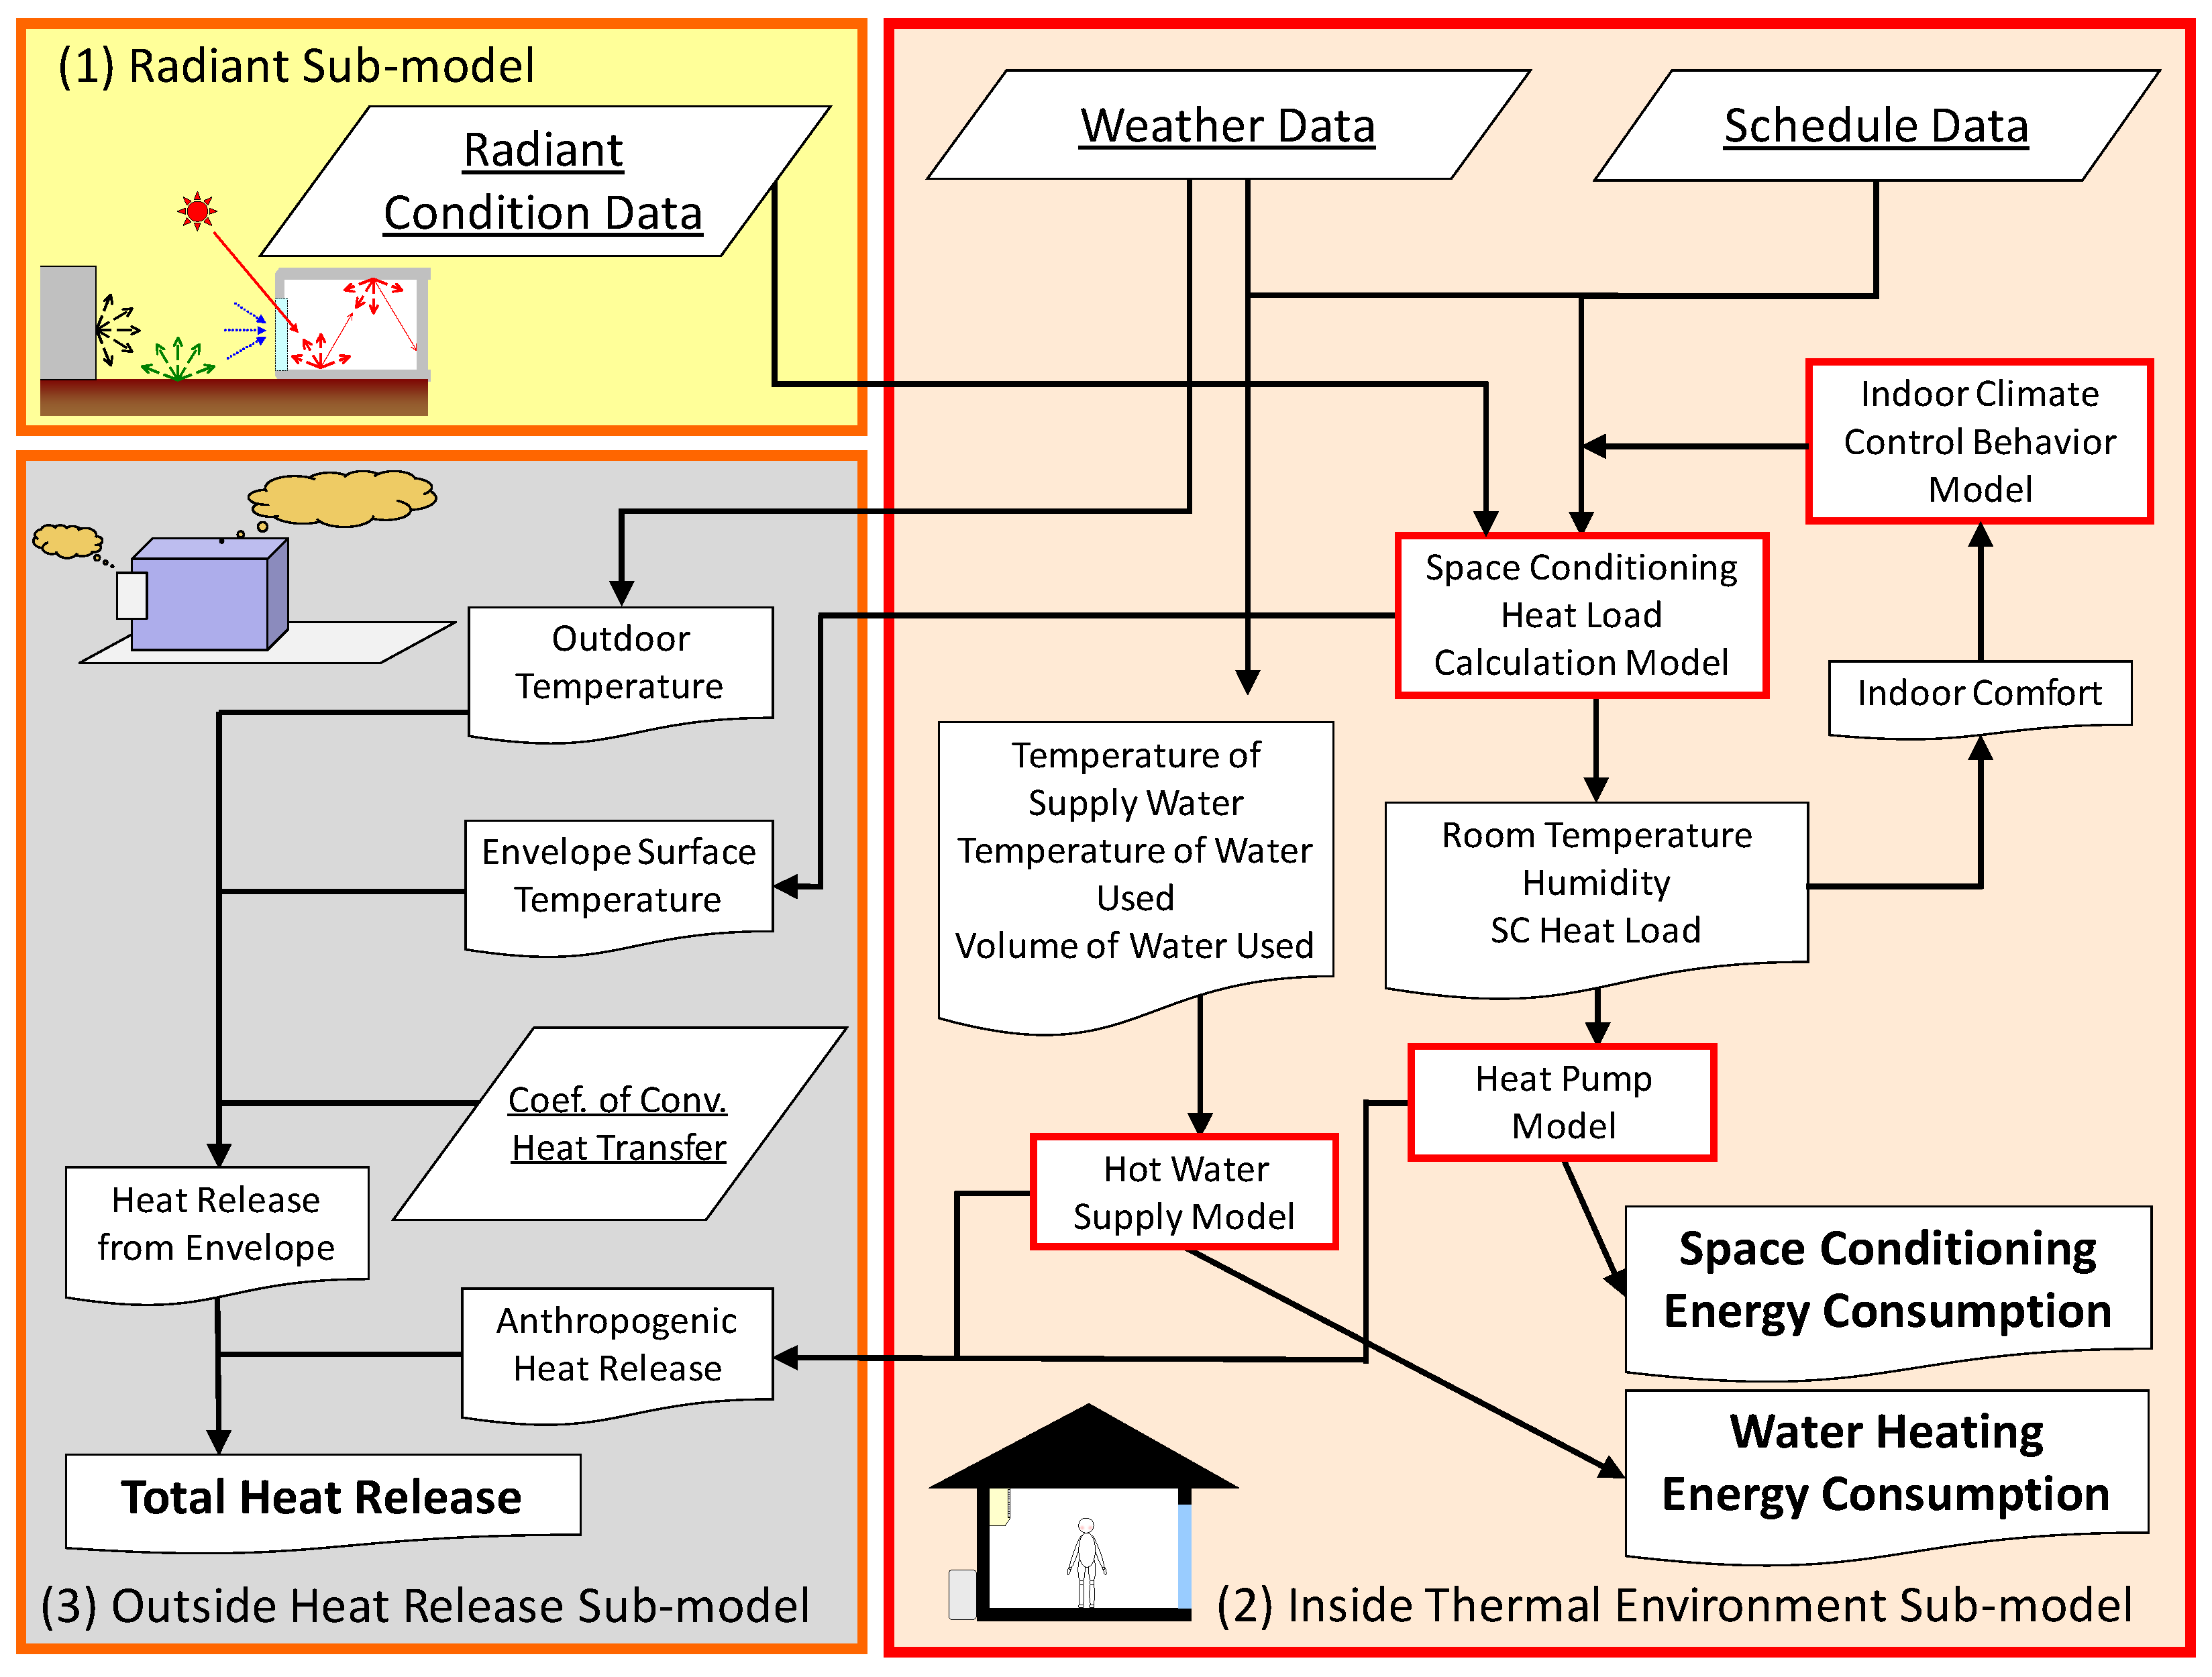
Figure 1. Outline of the SCIENCE-Outdoor model showing the flowchart of data between or inside each submodel: (1) radiant, (2) inside thermal environment, and (3) outside heat release.
Atmosphere 12 00572 g001
Figure 2. Schematic diagram of the heat release defined in this study for (a) the cooling season and (b) the heating season.
Atmosphere 12 00572 g002
Figure 3. Plan view of the targeted detached house.
Atmosphere 12 00572 g003
Figure 4. Sensible heat release from each path for a wooden structure with low insulation on a representative sunny day in (a) summer and (b) winter.
Atmosphere 12 00572 g004
Figure 5. Weather conditions on a representative sunny day in (a) summer and (b) winter.
Atmosphere 12 00572 g005
Figure 6. Time series of the sensible heat release from an envelope surface on a representative sunny summer day for (a) reinforced concrete structure and (b) wooden structure with low insulation level.
Atmosphere 12 00572 g006
Figure 7. Time series of the sensible heat release from an envelope surface on a representative sunny winter day for (a) reinforced concrete structure and (b) wooden structure with low insulation level.
Atmosphere 12 00572 g007
Figure 8. Time series of the difference in sensible heat release from the space conditioning (with countermeasure minus without countermeasures), on an average value of sunny days in August, for (a) reinforced concrete and (b) wooden structure with low insulation level.
Atmosphere 12 00572 g008
Figure 9. Time series of the difference in sensible heat release from the space conditioning in the case with or without utilizing countermeasures (with-without), on an average value of sunny days in February, for (a) reinforced concrete and (b) wooden structure with low insulation level.
Atmosphere 12 00572 g009
Figure 10. Time series of the difference in sensible heat release from water heating in the case with or without utilizing countermeasures (with-without), on an average value of sunny days, for (a) August and (b) February.
Atmosphere 12 00572 g010
Figure 11. Diurnal (24-h) average reduction in sensible heat release on an average value of sunny days in August versus total summer (July–September) reduction in CO2 emissions upon applying each countermeasure.
Atmosphere 12 00572 g011
Figure 12. Diurnal (24-h) average reduction in sensible heat release on an average value of sunny days in February versus total winter (December–February) reduction in CO2 emissions upon applying each countermeasure.
Atmosphere 12 00572 g012
Figure 13. Annual reduction of CO2 emissions from space conditioning by applying the UHIE countermeasures.
Atmosphere 12 00572 g013
Table 1. Outline of the computational condition.
PropertyValue
OutdoorClimate conditionExpanded AMeDAS weather data [46]): standard year (Osaka city, Japan)
Ground albedo0.16
BuildingHouse modelStandard residential house model [45]
StructureWooden or reinforced concrete
Insulation3 levels: no = no insulation; low = insulation equivalent to the old 1980 Japanese energy-saving code; high = insulation equivalent to the next-generation 1999 Japanese energy-saving code
Envelope albedo0.20 (base condition)
Space conditioning unitAir-cooled type heat pumps; cooling capacity in living room, main bedroom: each 3.6 kW; cooling capacity in child bedrooms 1 and 2: each 2.2 kW
OccupantHouseholdTwo adults (one employed outside the home, the other a homemaker) and two schoolchildren
Preset temp. and relative humidity27 °C and 60% RH in the cooling season; 22 °C and uncontrolled humidity in the heating season
Opening patternDetermined by the indoor climate control behavior model [39] depending on the weather conditions
Schedule of occupancy and heat generationSet by applying the automatic setup scheduling program SCHEDULE [47]
Table 2. Wall composition of the building to be evaluated.
PartInsulation LevelWooden
LayerThermal Conductivity (W/m·K)Volumetric Heat Capacity (kJ/m3·K)Thickness (m)
Outer WallCommonGypsum board2.14 × 1018.54 × 1021.2 × 10−2
HighInsulator3.60 × 10−22.70 × 1014.4 × 10−2
Low5.11 × 10−28.413.2 × 10−2
HighAir layer7.00 × 10−2 *1.204.2 × 10−2
Low5.4 × 10−2
No8.6 × 10−2
CommonPlywood1.29 × 1011.11 × 1039.0 × 10−3
CommonMortar1.092.31 × 1033.0 × 10−2
RooftopCommonGypsum board2.14 × 1018.54 × 1021.2 × 10−2
HighInsulator3.60 × 10−22.70 × 1014.4 × 10−2
Low5.11 × 10−28.413.2 × 10−2
HighAir layer7.00 × 10−2 *1.204.2 × 10−2
Low5.4 × 10−2
No8.6 × 10−2
CommonPlywood1.29 × 10−11.11 × 1031.2 × 10−2
CommonSlate9.63 × 10−11.52 × 1031.2 × 10−2
PartInsulation levelReinforced concrete
LayerThermal conductivity (W/m·K)Volumetric heat capacity (kJ/m3·K)Thickness (m)
Outer WallCommonGypsum board2.14 × 10−18.54 × 1021.2 × 10−2
HighInsulator3.60 × 1022.70 × 1014.4 × 10−2
Low5.11 × 10−28.413.2 × 10−2
HighAir layer7.00 × 102 *1.204.2 × 10−2
Low5.4 × 10−2
No8.6 × 10−2
CommonPlywood1.29 × 10−11.11 × 1039.0 × 10−2
CommonMortar1.092.31 × 1033.0 × 10−2
RooftopCommonGypsum board2.14 × 10−18.54 × 1021.2 × 10−2
HighInsulator3.60 × 1022.70 × 1014.4 × 10−2
Low5.11 × 1028.413.2 × 10−2
HighAir layer7.00 × 10−2 *1.204.2 × 10−2
Low5.4 × 10−2
No8.6 × 10−2
CommonPlywood1.29 × 1011.11 × 1031.2 × 10−2
CommonSlate9.63 × 1011.52 × 1031.2 × 10−2
* This cell shows the value of thermal resistance (m2·K)/W.
Table 3. Outline of the evaluated countermeasures.
CountermeasureMain TargetComputational Condition
High-albedo roof (HAR)UHIERaising the rooftop albedo to 0.60 from 0.20
Roof greening (RG)UHIEImproving evaporation efficiency of the rooftop to 0.3 from 0.0 and albedo of the rooftop to 0.25
Adding a greening and soil layer on rooftop surface
Setting for the reinforced concrete structure only
Setting the condition for withering during winter
Roof water showering (RWS)UHIE·Setting evaporation efficiency of rooftop to 0.7 from 0.0 when the rooftop surface temperature exceeds 40 °C in the daytime until 5 p.m.
Evaporation efficiency will gradually decrease in the nighttime
Evaporative space cooling (ESC)UHIEImproving indoor thermal comfort by spraying dry fog jet
Cooling effect is equivalent to 1 K decrease in SET *
Jetting will be stopped when behavior model judges AC is required
Installing only in the air-conditioned room—9 nozzles each in the living room and the main bedroom, and 4 nozzles each in the child bedrooms
The amount of water used per nozzle was 1.34 L per minute (L/min)
Condensing water heater (CWH)GWImproving the efficiency to 95% from 78%
Heat pump water heater (HPH)GWSetting rated generation output of the hot water at 4.5 kW
Improving the efficiency
Absorbing heat from the ambient atmosphere
Changing the COP due to outside air temperature
Gas engine cogeneration system (GECS)GWSetting rated power generation output at 1.0 kW and rated power generation efficiency at 20%
Heat exhaust efficiency at 57%
Operating in accordance with the heat demand
Number of operations per day is unlimited but excessive start/stop is restricted
Solid oxide fuel cell (SOFC)GWSetting rated power generation output at 0.7 kW and rated power generation efficiency at 45%
Heat exhaust efficiency at 36% (depend on the load)
Setting hourly power generation as for fitting electricity load without start/stop
Photovoltaic power generation (PV)GWSetting rated power generation efficiency at 13%
Considering the influence of decreasing the albedo on the rising temperature of the rooftop surface and increasing heat release
Publisher’s Note: MDPI stays neutral with regard to jurisdictional claims in published maps and institutional affiliations.