Abstract
The Chinese government attaches great importance to climate change adaptation and has issued relevant strategies and policies. Overall, China’s action to adapt to climate change remains in its infancy, and relevant research needs to be further deepened. In this paper, we study the future adaptive countermeasures of Shenzhen city in the Pearl River Delta in terms of climate change, especially urban flood risk resilience. Based on the background investigation of urban flood risk in Shenzhen, this paper calculates the annual precipitation frequency of Shenzhen from 1953 to 2020, and uses the extreme precipitation index as a quantitative indicator to analyze the changes in historical precipitation and the impact of major flood disasters in Shenzhen city in previous decades. Based on the six kinds of model data of the scenario Model Inter-comparison Project (MIP) in the sixth phase of the Coupled Model Inter-comparison Project (CMIP6), uses the Taylor diagram and MR comprehensive evaluation method to evaluate the ability of different climate models to simulate extreme precipitation in Shenzhen, and the selected models are aggregated and averaged to predict the climate change trend of Shenzhen from 2020 to 2100. The prediction results show that Shenzhen will face more severe threats from rainstorms and floods in the future. Therefore, this paper proposes a resilience strategy for the city to cope with the threat of flood in the future, including constructing a smart water management system and promoting the development of a sponge city. Moreover, to a certain extent, it is necessary to realize risk transfer by promoting a flood insurance system.
1. Introduction
Climate change is currently a global issue that affects human survival and sustainable societal development. In the past 100 years, the global climate has been characterized by warming [1]. The Fifth Assessment Report of the International Intergovernmental Panel on Climate Change (IPCC) states that the average global temperature increased by 0.65–1.06 °C from 1880 to 2012, and that the global temperature will continue to increase in the future [2,3]. In the context of continued global warming, changes in climate variability (such as monsoon, precipitation, and atmospheric circulation) will not only have significant regional hydrothermal impacts but will also further increase the risk of extreme climate events [4,5]. Although extreme climate events are low probability events, they are extremely sudden and destructive, and are difficult to predict [6]. In recent years, with the development of urbanization, problems have arisen that are associated with the increase in the area of hardened urban subsurfaces, the proliferation of impervious facilities, imperfect construction of drainage networks and other infrastructure, and the uncoordinated development of cities themselves. Among the challenges, heavy rainfall and flooding caused by extreme precipitation tend to result in internal flooding in cities with insufficient drainage capacity, increasing the frequency and risk of urban natural disasters and affecting regional infrastructure and economic development [7]. Therefore, the quantitative evaluation description, simulation, and early warning assessment of extreme precipitation events in cities has become a current research hotspot in the field of climate change and urban construction.
Domestic and international scholars have carried out a considerable amount of research on extreme climate change, simulation prediction, and urban response [8,9,10], mainly focusing on three aspects. Firstly, the quantitative research on extreme climate change, including the characterization definition, spatial and temporal evolution patterns, and the causes of extreme climate indices [11,12]. The Expert Team on Climate Change Detection and Indices (ETCCDI) of the World Meteorological Organization (WMO) has defined 27 extreme climate indices in terms of intensity, frequency, and duration using statistical methods such as the percentage method and threshold determination. These indices are widely used in the quantitative analysis of extreme climate change [13,14,15,16]. Secondly, the application of global climate model data to simulate and predict future extreme climate indices. The World Climate Research Program has developed the Coupled Model Inter-comparison Project (CMIP) as a database for making such predictions [17]. The latest version of the current CMIP series is CMIP6, which presents new prognostic scenarios using six integrated assessment models (IAMs), based on different shared socioeconomic pathways (SSPs) and the latest anthropogenic emission trends. The new scenarios not only include future social and economic changes (such as population, economic development, ecosystems, resources, systems, and social factors), but also future efforts to mitigate, adapt, and respond to climate change, with better resolution [18,19,20]. Many scholars have attempted to use the CMIP6 outputs to evaluate the characteristics of extreme rainfall under different scenarios in the future [21,22,23]. The result showed that extreme temperature and precipitation have shown increasing trends in this century overall, and these changes are more obvious in the CMIP6 simulation than in the CMIP5 simulation. However, not all models exhibit a better performance in a certain region. Therefore, the best choice is an optimal model prediction that can better reduce the uncertainty of the simulation. With the application of global climate model data, a large number of researchers have found that a multi-model ensemble (MME) has better evaluation performance than a single model [24,25]. The third aspect is that many scholars are committed to proposing an effective measure to enable cities to better cope with extreme climate change [26,27,28,29]. Therefore, many new concepts have been proposed, such as sponge city, Smart Water Management (SWM), flood insurance, etc.
Shenzhen is one of the most innovative cities with the highest degree of marketization, the most perfect market system and the most important economy in China. It plays an irreplaceable role in promoting the rapid development of the national economy. In recent years, with the acceleration of urban modernization and the continuous improvement of urban function positioning, Shenzhen has become increasingly sensitive to flooding disasters, and climate risks have also increased. However, the meteorological disasters caused by extreme rainfall cause serious loss of life and property almost every year, which greatly restricts economic and social development. For example, the 2008 typhoon “Fengshen” was the strongest typhoon encountered in Shenzhen. There were more than 90 waterlogged sites in the city, and at least 18 sites with water depths of more than 1 m; traffic jams in many road sections in the city were serious; in addition, the heavy rain caused landslides in 10 places in the city, the most serious being on the side of the Buji River. The slope of Shenhui Road collapsed more than 70 m, and nearly one million people were affected by the heavy rain in the city, causing a direct economic loss of about 490 million yuan [30]. Improving our understanding of the characteristics of flood disasters and optimizing flood control and disaster reduction countermeasures is the main subject and overall goal of Shenzhen’s future urban flood control work.
At present, there is a lack of research using the CMIP6 outputs to predict extreme precipitation changes at the urban scale [31]. Meanwhile, there is a lack of systematic measures and suggestions on how cities should deal with climate change. Therefore, based on the simulation capabilities of different CMIP6 outputs, this paper reveals the evolutionary laws and characteristics of extreme climate events, and proposes countermeasures to manage extreme precipitation and urban waterlogging, with a view to minimizing disaster losses and improving the city ability to deal with climate risks.
2. Literature Review
2.1. Resilient City
As a complex giant system, cities are becoming more and more powerful at the same time they are becoming more and more vulnerable, such as floods caused by extreme climates. Therefore, how a city can respond to various changes and maintain its own vitality in the face of numerous challenges and crises has become an important issue that needs to be resolved.
The concept of elasticity originated from ecology and was put forward by the American scholar Holling in the 1970s [32]. With the development of research, the concept of resilience began to be combined with disciplines other than ecology. In the field of urban planning, Albert [33] proposed the concept of “resilient city”, which is defined as the ability and degree of a city to dissolve and absorb changes before structural and process restructuring changes. The Resilience Alliance defines a resilient city as: the ability of a city or urban system to absorb and absorb external disturbances and maintain the original main features, structure, and key functions [34]. However, in fact, a resilient city includes not only the ability of the city system to adjust itself to respond to various negative uncertainties and sudden attacks, but also the ability to effectively transform those positive opportunities into capital [35].
2.2. Resilient Strategies
Frequent water disasters have caused people to reflect on whether the single-target engineering resistance strategy is reasonable, such as raising flood dikes and diverting water, and actively looking for other solutions. In this context, resilient strategies have received attention and development [36]. Resilient strategies are more resilient than resistance strategy and more adaptable to various uncertain changes [37]. Resilience strategies include structural measures and non-structural measures [38]. Structural measures include river net flow management, flood adaptation, hanging water and construction measures, while non-structural measures are reflected in flood policies and management.
China’s 13th Five-Year Plan proposes that “sponge cities” are an important direction for the development of new urbanization. “Sponge city” is a new generation of urban stormwater management concept [39]. It means that the city can be like a sponge and has good flexibility in adapting to environmental changes and coping with natural disasters caused by rainwater. It can also be called a “water resilient city” [40]. The “sponge city” has the flexibility to adapt to environmental changes and respond to rain and flood disasters. The construction of “sponge city” will help solve the problem of urban waterlogging, improve the urban ecological environment, and improve the quality of life of the people [41].
At present, it is also a hot issue to promote smart water management with the help of emerging information technologies such as the Internet, cloud computing, big data, and artificial intelligence [42,43]. The urban flood control system mainly consists of a source monitoring system, a river management system, a flood forecasting system, an alarm system, a flood risk assessment system, and a flood-related database. The source flood level and flow are monitored through the source monitoring system, and then the flood level is forecasted through the flood forecasting system. The flood was assessed through the flood risk assessment system. Through these non-engineering measures, flood attacks can be avoided, prevented, or reduced, adapt to changes in various types of floods, and better utilize the benefits of flood control projects, thereby reducing flood losses [44].
In addition, in many developed countries, flood insurance is often an important part of disaster prevention laws, and catastrophe insurance plays a vital role in disaster relief and protection of people’s lives and property [45,46]. In the 20th century, although the American flood insurance measures were unable to restrain the upward trend of flood losses, they effectively reduced the ratio of flood losses to GNP and restricted flood risks to acceptable limits [47]. As an important non-engineering measure for flood control, will play an increasingly important role in transferring flood risk [48].
3. Materials and Methods
3.1. Study Area
Shenzhen is located between 113°43′–114°38′E and 22°24′–22°52′N (Figure 1). It is a coastal city in the south of China with an area of 1997.47 km2. Shenzhen experiences a southern subtropical monsoon climate with variable weather in spring, prevailing easterly winds, a long summer, and a short winter. The climate is mild, with mean annual temperature of 22.4 °C. Shenzhen is rich in precipitation resources. Annual rainfall of 1933.3 mm occurs during the rainy season from April to September each year. The prevailing winds are southeasterly and easterly, with an influence from tropical cyclones 4–5 times per year on average [49].
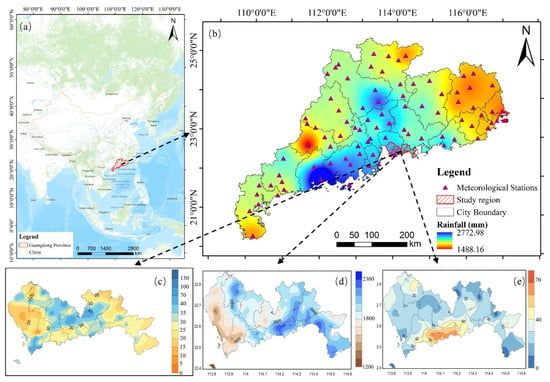
Figure 1.
Study area location and rainfall characteristics. (a) Location of Guangdong Province; (b) spatial distribution of the mean annual rainfall in Guangdong Province from 2000 to 2019; (c) distribution map of maximum 1 h rainfall in Shenzhen from 19–22 May 2020; (d) distribution of accumulated rainfall in Shenzhen throughout 2019; (e) maximum 30 min rainfall distribution in Shenzhen from 21:00 to 23:00 on 11 April 2019. Where (c–e) were derived from the Shenzhen Climate Bulletin.
As of the end of 2019, the city had a built-up area of 927.96 km2, an urban population of 13.438 million, and an urbanization rate of 100%. It is the first fully urbanized city in China. Recently, Shenzhen has become a national economic center and a national innovation city with rapid urban development. However, due to its unique geographical location, population density, and social conditions, severe weather such as strong convection, low temperature and rainfall, tropical cyclones, thunderstorms, and heavy rain frequently occur, causing serious economic losses.
As a result of climate change, the rainfall pattern in Shenzhen has changed considerably, the frequency of heavy rainfall has increased, and multiple climate risks such as heavy rains, floods, and typhoons have been superimposed, which will increase the risk of future urban floods. In 2019, the temporal and spatial distribution of precipitation is extremely uneven, the precipitation is concentrated in stages, and the rain is strong. The city’s annual average rainfall is 1882.9 mm. Figure 1c,d respectively display two typical rainstorm events. The heavy rain on 11 April 2019, lasted just one hour and 42 min, with a maximum rainfall of 65.5 mm. The maximum one-hour rainfall on 22 May 2020 reached 153.7 mm, setting a new record [30]. Shenzhen is a typical and representative city, so it was selected as a study area for assessment of flood risk impacts under climate change, which will be of great reference significance for other cities in China to cope with climate change.
3.2. Data Sources
CMIP6 is the sixth stage of CMIP. It has the largest number of experimental models, the most complete experimental design, and the largest amount of data simulation since the implementation of the CMIP plan [50]. This study used six global climate models from ScenarioMIP, i.e., the scenario model comparison program of CMIP6 (Table 1), with different spatial resolutions for each model; more details can be found at https://esgf-node.llnl.gov/search/cmip6/, accessed on 20 April 2021.

Table 1.
Global climate model information.
The data in this study were historical experimental data from 1953 to 2014 and simulated data from 2020 to 2100 under four combined scenarios (SSP1-2.6, SSP2-4, SSP3-7.0, and SSP5-8.5), where SSP1-2.6 was the updated CMIP5 RCP2.6 scenario in CMIP6, which represents the combined effects of low vulnerability, low mitigation pressure, and low radiative forcing; SSP2-4.5 is the updated CMIP5 RCP4.5 scenario in CMIP6, which represents a combination of moderate social vulnerability and moderate radiative forcing. SSP3-7.0 was a new radiative forcing scenario in CMIP6, representing a combination of high social vulnerability and relatively high anthropogenic radiative forcing, which is important for IAM and climate change impact, mitigation, and adaptation (IAV) studies; SSP5-8.5 is the updated CMIP5 RCP8.5 scenario in CMIP6 and was the only shared socioeconomic pathway to achieve an anthropogenic radiative forcing of 8.5 W/m2 by 2100.
In order to assess the simulation capability of climate variables output from the climate model for the historical reference period (1953–2014), the measured daily-scale precipitation data of Shenzhen Station from 1953 to 2020, which were derived from the China Meteorological Data Network (http://data.cma.cn/site/index.html, accessed on 20 April 2021), were used as the benchmark in this study.
3.3. Analysis Method
3.3.1. Extreme Precipitation Index Method
We selected 11 of the 15 extreme precipitation index indexes determined by the Expert Team on Climate Change Detection and Indices (ETCCDI) [51] (http://etccdi.pacificclimate.org/docs/ETCCDMIndicesComparison1.pdf, accessed on 20 April 2021), which are described in detail in Table 2. The extreme precipitation index was calculated based on the RclimDex 1.0 model, and the linear trend analysis method and the P test method were used to calculate the inter-annual change trends and to determine the significance of each index, the change characteristics of the extreme climate index were then analyzed.

Table 2.
Definitions and classifications of extreme precipitation indicators.
3.3.2. Evaluation of Climate Model Simulation Results
Taylor graph method [52]: The Taylor graph method is a method proposed by Taylor et al. to evaluate the similarity between two datasets. It also considers the correlation coefficient (COR), relative standard deviation (RSTD), and standard root mean square error (RMSD) between the two datasets. Furthermore, because these three values have a mathematical transformation relationship, they can be comprehensively displayed in the same graph, so as to compare the similarity between the two datasets more intuitively. In this paper, the simulation capabilities of different climate models were described by the Taylor diagram. For the set of simulated climate variables, X, and the set of observed climate variables, Y, the calculation methods of each statistic are as follows.
If the RSTD of simulated and observed values of climate variables is smaller and the COR is larger, the RMSD is smaller, thereby indicating a better fitting ability of the climate model.
MR (Metrics Rating) comprehensive evaluation [53]: In order to further evaluate the comprehensive simulation capability of each climate model, the COR, RSTD, and RMSD of the simulated and observed values of each extreme precipitation index were counted separately, with a total of 33 indicators, and the calculated comprehensive simulation capability of each climate model was ranked.
Here, rij is the descending ranking of the simulation ability of climate models for individual indicators; m is the number of models (taken as 26); n is the number of evaluation indicators (taken as 18); and rank is the descending ranking of the comprehensive simulation ability of climate models. Note that the higher the ranking, the stronger the comprehensive simulation ability of extreme precipitation indices.
Comprehensive simulation scoring [54]: Based on the comprehensive evaluation results of climate models, the optimal MME average method was adopted to reduce the uncertainty of the simulation results of a single climate model. In order to determine the optimal number of models, a comprehensive simulation scoring index (CSS) that also considers the COR and RSTD between the simulated and observed extreme precipitation index values was adopted. The formula is as follows.
The larger the CSS, the better the performance of the climate model, and vice versa.
In summary, based on the background investigation of the urban flood risk in Shenzhen, this paper analyzed the changes in historical precipitation and the impacts of major floods in Shenzhen during the past 68 years. In addition, based on CMIP6 data, we comprehensively evaluated the simulation capability of different climate models for extreme precipitation in Shenzhen. On this basis, we preferably selected models for ensemble averaging, predicted the change characteristics of extreme precipitation in Shenzhen in the 21st century (2020–2100), and proposed a resilience strategy for integrated urban flood risk management. Figure 2 presents the technical roadmap of this paper.
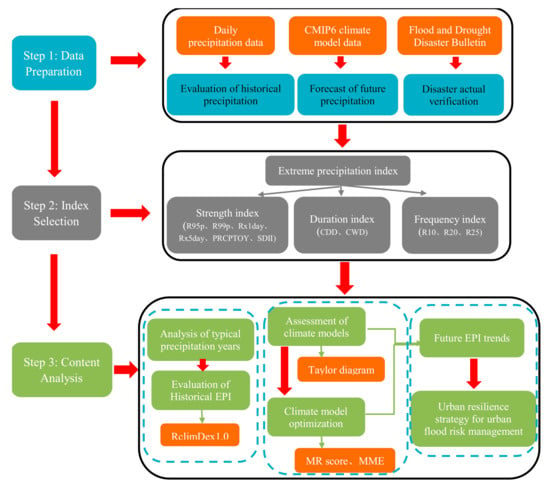
Figure 2.
Overall research framework (see Table 2 for definitions and classifications of extreme precipitation indicators).
4. Results and Discussion
4.1. Analysis of Historical Precipitation Evolution in Shenzhen
4.1.1. Changes in Measured Precipitation in Shenzhen
Based on the measured precipitation data of the Shenzhen Station, annual and monthly precipitation in Shenzhen from 1953 to 2020 were determined. The change in precipitation is shown in Figure 3. The redder the color, the more rainfall, and the bluer the color, the less rainfall. The mean monthly rainfall in Shenzhen was 160.8 mm, and the maximum monthly rainfall was 1395.3 mm, with rainfall mainly concentrated in April–September (accounting for 85.11% of the annual rainfall). Extreme rainfall mainly occurred in June.
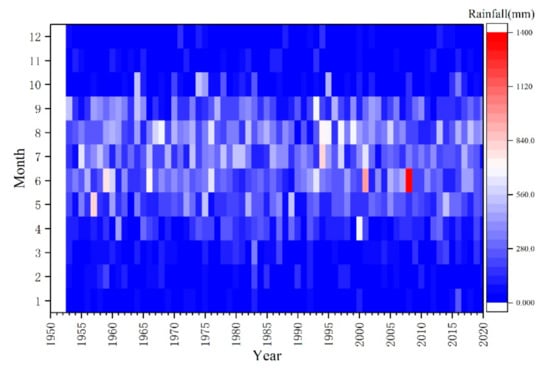
Figure 3.
Interannual variation of precipitation in Shenzhen.
To better understand the evolutionary characteristics of extreme precipitation in Shenzhen, the annual precipitation in Shenzhen from 1953 to 2020 was calculated by ranking frequency, as shown in Figure 4. Statistically, 50% of the extremely wet and extremely dry years (i.e., years with an empirical frequency < 10% and an empirical frequency > 90%, respectively) occurred after 2000, indicating that extreme precipitation events have not only intensified in recent years but that their frequency has also increased and humans are facing more extreme climate challenges. In addition, three typical years were selected according to the cumulative frequency, namely, dry, normal, and humid years, which were 1963, 2002, and 2001 (empirical frequencies were 98.55%, 50.0%, and 1.45%, respectively). The accumulated precipitation in a drought year was 911.9 mm (i.e., 51.58% less than a normal year) and the lowest precipitation occurred in winter. Therefore, attention should be paid to the prevention and control of winter droughts. The cumulative precipitation in the wet year was 2747 mm (i.e., 45.9% more than in a normal year) and the highest daily precipitation in 2001 occurred on 27 June. Due to the influence of the low pressure trough in June, as of 27 June 2001, the cumulative rainfall in Shenzhen in June had reached 925.2 mm, breaking not only the 50-year historical record of 790.9 mm in June, but also the 50-year historical record of 826.2 mm of cumulative rainfall in a single month, with repeated heavy rainfall events [55].
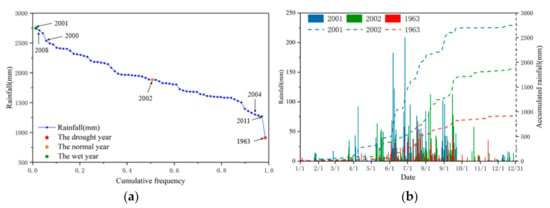
Figure 4.
Empirical frequency ranking of precipitation in Shenzhen (a) and daily and cumulative precipitation in extreme dry, normal, and extreme wet years (b).
The highest precipitation occurred in 2001 and 2008; however, the social and economic losses from heavy rains and floods were quite different. The empirical frequency of precipitation in 2001 was 1.45% and the second extremely wet year was 2008 with an empirical frequency of 2.90%. Although slightly more precipitation fell in 2001 than in 2008, flood damage was much greater in 2008 than in 2001, as shown in Table 3. From 13–14 June 2008, there was continuous heavy rainfall in Shenzhen. The rainfall was concentrated, with a wide range and high intensity. The recurrence period of heavy rain exceeded 1-in-100 years. More than 1000 waterlogging or flooding events of various degrees occurred throughout the city. The heavy rain caused more than 70 houses to collapse, 5 people were killed, 3 people went missing, and the direct economic loss equated to approximately 500 million yuan [56]. From 29–31 August 2008, there was an historically rare period of three consecutive days of extremely heavy localized rainfall, during which the maximum 12 h rainfall (333.9 mm), the maximum 24 h rainfall (417.2 mm), and the maximum 48 h rainfall (486.9 mm) all exceeded the previous August rainfall records. The city saw several reservoirs exceeding the flood control limit, several severe waterlogging, many traffic and power supply disruptions, landslides, and other dangerous situations [57]. This may be due to the fact that more extreme precipitation events occurred in 2008 than in 2001, in addition to the fact that the natural water circulation system was altered by the urbanization of Shenzhen, resulting in poor drainage and the occurrence of urban flooding problems with severe losses. This phenomenon also reflects the need to study extreme precipitation events.

Table 3.
Comparison of heavy rainfall disasters in Shenzhen in 2001 and 2008 [58].
4.1.2. Time Series Evaluation of Historical Extreme Precipitation Indices in Shenzhen
Based on the meteorological data of Shenzhen Station from 1953 to 2020, the extreme precipitation index was calculated through RclimDex1.0 software using the least squares and local weighted regression method to analyze the time series changes of 11 extreme precipitation indices at Shenzhen Station in the past 68 years. As can be seen from Figure 5, all indices showed similar fluctuation trends in the time series, with biases in the 1960s and early 21st century. Among the 11 precipitation indices, PRCPTOT, SDII, CDD, R10, and R20 showed increasing trends; however, these trends were not significant, indicating that the extreme precipitation at Shenzhen Station did not change considerably during 1953–2020, and that precipitation showed a weakly increasing trend. Although the intensity of precipitation decreased, the number of consistently dry days decreased, the number of consistently wet days increased, and the frequencies of light and heavy rainfall also increased, indicating that extreme wet events were became more frequent during the 68 years from 1953 to 2020, leading to urban flooding, flash floods, mudslides, inundation of factory farmland, etc. The disasters caused by extremely heavy precipitation are often severe, and the risk of flash flooding has further increased.
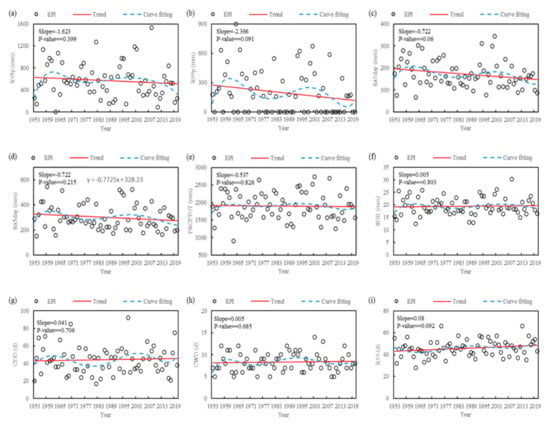
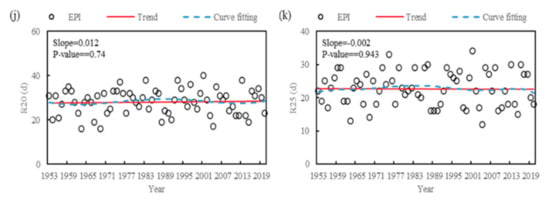
Figure 5.
Linear trend and curve fitting of the extreme precipitation index (EPI) in Shenzhen. (a) R95p; (b) R99p; (c) Rx1day; (d) Rx5day; (e) PRCPTOT; (f) SDII; (g) CDD; (h) CWD; (i) R10; (j) R20; and (k) R25 (see Table 2 for definitions and classifications of extreme precipitation indicators).
4.2. Preferred Climate Model for Shenzhen and Prediction of Future Trend of Extreme Precipitation Index
4.2.1. Taylor Diagram-Based Simulation Evaluation
In order to objectively evaluate the simulating capabilities of the six climate models for Shenzhen’s extreme precipitation index, in this paper we counted the 11 extreme precipitation indexes simulated by each climate model during the climate reference period and compared them with actual observations. The horizontal and radian axes of the figure indicate the RSTD and COR of the simulated values relative to the measured values, respectively, while the concentric circles surrounded by green dashed lines indicate the standard RMDS of the simulated values relative to the measured values, and the red dots indicate the fitting ability of different climate models for extreme precipitation, respectively.
From Figure 6, it can be seen that in terms of fitting ability, all the models had poor fitting ability for different extreme precipitation indices. Specifically, for the 11 extreme precipitation indices, the temporal CORs of most of the models were less than 0.3. In terms of RSTDs, the standard deviations and mean deviations of the six climate models were relatively large, which indicates that the interannual fluctuations of the 11 extreme precipitation indices were overestimated to different degrees by the six climate models, thus making the fitting deviations significantly larger. From the comparison of the fitting ability of different models, BCC-CSM2-MR and MPI-ESM1-2-LR were superior for each index, with relatively large CORs; however, the deviation of BCC-CSM2-MR remained large, and CanESM5 had the smallest COR, a large RSTD, and the worst simulation effect. The fitting ability of the other different models for each index was relatively close, at a medium level. Considering that the average of MME simulations works more effectively for most of the individual model results, this study used MR ranking and MME averaging for model preference for extreme temperature prediction, which has been widely accepted in other related studies [59,60] and can further improve its fitting ability.
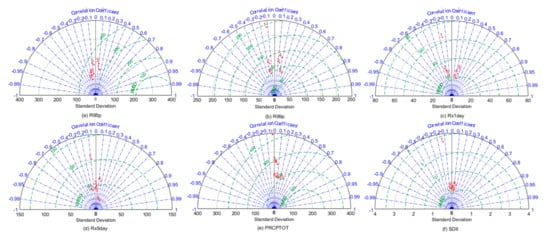
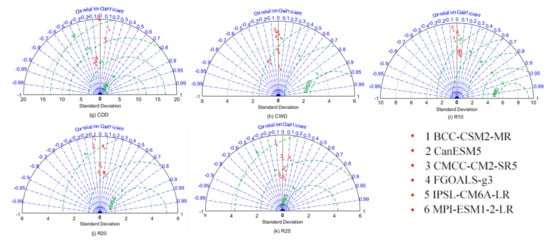
Figure 6.
Taylor diagram of extreme precipitation index simulated by different climate models. (a) R95p; (b) R99p; (c) Rx1day; (d) Rx5day; (e) PRCPTOT; (f) SDII; (g) CDD; (h) CWD; (i) R10; (j) R20; and (k) R25 (see Table 2 for definitions and classifications of extreme precipitation indicators).
4.2.2. Preferred Extreme Precipitation index Model in Shenzhen
Optimal MME averaging can improve the simulation capability of climate models by offsetting the errors between different models and reducing the uncertainty of the simulation results of individual climate models [61,62]. In order to determine the optimal models set, this paper statistically ranked the scores of six climate models for different extreme precipitation index time fitting abilities from 1953 to 2020 based on COR, RSTD, and RMSD, and plotted the ranking results of different climate models, as shown in Figure 7 (note: For a certain extreme precipitation index, the COR, RSTD, and RMSD are indicated.) The final ranking of the best to worst models for the integrated simulation of extreme precipitation indices was BCC-CSM2-MR > PI-ESM1-2-LR > GOALS-g3 > PSL-CM6A-LR > MCC-CM2-SR5 > CanESM5. In addition, despite the differing sets of better and worse models for different indices, there remains a strong similarity, indicating that the assessment results of the climate models obtained by the MR composite score can be applied to each extreme precipitation index.
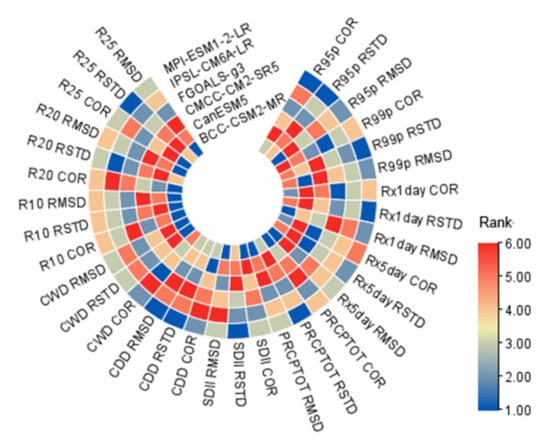
Figure 7.
MR score ranking of climate model simulated extreme precipitation index (see Table 2 for definitions and classifications of extreme precipitation indicators).
Finally, we used the comprehensive simulation scoring index (CSS) to confirm the number of optimal modes to be selected for MME; the larger the comprehensive simulation scoring index (CSS), the stronger the simulation ability. As can be seen from Figure 8, with the increase in the number of models, the overall simulation ability of MME for different extreme precipitation indices showed a trend of initially increasing and then decreasing. Therefore, according to the ranking of the comprehensive simulation capabilities of each model, we finally selected the optimal number of models for the arithmetic average, and obtained the result of the MME average. That is, for one mode that performs well, we selected the BCC-CSM2-MR modes for evaluation, such as R95p, R99p, Rx1day, Rx5day, PRCPTOT, SDII, R10, R20, and R25 indices. For the three modes that performed well, we selected the pooled mean of the BCC-CSM2-MR, MPI-ESM1-2-LR, and FGOALS-g3 modes, such as the CDD and CWD indices from Table 4, and it can be seen that the MME averaging results eventually improved the fitting ability of the extreme precipitation indices to some extent.
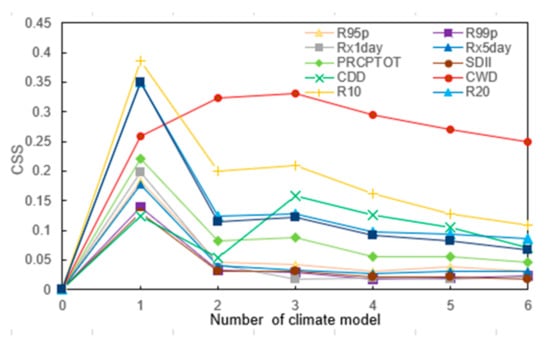
Figure 8.
Trend of fitting effect of MME average simulated extreme precipitation index (see Table 2 for definitions and classifications of extreme precipitation indicators). CSS—comprehensive simulation scoring.

Table 4.
Statistical characteristics of the fitting effect of the MME average simulated extreme precipitation index (see Table 2 for definitions and classifications of extreme precipitation indicators).
4.2.3. Trend Analysis of Future Extreme Precipitation Indices in Shenzhen
Figure 9 shows the relative changes of 11 extreme precipitation indices in Shenzhen under different future scenarios. Relative to the mean value of the indices in the base period of 1953–2020, very wet days (R95p) show a significant decreasing trend in the future; however, the extremely wet days (R99p) increase by means of 17.24%, 15.01%, 25.18%, and 31.94%, under the four scenarios, respectively. The occurrence of flooding is closely related to the precipitation intensity, and an increase in extremely wet days (R99p) in the future is likely to lead to an increase in flood risk and geological hazards. Among the 11 indexes, the maximum 1 d precipitation amount (Rx1day) and the maximum 5 d precipitation amount (Rx5day) have the largest increases, indicating that the extreme precipitation values in the future reflect climate change most significantly. The relative changes in the three frequency indices show that R25 > R20 > R10, that the number of heavy and stormy days will increase significantly in the future, and that the more concentrated the precipitation, the greater the possibility that flooding will occur. In addition, both CDD and CWD indices show insignificant trends in the future; however, they will increase by 0.31% and 0.10%, respectively, under the ssp5-8.5 scenario, indicating that droughts and floods may increase simultaneously in the future under the high discharge scenario. In addition, the annual total wet-day precipitation and simple daily intensity index are both positive, and the overall trend is weakly increasing. Comparing the relative rate of change of each index under the four emission scenarios, the relative change increases sequentially from SSP1-2.6 to SSP5-8.5. The increase of each index is larger in the high emission scenario, and the risk of socio-economic disasters caused by extreme rainfall in the future will increase accordingly.
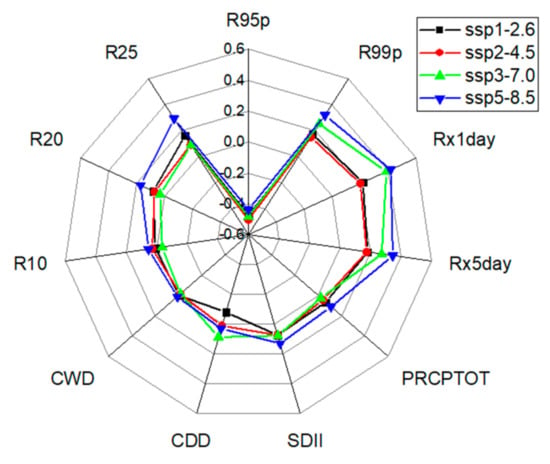
Figure 9.
Relative changes in the extreme precipitation indices in Shenzhen under different scenarios (see Table 2 for definitions and classifications of extreme precipitation indicators).
Figure 10 shows the change series of 11 extreme precipitation indices under four future scenarios. It can be seen that the extreme precipitation indices in Shenzhen will show fluctuating changes in the future, among which the fluctuations in the number of extremely wet days, maximum daily precipitation, and heavy rainstorm days are large, indicating that extreme precipitation will tend to be unstable in the future. Unlike temperature, the precipitation elements do not change significantly under different future scenarios. For Shenzhen, R99p, Rx1day, Rx5day, R20, and R25 will be the most important influencing factors for the occurrence of flooding events in the future, especially R99p, Rx1day, and Rx5day, with maximum values of 1166.59 mm, 792.25 mm, and 992.53 mm, respectively. The Rx1day peak does not necessarily correspond to the Rx5day peak. It indicates that the impact of maximum 1 d precipitation amount on the overall maximum 5 d precipitation amount total is small, and that the increased occurrence of heavy precipitation events in the future and the short confluence time of floods caused by heavy precipitation will likely trigger flash floods, damage roads, inundate farmland, and cause considerable economic losses due to flooding. By the end of the 21st century, the numbers of days of moderate and heavy rain under the SSP5-8.5 scenario will increase by 16.93% and 29.33%, respectively, indicating that future rainfall will increase, mainly exhibiting increases in moderate and heavy rain, and that the growth trend is more significant than the growth trend of daily maximum precipitation. The extreme precipitation index does not change significantly under the SSP2-4.5 scenario, while there is a more pronounced overall upward trend relative to SSP5-8.5, indicating a greater likelihood of future extreme precipitation events under this scenario. Although the CDD, CWD, PRCPTOT, and SDII indices do not have a wide range of fluctuations, they all show overall increasing trends. In summary, extreme precipitation events will increase in the future, and the possible precipitation risk in Shenzhen will also increase. In this context, there is an urgent need to improve the flood warning system in Shenzhen to reduce flood risks and losses, to enable the city to better cope with climate change.
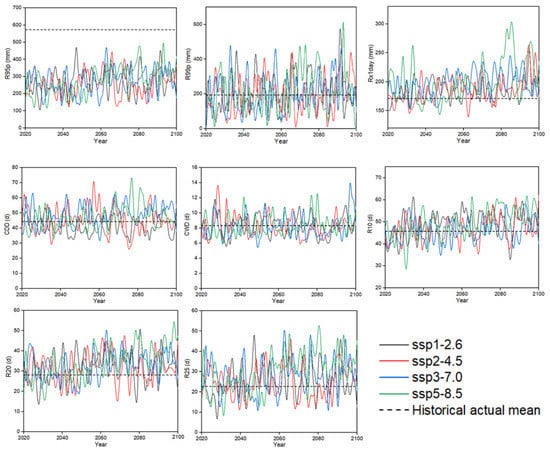
Figure 10.
Variation series of extreme precipitation indicators in Shenzhen under four scenarios (see Table 2 for definitions and classifications of extreme precipitation indicators).
4.3. Main Measures to Cope with Climate Change Risks in Shenzhen
With the intensification of climate change, extreme weather events will be more frequent in the future. If Shenzhen is negatively affected by heavy rainfall and flooding for a long time period, it will not only cause huge economic losses to the city, but will also seriously threaten urban security. In the face of the increasingly serious flood situation, especially in high-density urbanized areas, flood prevention and drainage should be further applied as rigid constraints for urban construction based on the rigid water resource constraints. The key to integrated urban flood risk management is sponge city construction and urban resilience enhancement. In order to better cope with climate change and reduce climate risks and flood losses, on the basis of systematic assessment of climate risks in Shenzhen combined with the current situation of extreme precipitation risks and future prediction results, we propose an integrated urban flood risk management resilience strategy in terms of smart city construction, smart water utilities, sponge city construction, and system improvements.
4.3.1. Strengthening Smart City and Smart Water Utilities Construction
From the predicted results of the extreme precipitation index in Shenzhen, it is expected that the intensity of heavy rainfall will continue to reach new maximum levels, relying on natural ecological storage and purification methods is difficult to “absorb” the rain. Urban construction in Shenzhen should take into account the whole process of the natural–social water cycle. Not only can it effectively mitigate the impact of urban flood disasters but it can also consider water ecological protection and flood resource reuse. Spatial planning and land-use adjustment should enhance the spatial flood resilience of the city and realize the resource utilization of rainwater [63].
On 12 July 2018, the Shenzhen Municipal People’s Government approved and issued the “Overall Plan for the Construction of a New Type of Smart City in Shenzhen”, which specifies the working ideas and overall objectives, general framework, construction principles, implementation mechanism, and key projects, and guarantee measures for the construction of a smart city [64]. The Overall Plan states that Shenzhen should construct a new integrated smart city and develop a new national type of smart city benchmark city of world-class standard.
The construction of smart cities plays a crucial role in a cities’ response to climate change [65,66,67]. In the face of urban flooding, digital means are used to empower urban drainage situation management, comprehensive scheduling and control of road traffic, and management of emergencies. This allows the realization of the prediction of crises, the management of emergency scheduling, and the rapid formulation of response measures to minimize disaster losses and improve a cities’ response to climate risks. Smart water utilities can improve the lack of information perception in water security, build business systems (such as smart basin management, smart reservoir area, water diversion project management, whole process management of water projects, water administration and law enforcement, and a joint scheduling model of multiple water sources, etc.). This will enable realization of the intelligent support provided by information technology for water security and other businesses in Shenzhen and provide information security for the completion of key water services such as water quality control and river chief system management [68].
4.3.2. Promotion of Sponge City Construction
Due to the increased frequency of extreme precipitation events and the increased risk of urban flooding in the future, urban construction in Shenzhen faces additional requirements to cope with extreme weather. In view of this, the implementation of the sponge concept and resilience strategy and the construction of a sponge city that integrates water system management and flood control functions will greatly improve the current waterlogging prone situation of urban flooding and the urban ecological environment [69]. Sponge cities is a new generation of urban rainwater management concept, and refers to constructing cities to act like a sponge. This is achieved through strengthening urban planning and construction management, make the building, road and green space, water system and other ecosystems produce effect on rainwater absorption, storage, and slow release, and effective control of rainwater runoff, to realize the natural accumulation, infiltration and purification of rainfall in urban areas. Sponge cities are resilient in adapting to environmental changes and responding to natural disasters caused by rainwater and can also be referred to as “water-resilient cities” [70].
Shenzhen became one of the second batch of national sponge city pilot cities in 2016, and in January 2019, the Shenzhen Planning and National Resources Committee released the “Shenzhen Sponge City Construction Special Planning and Implementation Plan (Optimization)”. The plan specifies that the overall goal is to minimize the impact of urban development and construction on the ecological environment through the construction of sponge cities and the comprehensive adoption of measures such as “seepage, retention, storage, purification, use, and discharge”. In this context, the use of the internet, cloud computing, big database, artificial intelligence, and other emerging information technologies can also promote information regarding sponge cities. On the basis of the existing various types of water-related information management system, combining remote sensing big data and a spatio-temporal intelligence model, which will be integrated into the wisdom of the city cloud computing center, disaster risk warning, rainfall and flood storage, ecological environment monitoring, and other multi-functional integration, play a comprehensive and integrated ecological wisdom system services [71,72,73].
4.3.3. Engineering and Non-Engineering Measures
Cheng et al. conducted research in the Taihu Lake Basin and found that the urban flood risk could, in theory, be mitigated by improving flood control and drainage standard, such as the construction of flood control projects [74]. However, there is a threshold of the flood control and drainage standard, and when the standard is greater than this threshold, the cost will increase significantly; however, the flood control benefit is lower than the input cost [75,76]. Therefore, according to this feature, the present study proposes the following two measures:
- Flood standard ≤ once in 50 years: Risk control as the main measure.
Improving urban flood resilience must be achieved by taking engineering and non-engineering measures to resist, absorb, and adapt to flood risks. Furthermore, in order to maintain urban structure and function, engineering measures (such as strengthening regional pumping capacity) and non-engineering measures (such as improving flood control planning) must be taken to enhance the responsiveness of cities to resist, absorb, and adapt to flood risks.
Engineering measures: These mainly rely on the construction or improvement of the engineering standards of urban drainage systems and flood control and drainage systems to treat and remove urban rainwater (mainly including urban rivers, municipal drainage pipelines, drainage pumping stations, dikes, sluices, reservoirs, etc.). It is also possible to increase the water storage capacity of cities by building sponge cities.
Non-engineering measures: These mainly include strengthening risk management, improving forecasting and early warning capabilities, improving flood control standards and related regulations, raising public awareness, and building smart water services and smart cities. Among them, strengthening risk management requires governments at all levels to improve the mechanism and system, and to improve the level of risk management in terms of three aspects: (1) Strengthening the government’s comprehensive coordination and command, promoting departmental collaboration and linkage, and encouraging social forces to participate; (2) improving forecasting and early warning capabilities by establishing an independent flood forecasting and early warning system to forecast the flood characteristics of urban rivers based on the rainfall and water conditions in the upstream basin, and make scientific decisions; (3) improving flood control and drainage standards and related laws and regulations, i.e., unifying urban drainage standards and water conservancy drainage standards, and restricting and sanctioning economic and social activities that are not conducive to flood control and disaster mitigation through mandatory codes of conduct; (4) finally, the flood risk awareness and flood risk prevention capabilities of the society should be improved, and public participation in flood risk management should be strengthened. Redesigning the organizational structure enhances the flexibility and adaptability of the organization, and improves the flexibility of the system to adapt to various uncertain disturbances.
- 2.
- Flood standard > once in 50 years: Consider risk transfer.
There is a threshold value for engineering measures to reduce climate risk losses, and the cost effectiveness of engineering measures decreases sharply when the standard of flood control reaches > 50 years, which requires transferring flood risks through market-based means such as catastrophic insurance (i.e., flood insurance). Although insurance itself cannot reduce disaster losses, on the one hand it can relieve the government’s economic pressure on flood relief, and on the other hand it can indirectly play a role in regulating urban flood prevention and mitigation [77,78].
Urban flood insurance is one of the main measures of urban flood risk management. The risks it bears mainly have three characteristics, as follows: (1) Non-eliminability—the risk of flooding can be reduced at a limited cost, but the risk is not completely eliminated; (2) relative predictability—compared with catastrophes such as earthquakes and tsunamis, flood disasters occur with a certain frequency and are, therefore, more controllable; (3) catastrophic characteristics—although urban flood disasters themselves have certain controllability, urban flood disasters still have the common characteristics of catastrophes with concentrated risk, high unpredictability, and huge losses [79].
At the same time, urban flood insurance also has two major attributes [80]: Insurability: region-specific and frequent flood risks are not strictly insurable risks. Therefore, flood insurance must be based on the regional flood control facilities reaching certain standards and ensuring a large insurance coverage in order to better comply with the accomplishment of large numbers of insurance and have a strong insurability; quasi-public product attributes: urban flood insurance is a product with obvious public welfare and high social benefits, but which also has a private product nature, i.e., it is a quasi-public product. This characteristic determines that flood insurance cannot be carried out by commercial insurance companies alone, and that its implementation must implement a government-led or government and market combined mechanism.
5. Conclusions
Based on the background investigation of the flood disaster risk in Shenzhen city, this paper analyzed the historical precipitation changes and the impact of major flood disasters in Shenzhen in recent decades. Using the six kinds of model data of the sixth stage scenario MIP of the CMIP6, we predicted the climate change trend of Shenzhen from 2020 to 2100. Further, on this basis, we proposed measures for cities to deal with future flood threats. The main findings were as follows:
- The mean monthly rainfall in Shenzhen is 160.8 mm, and the maximum monthly rainfall is 1395.3 mm. Rainfall is mainly concentrated from April to September, during which the rainfall in Shenzhen Station accounts for 85.11% of the annual rainfall. Extreme rainfall mainly occurs in June. During the period from 1953 to 2020, extreme precipitation at Shenzhen Station changed insignificantly, and the total amount of precipitation showed a weakly increasing trend. Although the intensity of precipitation decreased, the number of persistently dry days decreased, the number of persistently wet days increased (though not significantly), and the frequencies of light and heavy rainfall increased. These results indicated that extreme wet events were more frequent and that the risk of heavy rainfall and flooding increased from 1953 to 2020.
- The MR composite score shows that the models with the best to worst ability to simulate extreme precipitation indices in Shenzhen are BCC-CSM2-MR > PI-ESM1-2-LR > GOALS-g3 > PSL-CM6A-L > MCC-CM2-SR5 > CanESM5. The series of extreme precipitation index changes under the four scenarios indicate that future precipitation will tend to be unstable. Except for the R95p index, which shows a significant decrease in the future, other extreme precipitation indexes will generally increase. R99p, Rx1day, Rx5day, R20, and R25 will be the most important factors leading to flood events. In the future, extreme weather events will increase, and the risk of precipitation in Shenzhen will also increase.
- The causes of flooding in Shenzhen are multifaceted, complex, and comprehensive. The weather process of short-duration heavy precipitation is the direct meteorological factor triggering flooding in Shenzhen, and the drainage capacity is the key factor for the occurrence of flooding. Specific resilience strategies for integrated urban flood risk management include strengthening the construction of new smart cities, promoting smart water utilities, and sponge city construction. In addition, risk control is the main measure when the flood standard is ≤ once in 50 years. When the flood standard is > once in 50 years, the main consideration is to transfer the flood risk by market-based means such as catastrophic insurance.
Author Contributions
Conceptualization, W.S. and J.L. (Jiahong Liu); methodology, W.S. and X.S.; software, X.S. and J.L. (Jie Lu); validation, J.L. (Jie Lu).; formal analysis, W.S., J.L. (Jiahong Liu), and Z.Y.; investigation, X.S., J.L. (Jie Lu), C.M., C.L., and J.L. (Jiahui Lu); resources, W.S. and J.L. (Jiahong Liu); data curation, X.S. and J.L. (Jie Lu); writing—original draft preparation, W.S., X.S., and J.L. (Jie Lu); writing—review and editing, W.S., X.S., J.L. (Jie Lu), and J.L. (Jiahong Liu); visualization, W.S., X.S. and J.L. (Jie Lu); supervision, J.L. (Jiahong Liu), Z.Y., and C.M.; project administration, W.S. and J.L. (Jiahong Liu). All authors have read and agreed to the published version of the manuscript.
Funding
This research received no external funding.
Institutional Review Board Statement
Not applicable.
Informed Consent Statement
Not applicable.
Data Availability Statement
All data used in this study are available upon request.
Acknowledgments
The researchers would like to extend their thanks to the Chinese National Key Research and Development Program (2018YFC1508203) and Chinese National Natural Science Foundation (Nos. 51979285, 51739011 and 51879274). We also want to express the thanks to the Climate Risk and Resilience in China (CRR) project supported by GIZ (Deutsche Gesellschaft für Internationale Zusammenarbeit) and SDC (Swiss Agency for Development and Cooperation). We also thank the anonymous reviewers and the Editor for their insightful comments and helpful suggestions to improve this manuscript. We also thank the help of World Climate Research Programme’s Working Group on Coupled Modelling, which is responsible for CMIP.
Conflicts of Interest
The authors declare no conflict of interest.
References
- Xiong, Y.; Ta, Z.; Gan, M.; Yang, M.L.; Yu, Y. Evaluation of cmip5 climate models using historical surface air temperatures in central Asia. Atmosphere 2021, 12, 308. [Google Scholar] [CrossRef]
- Intergovernmental Panel on Climate Change (IPCC). Climate Change 2013: The Physical Science Basis. Contribution of Working Group I to the Fifth Assessment Report of the Intergovernmental Panel on Climate Change; Cambridge University Press: Cambridge, UK; New York, NY, USA, 2013; p. 1535. [Google Scholar]
- IPCC. Climate Change 2014: Synthesis Report; Cambridge University Press: Cambridge, UK; New York, NY, USA, 2014. [Google Scholar]
- Piras, M.; Mascaro, G.; Deidda, R.; Vivoni, E.R. Impacts of climate change on precipitation and discharge extremes through the use of statistical downscaling approaches in a Mediterranean basin. Sci. Total Environ. 2016, 543, 952–964. [Google Scholar] [CrossRef]
- Aslam, A.Q.; Ahmad, S.R.; Ahmad, I.; Hussain, Y.; Hussain, M.S. Vulnerability and impact assessment of extreme climatic event: A case study of southern Punjab, Pakistan. Sci. Total Environ. 2017, 580, 468–481. [Google Scholar] [CrossRef] [PubMed]
- Maxwell, S.L.; Butt, N.; Maron, M.; McAlpine, C.A.; Chapman, S.; Ullmann, A.; Segan, D.B.; Watson, J.E. Conservation implications of ecological responses to extreme weather and climate events. Divers. Distrib. 2019, 25, 613–625. [Google Scholar] [CrossRef]
- Lancia, M.; Zheng, C.; He, X.; Lerner, D.N.; Andrews, C.; Tian, Y. Hydrogeological constraints and opportunities for “Sponge City” development: Shenzhen, Southern China. J. Hydrol. Reg. Stud. 2020, 28, 100679. [Google Scholar] [CrossRef]
- Nyaupane, N.; Thakur, B.; Kalra, A.; Ahmad, S. Evaluating future flood scenarios using CMIP5 climate projections. Water 2018, 10, 1866. [Google Scholar] [CrossRef]
- Lehtonen, I.; Jylhä, K. Tendency towards a more extreme precipitation climate in the Coupled Model Intercomparison Project Phase 5 models. Atmos. Sci. Lett. 2019, 20, e895. [Google Scholar] [CrossRef]
- Alfieri, L.; Feyen, L.; Di Baldassarre, G. Increasing flood risk under climate change: A pan-European assessment of the benefits of four adaptation strategies. Clim. Chang. 2016, 136, 507–521. [Google Scholar] [CrossRef]
- Wang, L.; Chen, S.; Zhu, W.; Ren, H.; Zhang, L.; Zhu, L. Spatiotemporal variations of extreme precipitation and its potential driving factors in China’s North-South Transition Zone during 1960–2017. Atmos. Res. 2021, 252, 105429. [Google Scholar] [CrossRef]
- Tegegne, G.; Melesse, A.M.; Alamirew, T. Projected changes in extreme precipitation indices from CORDEX simulations over Ethiopia, East Africa. Atmos. Res. 2020, 247, 105156. [Google Scholar] [CrossRef]
- Liang, K.; Bai, P.; Li, J.; Liu, C. Variability of temperature extremes in the Yellow River basin during 1961–2011. Quat. Int. 2014, 336, 52–64. [Google Scholar] [CrossRef]
- Sun, W.; Mu, X.; Song, X.; Wu, D.; Cheng, A.; Qiu, B. Changes in extreme temperature and precipitation events in the Loess Plateau (China) during 1960–2013 under global warming. Atmos. Res. 2016, 168, 33–48. [Google Scholar] [CrossRef]
- Zolina, O.; Kapala, A.; Simmer, C.; Gulev, S.K. Analysis of extreme precipitation over Europe from different reanalyses: A comparative assessment. Glob. Planet. Chang. 2004, 44, 129–161. [Google Scholar] [CrossRef]
- Liu, K.; Nie, G.; Zhang, S. Study on the Spatiotemporal Evolution of Temperature and Precipitation in China from 1951 to 2018. Adv. Earth Sci. 2020, 35, 1113–1126. [Google Scholar] [CrossRef]
- Eyring, V.; Bony, S.; Meehl, G.A.; Senior, C.A.; Stevens, B.; Stouffer, R.J.; Taylor, K.E. Overview of the Coupled Model Intercomparison Project Phase 6 (CMIP6) experimental design and organization. Geosci. Model Dev. 2016, 9, 1937–1958. [Google Scholar] [CrossRef]
- O’Neill, B.C.; Tebaldi, C.; Vuuren, D.P.V.; Eyring, V.; Friedlingstein, P.; Hurtt, G.; Knutti, R.; Kriegler, E.; Lamarque, J.; Lowe, J.; et al. The scenario model intercomparison project (ScenarioMIP) for CMIP6. Geosci. Model Dev. 2016, 9, 3461–3482. [Google Scholar] [CrossRef]
- Ukkola, A.M.; de Kauwe, M.G.; Roderick, M.L.; Abramowitz, G.; Pitman, A.J. Robust future changes in meteorological drought in CMIP6 projections despite uncertainty in precipitation. Geophys. Res. Lett. 2020, 47, e2020GL087820. [Google Scholar] [CrossRef]
- Ma, F.; Yuan, X.; Jiao, Y.; Ji, P. Unprecedented Europe heat in June–July 2019: Risk in the historical and future context. Geophys. Res. Lett. 2020, 47, e2020GL087809. [Google Scholar] [CrossRef]
- Bracegirdle, T.J.; Krinner, G.; Tonelli, M.; Haumann, F.A.; Naughten, K.A.; Rackow, T.; Roach, L.A.; Wainer, I. Twenty first century changes in Antarctic and Southern Ocean surface climate in CMIP6. Atmos. Sci. Lett. 2020, 21, e984. [Google Scholar] [CrossRef]
- Akinsanola, A.A.; Kooperman, G.J.; Pendergrass, A.G.; Hannah, W.M.; Reed, K.A. Seasonal representation of extreme precipitation indices over the United States in CMIP6 present-day simulations. Environ. Res. Lett. 2020, 15, 094003. [Google Scholar] [CrossRef]
- Chen, H.; Sun, J.; Lin, W.; Xu, H. Comparison of CMIP6 and CMIP5 models in simulating climate extremes. Sci. Bull. 2020, 65, 1415–1418. [Google Scholar] [CrossRef]
- Palmer, T.N.; Doblas-Reyes, F.J.; Hagedorn, R.; Weisheimer, A. Probabilistic prediction of climate using multi-model ensembles: From basics to applications. Trans. R. Soc. B Biol. Sci. 2005, 360, 1991–1998. [Google Scholar] [CrossRef] [PubMed][Green Version]
- Thomson, M.C.; Doblas-Reyes, F.J.; Mason, S.J.; Hagedorn, R.; Connor, S.J.; Phindela, T.; Morse, A.P.; Palmer, T.N. Malaria early warnings based on seasonal climate forecasts from multi-model ensembles. Nature 2006, 439, 576–579. [Google Scholar] [CrossRef] [PubMed]
- Liu, Z.; Cai, Y.; Wang, S.; Lan, F.; Wu, X. Small and medium-scale river flood controls in highly urbanized areas: A whole region perspective. Water 2020, 12, 182. [Google Scholar] [CrossRef]
- Linham, M.M.; Green, C.H.; Nicholls, R.J. Costs of Adaptation to the Effects of Climate in the World’s Largest Port Cities; A VOID: London, UK, 2010; p. 225. [Google Scholar]
- Lasage, R.; Veldkamp, T.I.E.; de Moel, H.; Van, T.C.; Phi, H.L.; Vellinga, P.; Aerts, J.C.J.H. Assessment of the effectiveness of flood adaptation strategies for HCMC. Nat. Hazards Earth Syst. Sci. 2014, 14, 1441–1457. [Google Scholar] [CrossRef]
- Li, Y.; Guo, F.; Mao, K.; Chen, F. Response strategy for drought and flood in sponge city construction risk under the background of climate change. In IOP Conference Series: Earth and Environmental Science; IOP Publishing: Bristol, UK, 2019; Volume 252, p. 042015. [Google Scholar] [CrossRef]
- Shenzhen Climate Bulletin. 2008. Available online: http://weather.sz.gov.cn/ (accessed on 20 April 2021).
- Wu, W.; Mu, H.; Liang, Z.; Liu, X. Projected changes in extreme temperature and precipitation events in Shanghai based on CMIP5 simulations. Clim. Environ. Res. 2016, 21, 269–281. [Google Scholar] [CrossRef]
- Holling, C.S. Resilience and Stability of Ecological Systems. Annu. Rev. Ecol. Syst. 1973, 4, 1–23. [Google Scholar] [CrossRef]
- Alberti, M.; Marzluff, J.M.; Shulenberger, E.; Bradley, G.; Ryan, C.; Zumbrunnen, C. Integrating humans into ecology: Opportunities and challenges for studying urban ecosystems. BioScience 2003, 53, 1169–1179. [Google Scholar] [CrossRef]
- Alliance, R. Urban Resilience Research Prospectus. Australia; CSIRO: Canberra, Australia, 2007; Volume 2, Available online: http://81.47.175.201/ET2050_library/docs/scenarios/urban_resilence.pdf (accessed on 20 April 2021).
- Berkes, F.; Colding, J.; Folke, C. (Eds.) Navigating Social-Ecological Systems: Building Resilience for Complexity and Change; Cambridge University Press: Cambridge, UK, 2008. [Google Scholar]
- Jabareen, Y. Planning the resilient city: Concepts and strategies for coping with climate change and environmental risk. Cities 2013, 31, 220–229. [Google Scholar] [CrossRef]
- Wardekker, J.A.; de Jong, A.; Knoop, J.M.; van der Sluijs, J.P. Operationalising a resilience approach to adapting an urban delta to uncertain climate changes. Technol. Forecast. Soc. Chang. 2010, 77, 987–998. [Google Scholar] [CrossRef]
- Meyer, V.; Priest, S.; Kuhlicke, C. Economic evaluation of structural and non-structural flood risk management measures: Examples from the Mulde River. Nat. Hazards 2011, 62, 301–324. [Google Scholar] [CrossRef]
- Wang, H.; Mei, C.; Liu, J.; Shao, W. A new strategy for integrated urban water management in China: Sponge city. Sci. China Ser. E Technol. Sci. 2018, 61, 317–329. [Google Scholar] [CrossRef]
- Liang, X. Integrated Economic and Financial Analysis of China’s Sponge City Program for Water-resilient Urban Development. Sustainability 2018, 10, 669. [Google Scholar] [CrossRef]
- Xia, J.; Zhang, Y.; Xiong, L.; He, S.; Wang, L.; Yu, Z. Opportunities and challenges of the Sponge City construction related to urban water issues in China. Sci. China Earth Sci. 2017, 60, 652–658. [Google Scholar] [CrossRef]
- Yuanyuan, W.; Ping, L.; Wenze, S.; Xinchun, Y. A New Framework on Regional Smart Water. Procedia Comput. Sci. 2017, 107, 122–128. [Google Scholar] [CrossRef]
- Zhang, Y.; Luo, W.; Yu, F. Construction of Chinese Smart Water Conservancy Platform Based on the Blockchain: Technology Integration and Innovation Application. Sustainability 2020, 12, 8306. [Google Scholar] [CrossRef]
- Li, T. Study on the application of smart water affairs based on the concept of sponge city. Water Supply Drain 2017, 53, 129–135. [Google Scholar] [CrossRef]
- Jiang, Y.; Luo, Y.; Xu, X. Flood insurance in China: Recommendations based on a comparative analysis of flood insurance in developed countries. Environ. Earth Sci. 2019, 78, 1–11. [Google Scholar] [CrossRef]
- Taolue, F. Emergency Management of Foreign Cities from the Perspective of Flood Fighting. Available online: https://3g.163.com/news/article/FIQ74UR70519D828.html (accessed on 18 April 2021).
- Cheng, X. Strengthening Flood and Drought Disaster Management. The Common Trend of Global Water Control Strategy Adjustment. China Water Conservancy Technology Information Center. Summary of Urban and Rural Drinking Water Source Safety and Development; China Water Conservancy Technology Information Center: Beijing, China, 2009; pp. 58–61. [Google Scholar]
- Zhou, A. The difficulties and countermeasures of flood insurance in my country. Prod. Res. 2010, 03, 171–172. [Google Scholar] [CrossRef]
- Xu, D.; Ouyang, Z.; Wu, T.; Han, B. Dynamic Trends of Urban Flooding Mitigation Services in Shenzhen, China. Sustainability 2020, 12, 4799. [Google Scholar] [CrossRef]
- Zhang, L.; Chen, X.; Xin, X. Overview and review of CMIP6 Scenario Model Comparison Program (ScenarioMIP). Clim. Chang. Res. 2019, 15, 519–525. [Google Scholar] [CrossRef]
- Yin, H.; Sun, Y. Characteristics of extreme temperature and precipitation in China in 2017 based on ETCCDI indices. Adv. Clim. Chang. Res. 2018, 9, 218–226. [Google Scholar] [CrossRef]
- Taylor, K.E. Summarizing multiple aspects of model performance in a single diagram. J. Geophys. Res. Atmos. 2001, 106, 7183–7192. [Google Scholar] [CrossRef]
- Tebaldi, C.; Hayhoe, K.; Arblaster, J.M.; Meehl, G.A. Going to the extremes: An intercomparison of model-simulated historical and future changes in extreme events. Clim. Chang. 2006, 79, 185–211. [Google Scholar] [CrossRef]
- Li, L. Spatial and Temporal Evolution Patterns of Extreme Temperature, Precipitation and Drought Events and Their Multi-Model Predictions; Northwest Agriculture and Forestry University: Shaanxi, China, 2019. [Google Scholar]
- Li, Y.; Yan, D.; Peng, H.; Xiao, S. Evaluation of precipitation in CMIP6 over the Yangtze River Basin. Atmos. Res. 2020, 253, 105406. [Google Scholar] [CrossRef]
- Chen, X. Comparison and analysis of the causes of rainstorms and waterlogging in Beijing “7.21” and Shenzhen “6.13”. Water Resour. Dev. Res. 2013, 13, 39–43. [Google Scholar] [CrossRef]
- Huang, J.; Cao, W.; Wang, H.; Wang, Z. Affect path to flood protective coping behaviors using SEM based on a survey in Shenzhen, China. Int. J. Environ. Res. Public Health 2020, 17, 940. [Google Scholar] [CrossRef]
- Wu, Y.; Li, H. Meteorological disasters and risk assessment in Shenzhen since 2000. Guangdong Meteorol. 2009, 31, 43–45. [Google Scholar] [CrossRef]
- Schuenemann, K.C.; Cassano, J.J. Changes in synoptic weather patterns and Greenland precipitation in the 20th and 21st centuries: Evaluation of late 20th century simulations from IPCC models. J. Geophys. Res. 2009, 114, 1–20. [Google Scholar] [CrossRef]
- Lu, X.; Rao, X.; Dong, W. Model evaluation and uncertainties in projected changes of drought over northern China based on CMIP5 models. Int. J. Climatol. 2021, 41, E3085–E3100. [Google Scholar] [CrossRef]
- Seo, K.H.; Ok, J. Assessing future changes in the East Asian summer monsoon using CMIP3 models: Results from the best model ensemble. J. Clim. 2013, 26, 1807–1817. [Google Scholar] [CrossRef]
- Zhao, T.; Chen, L.; Ma, Z. Simulation of historical and projected climate change in arid and semiarid areas by CMIP5 models. Chin. Sci. Bull. 2014, 59, 412–429. [Google Scholar] [CrossRef]
- Schuetze, T.; Chelleri, L. Integrating decentralized rainwater management in urban planning and design: Flood resilient and sustainable water management using the example of coastal cities in the Netherlands and Taiwan. Water 2013, 5, 593–616. [Google Scholar] [CrossRef]
- Liao, G. Research on the Construction of a New Type of Smart City in Shenzhen; Shenzhen University: Shenzhen, China, 2018. [Google Scholar]
- Tian, Y.; Yang, M.; Jiang, Y. Research on Urban Smart Water Resources Emergency Management. Appl. Mech. Mater. 2013, 409, 75–78. [Google Scholar] [CrossRef]
- Antzoulatos, G.; Mourtzios, C.; Stournara, P.; Kouloglou, I.-O.; Papadimitriou, N.; Spyrou, D.; Mentes, A.; Nikolaidis, E.; Karakostas, A.; Kourtesis, D.; et al. Making urban water smart: The SMART-WATER solution. Water Sci. Technol. 2020, 82, 2691–2710. [Google Scholar] [CrossRef]
- Shahanas, K.M.; Sivakumar, P.B. Framework for a smart water management system in the context of smart city initiatives in India. Procedia Comput. Sci. 2016, 92, 142–147. [Google Scholar] [CrossRef]
- Zhu, X.; Yin, Z.; Liu, Y.; Feng, B.; Wang, Y. Study on Framework Design of Smart Water Management System in Shenzhen. In IOP Conference Series: Earth and Environmental Science; IOP Publishing: Bristol, UK, 2019; Volume 330, p. 032008. [Google Scholar] [CrossRef]
- Chan, F.K.S.; Griffiths, J.A.; Higgitt, D.; Xu, S.; Zhu, F.; Tang, Y.T.; Xu, Y.; Thorne, C.R. “Sponge City” in China—A breakthrough of planning and flood risk management in the urban context. Land Use Policy 2018, 76, 772–778. [Google Scholar] [CrossRef]
- Shao, W.; Liu, J.; Yang, Z.; Yang, Z.; Yu, Y.; Li, W. Carbon reduction effects of Sponge City construction: A case study of the city of Xiamen. Energy Procedia 2018, 152, 1145–1151. [Google Scholar] [CrossRef]
- Li, Y.J.; Zhang, C.; Leng, X.Y. Exploration and expectation of smart sponge city. South North Water Transf. Water Sci. Technol. 2016, 14, 161–164. [Google Scholar] [CrossRef][Green Version]
- Liu, J.; Gong, X.; Ren, X.; Liu, C.; Wu, L.; Wu, Y. Sponge city construction and innovation in Shenzhen. J. Shenzhen Univ. Sci. Eng. 2020, 37, 334–346. [Google Scholar] [CrossRef]
- Zhang, W.; Che, W. Connotation and multi-angle analysis of sponge city construction. Water Resour. Prot. 2016, 32, 19–26. [Google Scholar]
- Cheng, X.; Wu, H. Flood Risk Scenario Analysis Method and Practice—Taking Taihu Lake Basin as an Example; China Water Resources and Hydropower Press: Beijing, China, 2019. [Google Scholar]
- Ma, R.-Y.; Du, Y.; Li, K. Study on flood control risk of flood control engineering system based on the clustering of measured data. Clust. Comput. 2019, 22, S6541–S6549. [Google Scholar] [CrossRef]
- Ge, Y.; Liu, J.; Li, F. Research on assessment method for vulnerability transfer of insured enterprise: A case study of Changsha Region. J. Nat. Disasters 2008, 17, 81–85. [Google Scholar]
- Scott, I.N. The National Flood Insurance Program: Background, Issues and Reauthorization; Nova Science Publishers, Inc.: Hauppauge, NY, USA, 2021. [Google Scholar]
- Surminski, S. The role of insurance in reducing direct risk: The case of flood insurance. Int. Rev. Environ. Resour. Econ. 2014, 7, 241–278. [Google Scholar] [CrossRef]
- Landry, C.; Turner, D. Risk Perceptions and Flood Insurance: Insights from Homeowners on the Georgia Coast. Sustainability 2020, 12, 10372. [Google Scholar] [CrossRef]
- Atreya, A.; Czajkowski, J. Graduated flood risks and property prices in Galveston County. Real Estate Econ. 2019, 47, 807–844. [Google Scholar] [CrossRef]
Publisher’s Note: MDPI stays neutral with regard to jurisdictional claims in published maps and institutional affiliations. |
© 2021 by the authors. Licensee MDPI, Basel, Switzerland. This article is an open access article distributed under the terms and conditions of the Creative Commons Attribution (CC BY) license (https://creativecommons.org/licenses/by/4.0/).