Article

Feasibility for Operationally Monitoring Ground-Based Multichannel Microwave Radiometer by Using Solar Observations

1
Collaborative Innovation Center on Forecast and Evaluation of Meteorological Disasters, CMA Key Laboratory of Aerosol-Cloud-Precipitation, Nanjing University of Information Science & Technology, Nanjing 210044, China
2
School of Atmospheric Physics, Nanjing University of Information Science & Technology, Nanjing 210044, China
3
North Sky-Dome Information Technology (Xi’an) CO., LTD, Xi’an 710100, China
4
Xi’an Electronic Engineering Research Institute, Xi’an 710100, China
5
State Key Laboratory of Information Engineering in Surveying, Mapping and Remote Sensing (LIESMARS), Wuhan University, Wuhan 430074, China
*
Authors to whom correspondence should be addressed.
Atmosphere 2021, 12(4), 447; https://doi.org/10.3390/atmos12040447
Submission received: 5 March 2021 / Revised: 24 March 2021 / Accepted: 29 March 2021 / Published: 31 March 2021
(This article belongs to the Section Atmospheric Techniques, Instruments, and Modeling)

Abstract

:
Ground-based multichannel microwave radiometers can observe the atmospheric microwave radiation brightness temperature and continuously provide temperature and humidity profiles of the troposphere. At present, microwave radiometers are operated in many countries for monitoring climate and meteorological phenomena, and there have been many microwave radiometers of this kind presently implemented in China, but they lack a unified monitor for their operational condition, which is necessary if they are taken as a network. For this reason, a real-time monitoring receiving system of radiometer is fundamental and important. In order to check the system stability and the antenna performances, this paper studied the feasibility of applying the solar signals to monitor the antenna alignment, antenna pattern and stability of a radiometer system in working for operational field applications. An experiment was performed and the results from the analysis of the annual variation features with long-term solar observation data at four frequencies, 22.235, 26.235, 30.000 and 51.250 GHz, show that an antenna pattern retrieved from solar observations agrees well with that retrieved from the traditional method. In addition, a daily analysis of the solar signals in online data of a radiometer can be used for monitoring the alignment of the antenna and the stability of the ground-based microwave radiometer system.

1. Introduction

Ground-based multichannel microwave radiometers (GMRs) can continuously observe atmospheric radiation brightness temperature (TB) in K- and V-bands, and provide valuable data on the temperature, water vapor, cloud liquid and humidity structures of the troposphere [1,2,3,4]. The microwave radiometer is a typical remote sensing device and provides very useful data for the detection of mesoscale phenomena that require high spatial and temporal capabilities (e.g., nowcasting convective activity and heavy rain events, boundary layer meteorology, clouds and assimilating GMR data into the WRF precipitation model) [5,6,7]. In addition, Wang et al. presented the theoretical research for the lightning TB response of a GMR [8], and Jiang et al. remotely sensed artificially triggered lightning events with a GMR to research the lightning heating radiation for the first time [9].
The GMR has become a popular and efficient instrument for remotely sensing the atmospheric temperature and humidity profiles. In order to obtain the fine detection atmospheric temperature and humidity profiles, GMRs have been operated in many countries for monitoring climate and meteorological phenomena in the last few decades [6]. At present, the megacities meteorological observation network of microwave radiometers is gradually being implemented in China, but they lack a unified monitor for their operational condition. In general, common practice monitoring antenna alignment, system gain and receiver stability rely on either target source or methods. For instance, we can measure the antenna pattern to determine the antenna alignment and gain in a microwave anechoic chamber. The performance of the radiometer can be assessed by comparison of the observed TBs against modeled values, and the radiative transfer model can be used to calculate the modeled values with the radiosonde sounding, and the liquid nitrogen is a good target source for calibration and assessing system stability. However, if frequent checks are required, then these methods have the drawback of greater complexity and higher costs for the observation network of microwave radiometers [6,10]. Therefore, a simple, low-cost and automatic monitoring GMR system method is a necessary and important work.
At present, solar microwave radiation observation has long been used to good advantage by radar operators as a convenient radiation source to check out radar system performance according to literature. For example, Darlington et al. detected the method with operational weather radars and the results showed that the solar radiation can be used for health automatic checks of a radar [11]. Holleman et al. made use of solar radiation to check the antenna alignment and the stability of the receiver system of a weather radar [12]. It is said that the azimuth, elevation and effective antenna system gain could be determined with 0.1°, 0.2° and 1.3 dB [12]. This solar monitoring method has been implemented successfully to determine the antenna alignment, check system gain, monitor receiver stability and the differential reflectivity offset [13,14]. Along these lines, we can see that the solar radiation method has revealed to be potentially useful for the GMR system assessment.
In this paper, we attempted to apply the solar radiation method to monitor the health automatic checks of a ground-based microwave radiometer and evaluate the antenna performances; an experiment was also performed with the GMR installed at Xi’an field experimental site (N34.091°, E108.89°), in China. Firstly, we introduce the theory and experiment that the solar microwave radiation was remotely sensed with the GMR. The solar radiation TB increment arriving at the antenna without atmospheric attenuation can be observed by the GMR. Secondly, this paper presents what we have done with the solar method to determine the GMR antenna pattern and to monitor antenna alignment of GMR networks operating in the field. Thirdly, based on the measurement of the antenna pattern with the solar radiation, we extended the solar radiation method to online monitoring of the health automatic checks of the GMR system on a long-term observation. Moreover, the solar radiation method was applied to evaluate the stability and relative sensitivity of the receiving system. The experimental results show that the method of the GMR health checks based on solar observations has the advantages of simple operation and high accuracy.

2. Instrument for Observation

2.1. The System of GMR

The GMR (model MWP967KV) used for this experiment, shown in Figure 1, was developed and manufactured by our research team, and the system performance parameters are given in Table 1. The GMR comprises an antenna system, two sensitive heterodyne receivers, a detector unit, a data retrieval system and additional sensors. The GMR also contains a high-precision elevation and azimuth stepping scanning system to scan the sky, and the angular resolution is 0.1° for both the elevation and azimuth. The schematic internal structure is shown in Figure 2. To ensure high observation accuracy of atmospheric radiation, it is calibrated by liquid nitrogen (LN2), hot load, noise diode and the Tipping curve method. These calibrations can provide an absolute accuracy of at least 0.5 K [15].
The GMR receiver system consists of two heterodyne receivers covering K- and V-bands, it is nominally a 22-channel instrument, the centre frequencies of the channels are given in Table 1, each band is received and detected, and all channels use a common Local Oscillator signal. The antenna system contains a parabolic reflector, beam splitter and the compactness of a corrugated feedhorn, and it is shown in Figure 2. The parabolic reflector can focus the beam and be used to scan the beams in elevation. The corrugated feedhorn offers a wide bandwidth, low cross-polarization level, low sidelobe level, and a rotationally symmetric beam. In order to scan the sun, we tried to improve the antenna servo control system of the GMR so that it could point and track the sun. Hence, it was possible to implement not only meteorological observation mode, but also innovative ones. The upgraded GMR was set up at the Xi’an field experiment site, as shown in Figure 1. We used the GMR to observe the solar microwave radiation.
The period considered in this study extends from December 2019 to January 2021. During this period, the GMR undergoes regular maintenance, including antenna radome cleaning, sanity checks and absolute LN2 calibration. The LN2 calibrations were performed twice a year.

2.2. The GMR’s Solar Observation Mode

The GMR adopts the stable elevation-over-azimuth antenna positioner system and we improved the antenna servo control system of the GMR so that it could track and observe the solar microwave radiation. It works on two modes, i.e., the meteorological observation mode and the solar observation mode.
(1) Meteorological observation mode. Generally, the GMR works on meteorological observation mode to obtain atmospheric TBs which are used to retrieve atmospheric temperature and humidity profiles.
(2) The solar observation mode. This observation mode is specially developed for tracking and observing the solar radiation. The azimuth and elevation observing angles are sent to the antenna servo control system so that the antenna beam can scan the sun once the radiometer enters the solar observation mode. Firstly, the antenna system would be adjusted to control its antenna beam pointing to the position of the sun and tuning the antenna beam to scan the sun. During azimuth scanning, the antenna is moved to around the actual sun position using several Polar Plane Indicator (PPI) scans in the same elevation, by adding a step angle Δ θ A on the azimuth of the sun. In order to obtain a raster scanning for the sun, we need to repeat PPI scanning at different elevations. Secondly, the antenna is adjusted so that the sun is completely out of the beam to scan the sky using Range Height Indicator (RHI) scanning by adding an elevation step angle Δ θ E on the antenna elevation. Measurements in the direction of the sun and in another direction (sky background) were differenced to get an estimate of the solar TB increment. The antenna azimuth and elevation angle can be given as:
A z G M R = A z S U N + Δ θ A ,
E l G M R = E l S U N + Δ θ E ,
where A z G M R and E l G M R are the antenna azimuth and elevation angle. A z S U N and E l S U N are the solar azimuth and elevation angle. The azimuth and elevation step angle Δ θ A and Δ θ E are the relative position between the antenna beam pointing and the sun. Since the sun is moving along the sky within this time interval, we adjusted to control the antenna pointing to scan the sun, and we need to re-calculate the solar azimuth and elevation in real time and it is used to derive the relative position between the antenna beam pointing and the sun for each recorded data point. Each azimuth and elevation scanning can last up to 3 min at each frequency in 29 scanning angles, and the observations were made in a totally automated fashion. The solar observations are typically performed once or twice a week on sunny days and the sun is observed for more than 3 h a day.

3. Theory and Method

3.1. The TB from the Sun Arriving at the Antenna

Based on the theory of microwave radiation transfer in the atmosphere, the observed TB by radiometer can be estimated by the radiative transfer equation. When the antenna is pointed directly at the sun, the TB received by the antenna can be determined as follows [16,17]:
T s u n ( φ , θ ) = T b g e τ ( θ ) + T m [ 1 e τ ( θ ) ] + Ω S T s u n Ω A e τ ( θ ) ,
where φ , θ are the antenna azimuth and elevation angle, respectively,   T m and T b g are the atmospheric mean radiating temperature and cosmic background TB ( T b g = 2.75 K), respectively,   T s u n is the average TB of the sun, Ω S and Ω A are the solid angle of the sun and antenna, respectively. τ ( θ ) is the atmospheric opacity of each direction and it can be calculated by the Tipping calibration method [17,18,19].
When the antenna scans the sky and the sun is not in the beam, the atmospheric TB can be calculated as follows:
T s k y ( φ , θ ) = T b g e τ ( θ ) + T m [ 1 e τ ( θ ) ] .
The TB increment because of the solar radiation arriving at the antenna without atmospheric attenuation can be obtained by subtracting (4) from (3):
Δ T s u n ( φ , θ ) = Ω S T s u n Ω A ,
where Δ T s u n is the TB increment because of the solar radiance, and it is the received solar power as a function of the angle radius from the center of the antenna beam. The TB increment received by the antenna is proportional to the ratio of the solar solid angle to the antenna solid angle [16].

3.2. The Antenna Beamwidth

The GMR antenna beamwidth measurement is important for reliable and accurate antenna temperature measurement but is usually carried out in a microwave anechoic chamber. Measurement using an anechoic chamber is complex and expensive, and especially this cannot be used to monitor the antenna pointing of a radiometer in operational field applications after installation. Existing research shows that the sun can be used to not only calibrate radar antenna pointing but also measure antenna patterns. The use of the solar radiation for checking the antenna specifications has been a well-established method in the radar field. [12,13,20,21]. Therefore, we suggest using the sun method in our study in order to improve the accuracy of a ground-based GMR observation by automatically checking the antenna alignment and system stability.
The position of the sun can be accurately calculated according to literature [22,23]. The sun can be assumed to be in the far-field region and a point source for the antenna, and can be treated as a homogeneous disk with an approximate angular diameter of 0.53°. During the observing of the sun, the received solar power as a function of the radial distance to the antenna beam axis is approximated by a Gaussian function while the GMR antenna is scanning in azimuth and elevation [12,24]. Assuming a uniform disk for the sun and the simplest reasonable model of the actual solar power and antenna power pattern can be parameterized by
Δ T s u n ( x , y ) = A d G ( x , y ) ,
G ( x , y ) = exp [ 4 ln 2 ( x 2 θ H 2 + y 2 θ E 2 ) ] ,
where A d is the TB increment of the antenna beam pointing to the center of the sun and it is the peak solar power. θ H and θ E are the half-power beamwidth of the H-plane (azimuth scanning) and E-plane (elevation scanning), respectively. x and y are the solar azimuth and elevation angle radial distance from the beam center, respectively. Thus, the sun data can be easily fitted to this equation by the least-square method.
When the antenna scans the sun, a rotation of the antenna in azimuth with constant elevation is not a great circle in the sky-sphere, and there are some distortions in the scanning path. The rotation azimuth angle will turn out greater than the true azimuth angle in the sky-sphere and it has to be calibrated. There is an extreme case when the azimuth of the antenna is rotated at an elevation angle of 90°, but the antenna beam will not move in the sky. Reimann and Hagen provided an accurate method to calibrate the angle distortion [21], we calculated the distortion with their method and the result is shown in Figure 3. It can be seen that the distortion is small for low elevation and it is more obvious with a large rotation angle of the antenna in azimuth.

3.3. The Calibration Method of the Gain

The antenna maximum direction gain G can be easily calculated by using the following formula when we have the beamwidth of the antenna [25]:
G = 4 π R Ω D C r ,
where Ω D is the solid angle of the sun, and C r is the correction factor that accounts for the partial resolution of the disk image by the main lobe of the antenna pattern. We can ignore the effect of antenna efficiency, a misalignment between the horn and the parabolic reflector and the non-uniform distribution of the solar TB, and assuming a Gaussian antenna pattern of half-power beamwidth θ A and solar angular diameter θ D , C r can be closely approximated by
C r = 1 exp [ ln 2   ( θ D / θ A ) 2 ] ln 2   ( θ D / θ A ) 2 , i f   θ D < θ A .
The ratio R of the measured power difference is defined as follows:
R = Ω D G ( x , y ) d Ω 4 π G ( x , y ) d Ω .
At the same time, the antenna effective collecting area A e in m2 and the aperture efficiency η are calculated from [12]:
A e = λ 2 G 4 π ,
η = A e / A g 100 ,
where A g is the antenna physical area, and the effective area of the antenna is typically around 50%~60% of the physical area, it is a function of the feedhorn and it is usually very difficult to determine [26]. The popular method is to use the identical antennas to calibrate and measure the effective area in a microwave anechoic chamber and it is complex. However, the effective area can be easily measured by the sun-based monitoring method in operational, field applications after installation, as described above.

4. Result and Discussion

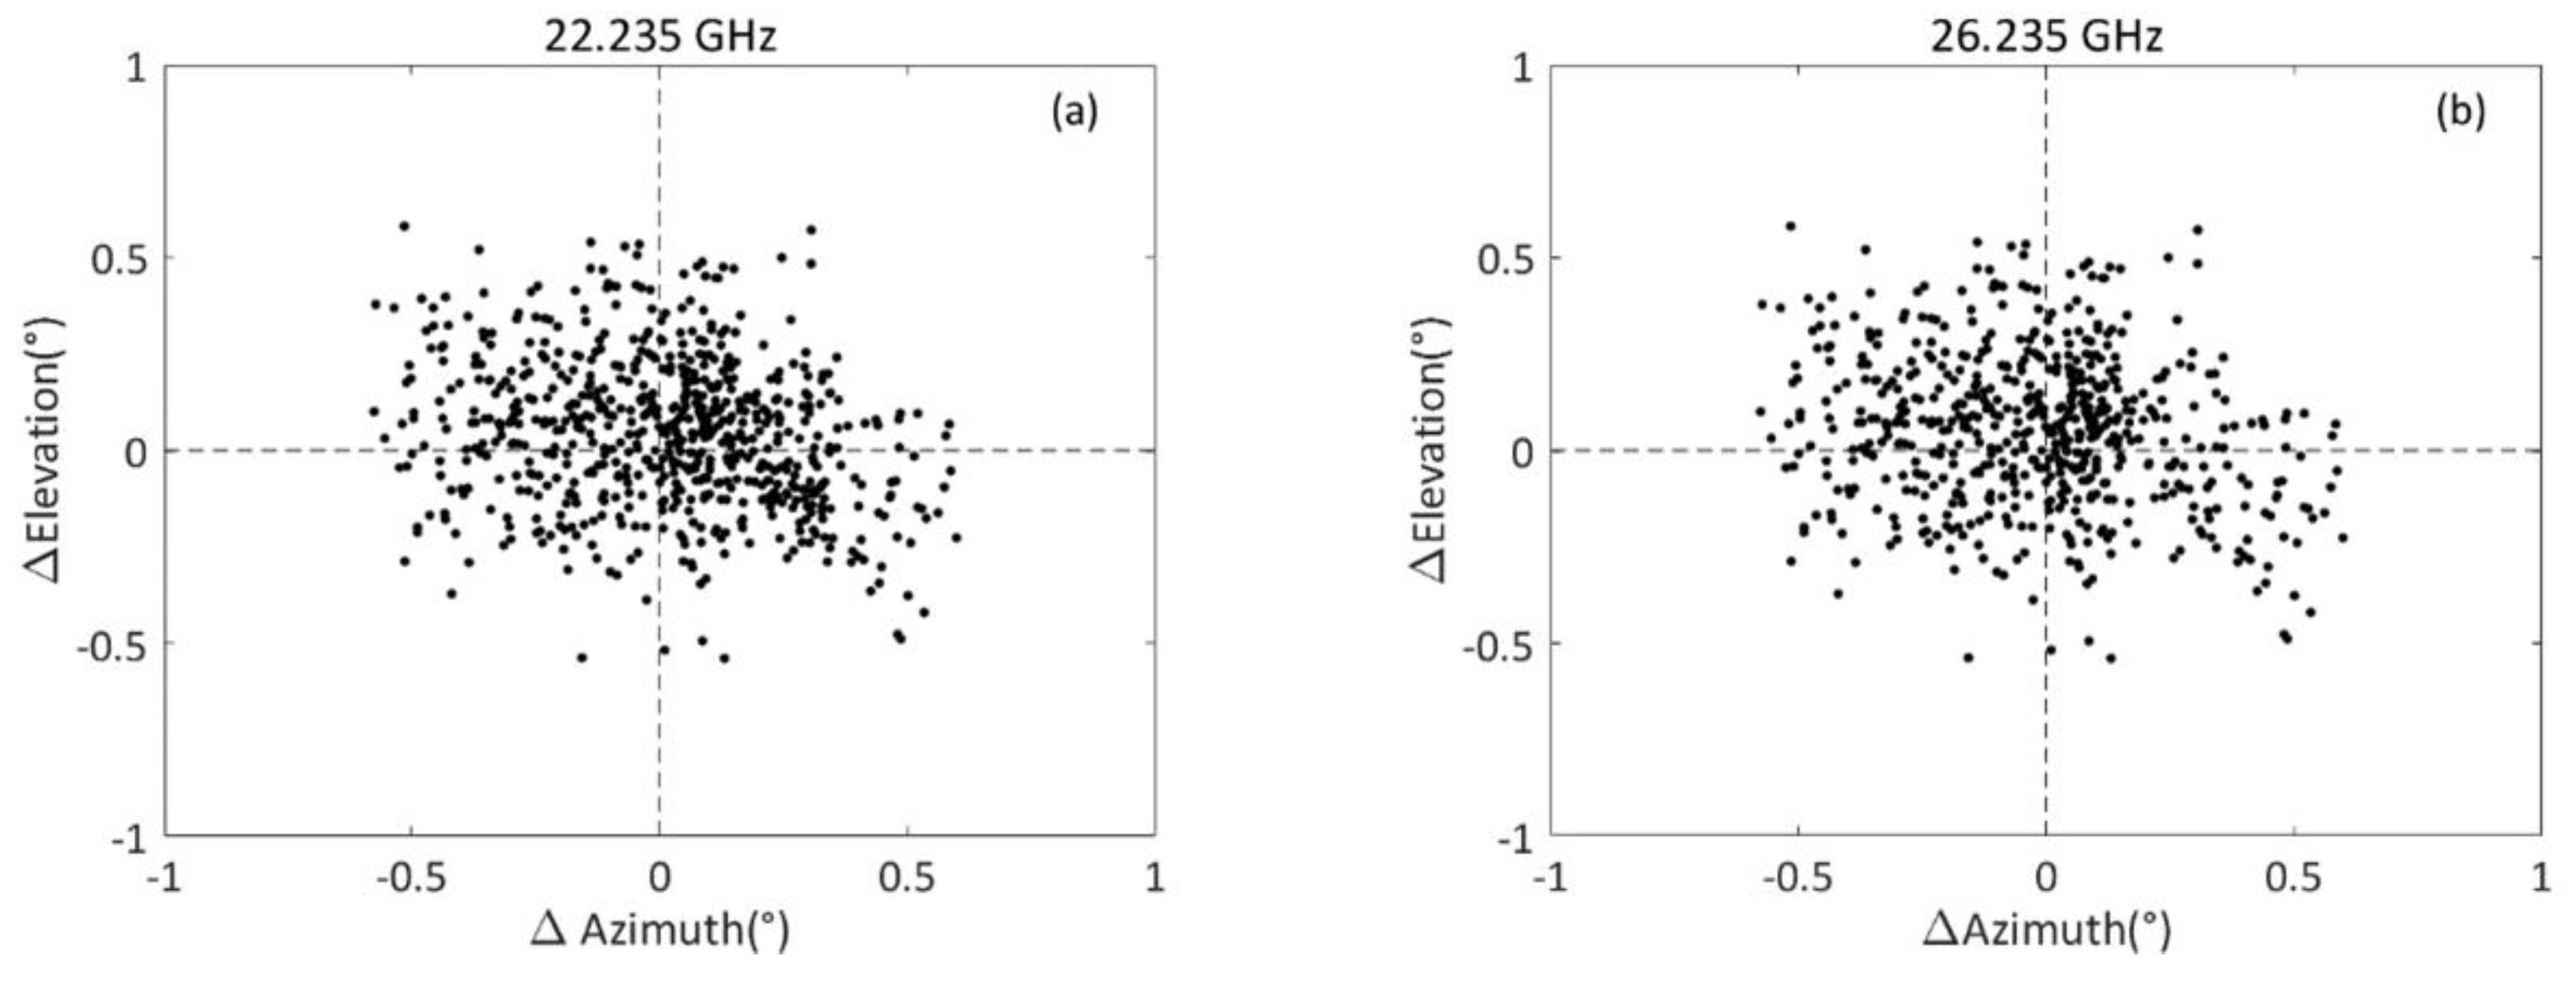
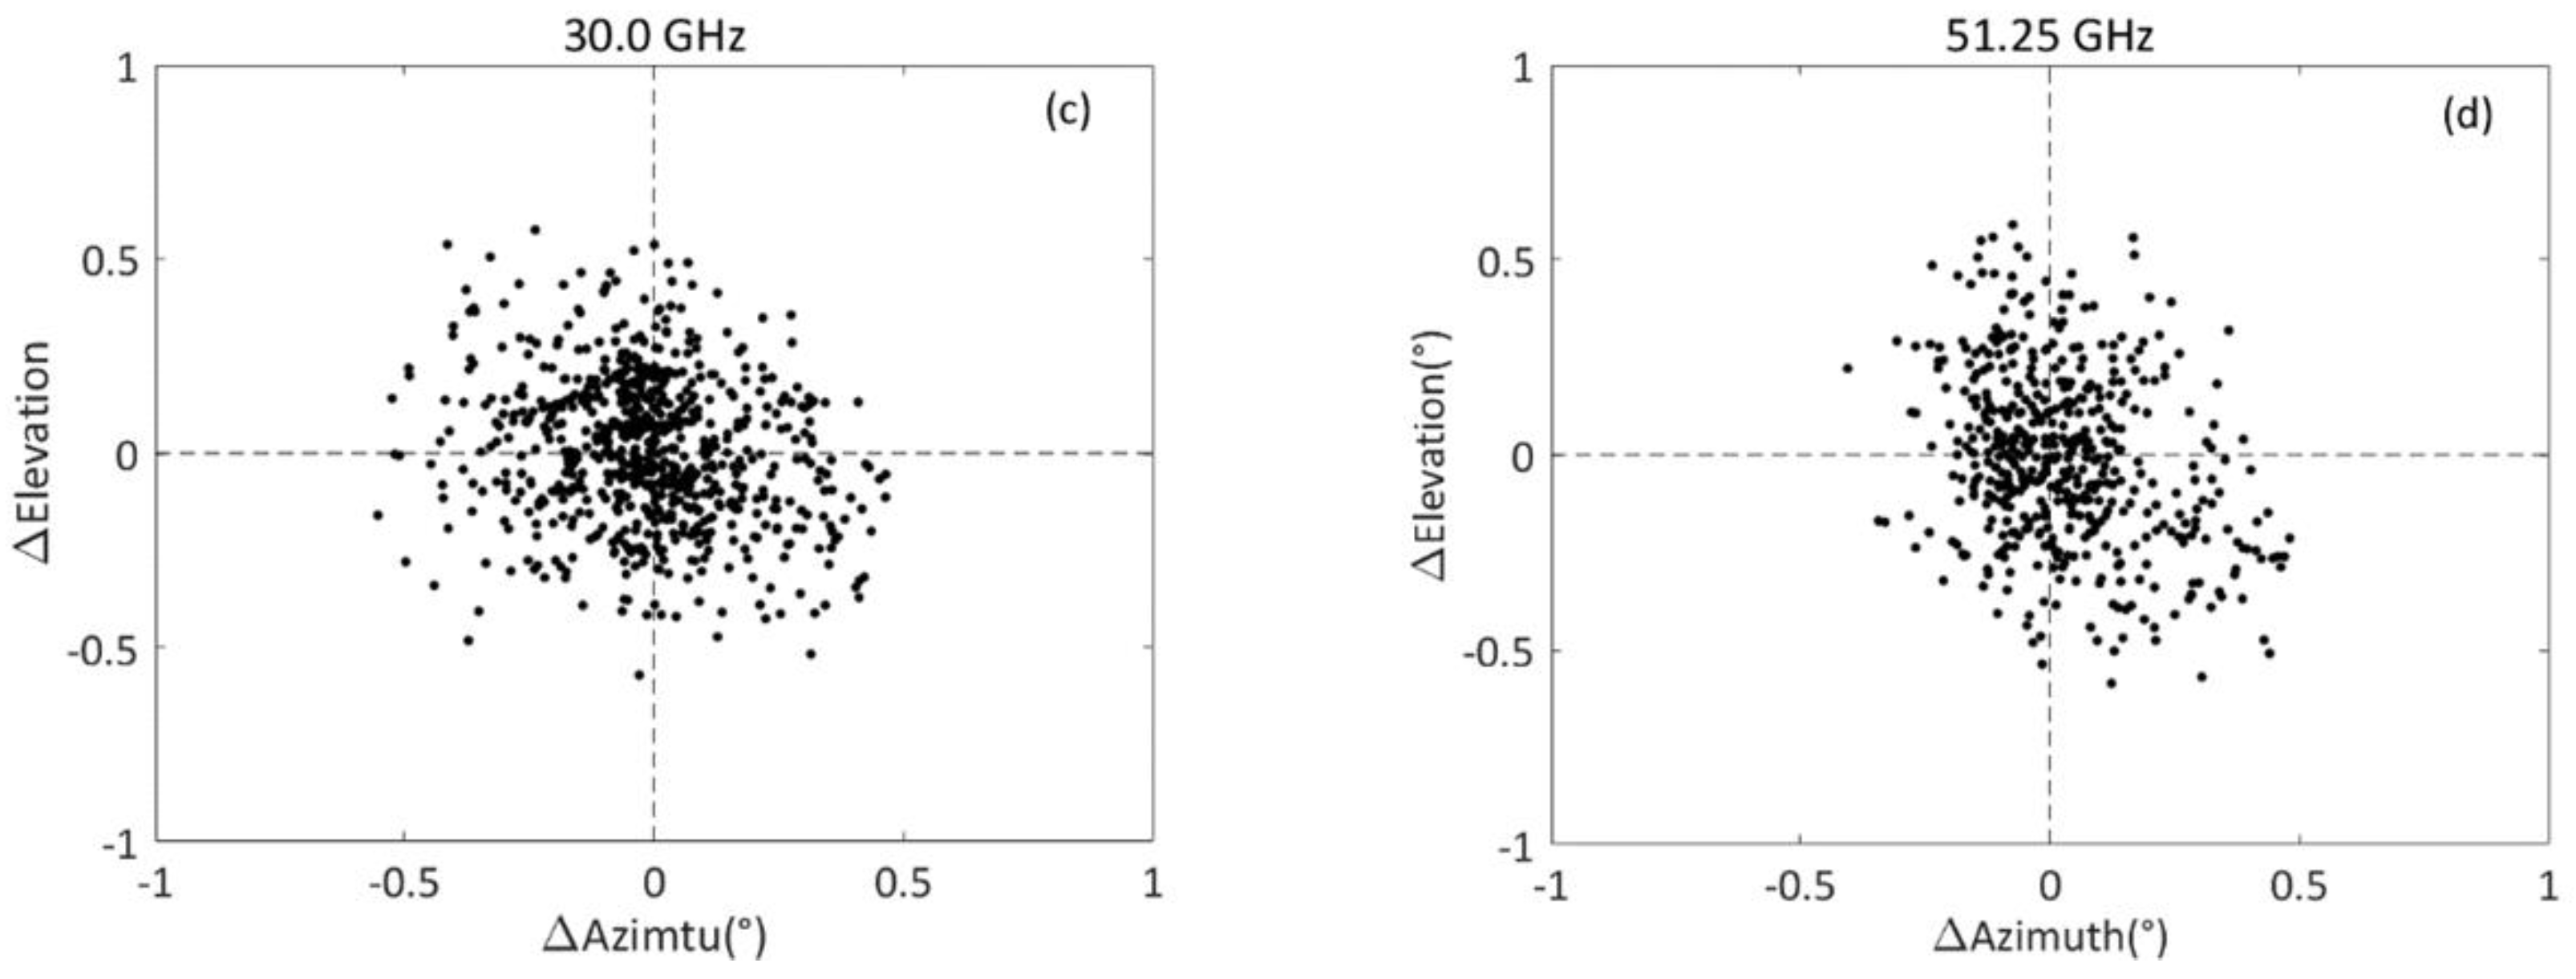
4.1. Antenna Alignment

The maximum amplitude of the TB is received by the GMR when the antenna beam points to the center of the sun. Then, the azimuth and elevation biases of the antenna beam between the peak TB and the predicted sun position are the corresponding calibration angle of antenna pointing. During the beam scanning of azimuth and elevation, the sun is located by an automatic search method until a maximum is found, and the pointing bias can be determined by this method. In addition, we can use this result to automatically check and calibrate the pointing of GMR that is deployed in the field. The difference between the observed antenna elevation (reading) and the calculated elevation of the sun is the calibration value of the antenna alignment, and the same as elevation calibration for the azimuth calibration.
The scanning solar power as a function of the radial distance to the antenna beam axis is approximated by a Gaussian function. Because there are some biases in antenna alignment, the scanning solar power data exhibit a Gaussian pattern with a maximum in the center but slightly offset from the origin. This offset points to a small bias in the GMR antenna alignment. Therefore, Equation (7) becomes
G ( x , y ) = exp { 4 ln 2 [ ( x + Δ a z ) 2 θ H 2 + ( y + Δ e l ) 2 θ E 2 ] } ,
where Δ a z and Δ e l are the biases of the azimuth and elevation, respectively. Thus, the antenna gain can easily be fitted to this equation by the least-square method because a scanning antenna simply cannot point optimally at the sun all of the time. Figure 4 shows the pointing bias from fitting the Gaussian pattern at each frequency from December 2019 to January 2021. The pointing bias data exhibit a slight offset as is still seen in the center, the mean azimuth and elevation could be determined with 0.17° and 0.1°. The results show that the solar radiation can be used for monitoring and calibrating the alignment of the GMR antenna.

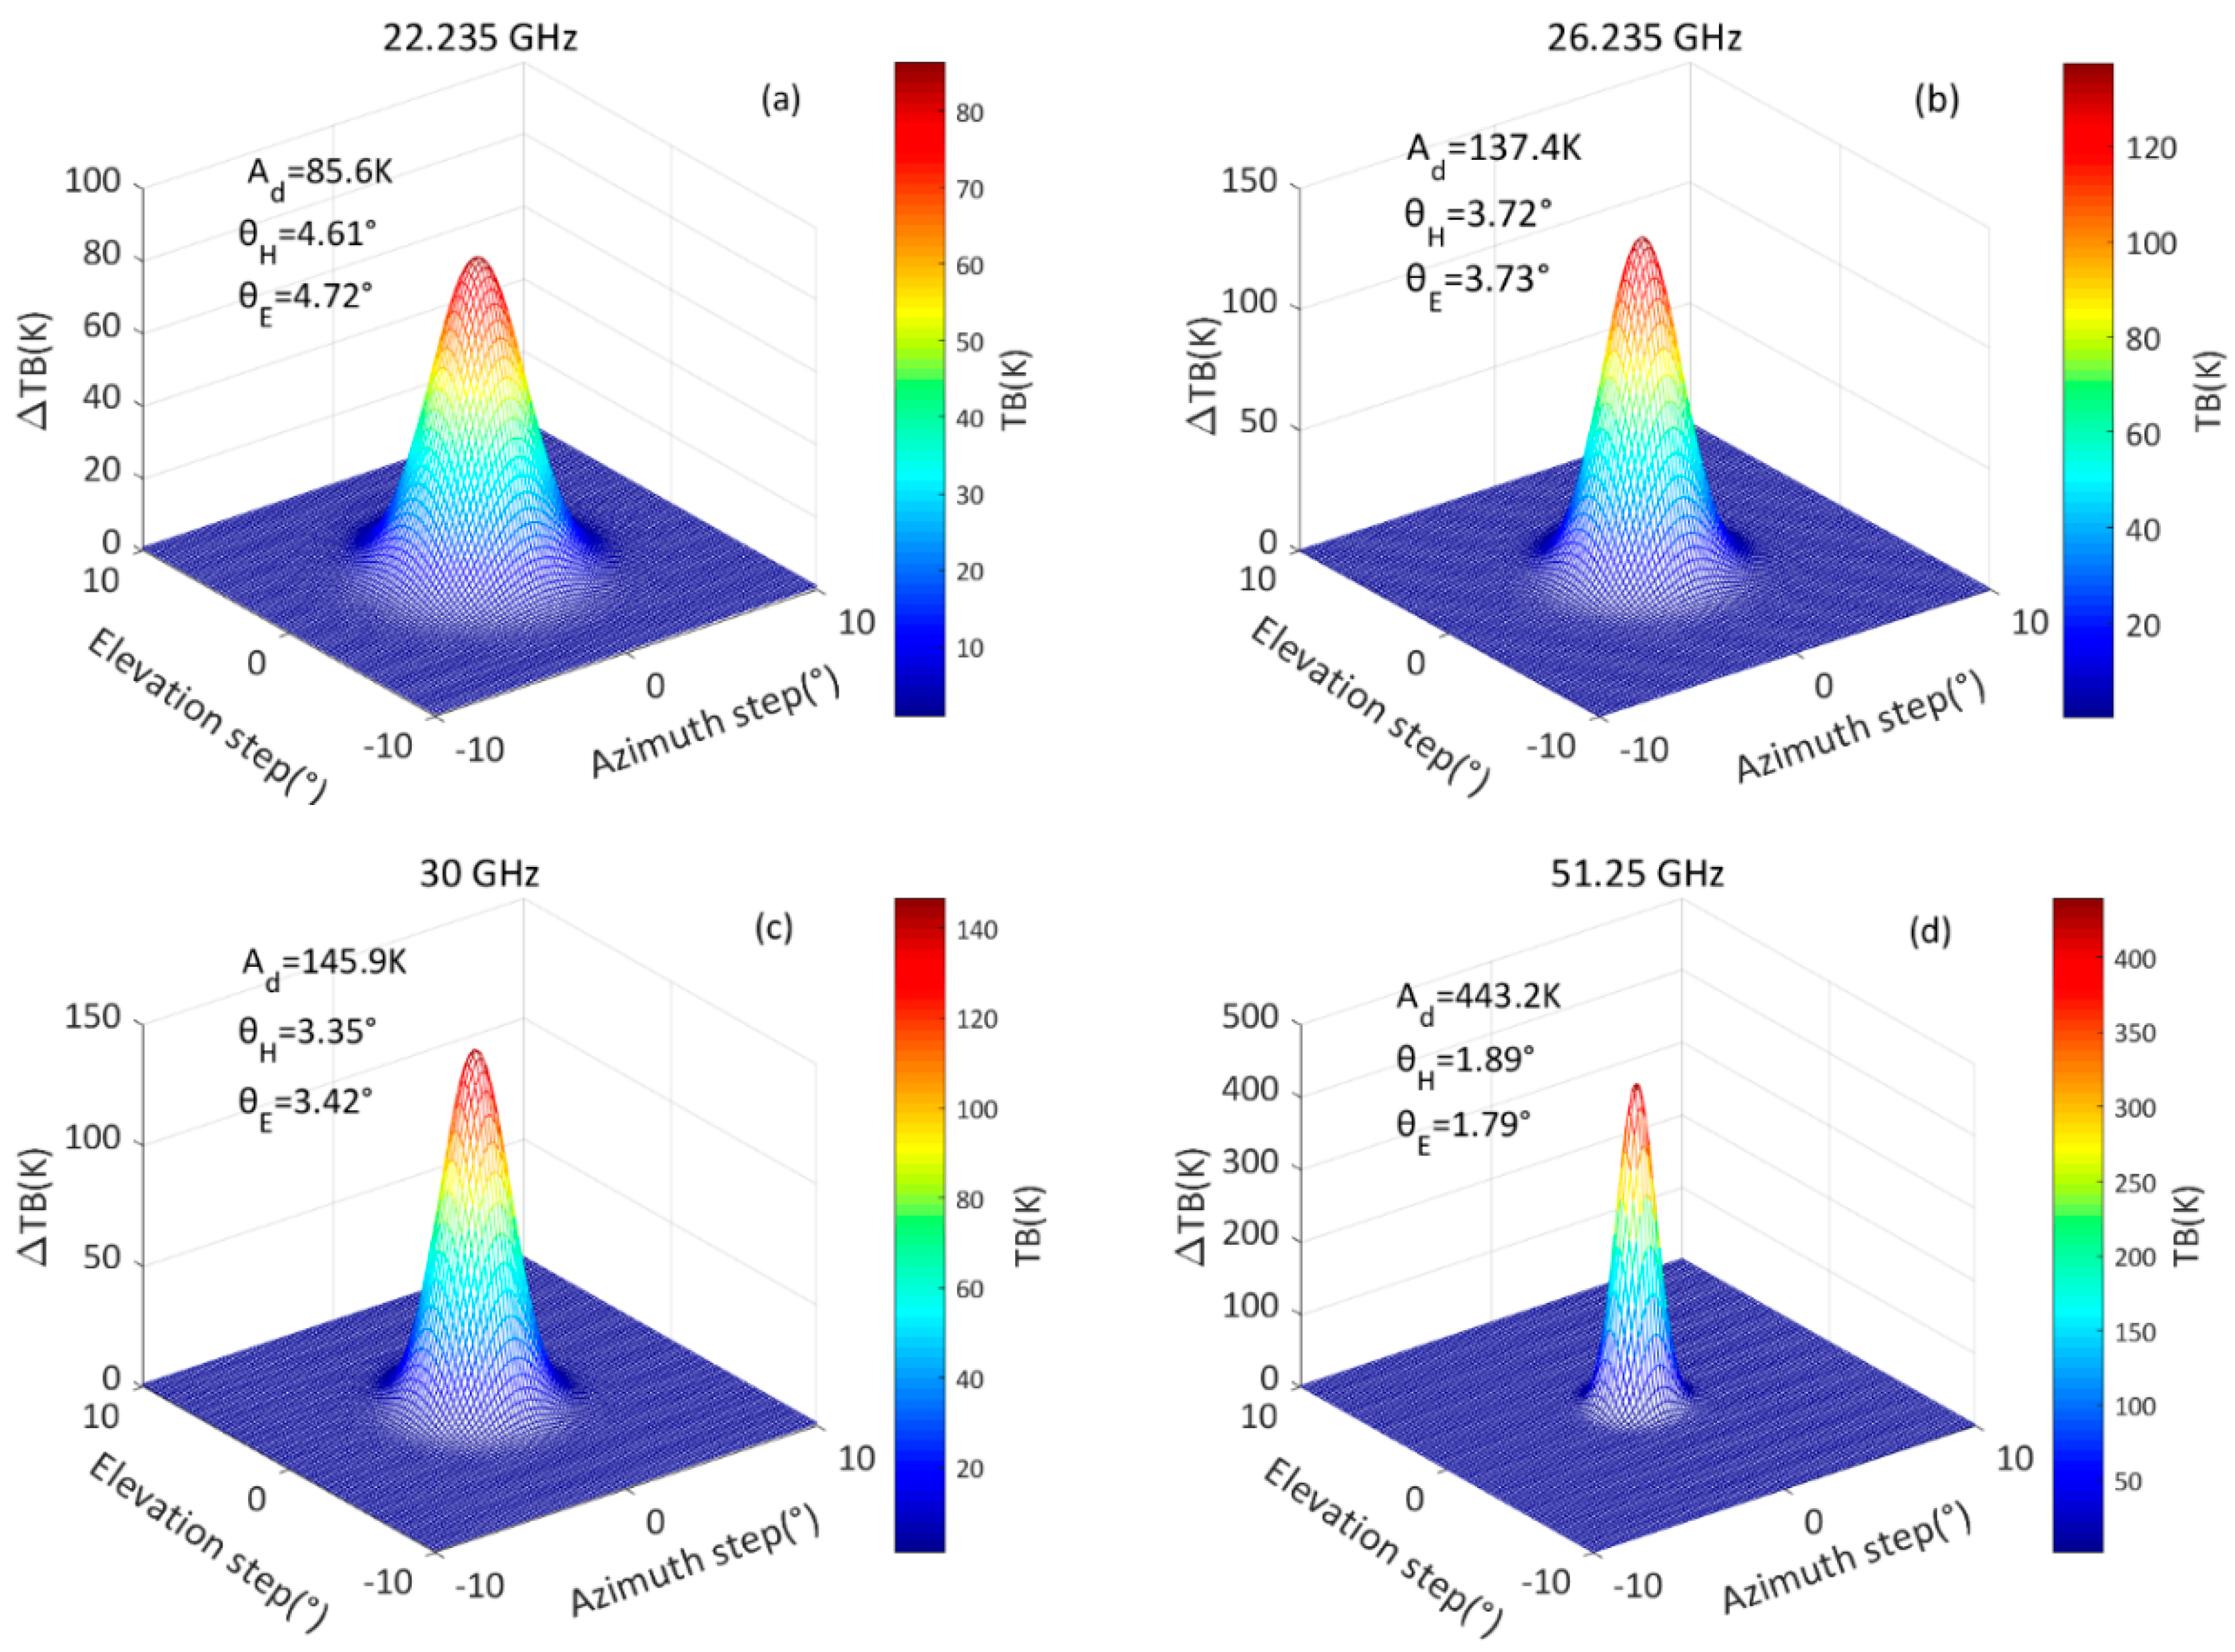
4.2. Scanning the Sun and Measuring the Antenna Pattern

GMR antenna pattern measurement is important for reliable and accurate antenna temperature measurement. We used the GMR to track and scan the sun at some frequencies. Figure 5 shows an example of scanning the sun on 14 March 2020, and the maximum solar elevation is about 40°. Measured TB increment distributions for a 29 by 29 matrix of measurement scatterplots and corrected the angle distortion are shown in Figure 5. There are more raster scanning points to collect a sufficient number of points for fitting near the sun, and this scanning method will help to get the complete 3D antenna pattern. The solar power data exhibit a radial pattern with a maximum in the center; this maximum value and the size of the halo are different for each frequency, and they are related to the antenna beamwidth and solar radiation.
Figure 6 shows the results from fitting the Gaussian model, and the 3D pattern of the antenna can be obtained by least-square fitting of the antenna raster scanning data. From the observation results, the scanning data are relatively symmetrical, the maximum value of TB increment is different for each frequency and they are related to the antenna beamwidth, and TB increment is inversely proportional to the beamwidth. The azimuth and elevation cut position for the sun is chosen to be the expected main beam direction (Figure 7).
Generally, the antenna power pattern is measured in at least two principal planes (H- and E-plane). Therefore, we only observed the solar azimuth and elevation scanning data to determine the beamwidth of the antenna through the center of the sun as it can save a lot of scanning time. Besides the sun measurement, a point source measurement was performed for comparison in the microwave anechoic chamber. We measured the antenna pattern at 30 GHz, the pattern derived from the sun and a point source were compared, and the maximum error was less than 0.1° at 30 GHz (Figure 8). It is shown that the main-lobe matches well to the pattern based on the point source measurements. The results show that when the antenna gain decreases more than 25 dB, the GMR cannot measure the TB increment from the sun. The results show that the sun method is simple to employ, especially when the antenna cannot be moved from its staged installation site.

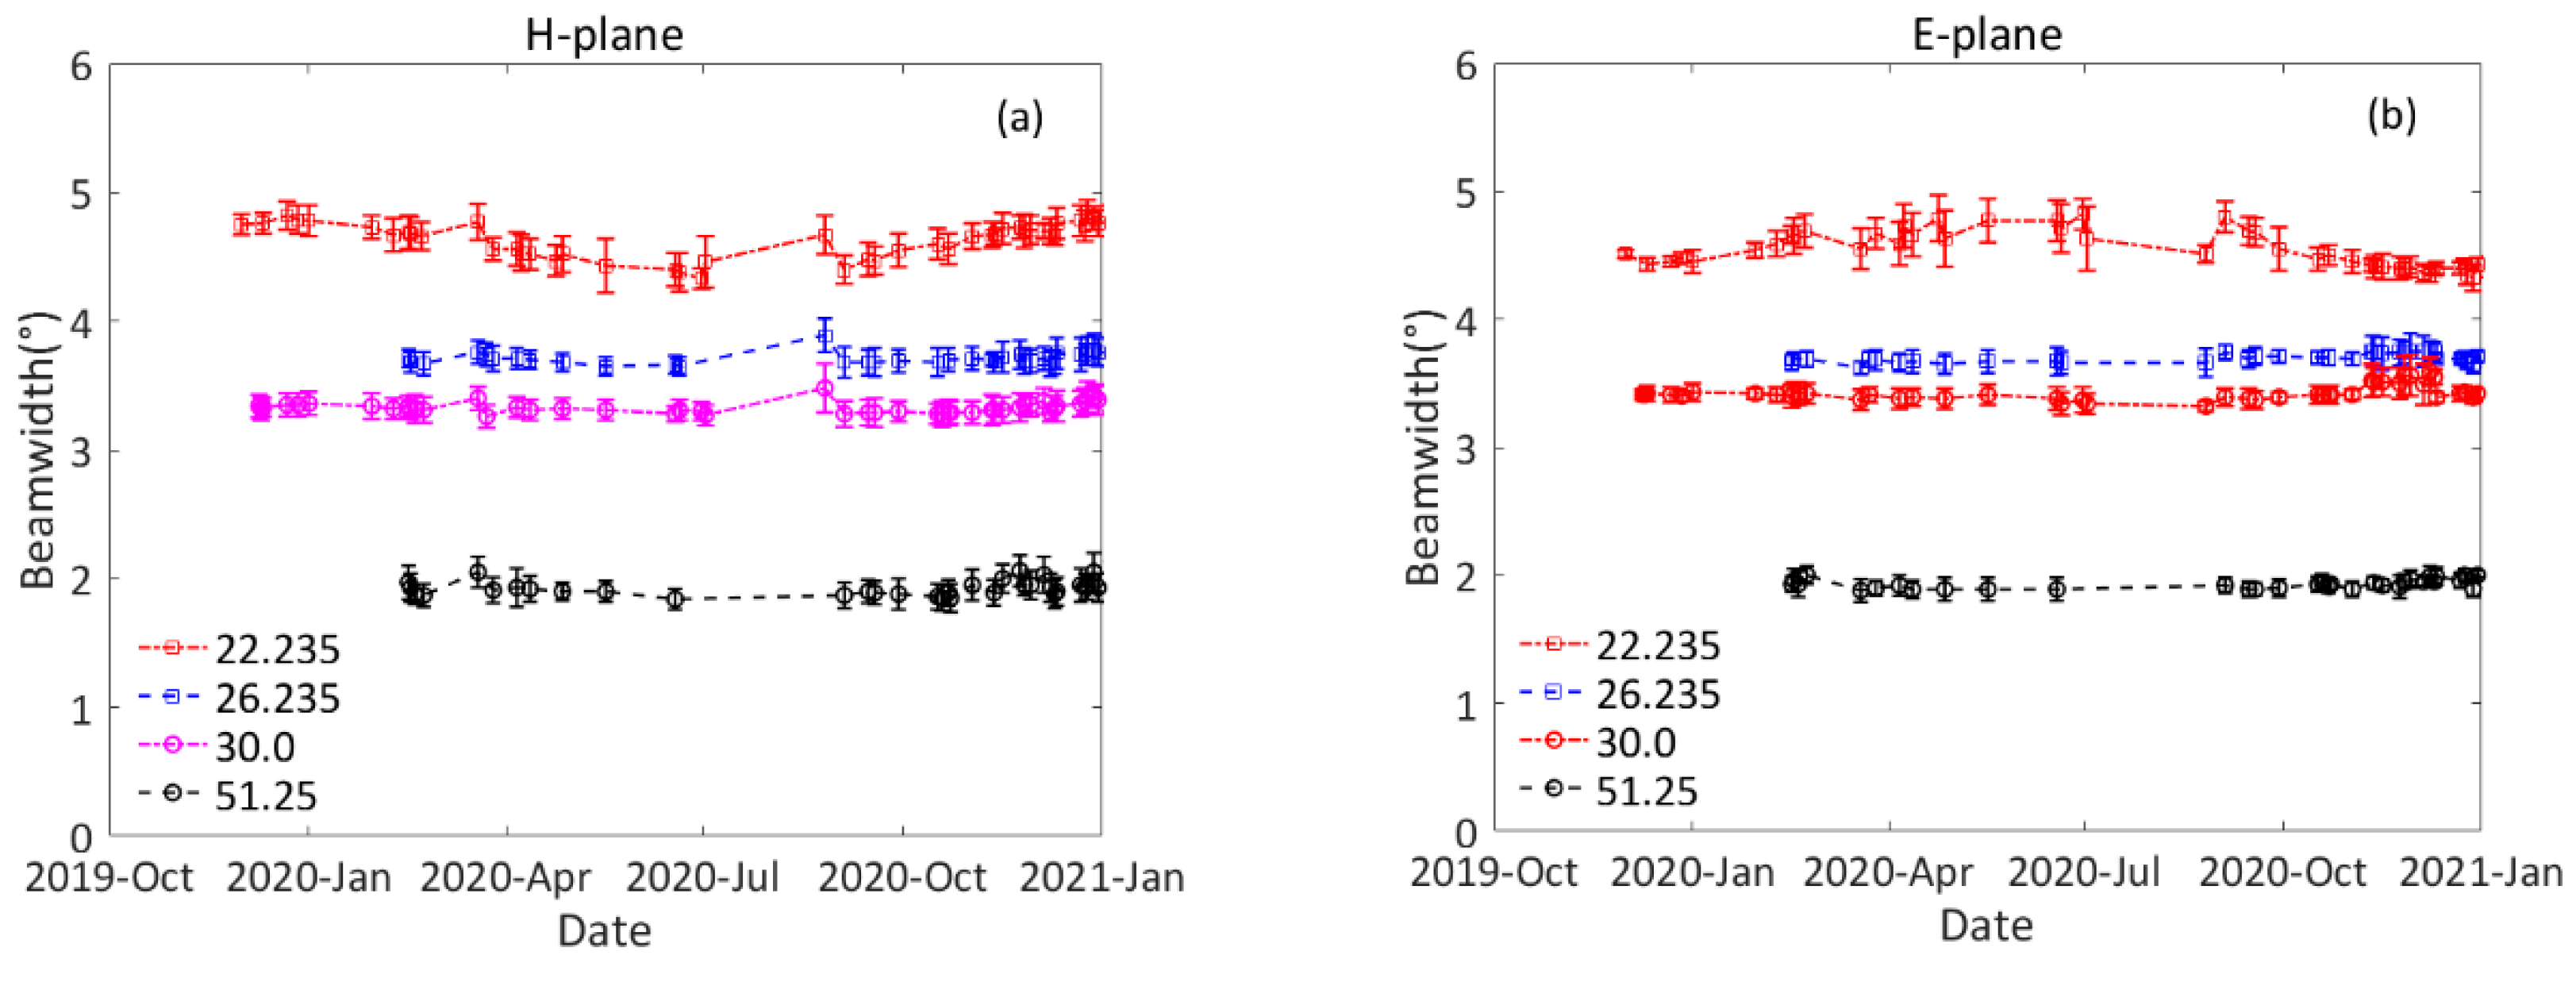
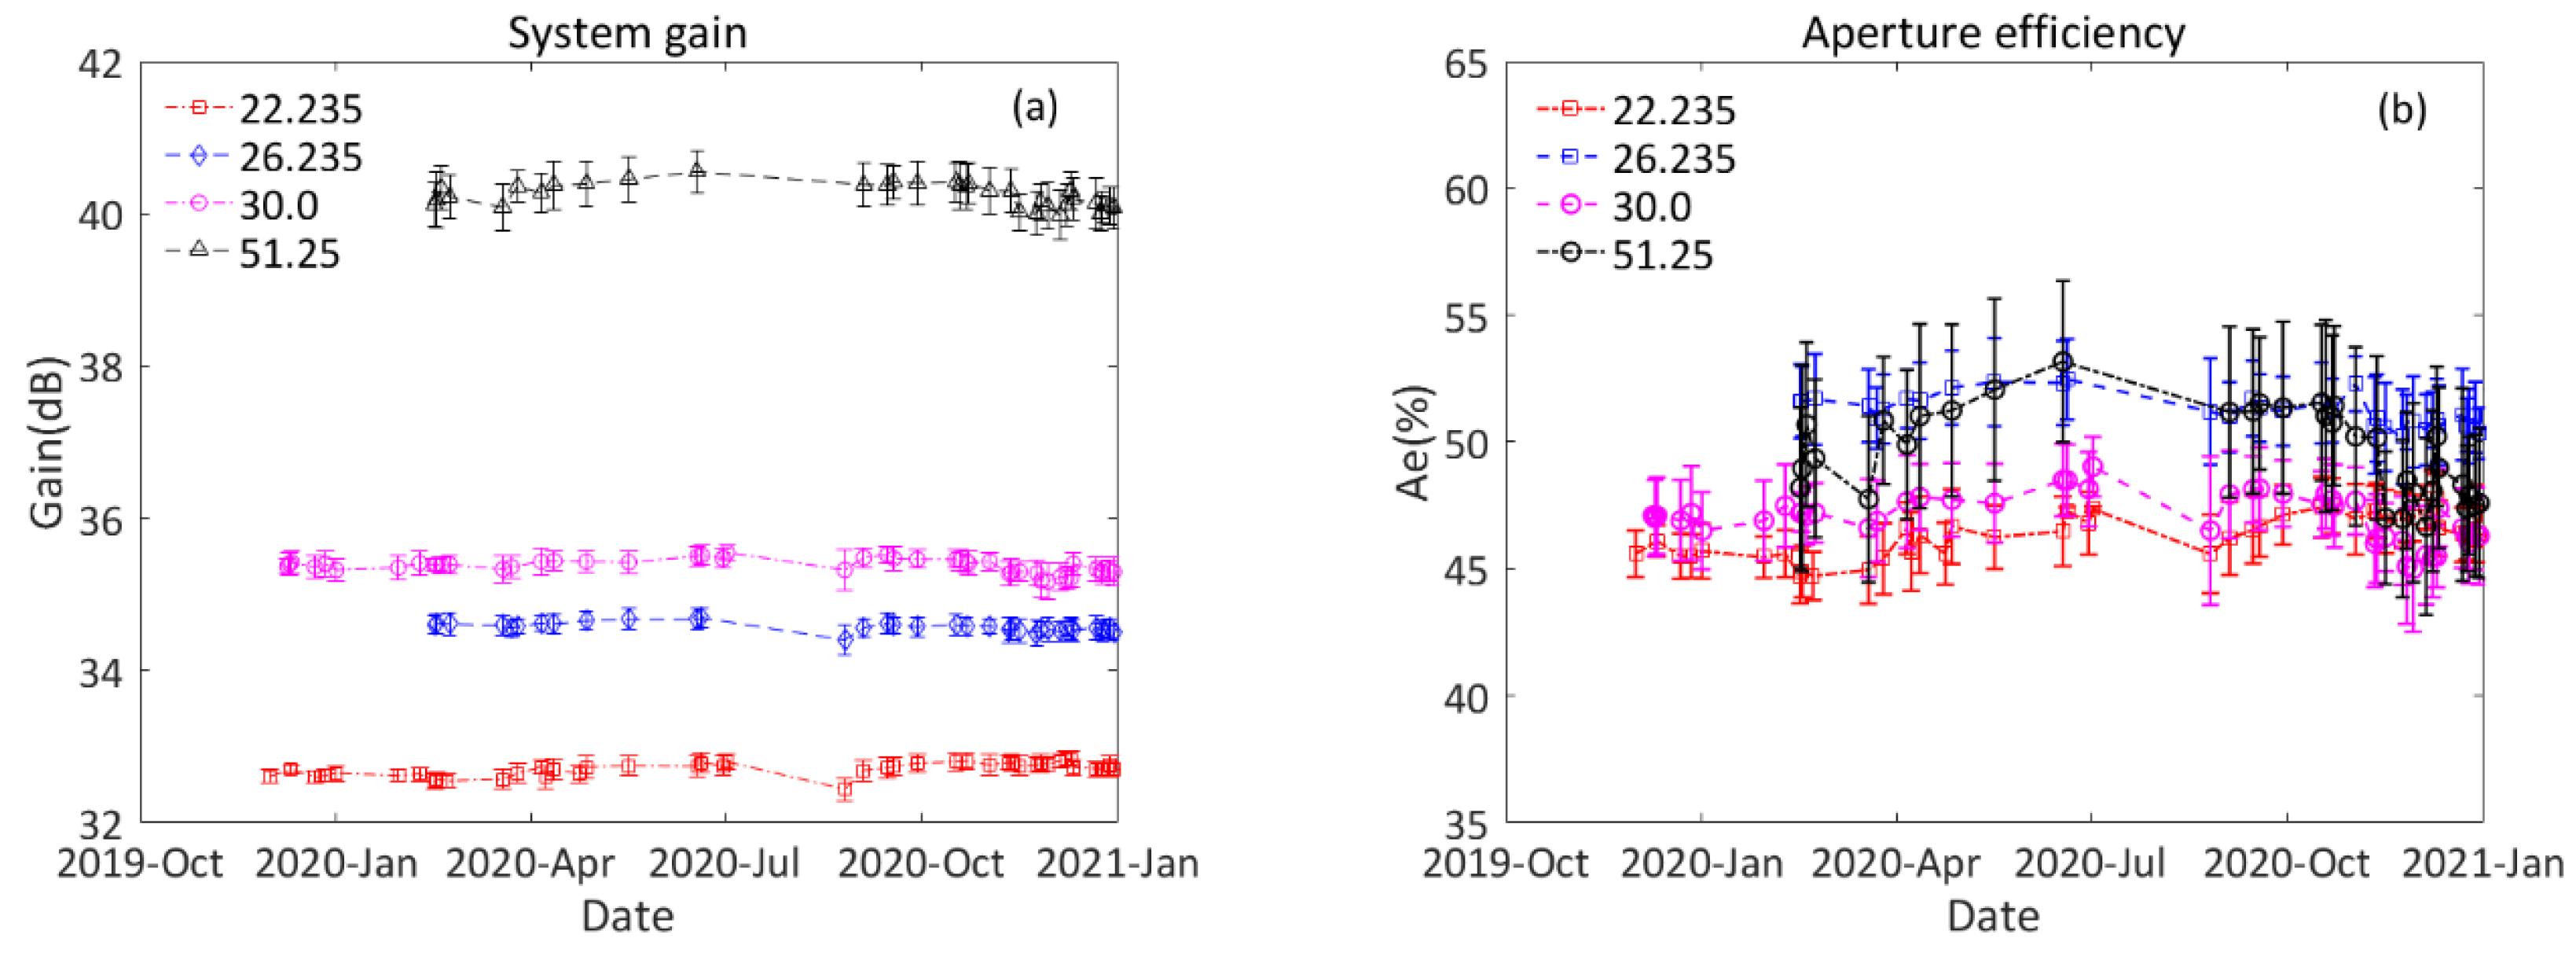
4.3. Long-Term Observation and the System Stability Analysis

During the experiment, the TB increment because of the solar radiation was observed by the GMR and recorded at four frequencies. In the operational use of the method, the solar radiation collected over a certain period (typically solar elevation >25°) was analyzed. We observed and recorded data every 10 min, the daily mean and the standard deviation were calculated and analyzed.
Figure 9 and Figure 10 show the annual variation of daily mean beamwidth, gain and aperture efficiency from December 2019 to January 2021, the sun tracking and monitoring was typically performed once or twice a week on sunny days and the solar observations were taken on a total of 53 days. The observation elevation was more than 25° and the maximum elevation angle was 79° on 18 June 2020. As the atmospheric refraction and attenuation both depend on elevation pointing, the sun observation at low elevations should be avoided. Scans under different solar elevations and seasons have been completed in order to study the effect of the solar elevation and season variation to the measurement of antenna pattern. It can be seen that these parameters do not have obvious seasonal variations. The statistics of the antenna parameters are shown in Table 2. One can see that the gain is greater than 30 dB at each frequency, the beamwidth is less than 5°, and the GMR aperture efficiency is around 45%~55%. The results of measurement indicate that the parameters of the antenna pattern comply with the design specification. Comparison of the beamwidth between H- and E-planes shows that the antenna beam is circular in general. These results show that we can monitor the antenna and receiving system of the GMR based on the sun monitoring.
Figure 10a presents the daily analysis of the system gain. The standard deviation of the daily average gain varies within roughly 0.15 dB at K-band and 0.28 dB at V-band during this period. The low standard deviation found for the GMR demonstrates the stability of the sun-based monitoring and the GMR receiving system. The standard deviation of the estimated gain serves as a sensitive quality measure of the daily analyses.
In addition, the Tipping curve calibration has been widely applied to absolute calibration in order to improve the long-term stability and reduce the retrieval error. However, the antenna beamwidth and pointing errors are very important influential factors for Tipping curve calibration uncertainties [15,18]. When Tipping curve calibration is enabled, the radiometer performs a scan from zenith to 30° elevation, the calibration uncertainties increase by increasing beamwidth [27]. In this case, the TB calibration needs the antenna pattern of a radiometer in operation and its pointing. On the other hand, we need to check whether the performance of an antenna in-field operation complies with the design specification. The traditional method for antenna performance measurement needs an anechoic chamber, which is complex in order to construct a special environment without wave reflections from the ground and surrounding area. Furthermore, in case the antenna is very large or the final assembly occurs at the installation site, the traditional method is extremely difficult [28]. Especially, the chamber method cannot be used to measure the antenna pattern of a radiometer in-field operation. Therefore, it is a simple and effective method to measure antenna pattern by using solar observation.
Due to the spatial variations of the cloud and the horizontal inhomogeneity of the water vapor, a large observation uncertainty is produced under cloudy-sky condition, specially the middle and low cloud. According to our experiment, the effect is smaller for high cloud. Therefore, this method is feasible under the high-cloud condition.

4.4. Measurement Errors and Methods to Reduce them

4.4.1. Systematic Errors

Measurement errors may be caused by source from the GMR system noise. In principle, this bias can be calibrated using the Tipping curve calibration and LN2 calibration. These calibrations can provide an absolute accuracy of at least 0.5 K [15,18,27]. The radiometer calibration is fundamental work to determine the link between the TB and output voltage. During this observation, the LN2 calibrations were twice a year and the Tipping curve calibration was applied to clear-sky condition. Thus, the impact of the system error can always be reduced.
In addition, a radiometer is able to point in any direction. During the Tipping calibration and the solar observation, the pointing errors cause larger uncertainties. To calibrate the pointing errors, the difference between the antenna pointing and the calculated position of the sun is the calibration value of the antenna alignment. According to our method in Section 4.1, the calibration error is better than 0.2° and the effect of the pointing error can often be reduced significantly.

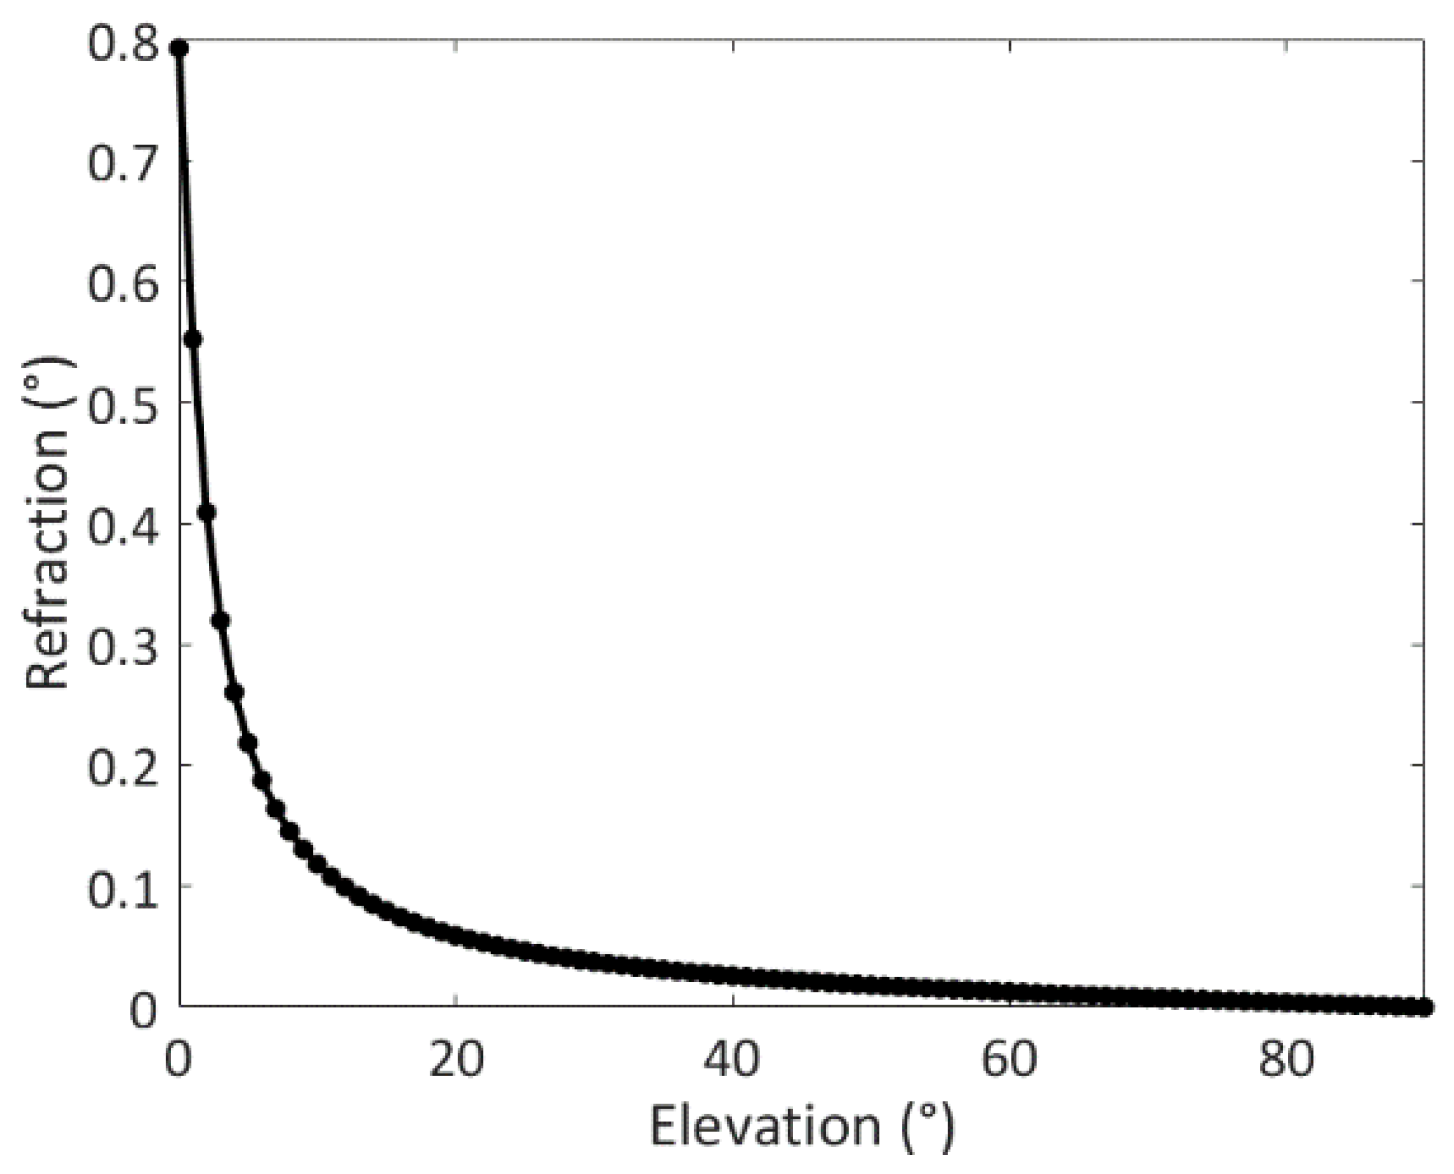
4.4.2. The Effect of Atmospheric Refraction

For the observation of the sun, we have to know the solar position without the effect of atmospheric refraction. However, the observed radiation of the sun is refracted during its propagation through the atmosphere. Under normal conditions, the vertical gradient of the refraction causes the beam to bend downward [18]. During the observation, the refraction has to be taken into account, especially at the low elevation. The true solar elevation e l t , apparent elevation e l a and refraction δ r are related by
e l t = e l a δ r ,
The refraction is a function of the elevation and depends on the relative humidity. Huuskonen and Holleman studied the atmospheric refraction model and this atmospheric refractive model is accurate enough for the requirement of antenna calibration [29]. Assuming a horizontally stratified atmosphere, we can calibrate the refraction with their calculation model and the result is shown in Figure 11. The effect of atmospheric refraction on the radiative transfer process is shown as well. The refraction curves have been calculated with different elevation for the U.S. Standard Atmosphere, 1976, that is, for an ambient temperature of 25 °C, a relative humidity of 85% and a surface pressure of 1013.25 hPa. The results show that radiation is influenced by atmospheric refraction, especially for antenna pointing with a lower elevation, and the influence becomes weaker with the increasing of antenna elevation.

4.4.3. The Effect of Antenna Beamwidth

For a radiometer, the observed TB is a weighted average of the TB over the antenna pattern, but the radiometer does not have an infinitesimal beamwidth, the observed TB will turn out greater than the TB at the antenna beam center [15,18]. Assuming a Gaussian antenna pattern, the amount of calibration δ T b can be given as [18]:
δ T b ( θ ) = B W 2 16 ln ( 2 ) ( T m T b g ) e τ ( θ ) [ 2 + 2 τ ( θ ) tan ( θ ) 2 ] τ ( θ ) ,
where B W is the full width half-maximum power of the power pattern. This correction is proportional to the zenith opacity and it is generally small (<0.1 K). However, the effect of the beamwidth grows exponentially for elevation angles lower than 30° [18], which is best calibrated. In practice, the side lobes of antenna beam may pick up radiation at low elevation from the ground source. For this reason, the observation should avoid low elevation angles.

5. Conclusions

In this paper, we presented a method for determining the GMR antenna pattern, calibrating antenna alignment and checking the system stability using the solar radiation signals. Experiment to track and scan the sun was carried out by using the GMR at the Xi’an experiment field. The use of the sun for the GMR antenna alignment and checking the effective antenna system gain and stability are suited for routine application to overcome the disadvantages of complexities and high costs in operational field applications after installation.
As a successful application example of the sun-based monitoring for GMR, an upgraded GMR has been discussed. It has been shown with the TB increment because of the fact that solar radiation can be observed and the 3D antenna pattern can be measured by raster scanning of the sun. A comparison between the sun and a point source measurement showed an agreement with each other in terms of the beamwidth in both H- and E-planes.
During the solar observation, operational the GMR can accurately observe the microwave signal of the sun to monitoring of the receiving system gain. We can use the system gain of the measurement as a check of the GMR system stability. During the observation, the standard deviation of the system gain is within 0.15 dB at K-band and 0.28 dB at V-band during this period. The low standard deviation found for the GMR demonstrates the stability of the sun-based monitoring and the GMR receiving system. Results from a daily analysis of the sun signals in radiometer data can be used for monitoring the alignment of the GMR antenna and the stability of the receiving system on sunny days or high-cloud condition. This method allows for daily quality monitoring of operational GMRs, which is becoming more and more popular in observational networks.
Because accurate monitoring receiving system of radiometer is a prerequisite for a national network of operational radiometer, it is recommended that the sun-based monitoring method be used, which can be done independently and automatically in the field. This method presented in this paper has great potential for routine monitoring of the GMRs in national or international networks.

Author Contributions

Conceptualization, L.L. and Z.W; methodology, L.L., Z.W. and Y.M; software, L.L.; validation, L.L.; investigation, J.L., J.Q., L.Z. and R.C.; resources, J.Q., R.C. and L.Z.; data curation, L.L., L.Z. and R.C.; writing—original draft preparation, L.L., Z.W. and Y.M.; writing—review and editing, L.L., Z.W. and Y.M.; visualization, L.L.; project administration, Z.W. and J.L.; funding acquisition, Z.W. All authors have read and agreed to the published version of the manuscript.

Funding

This work was supported by the National Natural Science Foundation of China (No. 41675028), and the Natural Science Foundation of Shanxi Province, China (No. 2020JM-718) and the Xi’an Science and Technology Project of Shanxi Province, China (No. 20SFSF0015), and A Project Funded by the Priority Academic Program Development of Jiangsu Higher Education Institutions [PAPD].

Institutional Review Board Statement

Not applicable.

Informed Consent Statement

Not applicable.

Data Availability Statement

Data are contained within the article.

Acknowledgments

We are also grateful to the Shanxi Provincial Atmospheric Sounding Technical Support Center and the Xi’an Meteorological Observation Center of Shaanxi Province, China, for the radiometer installation and for their support.

Conflicts of Interest

The authors declare no conflict of interest.

References

  1. Ahn, M.-H.; Won, H.Y.; Han, D.; Kim, Y.-H.; Ha, J.-C. Characterization of downwelling radiance measured from a ground-based microwave radiometer using numerical weather prediction model data. Atmos. Meas. Tech. 2016, 9, 281–293. [Google Scholar] [CrossRef] [Green Version]
  2. Bianco, L.; Friedrich, K.; Wilczak, J.M.; Hazen, D.; Wolfe, D.; Delgado, R.; Oncley, S.P.; Lundquist, J.K. Assessing the accuracy of microwave radiometers and radio acoustic sounding systems for wind energy applications. Atmos. Meas. Tech. 2017, 10, 1707–1721. [Google Scholar] [CrossRef] [Green Version]
  3. Cadeddu, M.P.; Liljegren, J.C.; Turner, D.D. The Atmospheric radiation measurement (ARM) program network of microwave radiometers: Instrumentation, data, and retrievals. Atmos. Meas. Tech. 2013, 6, 2359–2372. [Google Scholar] [CrossRef] [Green Version]
  4. Yang, J.; Min, Q. Retrieval of Atmospheric Profiles in the New York State Mesonet Using One-Dimensional Variational Algorithm. J. Geophys. Res. Atmos. 2018, 123, 7563–7575. [Google Scholar] [CrossRef]
  5. Chakraborty, R.; Das, S.; Jana, S.; Maitra, A. Nowcasting of rain events using multi-frequency radiometric observations. J. Hydrol. 2014, 513, 467–474. [Google Scholar] [CrossRef]
  6. Xu, G.; Xi, B.; Zhang, W.; Cui, C.; Dong, X.; Liu, Y.; Yan, G. Comparison of atmospheric profiles between microwave radiometer retrievals and radiosonde soundings. J. Geophys. Res. Atmos. 2015, 120, 10313–10323. [Google Scholar] [CrossRef]
  7. He, W.; Chen, H.; Li, J. Influence of assimilating ground-based microwave radiometer data into the WRF model on precipitation. Atmos. Ocean. Sci. Lett. 2020, 13, 107–112. [Google Scholar] [CrossRef] [Green Version]
  8. Wang, Z.; Li, Q.; Hu, F.; Cao, X.; Chu, Y. Remote sensing of lightning by a ground-based microwave radiometer. Atmos. Res. 2014, 150, 143–150. [Google Scholar] [CrossRef]
  9. Jiang, S.; Pan, Y.; Lei, L.; Ma, L.; Li, Q.; Wang, Z. Remote sensing of the lightning heating effect duration with ground-based microwave radiometer. Atmos. Res. 2018, 205, 26–32. [Google Scholar] [CrossRef]
  10. Che, Y.; Ma, S.; Xing, F.; Li, S.; Dai, Y. An improvement of the retrieval of temperature and relative humidity profiles from a combination of active and passive remote sensing. Theor. Appl. Clim. 2018, 131, 681–695. [Google Scholar] [CrossRef]
  11. Darlington, T.; Kitchen, M.; Sugier, J.; de Rohan-Truba, J. Automated real-time monitoring of radar sensitivity and antenna pointing accuracy. In Proceedings of the 31st Conference on Radar Meteorology, Seattle, WA, USA, 6 August 2003; pp. 538–541. [Google Scholar]
  12. Holleman, I.; Huuskonen, A.; Kurri, M.; Beekhuis, H. Operational Monitoring of Weather Radar Receiving Chain Using the Sun. J. Atmos. Ocean. Technol. 2010, 27, 159–166. [Google Scholar] [CrossRef]
  13. Altube, P.; Bech, J.; Argemí, O.; Rigo, T.; Pineda, N. Intercomparison and Potential Synergies of Three Methods for Weather Radar Antenna Pointing Assessment. J. Atmos. Ocean. Technol. 2016, 33, 331–343. [Google Scholar] [CrossRef]
  14. Gabella, M.; Leuenberger, A. Dual-Polarization Observations of Slowly Varying Solar Emissions from a Mobile X-Band Radar. Sensors 2017, 17, 1185. [Google Scholar] [CrossRef] [Green Version]
  15. Li, J.-M.; Guo, L.-X.; Lin, L.-K.; Zhao, Y.-Y.; Cheng, X.-H. A New Method of Tipping Calibration for Ground-Based Microwave Radiometer in Cloudy Atmosphere. IEEE Trans. Geosci. Remote. Sens. 2014, 52, 5506–5513. [Google Scholar] [CrossRef]
  16. Coates, R. Measurements of Solar Radiation and Atmospheric Attenuation at 4.3-Millimeters Wavelength. Proc. IRE 1958, 46, 122–126. [Google Scholar] [CrossRef]
  17. D’Orazio, A.; de Sario, M.; Gramegna, T.; Petruzzelli, V.; Prudenzano, F. Optimisation of tipping curve calibration of microwave radiometer. Electron. Lett. 2003, 39, 905. [Google Scholar] [CrossRef]
  18. Han, Y.; Westwater, E. Analysis and improvement of tipping calibration for ground-based microwave radiometers. IEEE Trans. Geosci. Remote. Sens. 2000, 38, 1260–1276. [Google Scholar] [CrossRef] [Green Version]
  19. Zhang, M.; Gong, W.; Ma, Y.; Wang, L.; Chen, Z. Transmission and division of total optical depth method: A universal calibration method for Sun photometric measurements. Geophys. Res. Lett. 2016, 43, 2974–2980. [Google Scholar] [CrossRef] [Green Version]
  20. Jin, R.; Li, Q.; Dong, J.; Chen, L.; He, L.; Chen, K. A solar calibration method for microwave Aperture Synthesis Radiometers. In Proceedings of the 2010 International Conference on Microwave and Millimeter Wave Technology, Chengdu, China, 8–11 May 2010; pp. 1723–1726. [Google Scholar]
  21. Reimann, J.; Hagen, M. Antenna Pattern Measurements of Weather Radars Using the Sun and a Point Source. J. Atmos. Ocean. Technol. 2016, 33, 891–898. [Google Scholar] [CrossRef] [Green Version]
  22. Qi, X.; Wang, J.; Zhao, L.; Ji, J. Antenna beam angle calibration method via solar electromagnetic radiation scan. J. Eng. 2019, 2019, 7890–7893. [Google Scholar] [CrossRef]
  23. Reda, I. Solar eclipse monitoring for solar energy applications. Sol. Energy 2015, 112, 339–350. [Google Scholar] [CrossRef] [Green Version]
  24. Ulich, B.; Haast, R. Absolute calibration of millimeter-wavelength spectral line. Astrophys. J. Suppl. Ser. 1976, 30, 247–258. [Google Scholar] [CrossRef]
  25. Ulich, B. A radiometric antenna gain calibration method. IRE Trans. Antennas Propag. 1977, 25, 218–223. [Google Scholar] [CrossRef]
  26. Tapping, K.F. The 10.7 cm solar radio flux (F10.7). Space Weather 2013, 11, 394–406. [Google Scholar] [CrossRef]
  27. Hewison, T.; Gaffard, C. Radiometrics MP3000 Microwave Radiometer Performance Assessment; Technical Report–TR29; Version 1.0; Mett Office: Reading, UK, 2003. [Google Scholar]
  28. Johnson, R.; Ecker, H.; Hollis, J. Determination of far-field antenna patterns from near-field measurements. Proc. IEEE 1973, 61, 1668–1694. [Google Scholar] [CrossRef]
  29. Huuskonen, A.; Holleman, I. Determining Weather Radar Antenna Pointing Using Signals Detected from the Sun at Low Antenna Elevations. J. Atmos. Ocean. Technol. 2007, 24, 476–483. [Google Scholar] [CrossRef]
Figure 1. The ground-based multichannel microwave radiometer (GMR) used at this experiment.
Atmosphere 12 00447 g001
Figure 2. Schematic internal structure of MWP967KV radiometer.
Atmosphere 12 00447 g002
Figure 3. (a,b) The elevation distortion arises from the rotation of the antenna in azimuth with constant elevation. The horizontal axis is the rotation angle of the GMR antenna in azimuth and the origin represents the center of the sun. The vertical axis is the elevation distortion in the sky-sphere, and the curves indicate the distortion at different antenna elevations.
Atmosphere 12 00447 g003
Figure 4. Scatterplots of the pointing bias at each frequency. The observations were taken on a Table for 53 days from December 2019 to January 2021. (a) 22.235 GHz, (b) 26.235 GHz, (c) 30.0 GHz, (d) 30.0 GHz. The vertical axis gives the difference between the observed antenna elevation and the calculated elevation of the sun, and the horizontal axis gives the same for the azimuth.
Atmosphere 12 00447 g004aAtmosphere 12 00447 g004b
Figure 5. Two-dimensional distribution of the TB increment observed from the sun raster scanning on March 14, 2020, 13:00 (local time), at four specific frequencies. The vertical axis is the elevation difference between the antenna and the sun, and the horizontal axis is their azimuth difference. (a) 22.235, (b) 26.235, (c) 30.000, and (d) 51.250 GHz.
Atmosphere 12 00447 g005aAtmosphere 12 00447 g005b
Figure 6. The 3D antenna power patterns were fitted by the least-square method on March 14, 2020, 13:00 (local time), at four specific frequencies. A d is the maximum TB increment, θ H and θ E are the half-power beamwidth of the H- and E-planes (a) 22.235 GHz, (b) 26.235 GHz, (c) 30.000 GHz, and (d) 51.250 GHz.
Atmosphere 12 00447 g006
Figure 7. The antenna power pattern on the H- and E-planes. The markers are for observed data and the lines are for fitting with the Gaussian function by least-square method, on March 14, 2020, 13:00 (local time). (a) H-plane and (b) E-plane.
Atmosphere 12 00447 g007
Figure 8. The antenna patterns measured in the anechoic chamber as compared with the results from the solar scanning at 30 GHz. (a) H-plane and (b) E-plane.
Atmosphere 12 00447 g008
Figure 9. The annual variation of daily mean beamwidth. The markers are observed daily mean and minus are standard deviation. Measurements were taken on a total of 53 days from December 2019 to January 2021. (a) H-plane and (b) E-plane.
Atmosphere 12 00447 g009
Figure 10. The annual variation of daily mean gain and aperture efficiency. The markers are observed daily mean and minus are standard deviation. Measurements were taken on a total of 53 days from December 2019 to January 2021. (a) Gain and (b) Aperture efficiency.
Atmosphere 12 00447 g010
Figure 11. The refraction curve as a function of elevation is calculated by model. The interval between data points is fixed (1°) on the horizontal axis.
Atmosphere 12 00447 g011
Table 1. The system performance of the GMR used in this study.
ParameterSpecification
Channel frequencyK-band (22~30 GHz): 22.235, 22.5, 23.035, 23.835, 25.0, 26.235, 28.0, 30.0
V-band (51~59 GHz): 51.25, 51.76, 52.28, 52.8, 53.34, 53.85, 54.4, 54.94, 55.5, 56.02, 56.66, 57.29, 57.96, 58.8
Parabolic reflectorSize: 320.5 × 186.3 mm; Focal length: 180 mm
K-feedhornD = 80 mm; L = 115 mm; flare angle: 15°
V-feedhornD = 38.2 mm; L = 56 mm; flare angle: 15°
BeamwidthK-band: ≤5°; V-band: ≤3°
Gain≥25 dB
Sidelobe level≤−25 dB
TB accuracy0.5 K
TB sensitivityK-band: ≤0.2 K (RMS);
V-band: ≤0.3 K (RMS)
Integration timeTypically 1 s
Antenna scanning capability+/−180° stepping scanning
Angular resolution0.1°
Calibration methodHot load; Noise diode; Tipping method; LN2
Table 2. The statistical results of the GMR antenna parameters.
Frequency
(GHz)
Gain
(dB)
η
(%)
Beamwidth (°)
H-PlaneE-Plane
22.23532.69 ± 0.0246.25 ± 0.314.62 ± 0.134.56 ± 0.11
26.23534.59 ± 0.0251.42 ± 0.253.70 ± 0.053.69 ± 0.03
30.00035.42 ± 0.0447.54 ± 0.393.31 ± 0.043.40 ± 0.04
51.25040.33 ± 0.0350.65 ± 0.331.90 ± 0.051.92 ± 0.03
Publisher’s Note: MDPI stays neutral with regard to jurisdictional claims in published maps and institutional affiliations.

