Article

Spatial and Temporal Variability in Positive Degree-Day in Western China under Climate Change

1
Qilian Alpine Ecology & Hydrology Research Station, Key Laboratory of Ecohydrology of Inland River Basin, Northwest Institute of Eco-Environment and Resources, Chinese Academy of Sciences, Lanzhou 730000, China
2
University of Chinese Academy of Sciences, Beijing 100049, China
3
College of Urban and Environmental Sciences, Northwest University, Xi’an 710000, China
*
Author to whom correspondence should be addressed.
Atmosphere 2021, 12(4), 443; https://doi.org/10.3390/atmos12040443
Submission received: 8 March 2021 / Revised: 26 March 2021 / Accepted: 29 March 2021 / Published: 31 March 2021
(This article belongs to the Section Climatology)

Abstract

:
Positive degree-day (PDD) indicates the accumulated positive temperature in a given time period; it directly relates to the melting of snow and ice, and it is a key parameter between global warming and cryosphere changes. In this study, we calculated the PDD based on the daily mean temperatures from 1960 to 2018 at meteorological stations, and we used measured and interpolated data to determine spatial and temporal distribution and changes in PDD in western China (WC). Results show that the mean annual, warm season, and cold season PDD values at 209 meteorological stations were 3652.2, 2832.9, and 819.3 °C, respectively. PDD spatial distribution in WC is similar to that of air temperature. In WC, PDD mainly ranged from 0 to 5000, 1000 to 4000, and 0 to 1000 °C year−1, respectively for annual, warm season, and cold season. From 1960 to 2018, the observed mean initial day of PDD moved forward by 8.3 days, and the final day was delayed by 8.2 days, with the duration expanding to 16.6 days; the trend in PDD reversed in the 1980s and the change rate in PDD for annual, warm season and cold season was 6.6, 3.8, and 2.7 °C year−1, respectively. Regionally, PDD increased in almost all areas; the high PDD advanced from south to north, east to west, desert to mountain, and low to high altitudes. The results also showed that the warming rate of PDD was lower in the cold season and in high-altitude areas, which was opposite to the observed temperature patterns, however, the non-linear relationship between PDD and mean temperature over a period of time is the main reason for this phenomenon. This study adds more details for the understanding of climate change in WC, and suggests that more attention should be paid to PDD in the study of cryosphere changes.

1. Introduction

Global warming since the last century is responsible [1,2] for a temperature rise that is especially noticeable in the middle latitudes of the northern hemisphere [3]. In China, the country-average annual mean surface air temperature rose by 1.12 °C during 1900s–2015, and the rate of temperature increase was 2.5 times higher after the 1950s that it was before the 1950s [4]. Climate change affects areas differently. The warming rate in western China is lower than that in eastern parts of the country [5], the temperature increase in the arid region of northwestern China is significantly higher than the region’s average [6,7,8,9], and the climate regime has shifted from warm-dry to warm-wet [10,11]. The Qinghai-Tibet Plateau in western China is affected by elevation-dependent warming [12,13,14], and the warming rate is significantly higher than that in the surrounding low altitude areas [15,16], especially in cold seasons [17,18,19,20]. A warming trend is expected to continue in this area in the near future [21].
Degree day is the deviation between the daily average temperature and the specified base temperature that describes thermal conditions [22]. Positive degree-day (PDD) refers to the sum of positive air temperatures over a period of time, and, because it is associated with changes in the phase of water, it is widely used to establish the effect of temperature on cryospheric components [23,24,25,26,27,28]. PDD is usually obtained directly from positive daily temperature at monthly or annual scales. Braithwaite [29], Reeh [30], Carlov and Greve [31], and Wake and Marshall [32] developed a method for calculating PDD using monthly average temperature; it improves the applicability of PDD in areas without observations of temperature. Therefore, PDD is often used in calculations of mass balance of glaciers and snow with a degree-day model [23,24,25] and of the impacts of climate change on frozen ground and river ice [26,27,28]. However, PDD is a link between air temperature and the cryospheric variation, thus, PDD has a more direct indication than temperature for the response of the cryosphere to climate change.
Western China (WC) is located in the eastern part of Eurasia. Under the control of westerly circulation and the Indian Ocean monsoon, with limited influence from the East Asian monsoon [33], in combination with its vast landform, WC has a complex and fragile ecosystem and a sensitive climate system [34,35]. The northern part of WC is the driest area in China, where water resources are mainly supplied by glaciers and snowmelt. The southern part is the Qinghai-Tibet Plateau. It has high mountains with high altitude and low temperature and the largest cryosphere outside the polar region; it is also the source of Asia’s nine major rivers that support about 1.65 billion people downstream [35]. With climate warming, the cryosphere in the WC has changed including the degradation of frozen ground, shrinking of glaciers, shortening of snow cover time, and desertification (expansion of deserts) [36,37], all of which threaten the ecological and water resources security of the region and surrounding areas [38]. In study of the impact of climate change [36,37,38], the air temperature is stated to be the main indicator of climate warming. Studies have revealed that the increase in low temperatures is greater than that in high temperatures in WC [6,19], so the increase rate of mean temperature and PDD may be discordant over a period of time. For the cryosphere, PDD has a more direct indication of climate change because it only represents temperature above 0 °C, which is the critical temperature for the melting of ice and snow. For this consideration, it is necessary to study the distribution characteristics, changing trends of PDD, and the regional relationship between PDD and air temperature in WC.
In this article, our objectives were to (1) determine spatial and temporal distribution of PDD and its changes from the 1960s to 2010s using observations and interpolation data; (2) reveal the trend difference between the annual, cold season, and warm season temperatures and PDD; and (3) analyze the source of the above differences through the theoretical connection between PDD and temperature by a case study. This study is helpful for understanding the changes of PDD in WC, and the results remind that it is important to distinguish the difference between mean temperature and PDD in cryospheric assessment.

2. Data and Methods

2.1. Data

Meteorological data were obtained from the National Meteorological Information Center data sharing service network (http://data.cma.cn/ accessed on 31 March 2021), which includes daily mean temperature (1960–2018), latitude, longitude, and elevation from 209 national stations in and around WC (Figure 1). The DEM (Digital Elevation Model) data were obtained from the National Tibetan Plateau Data Center (https://data.tpdc.ac.cn/zh-hans/ accessed on 31 March 2021), at 1 km spatial resolution. The boundary of western China was based on the Second Chinese Glacier Inventory [39]; the area of WC is 470 × 104 km2.

2.2. Methods

The monthly PDD of each meteorological station was calculated from the sum of daily mean temperatures above 0 °C, as:
PDD =   i = 1 n T +
where T+ (°C) is positive daily mean temperature in one month and n is the number of days in the month. Annual PDD is the sum of PDD from January to December. Considering the significant seasonal differences of the WC climate, PDD changes in the warm (May–October) and cold (November to April of the following year) seasons were analyzed separately. For further analyses and mapping, PDD was divided into 9 segments: I (0 °C), II (0~1000 °C), III (1000~2000 °C), IV (2000~3000 °C), V (3000~4000 °C), VI (4000~5000 °C), VII (5000~6000 °C), VIII (6000~7000 °C), and IX (>7000 °C).
The first and the last days of the year on which the temperature was positive, and the duration (between the first and last day) were used to describe the temporal characteristics of PDD. In this analysis, to avoid the impact of accidental extreme weather events on the long-term statistical results, the time series of PDD was first processed with the 5-day moving-average method [40]. However, the original information of the data was completely retained in the other analyses. The trend of PDD from 1960 to 2018 was expressed in terms of the slope of the linear regression equation for PDD per year, and the inter-annual variation was compared with an average of 10 years from the 1960s to 2010s (the 2010s included 2010~2018). Temporal variability in PDD over WC was also described for every decade from 1960s to 2010s.
The spatialization of PDD from meteorological stations to all of WC was completed in a manner similar to that of Wang et al. [40] and included three steps:
(1) Yearly and seasonal PDD for each meteorological station was calculated, then, multiple regression equations were established between PDD and the longitude, latitude, and altitude of each station. The equation form was:
PDD = c + c 1 l o + c 2 l a + c 3 a l t + c 4 l o 2 + c 5 l a 2 + c 6 a l t 2
where l o , l a , and a l t were longitude, latitude, and altitude of a meteorological station. C was a constant and c 1 ~ c 6 were coefficients of the polynomial.
(2) The multivariate regression equation was used to calculate PDD for each station, and the residuals between calculation and observation were obtained.
(3) The area of WC was divided into grids (0.1° × 0.1°) and mean longitude, latitude, and elevation were obtained for each grid. PDD for each grid was calculated with equation (2), and the residual error for each grid was interpolated with the station residual error in step 2. Then, PDD for each grid was obtained by adding calculated PDD and interpolated residuals together. After the grid data were interpolated again, PDD distribution over the whole area was obtained for different time periods.
In this section, data from 188 meteorological stations were used to calculate positive accumulated temperature, and data from 21 (>10% of the total) stations were used to verify the accuracy of regression equations and residual interpolation. Mean absolute deviation (MAE), mean relative error (MRE), and root mean square error (RMSE) were used to evaluate the accuracy of different interpolation methods including ordinary Kriging (OK) [41], inverse distance weighting (IDW), and spline methods (SPL). Correlation coefficients R2 were used to indicate the strength of regression equation (2). In this study, the R2 of the cold season PDD was lower than that of both the warm season and annual PDD values, but it still reached 0.92 with p < 0.01 (Table 1). The MRE, MAE, and EMSE of the cross-validation of the three interpolation methods showed that OK was the most precise method, and the three values were lower for OK than for IDW or SPL methods (Table 2). Therefore, we used the OK method to interpolate PDD for WC.

3. Results

3.1. PDD Distribution in WC from the 1960s to 2018

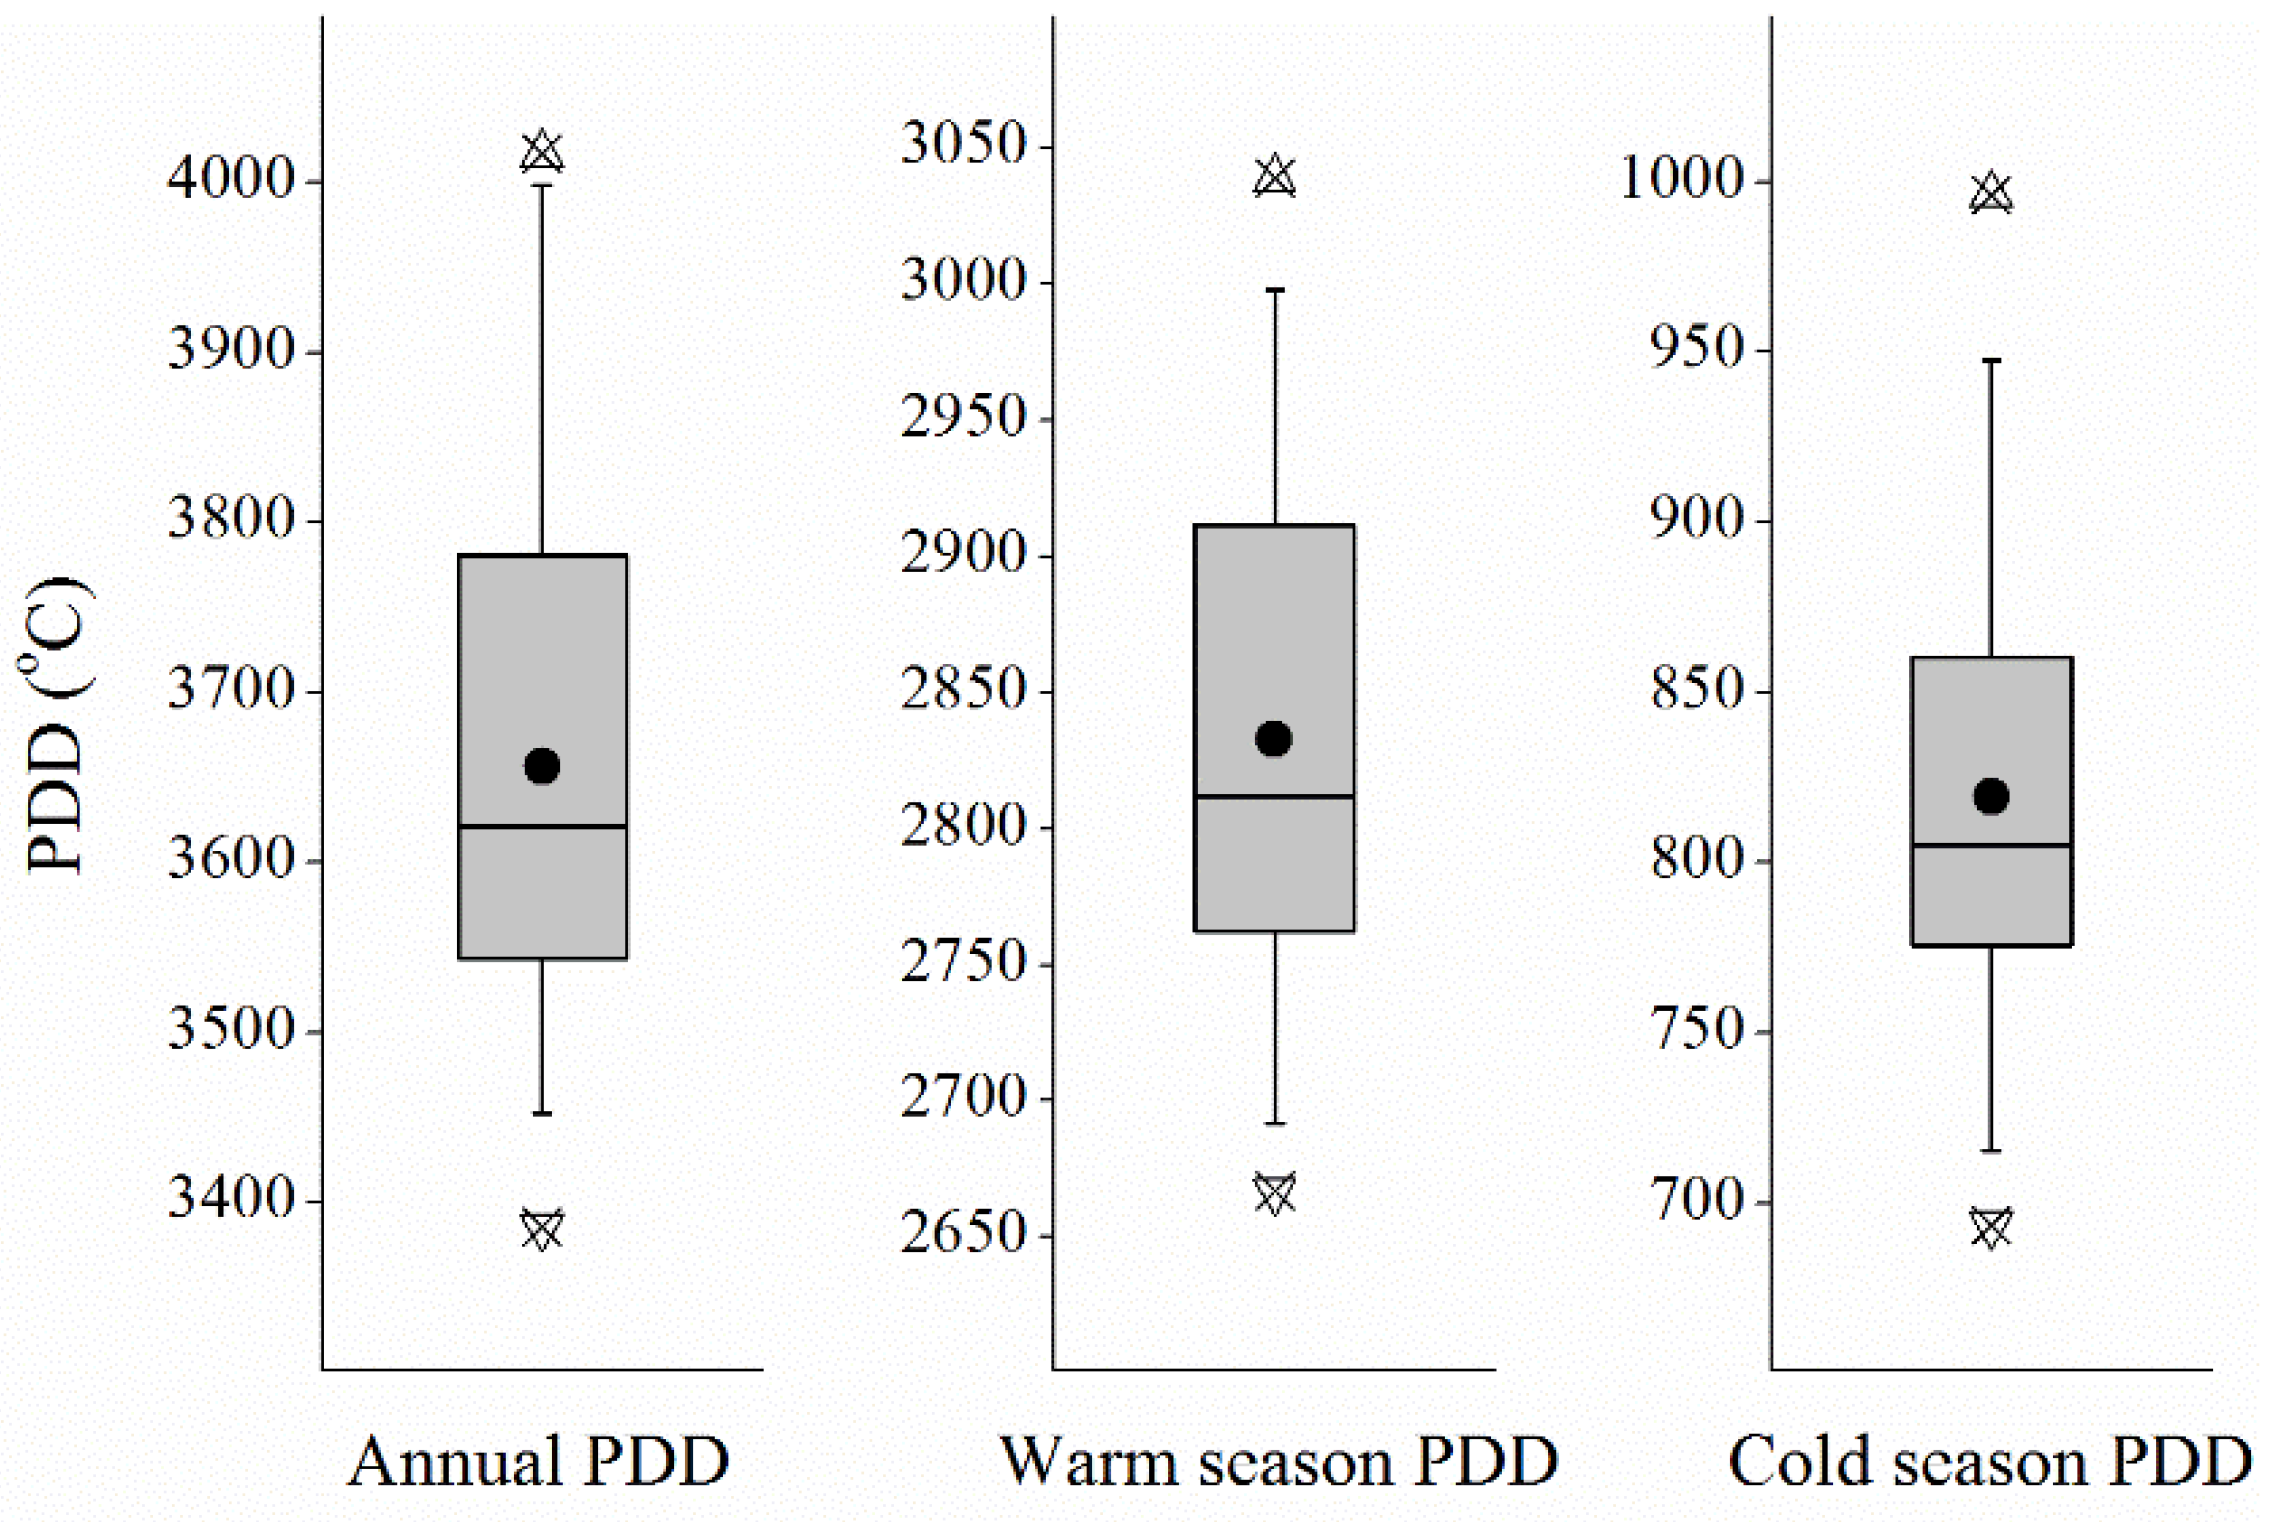
The mean annual PDD in western China, as determined from meteorological station observations, was 3652.2 °C from 1960–2018 with a range of 3385.5 ~ 4017.0 °C. Mean PDD in the warm season was 2832.9 °C, which was about 78% of the annual. Mean PDD in the cold season was 819.3 °C, or nearly one third of that of the warm season (Figure 2).
Mean annual PDD from the 1960s to 2010s was distributed in a similar way to that of topography in western China. PDD was lower in the Qinghai-Tibet Plateau and the surrounding high-altitude mountains, including the Altai, Tianshan, and Qilian, and higher in low latitudes and at elevations in the southernmost WC (Figure 3). PDD was significantly higher around the northern Tarim basin and Junggar basin. In the warm season (Figure 3b), there were small areas with a PDD of zero; this seems to contradict the results of the annual PDD in most of the northwestern Tibetan plateau where PDD was 0. This result was mainly due to the error of interpolation, and the average error of PDD was <100 °C. In the cold season (Figure 3c), PDD was nearly 0 in all mountainous areas and at low latitudes in the southeast, where PDD did not exceed 3000 °C.
The proportions of land area in the different segments are shown in Table 3. For the annual PDD values, 93% of WC is in segments I–VI (0~5000 °C); warm season and cold season PDD area mainly in segments II–V (1000~4000 °C) and I–II (0~1000 °C) with area proportion is about 96% and 90% of WC, respectively (Table 3). The extremely high PDD occurred only in small areas around the Tropic of Cancer and Sichuan Basin. In theory, extremely low PDD should be found in the Himalayas and the Transhimalaya region, but we observed that in the warm season (Figure 3b), PDD ranged from 0~1000 °C, even near Mount Everest, where the annual and warm season PDD was overestimated by more than 0 °C. We believe that the overestimation of PDD is due to the low number of meteorological stations in this region and the result cannot be improved with the methods used in this study; on the other hand, because PDD is the mean value for each grid, the results only represent the regional mean value. However, the distribution of PDD is consistent with spatial distribution characteristics of temperature in WC.

3.2. Temporal Characteristics of PDD Change in WC

Results shows that 40 of the 209 meteorological stations had no negative daily temperatures from 1960 to 2018; further, the initial date of PDD in the remaining 169 stations appeared earlier, final date was later, and the duration was longer (Table 4) in 2018 than it was in 1960. Of the 169 stations, less than half passed the p < 0.1 significance test for initial and terminal dates and duration, with rates of change of −1.01, 0.97, and 1.70 day 10y−1 in the period from 1960 to 2018, respectively (negative change rate means that the date advanced). The mean initial date of PDD moved forward by 8.3 days from 1960 to 2018 for all 169 stations, while the mean terminal date was delayed by 8.2 days and mean duration expanded to 16.5 days. These changes were more dramatic than those reported for the Qilian Mountains for negative degree days, in which the initial date shifted forward by 1.3 days, terminal date was delayed by 2.4 days, and duration expanded by 3.7 days from 1960t to 2015, but smaller compared with changes in freezing and thawing of surface soils in northwestern China and the Tibet Plateau [42,43] and with terminal and initial dates of snow cover in the Tibet Plateau [44].
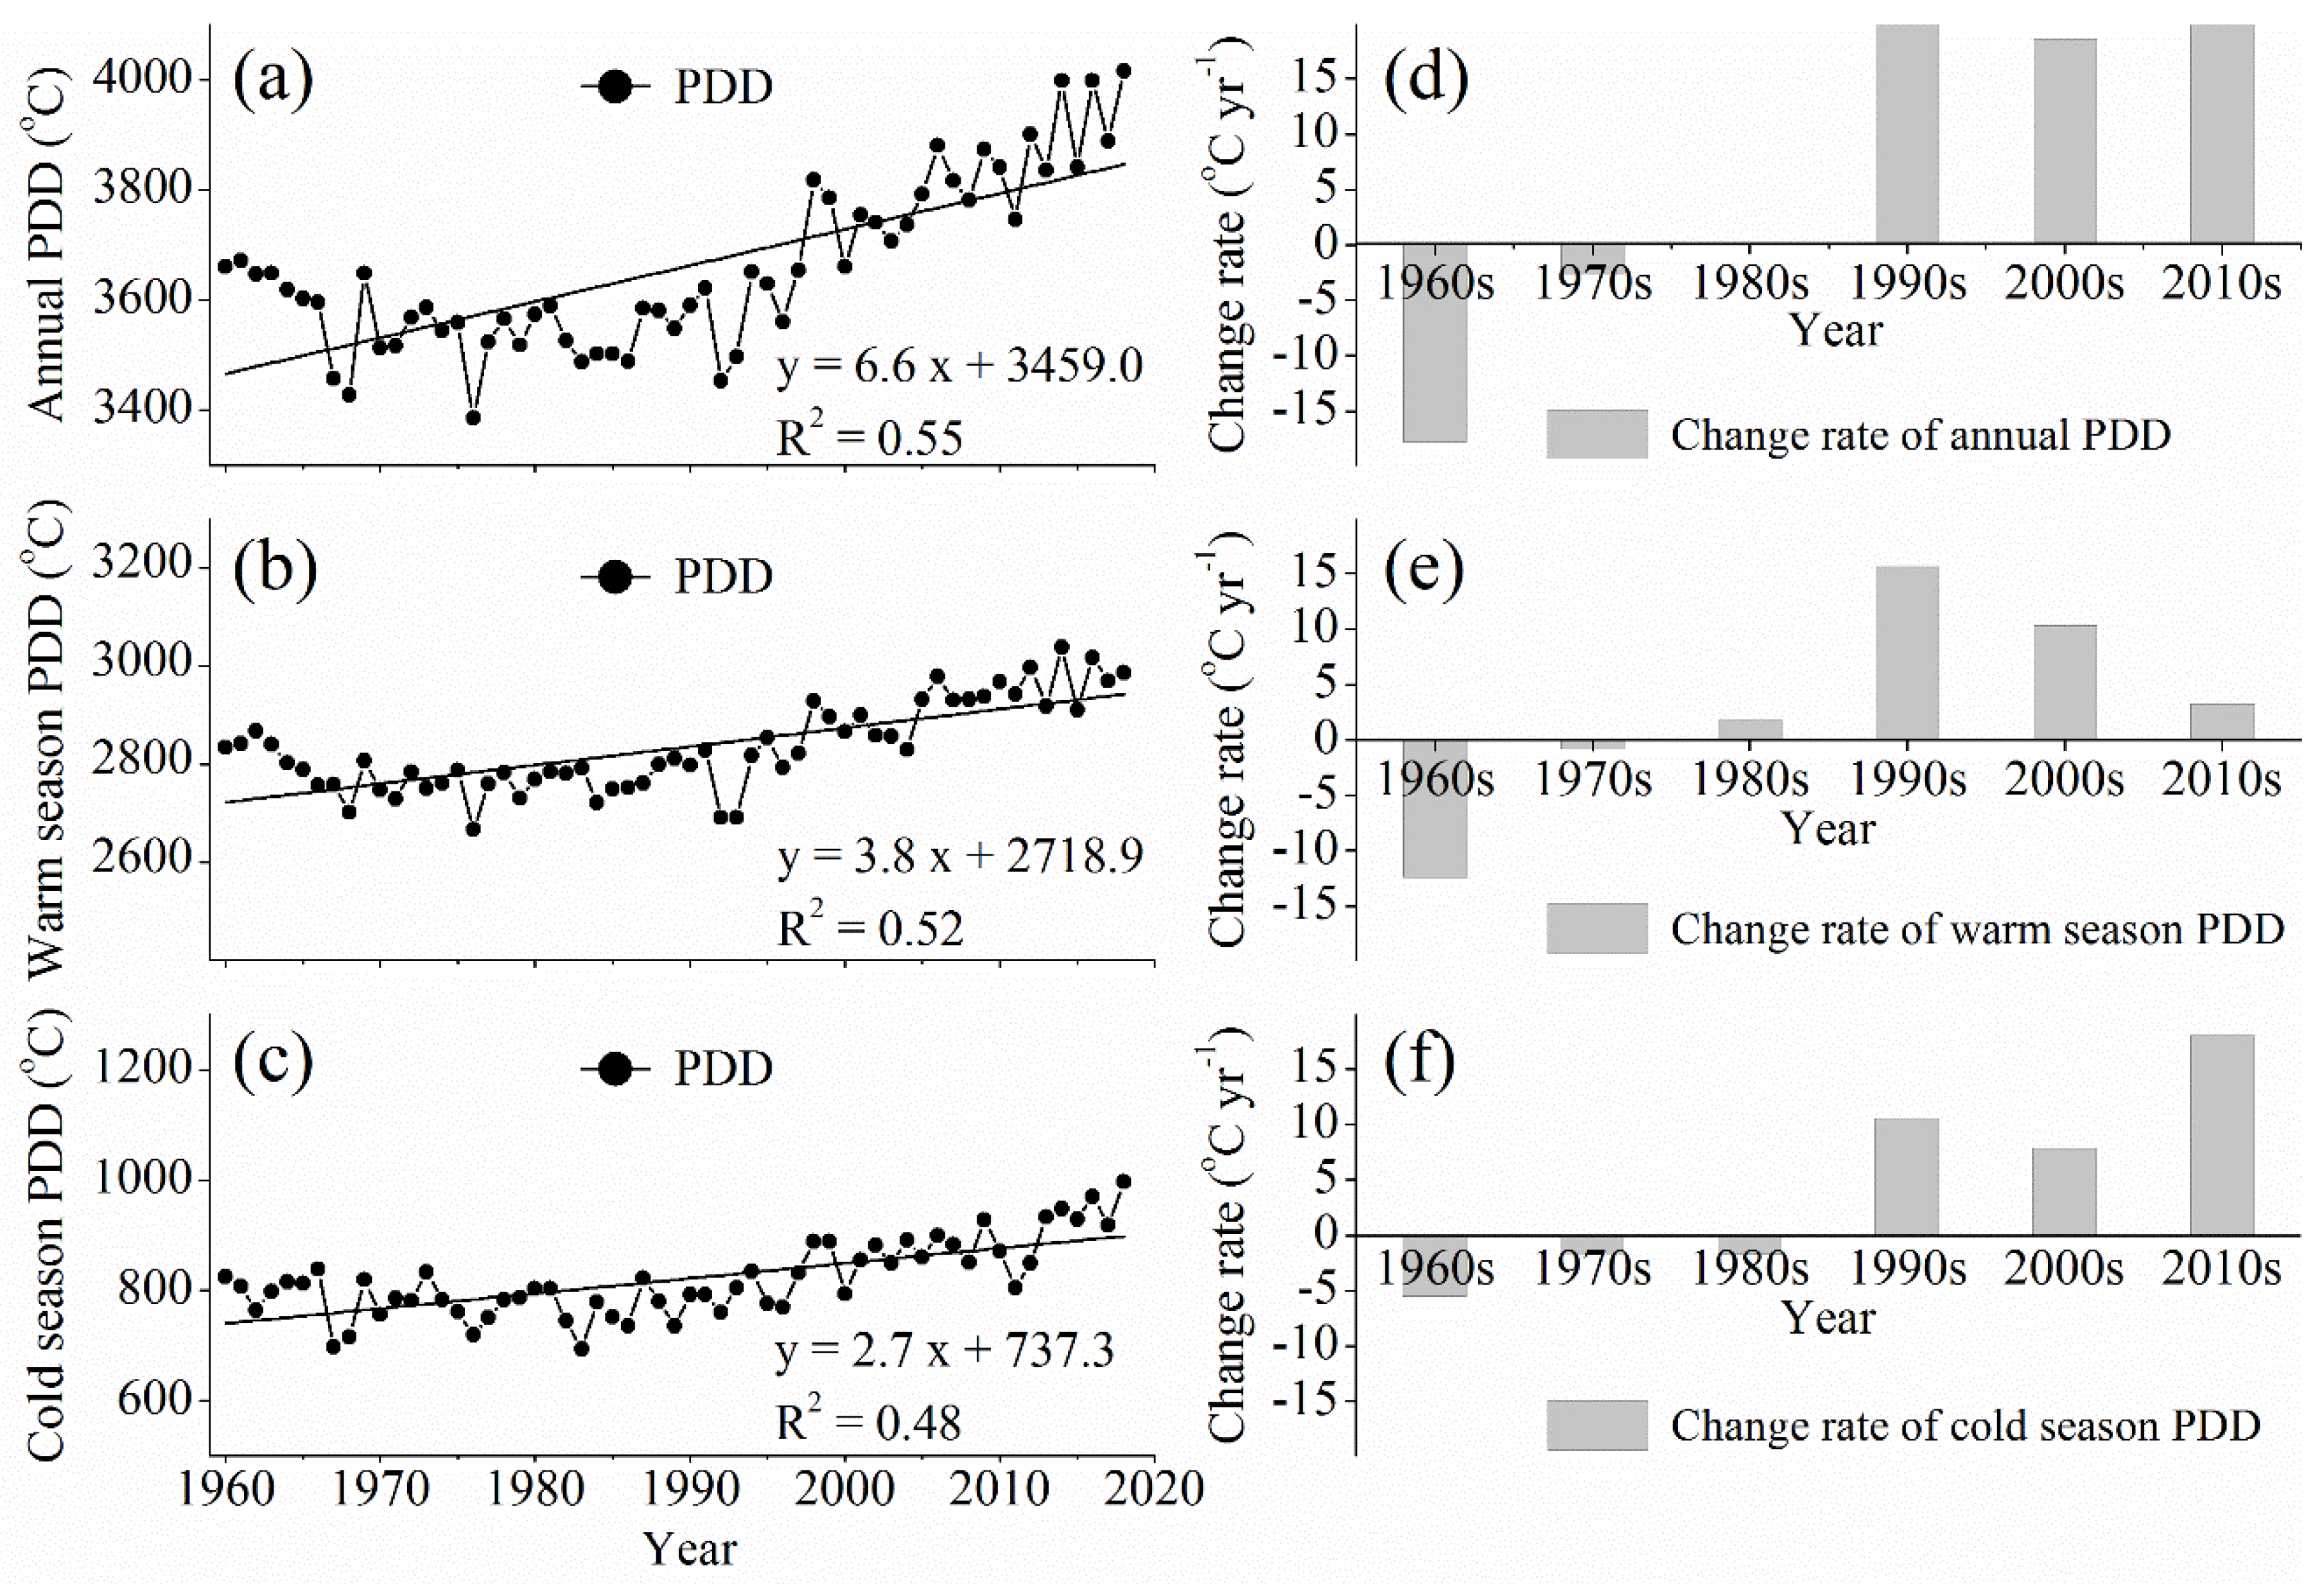
The observed PDD for all stations shows an increasing trend from 1960 to 2018, with PDD change rates of 6.6 °C year−1 for annual (Figure 4a), 3.8 °C year−1 for warm season (Figure 4b), and 2.7 °C year−1 for cold season (Figure 4c); the increase in warm season PDD contributed more to the annual PDD than did cold season PDD. The PDD decreased before and increased after the mid-1980s, and that coincided with the temperature trend in western China [4,10]. The change rate over decades (Figure 4d–f) was negative for annual and cold season from the 1960s to the 1980s, and negative for warm season during the same period. Starting in the 1990s, the trends reversed and became positive. From the 1990s to 2010s, the decadal change rate tended to stabilize for annual PDD with a mean of 22.3 °C year−1, decrease for warm season PDD from 15.6 to 3.2 °C year−1, and increase from 10.5 to 18.0 °C year−1 for cold season PDD. However, although the annual and decadal PDD change rates differed slightly, the trend was similar at both annual and seasonal scales from the 1960s to the 2010s, and the change in PDD increased and then decreased in concert with the change in temperature in western China [4,5].

3.3. Spatial Characteristic of PDD Change in WC

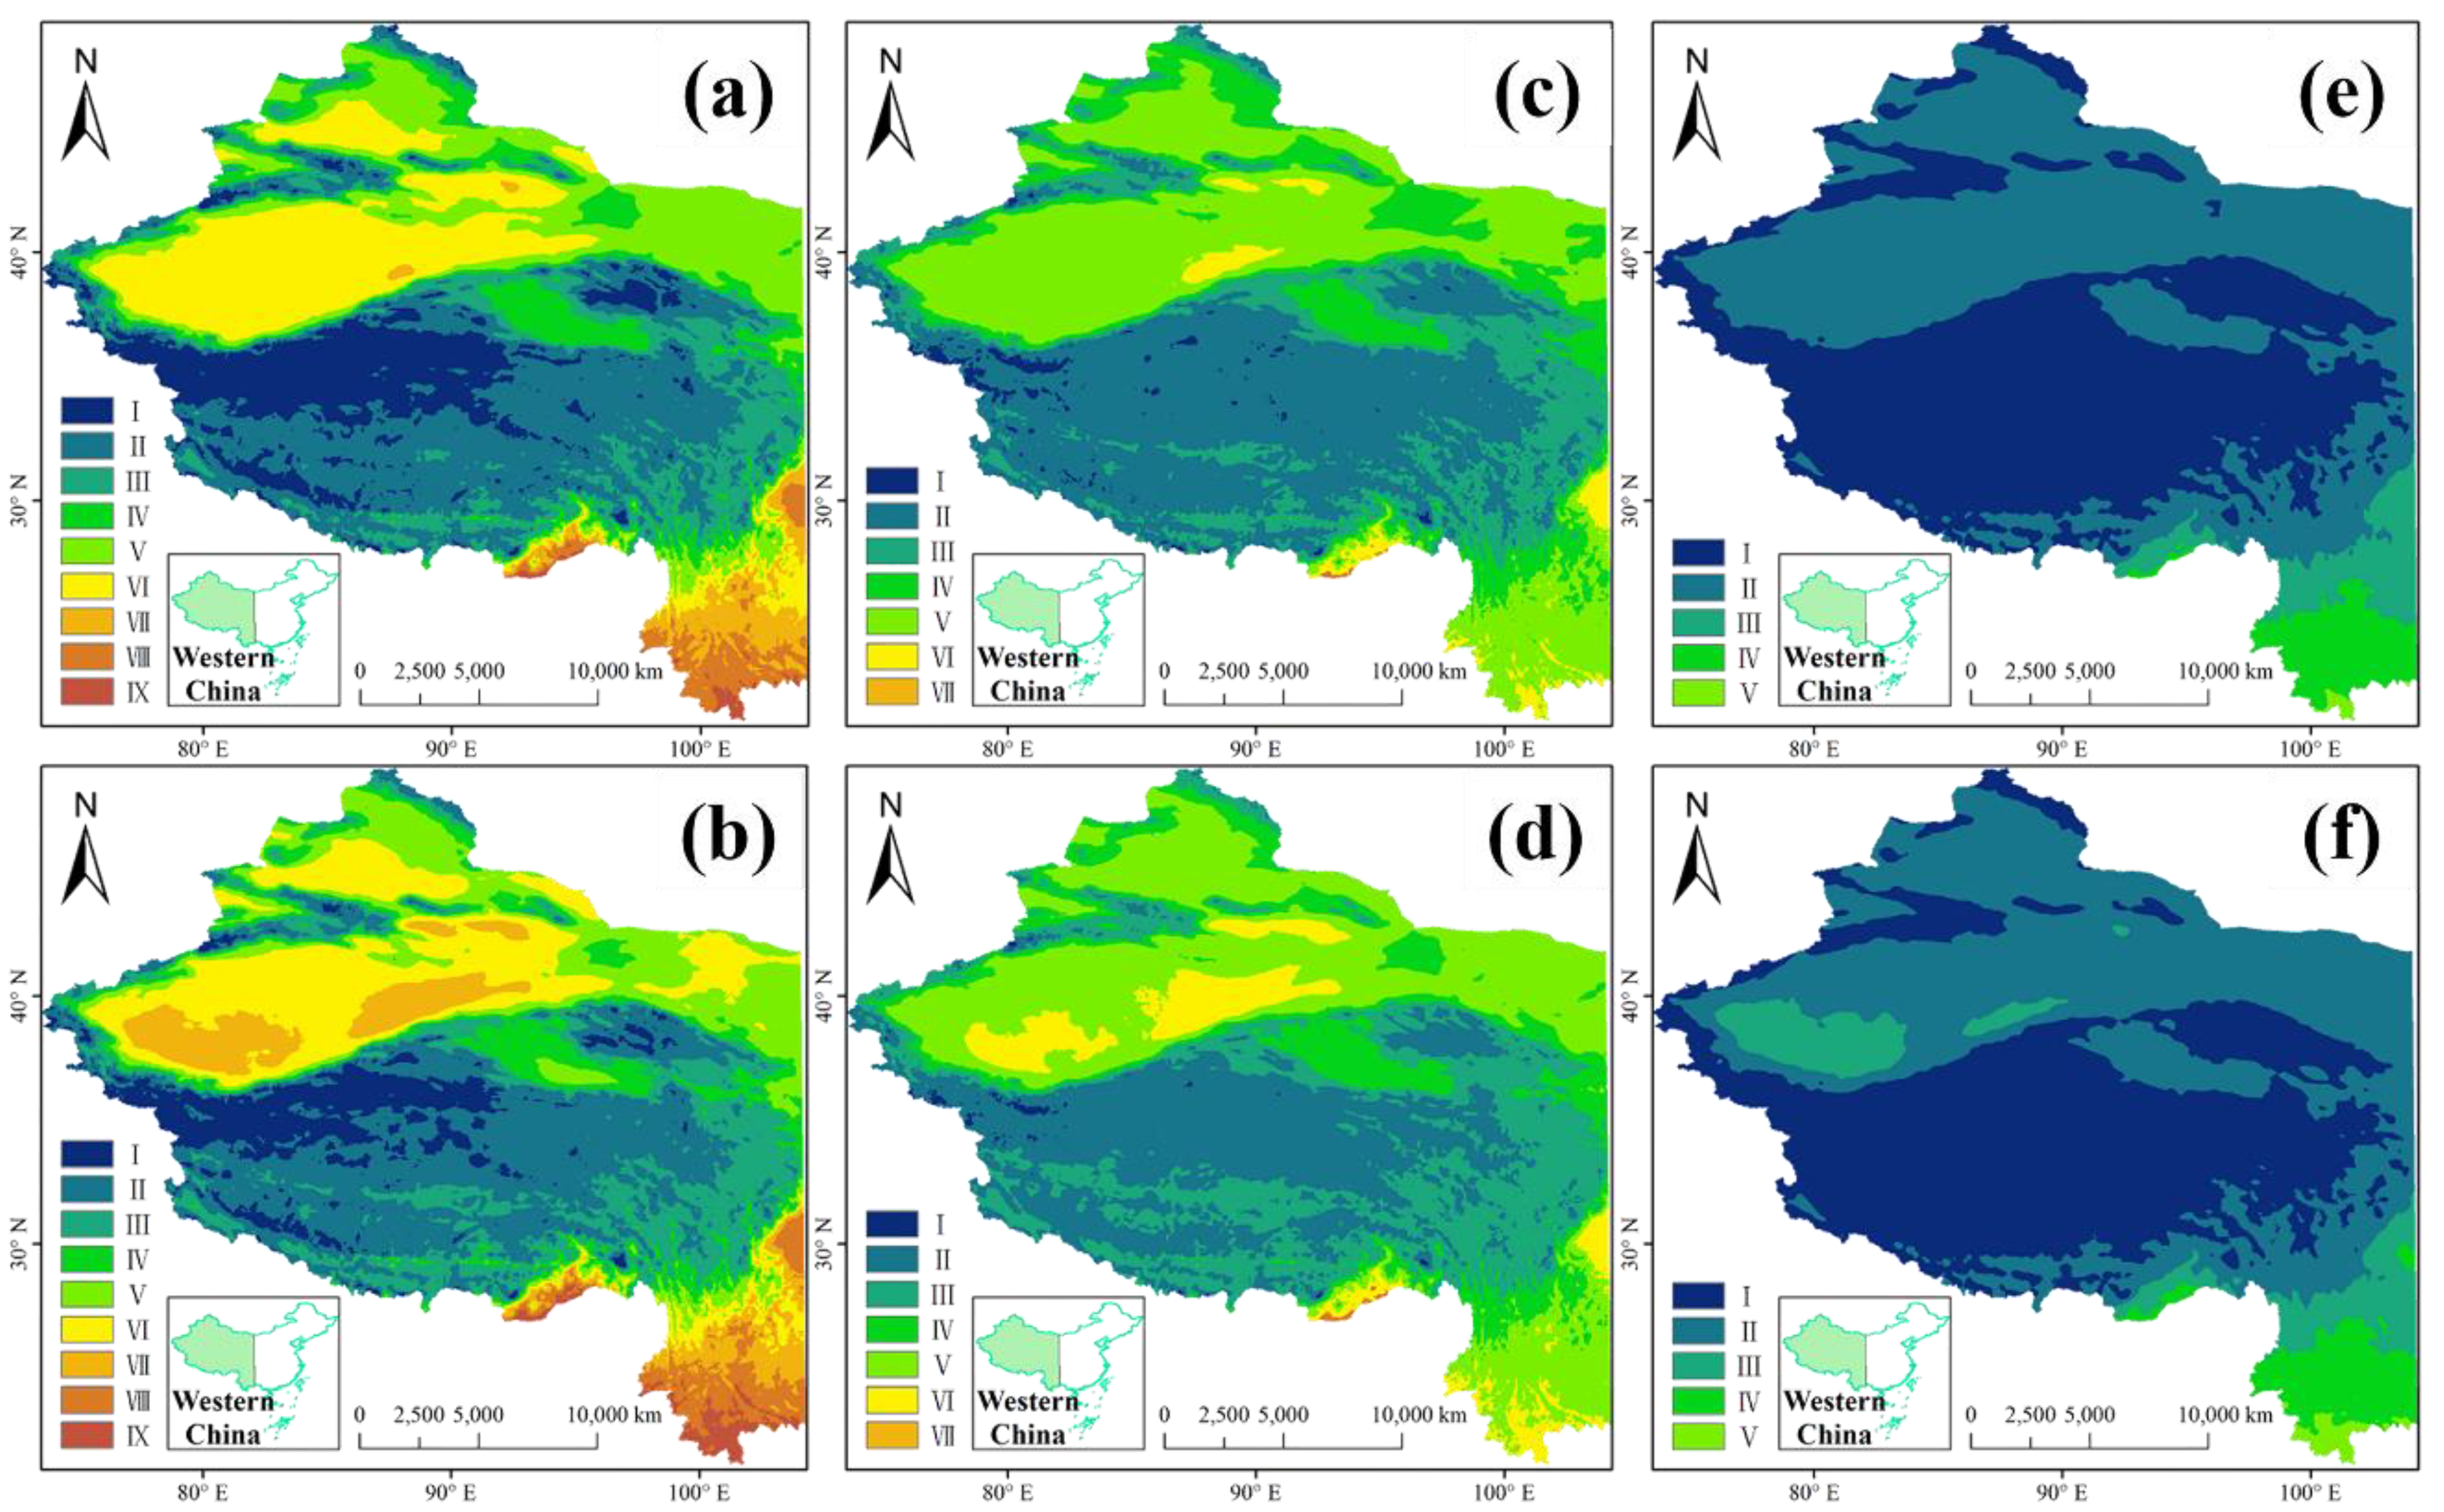
For the past nearly 60 years, the distribution of PDD has changed. Distribution of annual PDD changed significantly over WC (Figure 5a,b): segment I PDD became increasingly fragmented in the northwestern Tibetan Plateau, segment VII appeared in Tarim Basin and Turpan Depression surrounding Tianshan, and the boundary of segment VII, VIII, and IX in the south gradually moved northward. The same trend can also be found in warm season PDD (Figure 5c,d). For cold season PDD (Figure 5e,f), the increase in PDD was mainly reflected in the lower altitude at the edge of Tarim and Sichuan Basins, and the change was not apparent in the high altitude area. On the whole, PDD in WC increased from the 1960s to the 2010s, the low PDD area became gradually fragmented, the high PDD in the south advanced northward, and the low PDD in the high altitude area gradually retreated to higher altitudes.
In the process of continuous warming, a portion of one PDD segment will be transferred to the next highest level, while a portion of a preceding lower level will be added in the current segment. For the annual PDD (Table 5), the biggest increase occurred in segment VII, with an area increase of 19.7 × 10⁴ km2 accounting for 4% of the total study area. At the same time, the area of segment I decreased from 12.5 to 8.2% of WC, a 20.3 × 10⁴ km2 decrease. Compared to the initial area in the 1960s, the area of segment IX has almost tripled. With the area of segment I reduced to 1.6 × 10⁴ km2 in the warm season, the area with a PDD of 0 almost disappeared, while the area with the highest PDD in segment V barely changed, with an increase of 0.49 × 10⁴ km2 or about 0.1% of the total area of WC. Segments with the largest change in PDD were II and III; segment II decreased by 8.5% and III, by 6.8%. Compared with the whole year and warm season, segment change in the cold season PDD was smaller, however, there was a trend of decreasing areas for low PDD segments, and increasing areas for the high PDD segments; thus, areas of PDD below 1000 °C (segments I and II) decreased by a total of 4.3%, while areas above 1000 °C were mainly concentrated in segment III with an area increase of 37.8 × 10⁴ km2 or 3.5% of the total area.
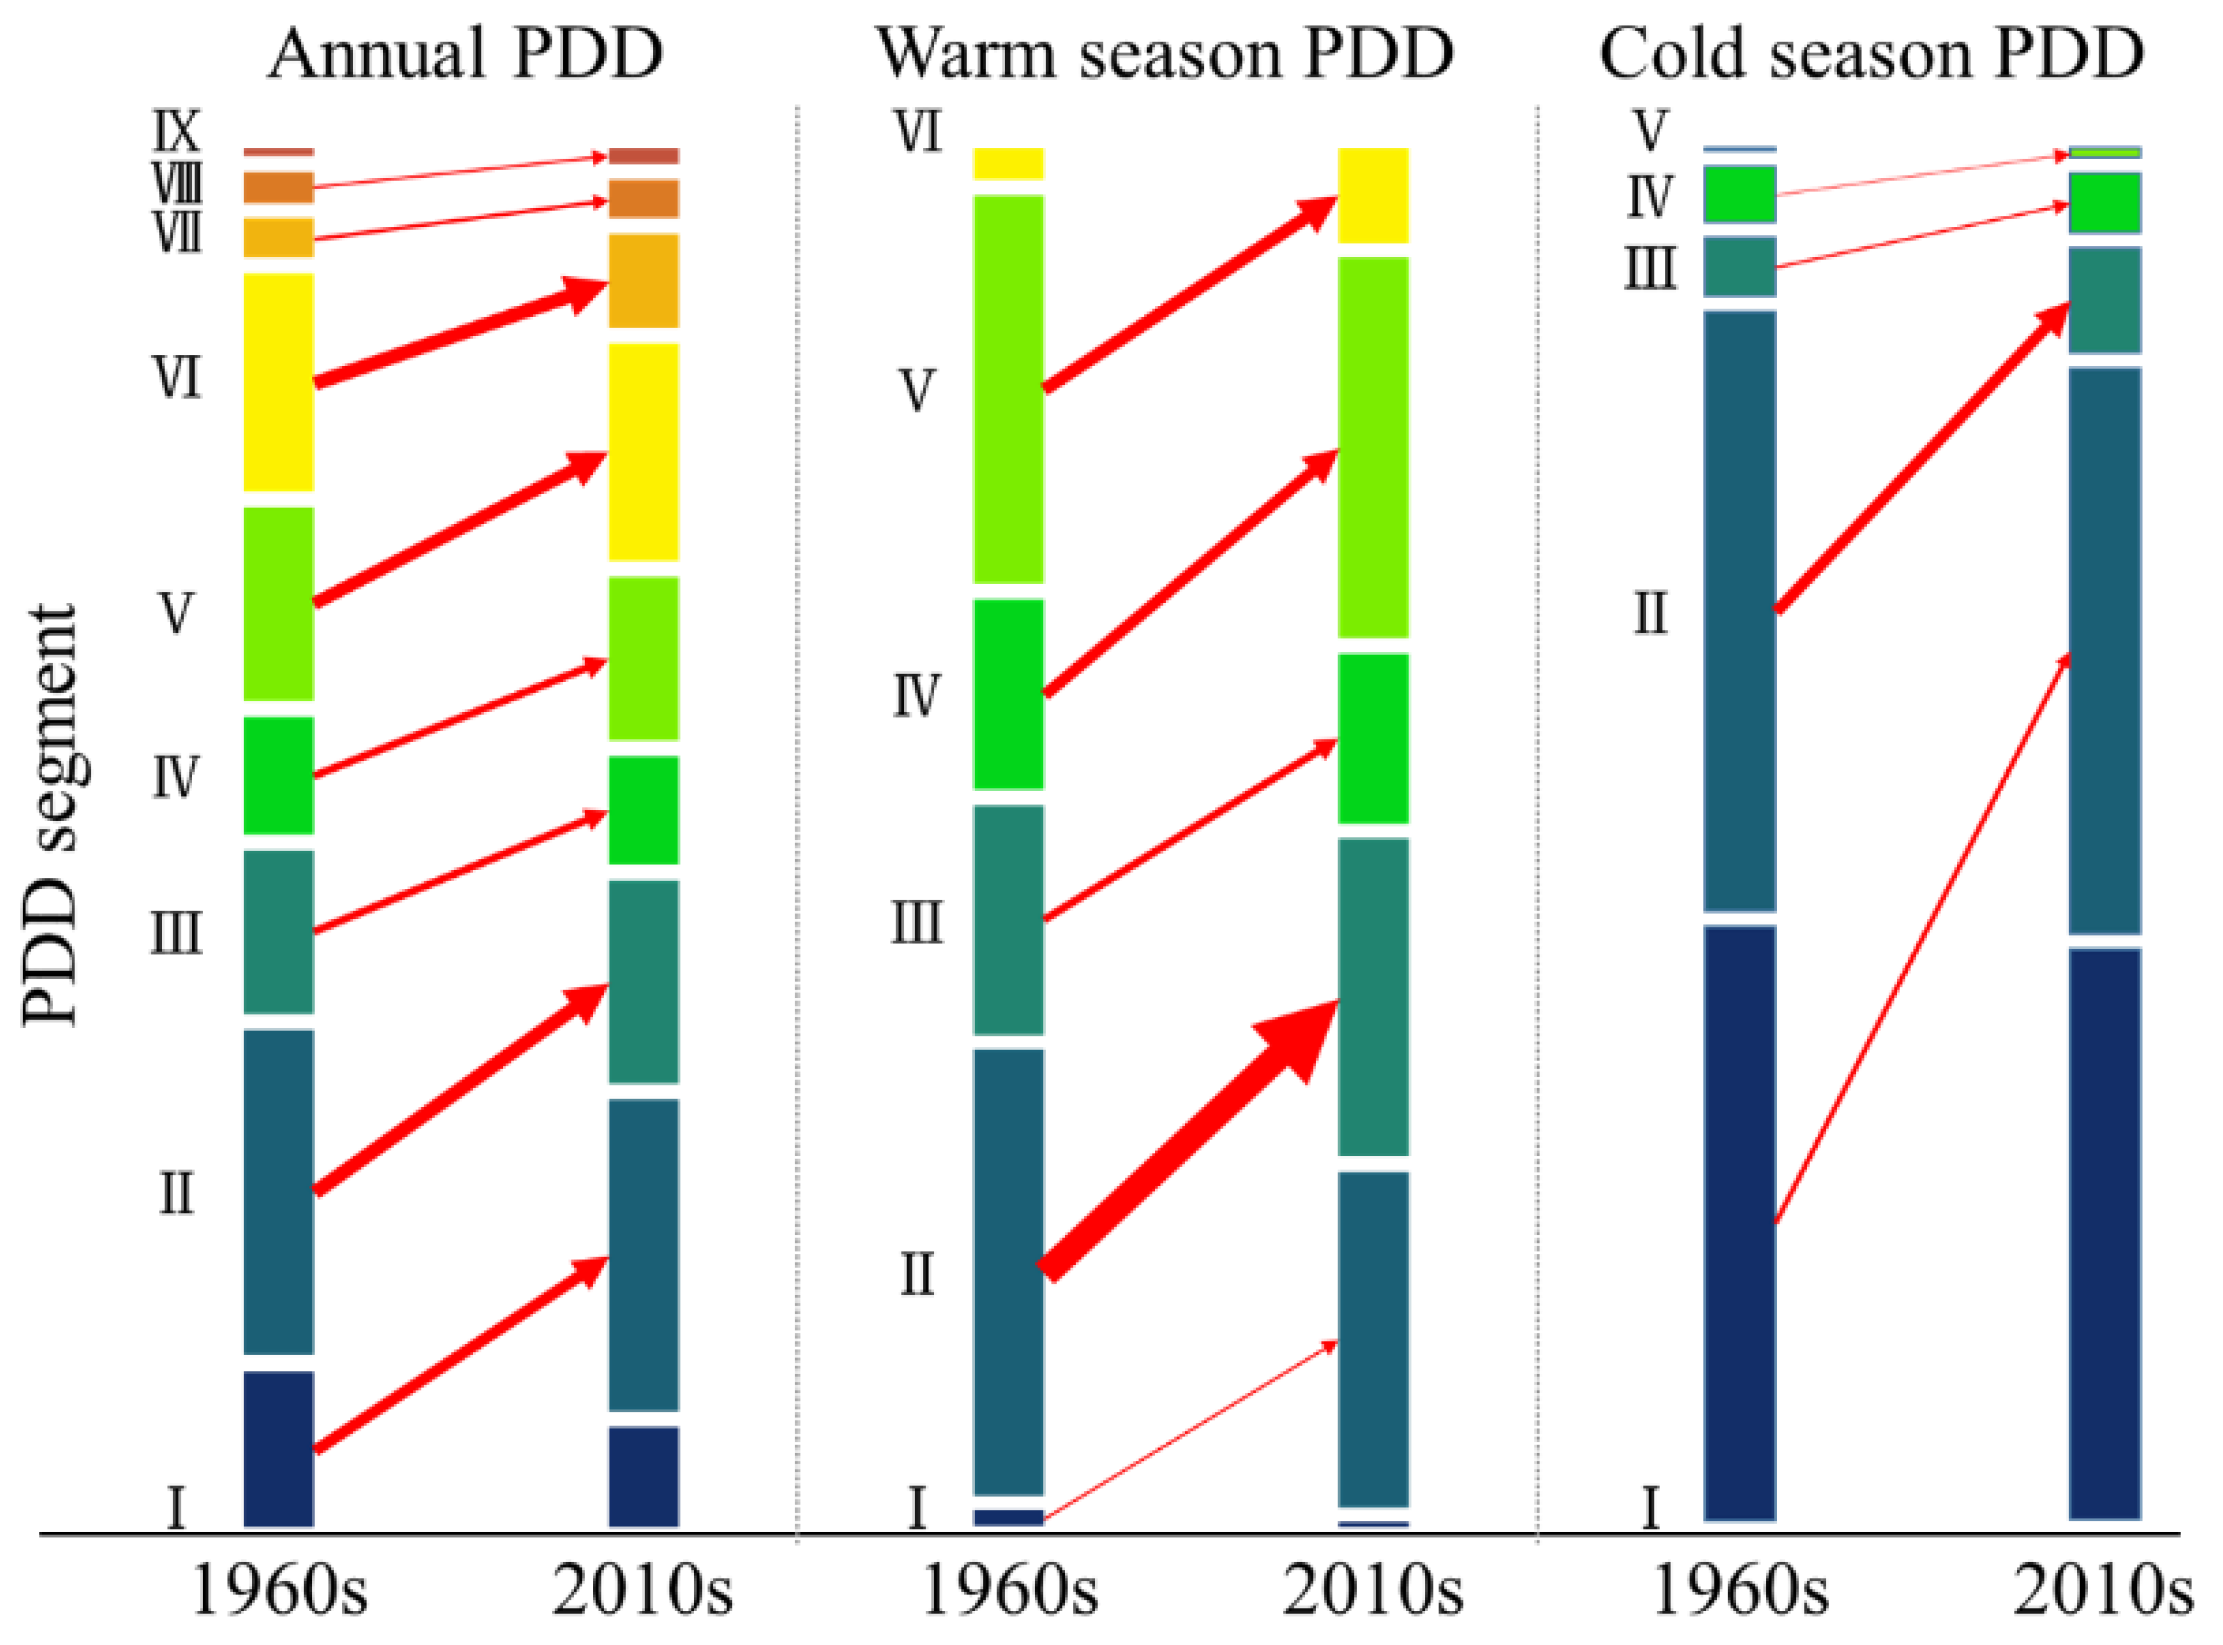
For annual PDD, a total of 130.9 × 10⁴ km2 was transferred from one segment to another, amounting to 27.8% of WC (Figure 6). Area transfer between segments and the corresponding proportions were 104.4 × 10⁴ and 22.2% for warm season PDD, and 37.1 × 10⁴ km2 and 7.9% for cold season PDD. Our results confirmed that the area transferred from segment II to III in the warm season was mainly the result of the PDD increasing from 1000–2000 °C to 2000–3000 °C, with an area of nearly 46.0 × 10⁴ km2, and this transfer pattern also dominated in the annual and cold season PDD (Figure 6). The next main area transfer was from segments V to VI, VI to VII, and I to II for annual PDD, and V to VI and IV to V for warm season PDD, in which area of transfer ranged from 20.0 × 10⁴ to 25.0 × 10⁴ km2. Transfer areas between other segments were smaller than 10 × 104 km2; finally, there were also very small areas (<1 × 10⁴ km2) of PDD with a downward trend with time from the 1960s to the 2010s, but decline was less than the error range of the interpolation error.

4. Discussion

4.1. Difference in Time Trend between PDD and Air Temperature

This paper studied the spatial-temporal distribution of annual, warm season, and cold season PDD in WC from the 1960s to the 2010s. Although PDD is calculated directly from temperature, and both can be used to represent energy levels [22], our results showed that the characteristics of PDD were different from those of temperature.
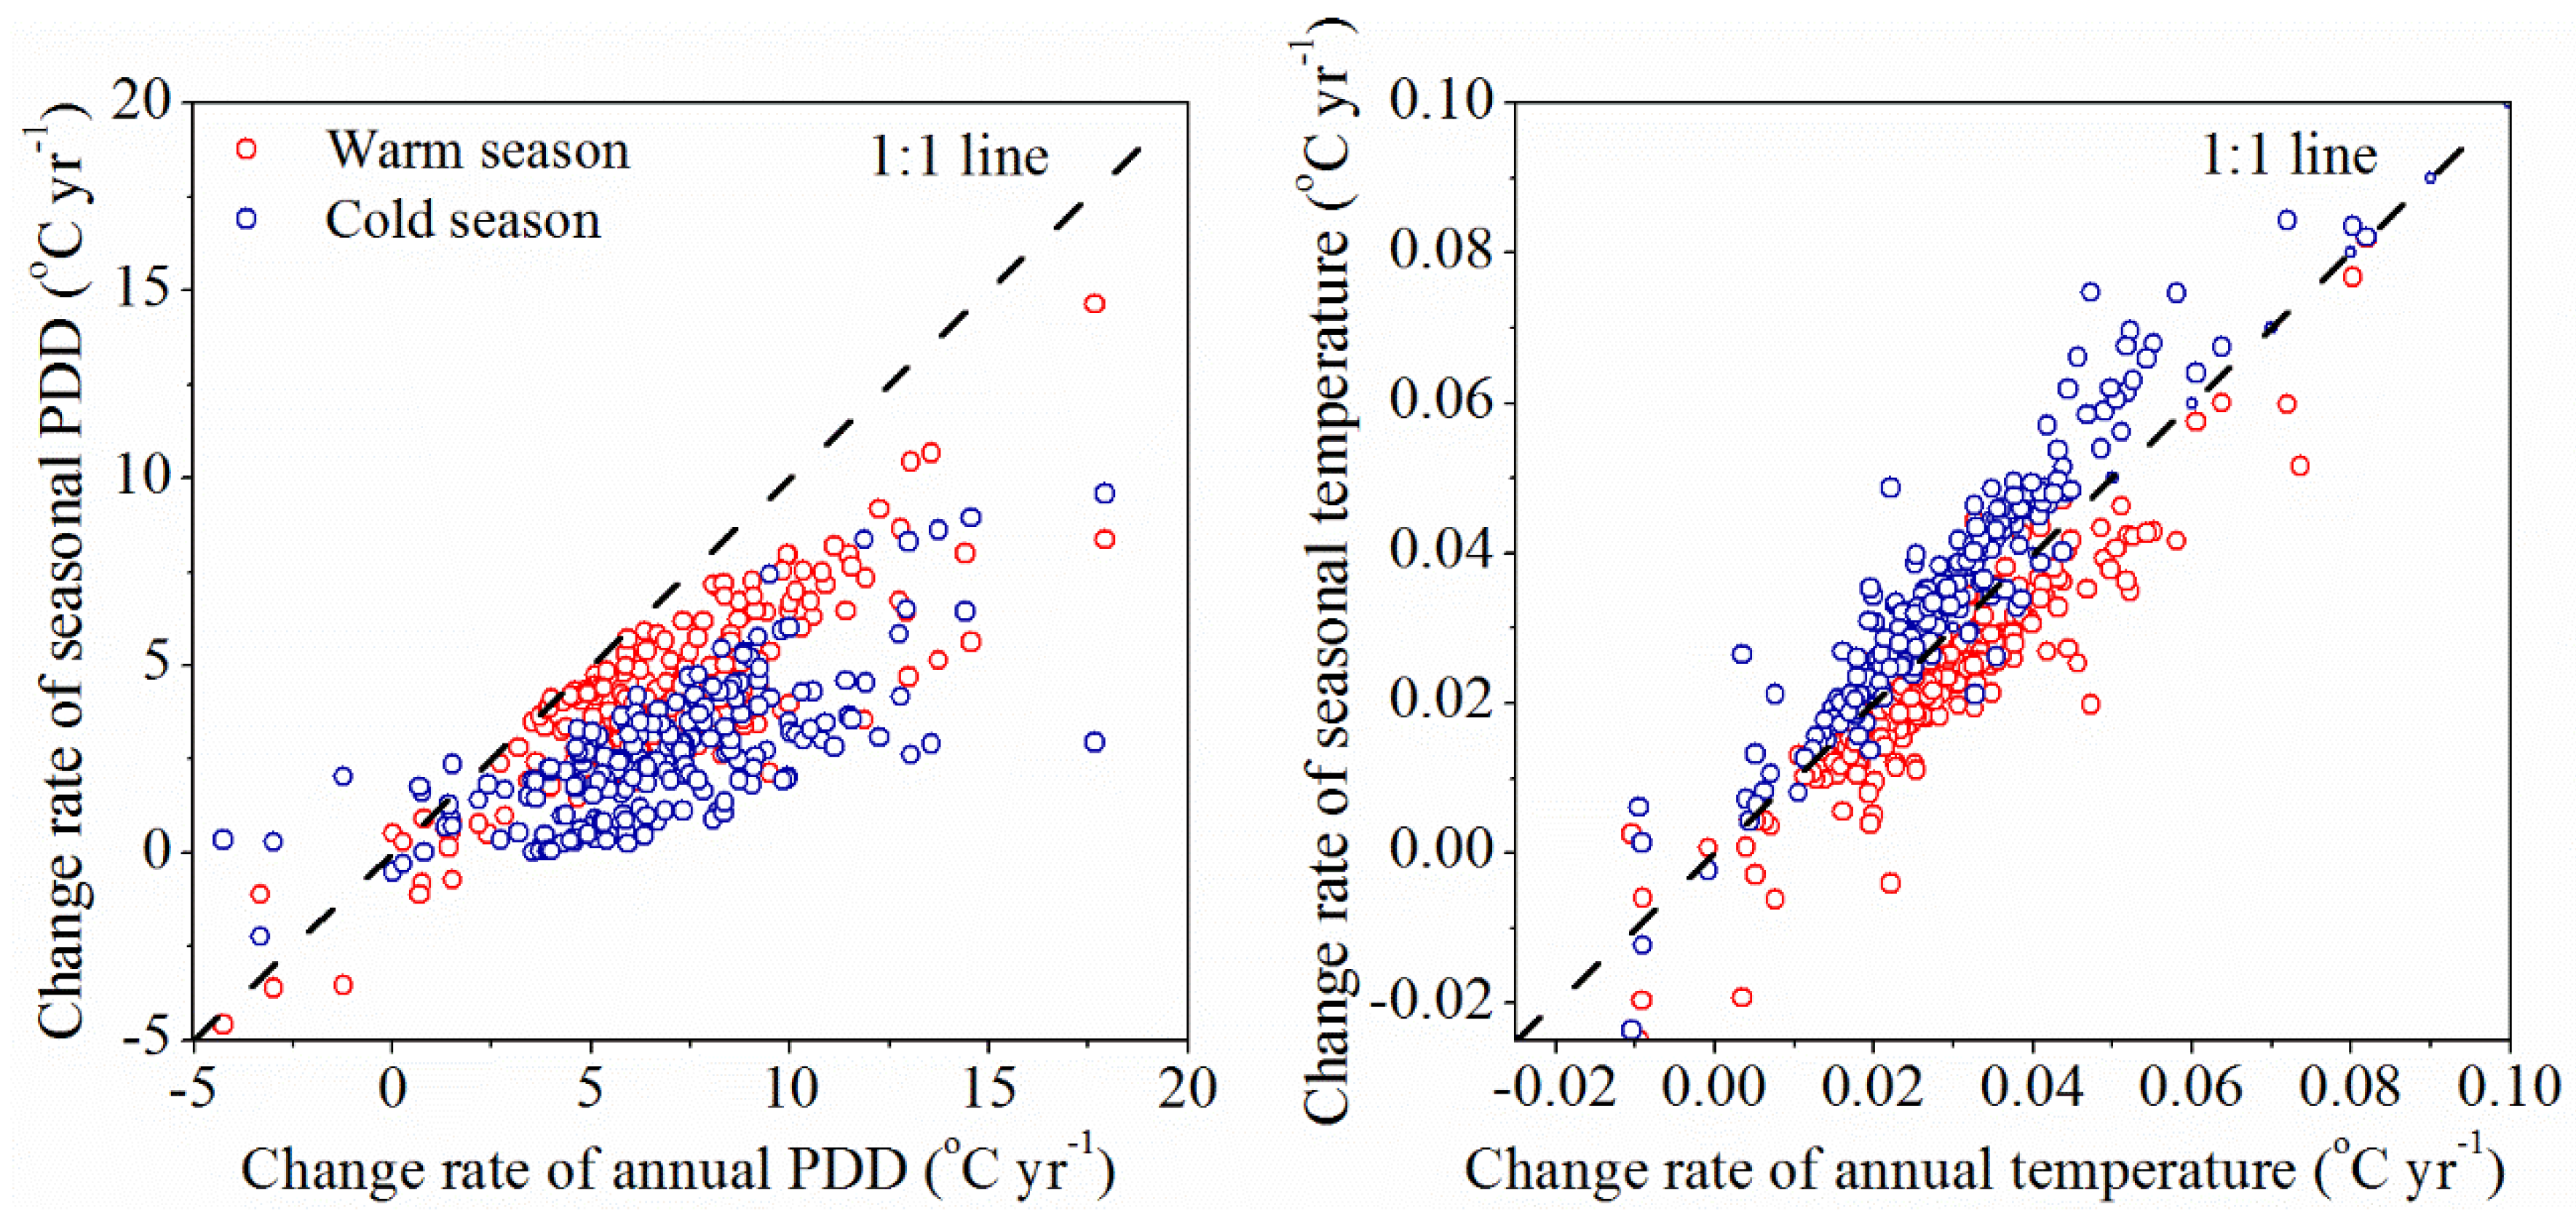
The change rate in PDD at annual and seasonal scales indicated that the increase in PDD in warm seasons contributed more to the annual PDD than that in cold seasons. However, in the arid region of northwestern China [6,7,8,9], the Tibet Plateau [19], the Hengduan Mountains [45], and in the Qilian Mountains [46], warming in the cold season was more pronounced than in the warm season. PDD is often used to determine the relationships with annual or seasonal snow and ice melting [25,30,32], stability of permafrost [26], and vegetation phenology [47], but long-term seasonal variability in PDD has not been studied. We contrasted PDD and air temperature change rate for 209 meteorological stations in western China for the cold and warm seasons (Figure 7). The results showed that the change rate of temperature in the warm season was greater than that in the cold season, and the annual temperature change rate was between those of the warm and cold seasons. At the same time, the change rate of PDD in the cold season was less than that in the warm season, and both were lower than the annual PDD change. The seasonal change rate of PDD is definitely different from that of temperature.
Further, the effect of elevational gradient on the change rate of temperature and PDD were analyzed. Results show that the rate of temperature change in WC increased with elevation, and that was the case at seasonal and annual scales (Figure 8); this was also shown in high mountain regions as elevation-dependent warming (EDW) [12,13,14,48]. The elevation effects on PDD change rate in the cold season and annually is contrary to the EDW of temperature in WC, and PDD increase is “restricted” by high altitude in the cold season. However, seasonal variability in PDD was different from that of air temperature, and this has not been reported in studies of trends in accumulated temperature [40,49].

4.2. Sources of Time Trend Differences: The Relationship between PDD and Air Temperature

To determine the reasons for the differences in PDD and temperature, we explored the definition of PDD and its calculation method. PDD, the positive accumulated temperature, is defined as the sum of all temperatures greater than 0 °C over a specified period [29]. Usually, monthly PDD is obtained from daily temperatures in a month. For regions where detailed temperature records are scarce, the hypothesized annual temperature cycle is supposed to follow a cosine function, and Reeh [30] suggests that monthly PDD totals can be modelled with a Gaussian distribution using mean monthly temperature and a fixed standard deviation. This method is used in uncharted areas where monthly mean temperatures can only be obtained by means of interpolation and accuracy is limited by the seasonal variation in standard deviation [50]. In assessment of current methods of PDD calculation, Wake and Marshall [32] found that the monthly PDD can be viewed as a function of monthly mean temperature. Li [51] fitted the relationship between monthly mean temperature and positive accumulated temperature as a branch of hyperbola, and the results showed a Nash Coefficient of 0.97. Monjur [22] fitted PDD with quadratic temperature and R2 of 0.95 for linear fitting and R2 of > 0.99 for non-linear fitting. In short, monthly PDD has a non-linear relationship with monthly average temperature.
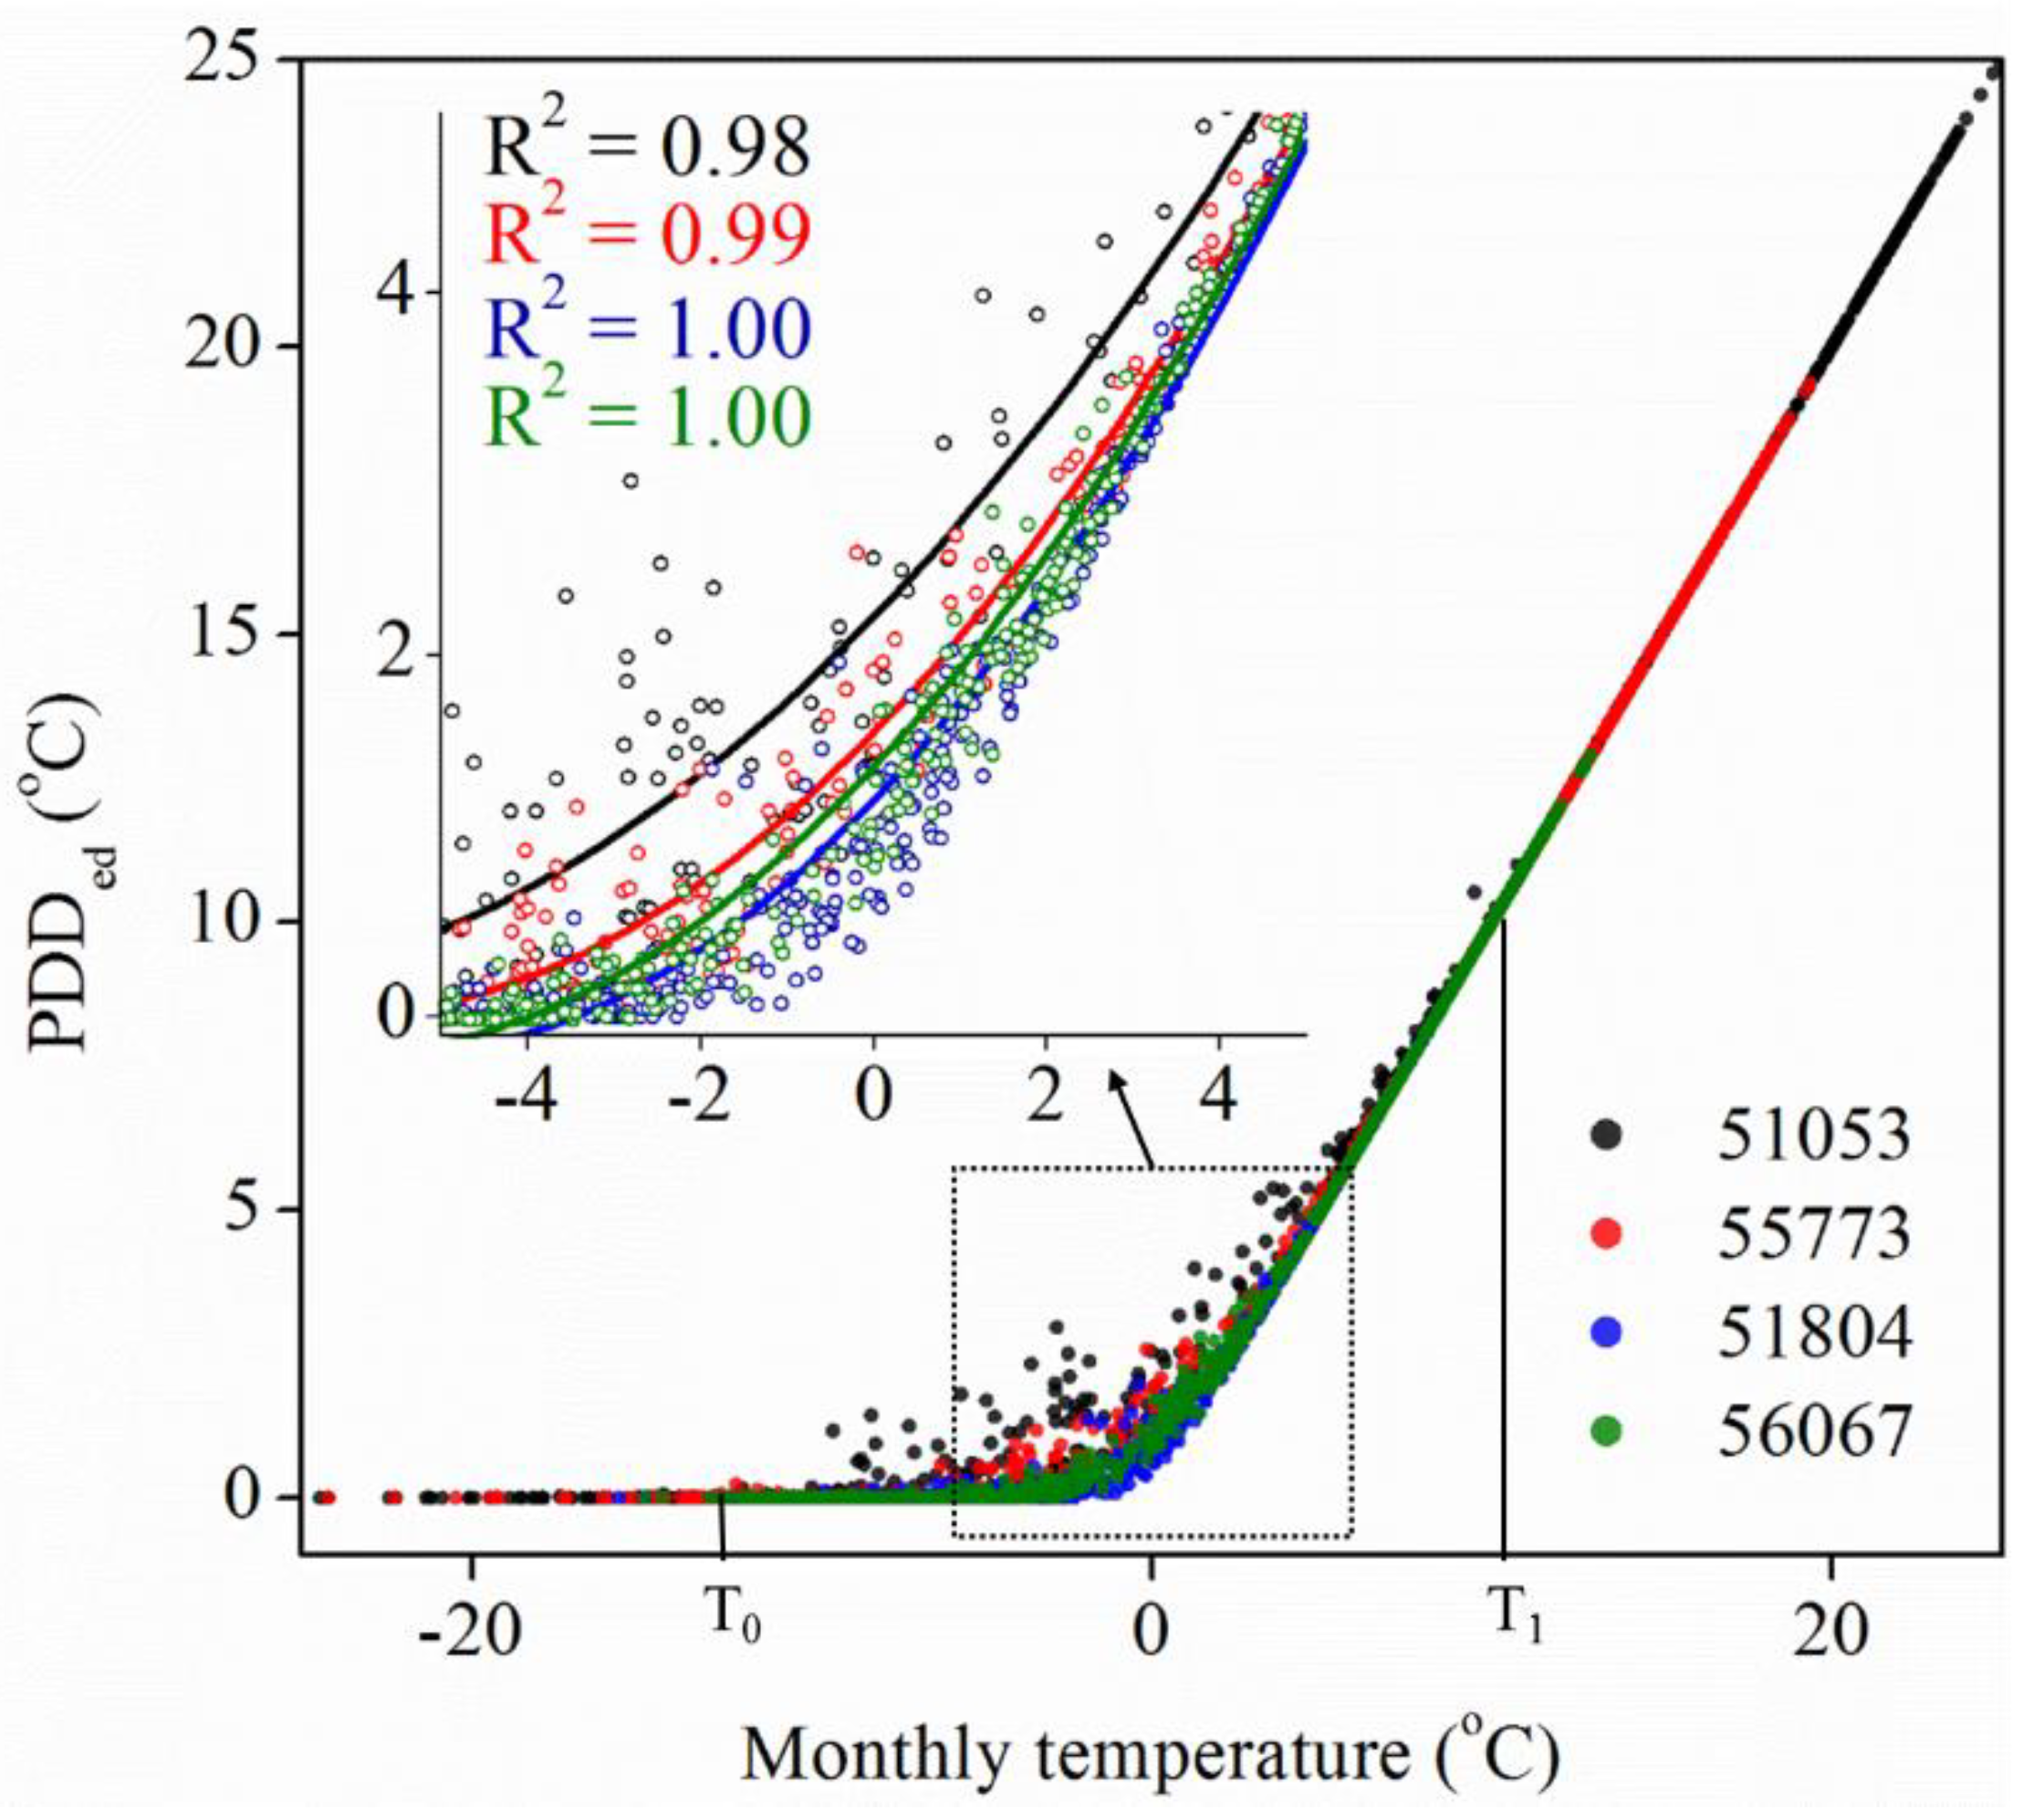
To explore the relationship between PDD and air temperature in WC, four weather stations located in different areas were used to represent the four directions of WC and were used as a case study. Four meteorological stations 51053 (86.40 E, 48.05 N, 532.6 m a.s.l.), 55773 (89.08 E, 27.73 N, 4300.0 m a.s.l.), 51804 (75.23 E, 37.77 N, 3090.1 m a.s.l.), and 56067 (101.48 E, 33.43 N, 3628.5 m a.s.l.) located in the east, south, west, and north of the study region in western China were included in the case study. Considering the convenience of comparison, PDDed were introduced to represent the equalized daily average PDD in one month (PDDed = PDD/d, d is the number of days in one month). At the four sites in WC, the correlation between monthly PDD and average monthly temperature from 1960 to 2018 is shown in Figure 9.
It can be clearly found that the relationship is nonlinear between monthly temperature (T) and PDDed, and in their fitted curves (Figure 9), there are critical temperatures T0 and T1, which can divide the correlation into three sections. When there were no positive daily temperatures in one month with T lower than T0, PDDed was 0 °C; when there were no negative daily temperatures in one month with T greater than T1, PDDed was equal to T; when T was between T0 and T1, PDDed and T exhibited a non-linear relationship. To verify that the above law is universal in WC, the critical temperature T0, T1, and the fitting equation of T and PDDed were determined in all meteorological stations. For every station, T0 is defined as the maximum T corresponding to PDDed = 0, T1 is defined as the minimum T corresponding to PDDed = T, and the equation is formatted as PDDed = b1+b2*T+ b3*T2 when the T is between T0 and T1. The result shows that there were 56 stations at low latitudes with no negative temperatures. For the other 153 stations, the mean T0 and T1 were −3.9 and 4.3 °C, respectively. The mean R2 of the regression equation was 0.92 for 153 stations. Result indicate that the relationship between T and PDDed in the case stations is universal in WC. According to the geometric characteristics of the fitted curve (Figure 9), it can be found that the change rate of PDD is constantly less than or equal to that of temperature, and the change rate of PDD is smaller in cold regions under the same temperature change rate, and this is the reason why the temperature and PDD changes are not synchronized. However, this desynchronization need to be studied further, because the temperature and PDD both can be used as a temperature index in assessment of the climate impact on the cryosphere, but in practice, their usage is not exactly the same.

5. Conclusions

PDD is widely applicable because cryospheric changes are mainly manifested as melting of solid water, a process that mainly depends on temperatures above 0 °C. Therefore, it is extensively used to model the changes in glaciers and snow. On the other hand, PDD also affects vegetation distribution and growth characteristics by representing regional total heat in a certain stage. Both of these aspects are very important for western China because it is a main region of the cryosphere, and it has a fragile ecosystem driven by the warm-dry climate in the north, and the cold climate in the Tibetan Plateau and other high mountain areas. In the past 60 years, the mean PDD in annual, warm season, and cold season was 3652.2, 2832.9, and 819.3 °C year−1, respectively, in WC as determined from meteorological station observations. In WC, the annual, warm season and cold season PDD values are mainly in segments of I–VI (0~5000°C), II–V (1000~4000 °C), and I–II (0~1000 °C) covering 93%, 96%, and 90% of the total area of WC, respectively. From 1960 to 2018, PDD experienced a process from decreasing to increasing, with the 1980s as the turning point. A total of 130.9 × 10⁴ km2 was transferred from one segment to another, amounting to 27.8% of WC. The area transferred from segment II to III by the PDD ascending from 1000–2000 °C to 2000–3000 °C was the dominant transfer pattern. The increase of PDD in the cold season was slower than that in the warm season, and the increase was smaller at high altitudes, which is contrary to the trend of temperature change. However, the inconsistent trend can be explained by the nonlinear relationship between temperature and PDD that originates from their definition and potential climatological significance. It reveals that PDD is a different climatic indicator for evaluating the change in cryosphere compared with air temperature. For the cryosphere, PDD’s indication of climate change is more direct, therefore, it is recommended to preferentially use PDD as the temperature index in the evaluation of changes in cryosphere elements.

Author Contributions

Conceptualization, G.L.; Data curation, R.C.; Formal analysis, X.W.; Funding acquisition, R.C.; Project administration, R.C.; Resources, G.L. and R.C.; Software, G.L.; Writing—original draft, G.L.; Writing—review & editing, G.L. All authors have read and agreed to the published version of the manuscript.

Funding

This study was supported primarily by the National Key Research and Development Program of China (2019YFC1510505), the National Natural Science Foundation of China (41690141), and Qinghai Key R&D and Transformation Program (2020-SF-146).

Institutional Review Board Statement

Not applicable.

Informed Consent Statement

Not applicable.

Acknowledgments

This study was supported primarily by the National Key Research and Development Program of China (2019YFC1510505), the National Natural Science Foundation of China (41690141), and Qinghai Key R&D and Transformation Program (2020-SF-146). The authors thank all team members in the Qilian Alpine Ecology and Hydrology Research Station. Guohua Liu is the main author and calculated and analyzed the results. Rensheng Chen is the corresponding author who improved the ideas and methods. Xiqiang Wang offered help in data processing and methods. Thanks to Kathryn B. Piatek for her editorial suggestions on the spelling and grammar of the manuscript.

Conflicts of Interest

The authors declare no conflict of interest.

References

  1. IPCC. Climate Change: The Physical Science Basis: Contribution of Working Group I to the Fourth Assessment Report of the Intergovernmental Panel on Climate Change; Cambridge University Press: New York, NY, USA; Cambridge, UK, 2007. [Google Scholar]
  2. IPCC. Climate change: The Physical Science Basis: Contribution of Working Group I to the Fifth Assessment Report of the Intergovernmental Panel on Climate Change; Cambridge University Press: New York, NY, USA; Cambridge, UK, 2013. [Google Scholar]
  3. Ji, F.; Wu, Z.; Huang, J.; Chassignet, E.P. Evolution of land surface air temperature trend. Nat. Clim. Chang. 2014, 4, 462–466. [Google Scholar] [CrossRef]
  4. Ren, G.; Ding, Y.; Tang, G. An overview of mainland China temperature change research. J. Hydrometeorol. 2017, 31, 3–16. [Google Scholar] [CrossRef]
  5. Tang, H.; Zhai, P. Comparison of variations of surface air temperatures in eastern and western China during 1951~2002. Chin. J. Geophys. 2005, 48, 526–534. (In Chinese) [Google Scholar] [CrossRef]
  6. Huang, J.; Guan, X.; Ji, F. Enhanced cold-season warming in semi-arid regions. Atmos. Chem. Phys. 2012, 12, 5391–5398. [Google Scholar] [CrossRef] [Green Version]
  7. Li, B.; Chen, Y.; Shi, X. Why does the temperature rise faster in the arid region of northwest China? J. Geophys. Res. 2012, 117, 1–7. [Google Scholar] [CrossRef] [Green Version]
  8. Li, B.; Chen, Y.; Shi, X.; Chen, Z.; Li, Q. Temperature and precipitation changes in different environments in the arid region of northwest China. Theor. Appl. Climatol. 2013, 112, 589–596. [Google Scholar] [CrossRef]
  9. Chen, Y.; Deng, H.; Li, B.; Li, Z.; Xu, C. Abrupt change of temperature and precipitation extremes in the arid region of Northwest China. Quatern. Int. 2014, 336, 35–43. [Google Scholar] [CrossRef]
  10. Shi, Y.; Shen, Y.; Hu, R. Preliminary study on siginal, impact and foreground of climatic shift from warm-dry to warm-humid in northwest China. J. Glaciol. Geocryol. 2002, 24, 219–226. (In Chinese) [Google Scholar]
  11. Shi, Y.; Shen, Y.; Li, D.; Zhang, G.; Ding, Y.; Hu, R.; Kang, E. Discussion on the present climate change from warm-dry to warm-wet in northwest China. Quat. Sci. 2003, 23, 153–164. [Google Scholar]
  12. Ohmura, A. Physical Basis for the temperature-based melt-index method. J. Appl. Meteorol. 2001, 40, 753–761. [Google Scholar] [CrossRef]
  13. Rangwala, I.; Miller, J. Climate change in moutains: A review of elevation-dependent warming and its possible cause. Clim. Chang. 2012, 114, 527–547. [Google Scholar] [CrossRef]
  14. Palazzi, E.; Mortarini, L.; Terzago, S.; Hardenberg, J. Elevation-dependent warming in global climate simulations at high spatial resolution. Clim. Dynam. 2018, 52, 2685–2702. [Google Scholar] [CrossRef] [Green Version]
  15. Ren, G.; Xu, M.; Chu, Z. Changes of surface air temperature in China during 1951–2004. Clim. Environ. Res. 2005, 10, 717–727. (In Chinese) [Google Scholar]
  16. Liu, X.; Cheng, G.; Yan, L.; Yin, J. Elevation dependency of recent and future minimum surface air temperature trends in the Tibetan Plateau and its surroundings. Global. Planet. Chang. 2009, 68, 164–174. [Google Scholar] [CrossRef]
  17. Gong, D.; Zhou, T.; Wang, S. Advance in the studies on north atlantic oscillation (NAO). Adv. Earth. Sci. 2001, 16, 413–420. (In Chinese) [Google Scholar]
  18. Duan, A.; Wu, G. Change of cloud amount and the climate warming on the Tibetan Plateau. Geophys. Res. Lett. 2006, 33, 1–5. [Google Scholar] [CrossRef]
  19. Hua, S.; Liu, Y.; Jia, R.; Chang, S.; Wu, C.; Zhu, Q.; Shao, T.; Wang, B. Role of clouds in accelerating cold-season warming during 2000–2015 over the Tibetan Plateau. Int. J. Climatol. 2017, 38, 4950–4966. [Google Scholar] [CrossRef]
  20. Wang, Y.; Sun, Y.; Hu, T.; Qin, D.; Song, L. Attribution of temperature changes in Western China. Int. J. Climatol. 2017, 38, 1–9. [Google Scholar] [CrossRef]
  21. Duan, A.; Xiao, Z. Does the climate warming hiatus exist over the Tibetan Plateau? Sci. Rep. UK 2015, 5, 13711. [Google Scholar] [CrossRef]
  22. Monjur, M. Relationship between annual mean temperature and degree-days. Energ. Build. 2012, 54, 418–425. [Google Scholar]
  23. Hock, R. Temperature index melt modelling in mountain areas. J. Hydrol. 2003, 282, 104–115. [Google Scholar] [CrossRef]
  24. Hock, R. Glacier melt: A review of processes and their modelling. Prog. Phys. Geog. 2005, 29, 362–391. [Google Scholar] [CrossRef]
  25. Zhang, Y.; Liu, S.; Ding, Y. Observed degree-day factors and their spatial variation on glaciers in western China. Ann. Glaciol. 2006, 43, 301–306. [Google Scholar] [CrossRef] [Green Version]
  26. Chen, G.; Jiang, H.; Wang, K. Thawing index and freezing index in the embankment surface in permafrost regions. J. Glaciol. Geocryol. 2003, 25, 603–607. (In Chinese) [Google Scholar]
  27. Anisimov, O.A.; Lobanov, V.; Reneva, S.; Shiklomanov, N.; Zhang, T.; Nelson, F. Uncertainties in gridded air temperature fields and effects on predictive active layer modeling. J. Geophys. Res. 2007, 112, 1–12. [Google Scholar] [CrossRef]
  28. Beltaos, S. Climate impacts on the ice regime of an Atlantic river. Nordic Hydrol. 2003, 35, 81–99. [Google Scholar] [CrossRef]
  29. Braithwaite, R. Calculation of degree-days for glacier-climate research. Z. Gletsch. Glazialgeol. 1985, 20, 1–8. [Google Scholar]
  30. Reeh, N. Parameterization of melt rate and surface temperature on the Greenland ice sheet. Polarforschung 1989, 5913, 113–128. [Google Scholar]
  31. Carlov, R.; Greve, R. A semi-analytical solution or the positive degree-day model with stochastic temperature variations. J. Glaciol. 2005, 51, 173–175. [Google Scholar] [CrossRef] [Green Version]
  32. Wake, L.; Marshall, S. Assessment of current methods of positive degree-day calculation using in situ observations from glaciated regions. J. Glaciol. 2015, 61, 329–334. [Google Scholar] [CrossRef] [Green Version]
  33. Yao, T.; Thompson, L.; Yang, W.; Yu, W.; Gao, Y.; Guo, X.; Yang, X.; Duan, K.; Zhao, H.; Xu, B.; et al. Different glacier status with atmospheric circulations in Tibetan Plateau and surroundings. Nat. Clim. Chang. 2012, 2, 663–667. [Google Scholar] [CrossRef]
  34. Qin, D. Assessment Report on Environment Evolutions in Western China; Science Press: Beijing, China, 2002; p. 242. [Google Scholar]
  35. Qin, D.; Ding, Y. Cryospheric Changes and their impacts: Present, trends and key issues. Adv. Clim. Chang. Res. 2009, 5, 187–195. (In Chinese) [Google Scholar] [CrossRef]
  36. Kang, S.; Xu, Y.; You, Q.; Flügel, W.A.; Pepin, N.; Yao, T. Review of climate and cryospheric change in the Tibetan Plateau. Environ. Res. Lett. 2010, 5, 1–8. [Google Scholar] [CrossRef]
  37. Li, Y.; Ding, Y.; Shangguang, D.; Wang, R. Regional differences in global glacier retreat from 1980 to 2015. Adv. Clim. Chang. Res. 2019, 10, 203–213. [Google Scholar] [CrossRef]
  38. Li, X.; Cheng, G.; Jin, H.; Kang, E.; Che, T.; Jin, R.; Wu, L.; Nan, Z.; Wang, J.; Shen, Y. Cryospheric change in China. Glob. Planet. Chang. 2008, 62, 210–218. [Google Scholar] [CrossRef]
  39. Guo, W.; Liu, S.; Xu, J.; Wu, L.; Shangguan, D.; Yao, X.; Wei, J.; Bao, W.; Yu, P.; Liu, Q.; et al. The second Chinese glacier inventory: Data, methods and results. J. Glaciol. 2015, 61, 357–372. [Google Scholar] [CrossRef] [Green Version]
  40. Wang, X.; Chen, R.; Liu, J. Spatial and temporal variation characteristice of accumulated negative temperature in Qilian Mountains under Climate. Plateau Meteorol. 2017, 36, 1267–1275. (In Chinese) [Google Scholar]
  41. Oliver, M.A.; Webster, R. Kriging: A method of interpolation for geographical information systems. Int. J. Geogr. Inf. Syst. 1990, 4, 313–332. [Google Scholar] [CrossRef]
  42. Li, X.; Jin, R.; Pan, X.; Zhang, T.; Guo, J. Changes in the near-surface soil freeze–thaw cycle on the Qinghai-Tibetan Plateau. Int. J. Appl. Earth. Obs. 2012, 17, 33–42. [Google Scholar] [CrossRef]
  43. Wang, X.; Chen, R.; Liu, G.; Yang, Y.; Song, Y.; Liu, J.; Liu, Z.; Han, C.; Liu, X.; Guo, S.; et al. Spatial distributions and temporal variations of the near-surface soil freeze state across China under climate change. Glob. Planet. Chang. 2018, 172, 150–158. [Google Scholar] [CrossRef]
  44. Liu, X.; Chen, R.; Liu, J.; Wang, X.; Zhang, B.; Han, C.; Liu, G.; Guo, S.; Liu, Z.; Song, Y.; et al. Effects of snow-depth change on spring runoff in cryosphere areas of China. Hydrol. Sci. J. 2019, 64, 1–9. [Google Scholar] [CrossRef]
  45. Xu, F.; Jia, Y.; Peng, H.; Niu, C.; Liu, J. Temperature and precipitation trends and their links with elevation in the Hengduan Mountain region, China. Clim. Res. 2018, 75, 163–180. [Google Scholar] [CrossRef]
  46. Wang, L.; Chen, R.; Han, C.; Wang, X.; Liu, G.; Song, Y.; Yang, Y.; Liu, J.; Liu, Z.; Liu, X.; et al. Change characteristics of precipitation and temperature in the Qilian Mountains and Hexi Oasis, Northwestern China. Environ. Earth. Sci. 2019, 78, 284. [Google Scholar] [CrossRef]
  47. Shah, F.; Xu, J.; Fazli, H.; Anis, U.; Wei, Q.; Cai, S.; Bai, W.; Yousef, A. Spaciotemporal deviation in growing degree days and season under increasing temperature in Heilongjiang province. Pak. J. Agr. Sci. 2019, 56, 1075–1086. [Google Scholar]
  48. Mountain Research Initiative EDW Working Group. Elevation-dependent warming in moutain regions of the word. Nat. Clim. Chang. 2015, 5, 424–430. [Google Scholar] [CrossRef] [Green Version]
  49. Wang, Y. Evolvement of the cumulative temperatures in China loess plateau. J. Glaciol. Geocryol. 2007, 29, 119–125. (In Chinese) [Google Scholar]
  50. Seguinot, J. Spatial and seasonal effects of temperature variability in a positive degree-day glacier surface mass-balance model. J. Glaciol. 2013, 59, 1202–1204. [Google Scholar] [CrossRef] [Green Version]
  51. Li, F. Impact of Climate Change to Water Resource on the Upper Reach of Kaidu River Basin. Master’s Thesis, Lanzhou University, Lanzhou, China, 2017. (In Chinese). [Google Scholar]
Figure 1. Distribution of meteorological stations in western China (black dots). There are 209 stations in and around WC, at elevations between 193 and 5135 m a.s.l. with a mean of 2328 m a.s.l. Data from 188 meteorological stations (blue dots) were used to calculate positive accumulated temperature, and data from 21 (>10% of the total) stations were used to filter the interpolation method.
Atmosphere 12 00443 g001
Figure 2. Distribution of PDD in 209 meteorological stations in western China.
Atmosphere 12 00443 g002
Figure 3. Distribution of interpolated mean annual (a), warm season (b), and cold season PDD (c) from 1960 to 2018 in western China.
Atmosphere 12 00443 g003
Figure 4. Trends and change rates for mean annual (a,d), warm season (b,e), and cold season (c,f) PDD from the 1960s to the 2010s.
Atmosphere 12 00443 g004
Figure 5. Changes in PDD distribution from the 1960s to the 2010s. (a,c,e) are the distribution of annual, warm season and 1960s; (b,d,f) are the corresponding distribution in the 2010s. Colors refer to PDD values from dark blue at segment I for 0 °C to red at segment IX for >7000 °C.
Atmosphere 12 00443 g005
Figure 6. Direction of area transfer for PDD segments from the 1960s to the 2010s. The direction of the arrows indicates the direction of the PDD segment transition, the bar heights indicate the segment area in the 1960s and the 2010s, and the thickness of the arrow indicates the size of the transfer area. Area transfers of less than 0.1 × 10⁴ km2 were omitted. Colors refer to PDD values from dark blue at segment I for 0 °C to red at segment IX for >7000 °C.
Atmosphere 12 00443 g006
Figure 7. Relationships between seasonal and annual change rates for PDD and temperature.
Atmosphere 12 00443 g007
Figure 8. Variation characteristics of temperature and PDD change rate with altitude.
Atmosphere 12 00443 g008
Figure 9. A case study of the relationship between monthly temperature and PDD. PDDed represents the equalized daily average PDD in one month. T0 and T1 are critical temperatures, here, they are just examples, not equal to any values. When monthly temperature T is smaller than T0, PDDed = 0; when monthly temperature T is greater than T1, PDDed = T. When monthly temperature T is between T0 and T1, PDDed and T are related by a nonlinear equation; that equation is PDDed = b1 + b2*T + b3*T2; b1, b2, b3 are the polynomial coefficients and R2 is corresponding regression coefficient. Four colors indicate different meteorological stations.
Atmosphere 12 00443 g009
Table 1. Correlation coefficient R2 for multiple regression equations with positive degree day (PDD) in western China.
R21960s1970s1980s1990s2000s2010s
Annual PDD0.960.960.950.960.960.96
Warm season PDD0.950.950.950.950.950.94
Cold season PDD0.920.920.920.930.930.93
Note: p < 0.01.
Table 2. Results of cross-validation using three interpolation methods. MRE: mean relative error; MAE: mean absolute error; RMSE: root mean square error; OK: ordinary Kriging; IDW: inverse distance weighting.
Time
Segment
MREMAERMSE
OKIDWSPLINEOKIDWSPLINEOKIDWSPLINE
1960s−165−207−2932122143765359110
1970s−181−222−3032212283805663112
1980s−167−211−2842002133775158109
1990s−134−178−2461701813544754104
2000s−28−76−117109103299384191
2010s11−35−1178771299333391
mean−111−155−2271661693484651103
Note: for the MRE, MAE and RMSE, smaller absolute values are desirable.
Table 3. The proportions of land area in the different PDD segments in western China (WC).
PDD SegmentAnnual PDDWarm Season PDDCold Season PDD
I (0 °C)10.6%0.8%44.4%
II (0~1000 °C)26.0%31.5%45.9%
III (1000~2000 °C)14.2%19.6%5.1%
IV (2000~3000 °C)9.2%14.1%4.4%
V (3000~4000 °C)14.9%30.3%0.2%
VI (4000~5000 °C)18.2%3.6%--
VII (5000~6000 °C)3.6%0.1%--
VIII (6000~7000 °C)2.7%----
IX (>7000 °C)0.6%----
Table 4. Time change rates of initial and final dates and duration of PDD from 1960 to 2018.
Significance LevelInitial Date of PDDTerminal Date of PDDDuration
Number of StationsMean CR (Day 10y−1)Number of StationsMean CR (Day 10y−1)Number of StationsMean CR (Day 10y−1)
p < 0.01270.14180.2590.015
p < 0.05490.86440.83191.21
p < 0.1481.65441.40502.17
p > 0.1452.53632.10913.78
NA40 40 40
Sum and Mean2091.412091.392092.82
Note: Stations with no negative daily temperatures during the year could not be tested and were assigned to “NA” (not applicable). Values for “sum and mean” are for all stations. In table the CR means change rate.
Table 5. Changes in percent of area in different PDD segments in WC from the 1960s to the 2010s.
PDD
Segment
Annual PDDWarm Season PDDCold Season PDD
1960s2010s1960s2010s1960s2010s
I12.5%8.2%1.20%0.40%45.3%43.50%
II26.1%25.2%34.20%25.70%45.80%43.30%
III13.2%15.7%17.60%24.40%4.50%8.00%
IV9.2%8.9%14.60%13.00%4.20%4.50%
V15.3%13.3%29.90%29.20%0.20%0.70%
VI17.3%17.0%2.40%7.20%----
VII3.4%7.5%0.10%0.10%----
VIII2.6%3.0%--------
IX0.4%1.2%--------
sum100.0%100.0%100.0%100.0%100.0%100.0%
Publisher’s Note: MDPI stays neutral with regard to jurisdictional claims in published maps and institutional affiliations.