Article

Assessment of the Contribution of Different Particulate Matter Sources on Pollution in Sofia City

1
Department of Meteorology and Geophysics, Faculty of Physics, Sofia University “St. K. Ohridski”, 5 James Bourchier Blvd., 1164 Sofia, Bulgaria
2
National Institute of Geophysics, Geodesy and Geography—Bulgarian Academy of Sciences, Acad. Georgi Bonchev Str., Bl. 3, 1113 Sofia, Bulgaria
*
Author to whom correspondence should be addressed.
Atmosphere 2021, 12(4), 423; https://doi.org/10.3390/atmos12040423
Submission received: 2 March 2021 / Revised: 18 March 2021 / Accepted: 19 March 2021 / Published: 25 March 2021
(This article belongs to the Special Issue Contributions of Aerosol Sources to Health Impacts)

Abstract

:
The habitants of Sofia, the capital city of Bulgaria, are unfortunately exposed to high levels of particulate matter (PM), despite a lot of efforts made by the government and the municipality in recent decades. A high resolution model using the Atmospheric Dispersion Modeling System (ADMS)-Urban was carried out for one year (2014) with elevated levels of PM concentration for the Sofia region measured during the winter. Four main emission sources (point industrial, domestic heating, roads, and unorganized transport) were taken into account for this study. This works intends to evaluate the impacts of different sources on the air pollution and quality of life in Sofia city. Although this type of modeling only accounts for the local sources, and has some deficiency, it can be a very useful tool for estimating the contribution of each source type to the concentration field, and it allows simulating different scenarios for future emission reduction that can help authorities with decision making.

Graphical Abstract

1. Introduction

Air pollution is currently the most important environmental risk to human health, and it is perceived as the second largest environmental concern for Europeans, after climate change [1]. Air contaminants are substances which, when present in the atmosphere in sufficient concentration, may harm human, animal, plant, and microbial health, or damage infrastructures and ecosystems [2]. Significant progress has been achieved in the past 20 years in the European Union (EU) by a dedicated and common policy in the field of anthropogenic atmospheric emissions and air quality, including the “Thematic Strategy on Air Pollution” [3], the National Emission Ceilings Directive (2001/81/EC) [4], and the Directive 2008/50/EC on ambient air quality and cleaner air for Europe [5]. Despite improvements over several decades, air pollution continues to cause substantial impacts to human health, particularly as a significant proportion of Europe’s population live in urban areas, where exceedances of air quality standards regularly occur [6]. Poor air quality-related health conditions, such as respiratory diseases, cardiovascular diseases, asthma and allergy, are considered a very serious problem by European citizens [7]. According to the median aerodynamic diameter, fine particulate matter (PM) can be divided into two categories for air quality regulatory purposes. Emissions from combustion of gasoline, oil, diesel fuel, or wood produce much of the PM, with a diameter of 2.5 μm or less (PM2.5) pollution found in outdoor air, as well as a significant proportion of PM with a diameter of 10 μm or less (PM10). PM10 also includes dust from construction sites, landfills and agriculture, wildfires and bush/waste burning, industrial sources, wind-blown dust from open lands, pollen and fragments of bacteria. PM2.5, as well as ozone (O3), are the most problematic pollutants in terms of human health, followed by benzo(a)pyrene (indicator for polycyclic aromatic hydrocarbons (PAHs); measured as content of PM10) and nitrogen dioxide (NO2). Air pollution is a major cause of premature death and disease and is the single largest environmental health risk in Europe [8]. Estimates of the health impact of exposure to air pollution indicate that long-term exposure to PM2.5 was responsible for approximately 417,000 premature deaths, the estimated impact attributable to the population exposure to NO2 was around 55,000 premature deaths, and exposure to ground-level O3 is estimated to have caused 20,600 premature deaths in Europe in 2018 [6].
Bulgaria was one of the countries with the highest PM10 concentrations in 2009, and, in spite of a considerable decrease was registered over the last decade [6], the air quality continues to be a major problem for the country. Approximately 3.3 million of the population (or 65.1% of total) is living at levels of PM10 pollution above the norms in settlements where this pollutant is measured, and in 9 out of a total of 15 air quality sites, the average annual norm for benzo(a)pyrene was exceeded in 2018 [9]. PM pollution during the winter is most harmful for Bulgarian big cities (e.g., Sofia and Plovdiv), according to the national reports on the state and protection of the environment for 2010–2018, provided by the Executive Environment Agency (ExEA), Ministry of Environment and Water. The main causes of excessive pollution with PM are domestic heating during the winter season, sanding and salting of streets and roads (and the ensuing secondary dispersion from road traffic), and emissions from road and public transport.
The concentration of human activities in cities results in emissions that modify the thermal and chemical composition of the urban atmosphere [2]. The urban living is connected to many busy streets, where crowds intermingle with cars, buses, and motorbikes, each of which injects heat, moisture, noise, and a host of air pollutants into the urban canopy layer. All of this occurs within a street canyon that confines the air flow and restricts the dilution of air pollutants. Contaminated air drifts into adjacent buildings where it lingers longer and affects the comfort and health of occupants [2]. Dense population means high levels of anthropogenic emissions, heat, and stress over the environment and, unfortunately, there is a clear tendency in increasing the number of people living in urban areas over the globe. Today, more than half of the world’s population lives in urban (55%) rather than rural, areas. This distribution is expected to reach 68% by 2050, with one in three people living in cities with at least half a million inhabitants [8]. The increase in urban population is not only common in metropolitan areas like Istanbul, Moscow, Paris, London etc., but also in smaller urban regions. Cities are becoming centers of human activity because people expect to improve the “quality of human life”, but large urbanized regions, on the other hand, are the largest sources of greenhouse gases and air pollutants, and cause changes in the land-use [10]. Relatively small urban areas, such as Sofia, with a population of approximately 1.24 million [11], are not exempt from these migration patterns. The problem with the lack of compulsory address registration, however, makes the city’s management believe that there are between 1.6 and 1.8 million people in the capital, approximately a quarter of the country’s population. Sofia municipality—as a study object—is a challenging complex urban system, because of its geographical setting (complex terrain and favorable meteorological conditions for high pollution) and due to its contrasting modes of urban development combined at the present moment in a rich variety of patterns. The city is settled in a field at the foothills of the steep Vitosha Mountain. Its climate is transitional with influences from several climate zones throughout the seasons. The city general urban form, urban design models, and realized urban morphology are complexly intertwined. Due to the described above reasons the air quality associated with PM pollution in the Sofia municipality was simulated in this work.
Bulgaria has decades of tradition in studying the air quality in both regional and local scales, including development of homemade models [12,13,14,15,16,17,18]. Plenty of work in the field of the regional air quality modeling has been made in Bulgaria in the last two decades, including transboundary pollution between Bulgaria and Greece [19,20,21,22], climate of atmospheric pollution for selected urban environment [23,24,25,26,27,28], study the specifics of air pollution in the Sofia valley [12,13,29,30,31]. Many studies for development and support of the Bulgarian Chemical Weather System [31,32,33,34,35,36,37,38,39], assessment of the contribution of different types of pollutants and different categories of sources [40] have also been published. Most of the more recent publications are based on the Weather Research and Forecasting (WRF) [41] model, which is managed by the USA National Center for Atmospheric Research, and the Community Multiscale Air Quality Modeling System (CMAQ) [42], which is supported by the USA Environmental Protection Agency. Advantages of these models include their ability to use temporally and spatially varying meteorology and to model chemical reactions, but due to used parameterizations of physical processes however, these models have restrictions of grid resolution (the finest is usually 1 km).
In spite of decades of study in Bulgaria on air quality at different scales, the contribution of physical environment on pollution in urban areas is not specifically investigated. Only one study presents modeling of NOx distribution from transport for small residential area in Sofia using Lagrangian particle dispersion model [43]. The physical environment plays a very significant role in urban areas, and this part is commensurate with the role of anthropogenic emissions and weather. Using detailed spatial depiction of urban infrastructure (e.g., roads, buildings, parking spaces, industrial and housing areas) in three-dimensional (3D) maps can affect significantly the air pollution modeling, provide detailed structure and help to define “hot spots” of pollution, and ensure valuable tools for the city planners to build sustainable environment in the future projects for urban development. We exploited the Atmospheric Dispersion Modeling System (ADMS-Urban) [44] which is a city-scale model that resolves concentration fields explicitly representing the near-field features of the dispersion of emissions with very high resolution (50 m in this work). Numerical simulations were performed for the Sofia municipality for a duration of one year (2014). This year is characterized by elevated levels of PM concentration for the region during the winter. Four main emission sources (point industrial, domestic heating, roads, and unorganized transport) were taken into account for this study.
The goals of this paper are to (i) evaluate ADMS-Urban and asses the model abilities to represent the pollution pattern in Sofia field surrounded by complex terrain and (ii) to estimate the impacts of different sources on the air quality and quality of life in Sofia city. The experimental design and methodology are described in Section 2. Section 3 presents results from numerical simulations and model validation, followed by contribution of the different types of sources to the modeled concentration fields for cold and warm seasons. An overall discussion is presented in Section 4, and the conclusions are in Section 5.

2. Experimental Design and Methodology

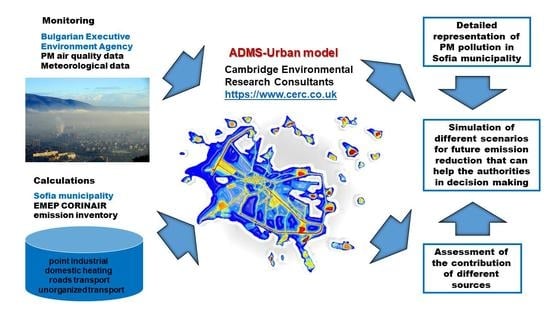
2.1. ADMS-Urban System

ADMS-Urban is a comprehensive system for modeling air quality and it is being used across the world for air quality management and assessment studies of complex situations in urban areas, cities, towns and close to motorways, roads and large industrial areas [45,46,47]. This model is applied to study the air pollution in local scales for first time in Bulgaria. The local Gaussian type model with an integrated street canyon model is nested within a trajectory model so that significant areas may be considered. ADMS-Urban is significantly more advanced than most of the other air Gaussian type dispersion models, in that it incorporates the latest understanding of the boundary layer structure, using advanced algorithms for the height-dependence of wind speed, turbulence, and stability to produce improved predictions. The model also takes into account the impacts of street canyons on dispersion, turbulence, and mixing induced by traffic, and includes a photochemical model for NOx and O3. Predicting pollutant concentrations in an urban area is a complex modeling problem. ADMS-Urban has been developed with a number of features to simplify the modeling process and help users.

2.2. Model Set-Up

The domain in this study covers Sofia city and suburbs, approximately 38 by 32 km, with grid resolution of 50 m (Figure 1a–d). Spatial data used by the model should be in a Cartesian coordinate system measured in meters in one of the available geographic projections. Different number of vertical levels can be exploited, but high number increases the computational time significantly. We used only two levels for this study as we investigate only concentration in the surface boundary layer. All different types of sources—point (industrial stacks), roads, domestic heating, and unorganized transport are mapped into the selected domain.
ADMS-Urban allows a lot of additional options that we applied in this study. The urban sprawl in Sofia has covered agricultural and green city hinterlands in the Sofia field and reached the foothills of Vitosha Mountain and the Stara Planina Mountain. This complex topography (Figure 1) affects the pollution transport and this effect is modeled by changing the plume trajectory and dispersion to account for disturbances in Monin–Obukhov length. Turbulence is considered using three sets corresponding to unstable (convective), near neutral and stable conditions, based on Monin–Obukhov length and corresponding to different diffusivity coefficients. Loss of the airborne concentration of pollutant occurs by dry and wet deposition. Wet deposition was not applied in this study as there was no hourly precipitation data available. The plume rise module predicts the trajectory, enhanced spread and inversion penetration of a buoyant jet or plume, given the conditions at the source and in the external environment. This module was applied to the industrial point sources requiring additional data for the temperature, flow velocity and geometry of the stack (height and diameter). The basic street canyon module was used for the road sources, which required additional information, such as the coordinates of each road segment and averaged parameters for road width and canyon height. Only primary pollutants were modeled; chemical reactions were not included in this study.

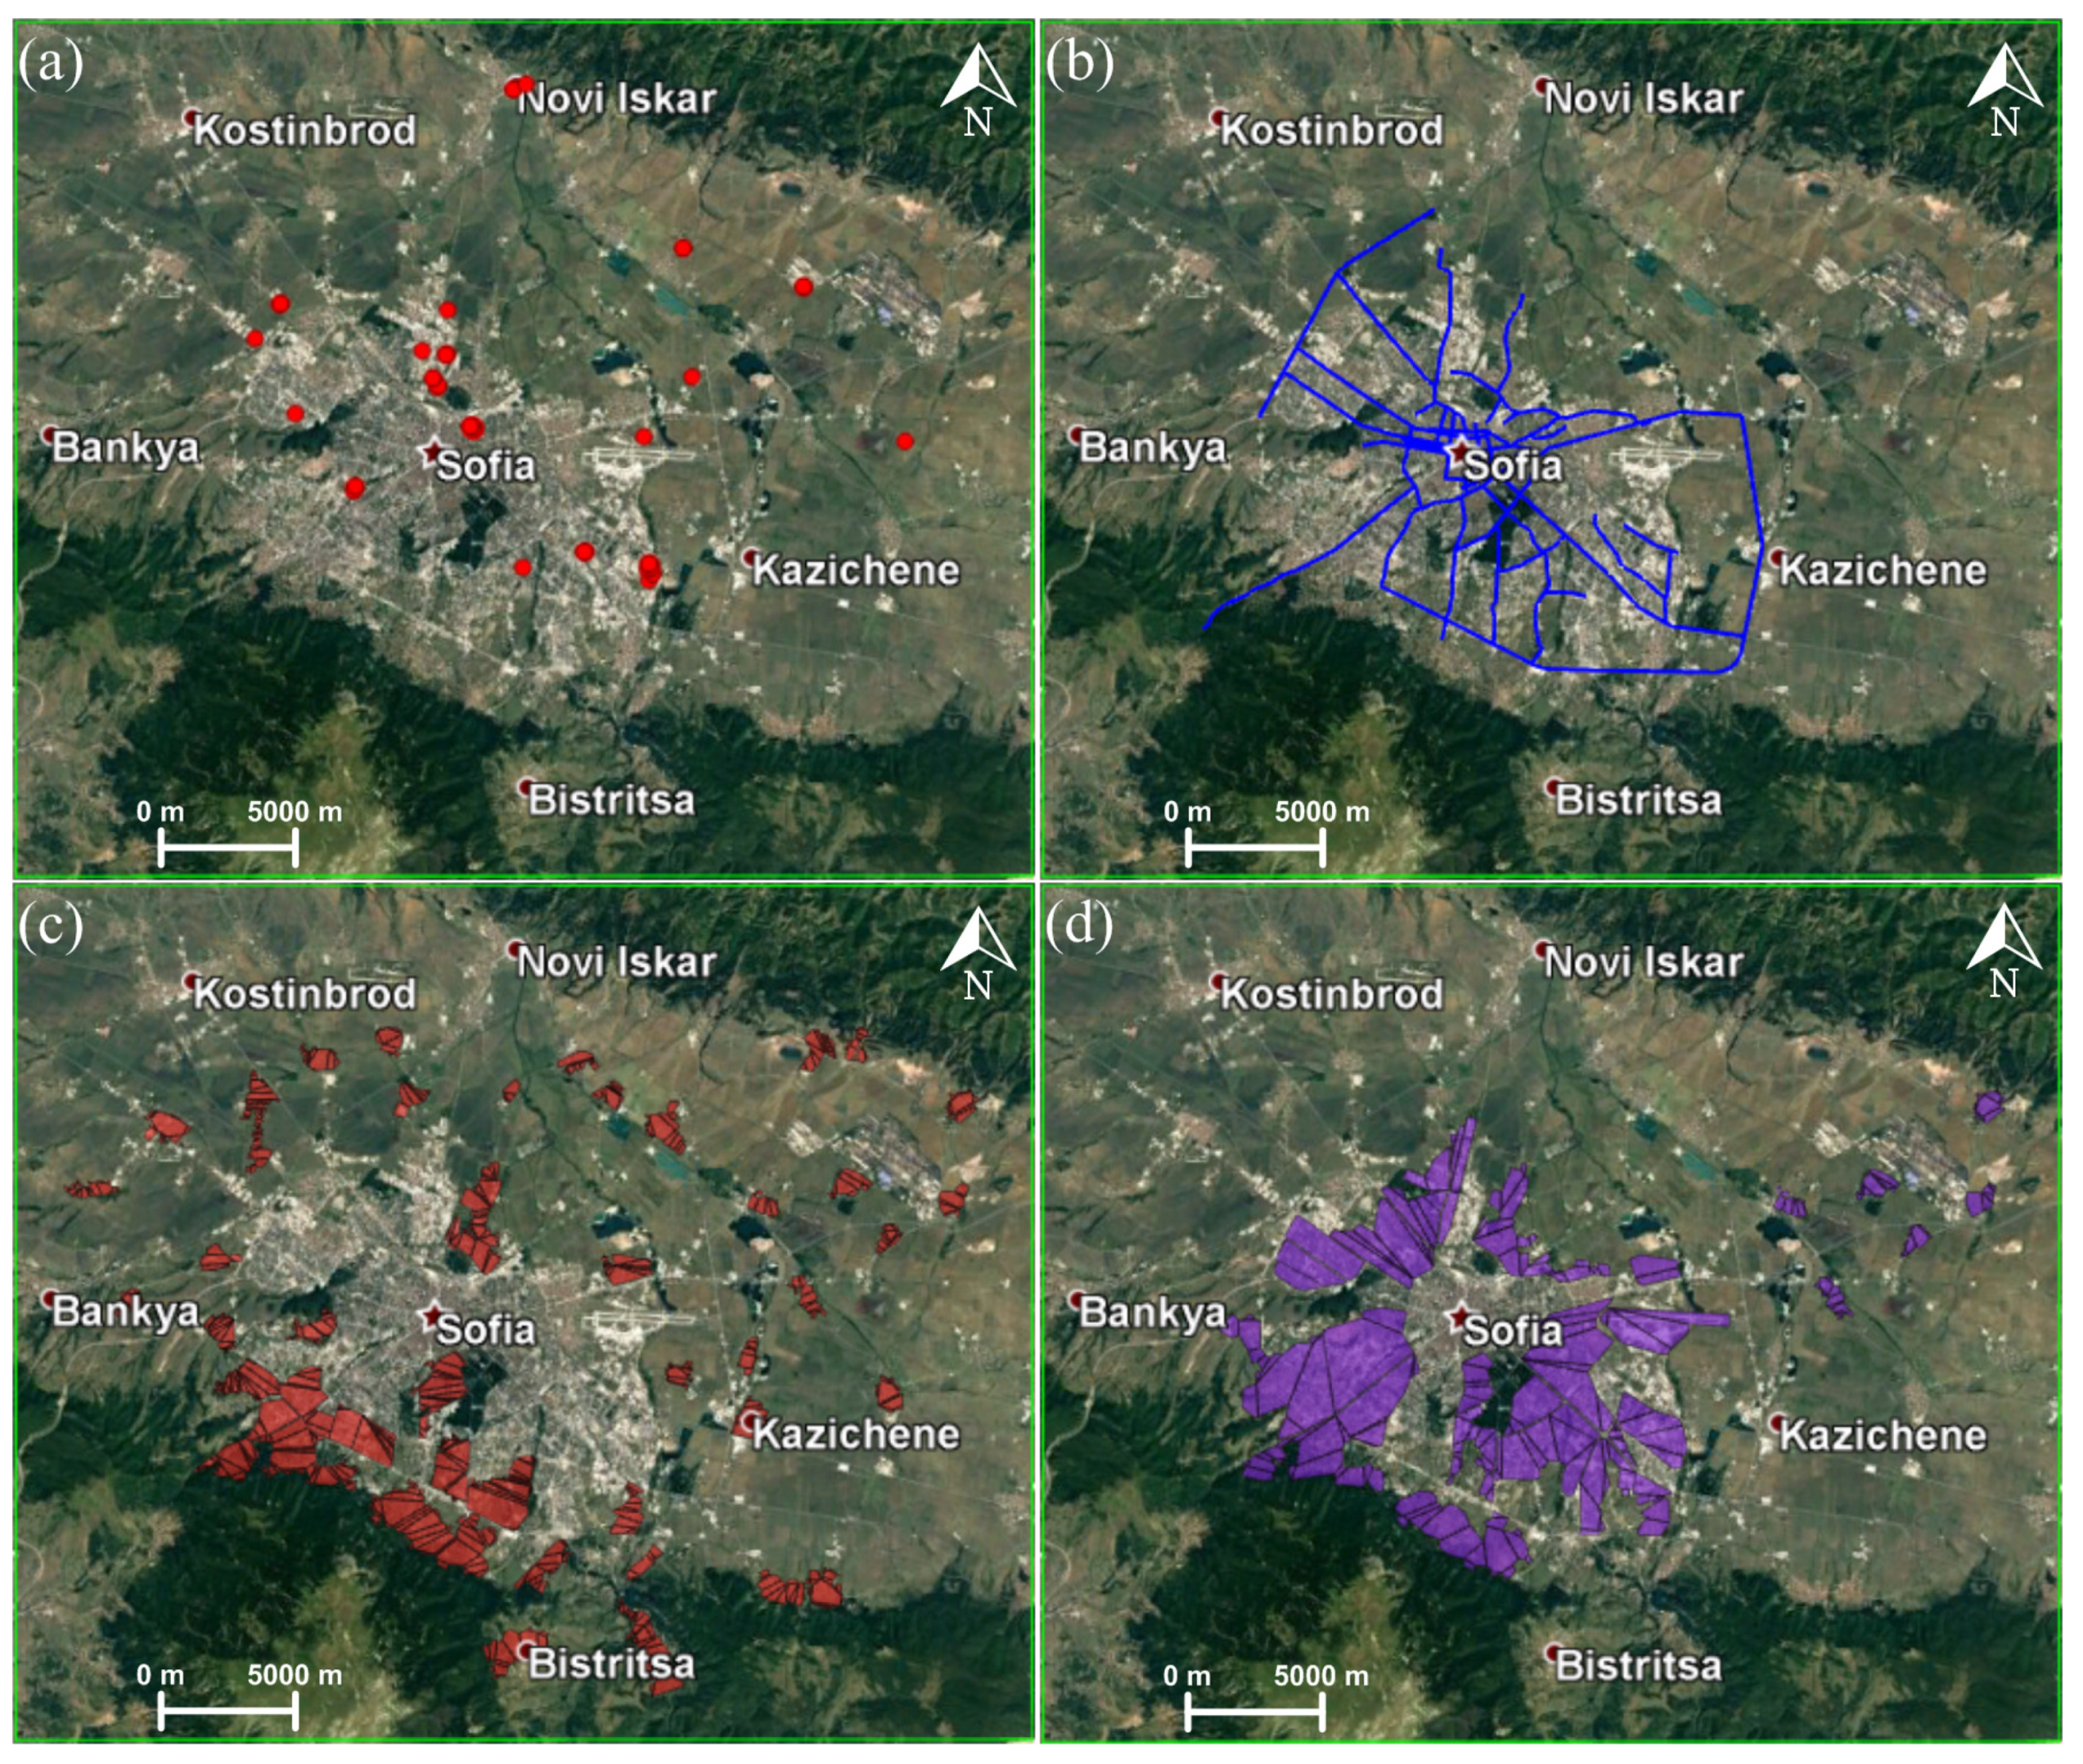
2.3. Emission Inventory
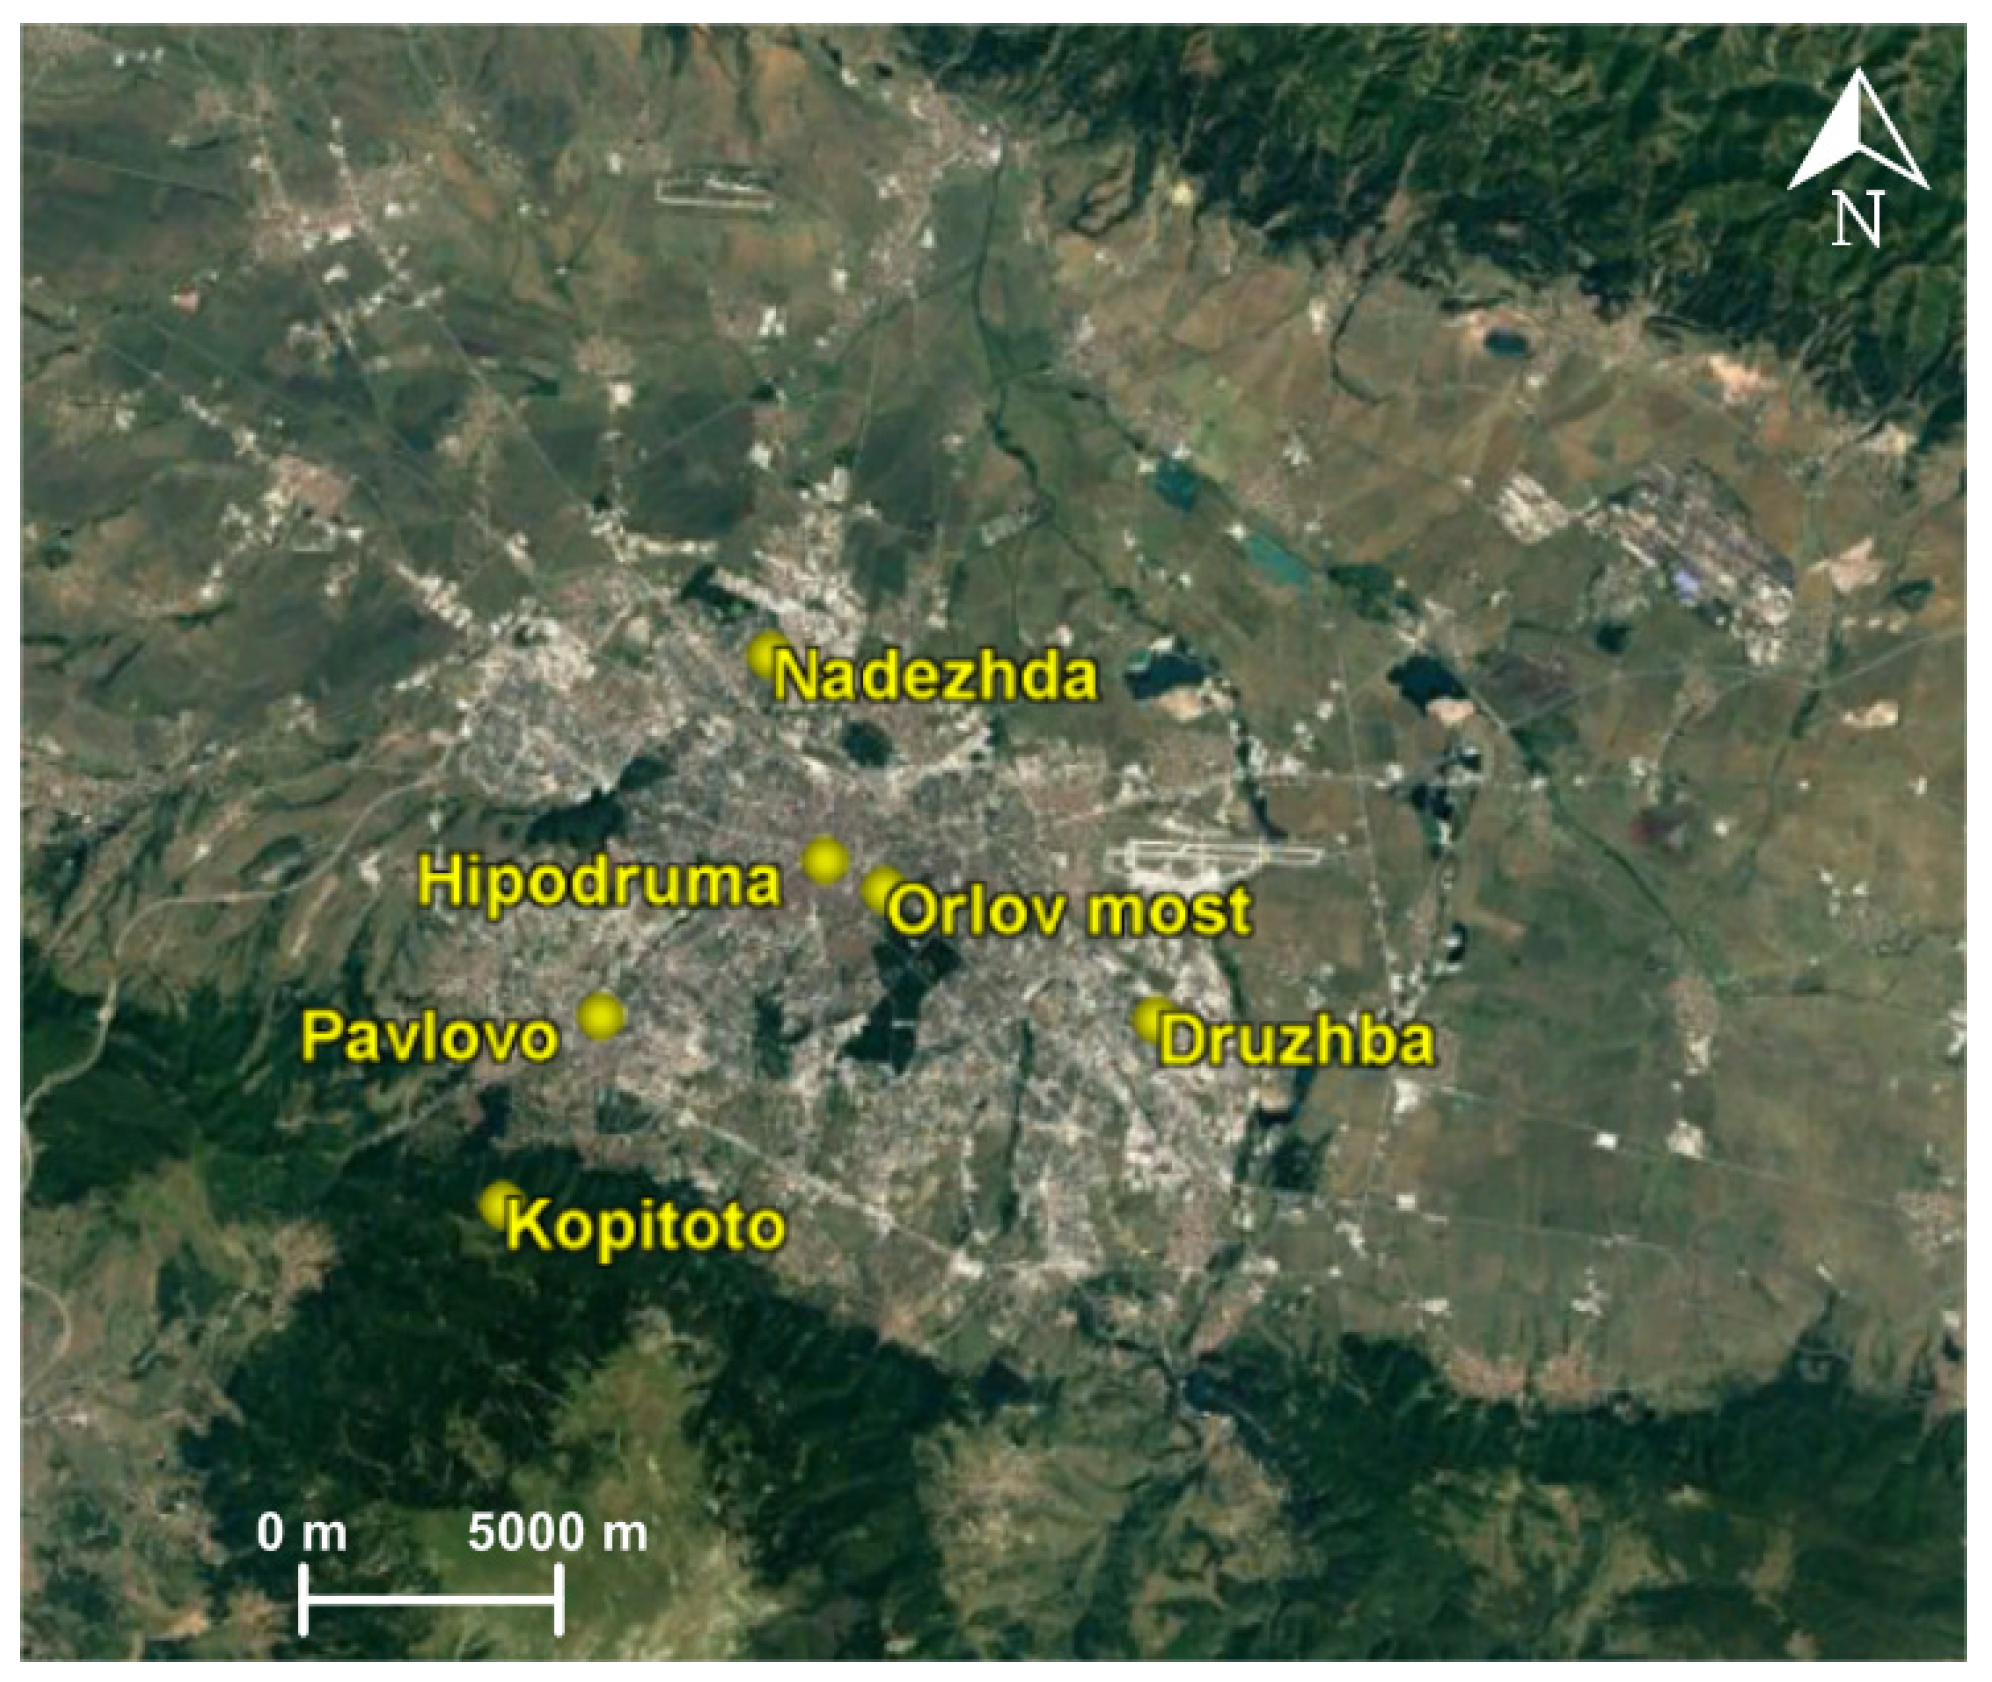
The used in this study detailed emission inventory is developed under the Program for management of air quality of the Sofia municipality for the period of 2015–2020, published and described in details within two reports—for reduction of the emissions and achieving the established air quality standards for particulate matter PM10 [48] and the supplemental program for PM2.5 and PAH [49]. For PM2.5 and PAH there are additional domestic heating sources, which are not included for PM10, thus we should not directly compare the concentration fields of PM10 and PM2.5. The sources and emissions from construction and depots and quarries are not included in the simulations, because their contribution to the concentrations of the considered in this study aerosols is very low (below 1%), which was determined by the calculations made beforehand. The domestic heating sources are modeled only for the cold season (January–March, November–December), because for the rest of the year, their contribution should be insignificant. The emissions required very detailed shape description for line and area sources, while point sources are defined by their geographical coordinates transferred in the study domain. All sources were described into details and are presented in Figure 1a–d together with location of Sofia city and surrounding towns and villages.

2.4. Observations

The base meteorological year for the simulations for each of the pollutants is 2014, in order to achieve a complex image of air quality for Sofia city and the surrounding area. The year 2014 was selected based on 10-years of record of hourly concentrations of PM taken from the official air quality network (ExEA, http://eea.government.bg/kav/; accessed on 23 March 2021), for the automatic air quality stations (AQSs) located in Sofia (Druzhba, Nadezhda, Pavlovo, Hipodruma, Orlov most). Three of these AQSs are suburban background stations (Druzhba, Nadezhda, Hipodruma), two of them traffic AQSs (Pavlovo, Orlov most). The mountain AQS Kopitoto, located near Sofia, is a background station. The map with locations of different observational sites is shown in Figure 2.

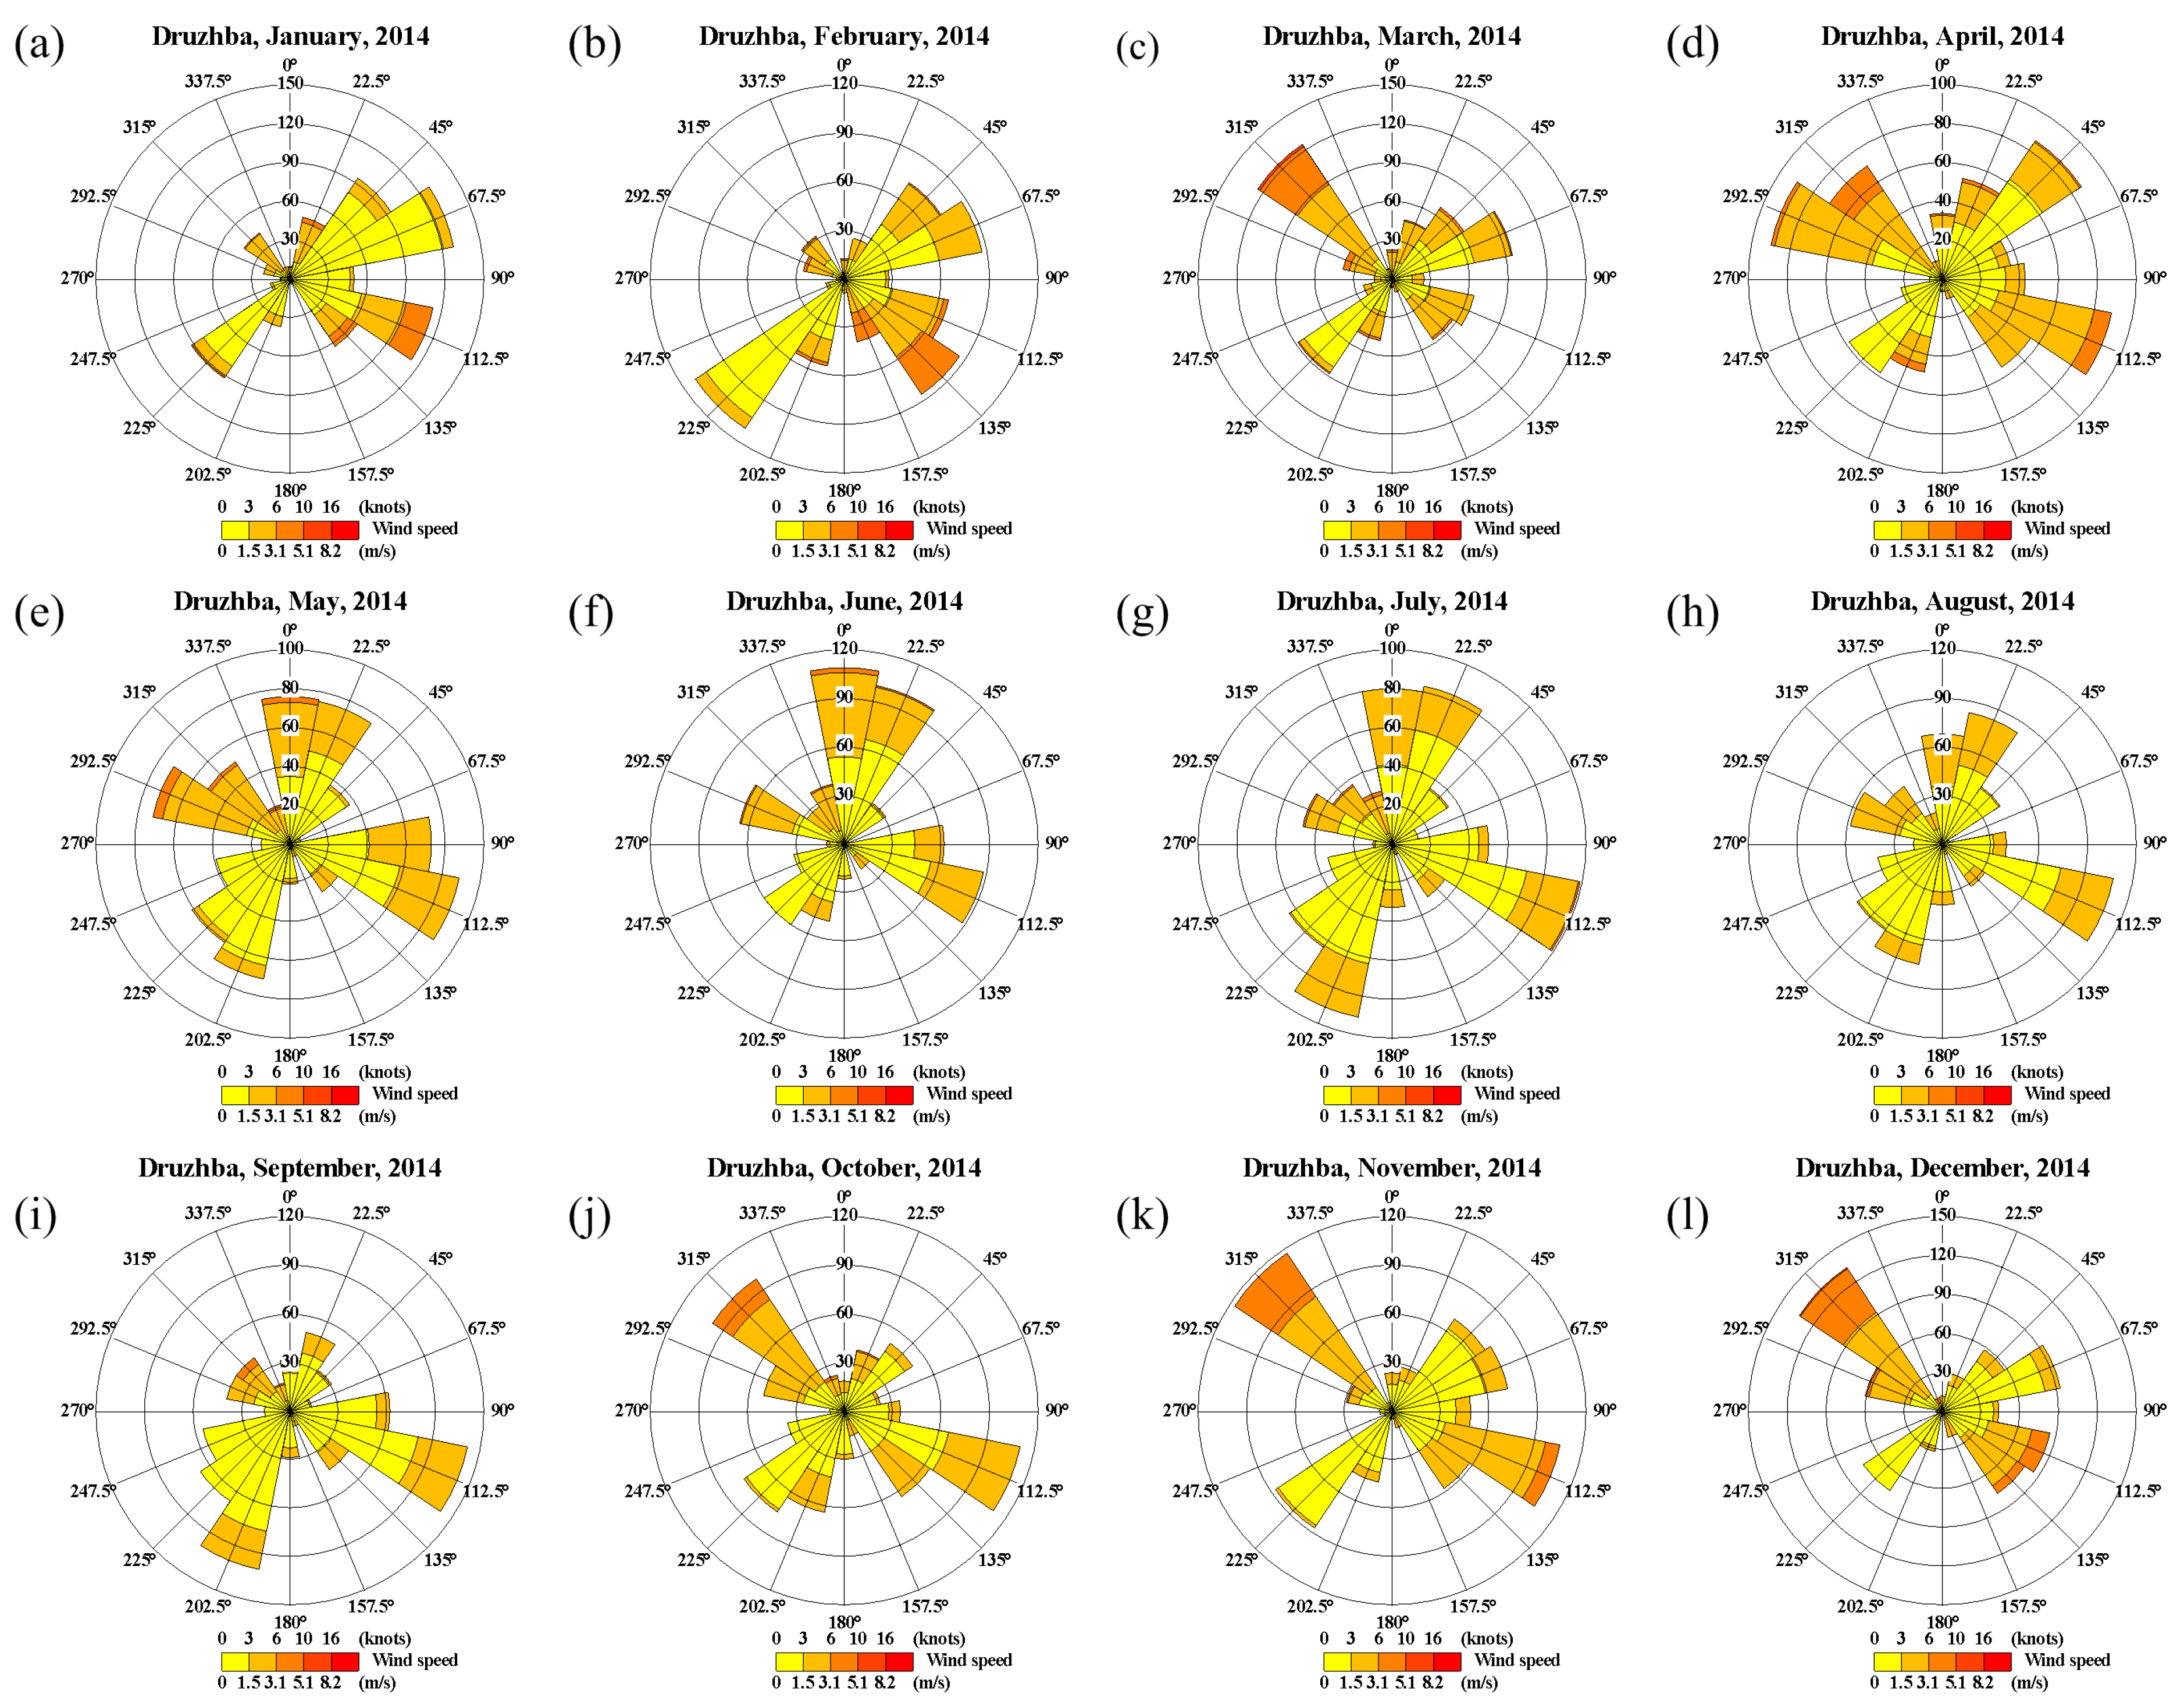
2.5. Meteorological Input

The meteorological conditions (measured also automatically at each site) were prescribed from AQS Druzhba, as it consists full record of hourly data with a few missing records only, which were reconstructed based on interpolation method integrated into the model, taking the available values from the nearest hours. The meteorological variables used in this study are hourly data for wind speed (minimum 0.75 m s−1 is required) and direction, temperature, and incoming solar radiation. The wind roses for different months of 2014 are shown in Figure 3. ADMS-Urban was run daily providing 24-h average concentration outputs for the entire domain and prescribed locations, corresponding to the measurement sites. There is a great diversity in the prevalent wind direction and speed between different months that affect significantly the pollution field. During the spring (March, April) and autumn (October–December) the northwesterly flow is predominant. During the summer variety of synoptic conditions were observed with the highest contribution of the north to northeasterly and southeasterly flows.

3. Results

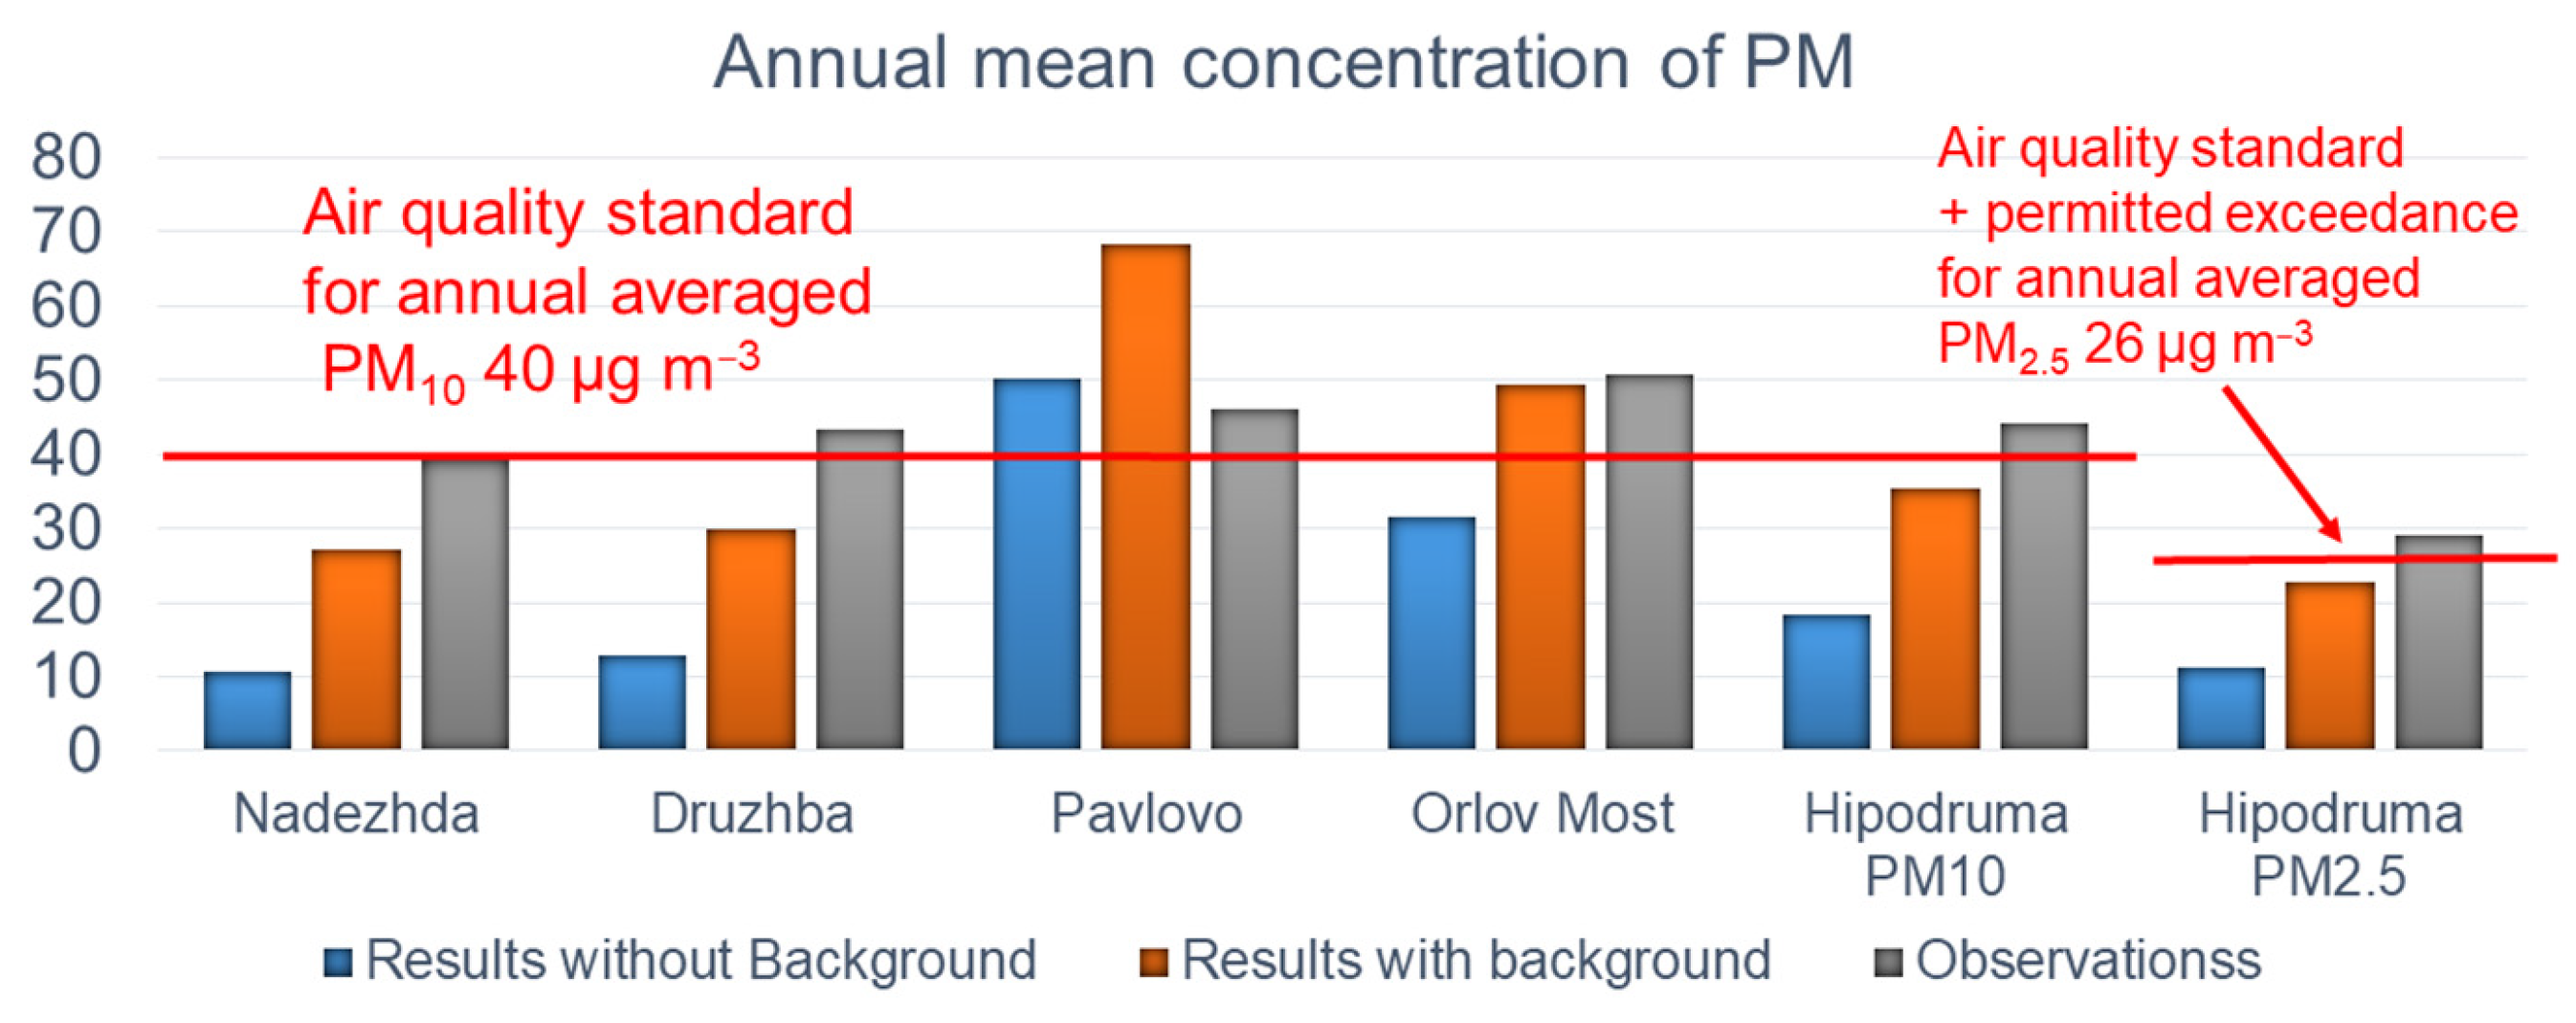
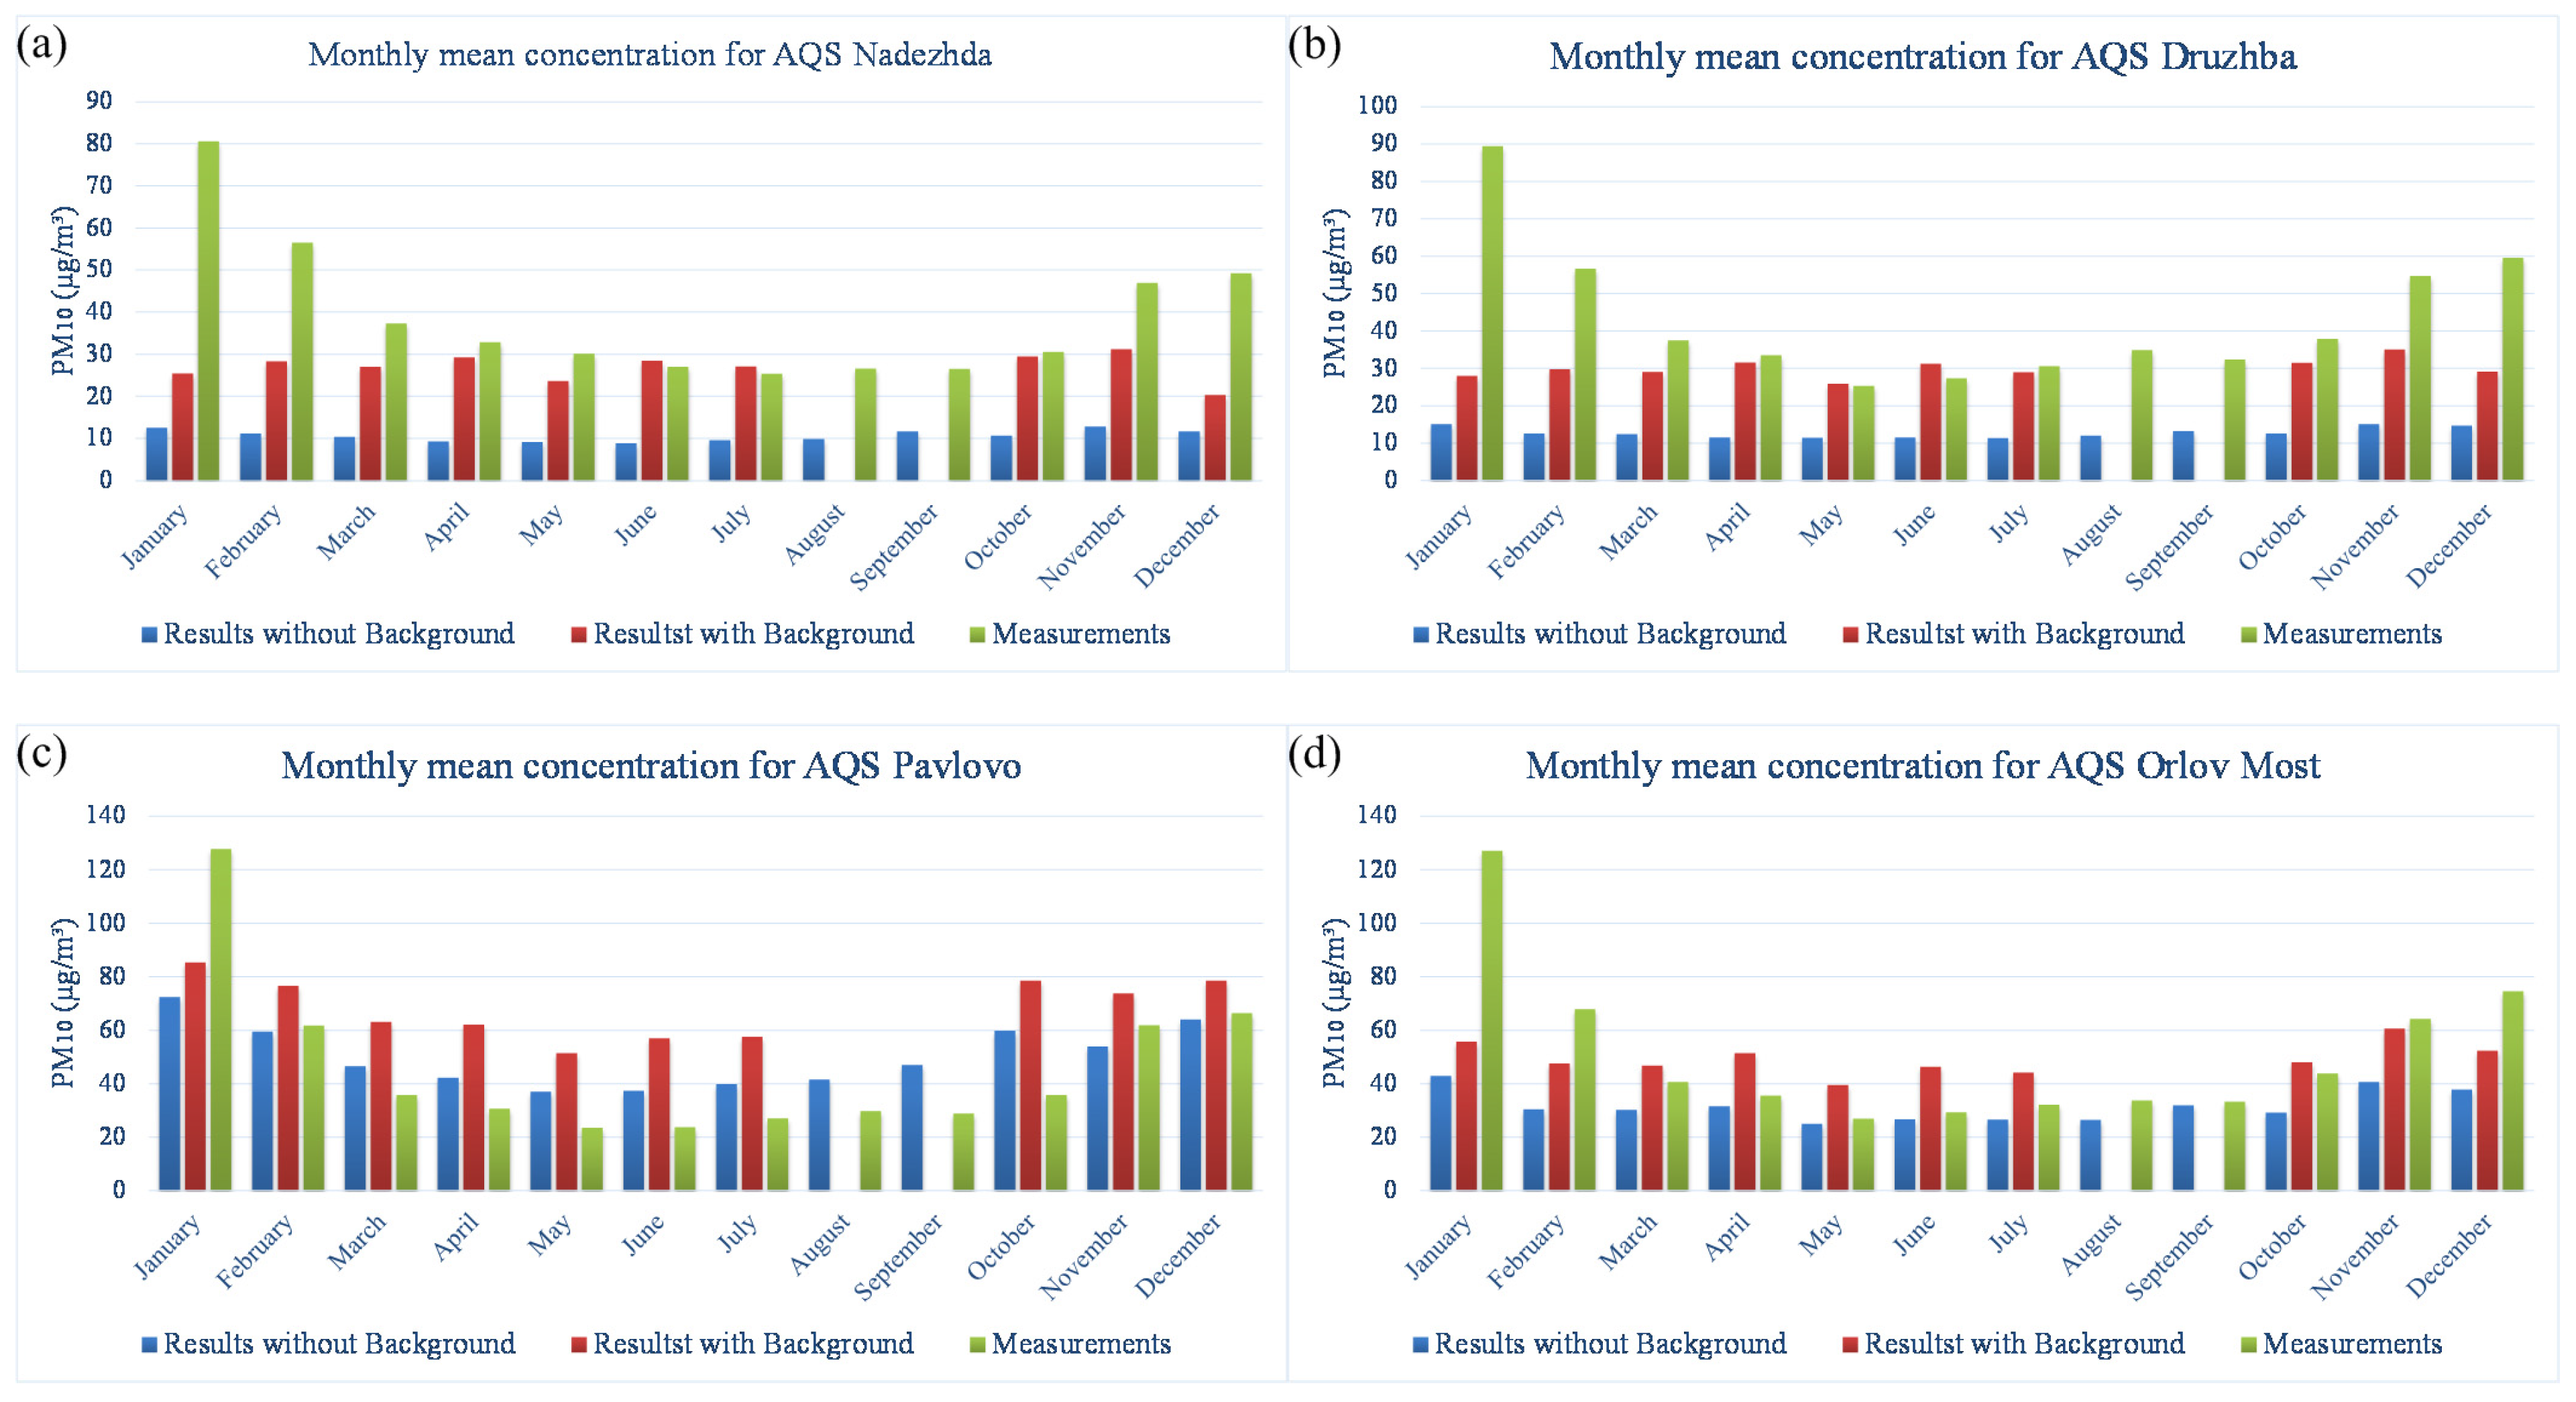
3.1. Model Validation

Model validation was performed for all observational sites with all available data—four with measurements for PM10 and one for PM2.5. There are no observations for PAH from the AQSs, only handmade measurements are available with a lot of missing data, and due to this reason validation is not presented for this pollutant. Additional receptor points were added at the geographical locations of the measurement sites and compared with simulated values. Figure 4 presents annual averaged values, monthly averaged values are presented in the Appendix A (Figure A1). As only the local sources are considered and simulated, the background concentration was added from the measurements at the high mountain station, AQS Kopitoto.
The measured concentrations at all sites were above the annual averaged air quality standards 40 µg m−3 for PM10 and 26 µg m−3 (the standard with permitted exceedance for 2014) for PM2.5. Simulated concentrations with added background concentration are below observed values for all suburban background AQSs (Druzhba, Nadezhda, Hipodruma), in agreement with measurements at Orlov most traffic AQS at Sofia city center, and significantly overestimate values at Pavlovo traffic AQS, located in the western part of the city in Vitosha Mountain foothills. During the months January–March, and November–December, named as a cold season, the model simulations underestimate the measured values even with added background concentration, which has a very high contribution, for the suburban background stations Druzhba, Nadezhda, and Hipodruma (see the Appendix A, Figure A1). Most likely, the reason is inaccurate estimation of the domestic heating emissions during the cold half of the year. The domestic heating emissions usually are calculated with high uncertainties due to lack of necessary information and detailed description of spatial and temporal representation. During the warm season the suburban background sites are in agreement with measurements with added background concentration that clearly indicates the effect of pollution transport from the settlements surrounding the city to the residential areas in the outskirts of the city. At both traffic sites, simulated concentration is closer to measurements without considering background concentration. The Orlov Most and Pavlovo stations are located in close proximity to boulevards with heavy traffic. These stations are affected mainly by the local road source and less by the background concentration, which is clearly visible from the plots with monthly average validation, presented in the Appendix A (Figure A1). The simulated concentrations (with added background) are in good agreement with observations in the central city area for the annual averaged (Orlov Most), but significantly overestimate observations at Pavlovo. Most likely, the reason is that the used meteorology is not representative for this station. The flow is significantly modified by the Vitosha Mountain and the plume trajectory, calculated by the model using the option for complex orography, was not able to capture realistically the pattern of the pollution advection and dispersion.
Standard statistical measures such as mean bias (MB), mean errors (ME) and root mean squared error (RMSE) are presented in Table 1. The indexes of agreement (IA) parameter developed by Willmott [50] was also calculated. It is a standardized method to determine the degree of the model prediction error (see Equation (1))
I A = 1 i = 1 N P i O i 2 i = 1 N P i O ¯ + O i O ¯ 2
where P i and O i are the predicted and observed values, respectively, and O ¯ is the mean observed value. The IA values range between zero and 1, with 1 indicating a perfect match. In addition mean values and standard deviation (SD) are shown in Table 2.
The higher disagreement with observations appears during the cold season with ME approximately 30% and high values for RMSE at all stations. The IA is very low (except for Pavlovo station) confirming a problem most likely due to the domestic heating emissions or not well represented meteorological conditions. Very high values were measured in all stations, and the period corresponds to negative temperatures, high relative humidity of 99% and low values of radiation, which is an indicator of the existence of fog during these days. This result unequivocally shows the need of using additional data on meteorological parameters, preferably from numerical models, to allow a more realistic description of this type of situations by entering information about the height of the atmospheric boundary layer, the scale of Monin-Obukhov (involved in the description of turbulent processes) and humidity. Moreover, the mathematical formulation of the Gaussian models, does not allow operation at very low values of wind speed (as this period is). The model requires 0.75 m s−1 for all wind values less than this value. The period under discussion corresponds to calm conditions, and wind input leads to dispersion and notable reduction of concentration.
The MB, ME and RMSE calculated for the warm season are low (except for Pavlovo station) with IA above 0.7. The best agreement is achieved for Nadezhda and Druzhba sites with IA 0.9 and 0.89. Disagreement with observations during the warm season at Pavlovo site reinforces the above statement that the used meteorology is not representative for this station.
The mean observational values are underestimated for the annual averaged and cold season at all sites except Pavlovo, where it is slightly overestimated. During the warm season the modeling results show similar concentrations at suburban background sites Nadezhda and Druzhba and higher values for sites located near the roads with heavy traffic—Pavlovo, Orlov most and Hipodruma. SD is several times higher for the observations compared to the model results, with more significant variations in the mean value at traffic sites Pavlovo and Orlov most.

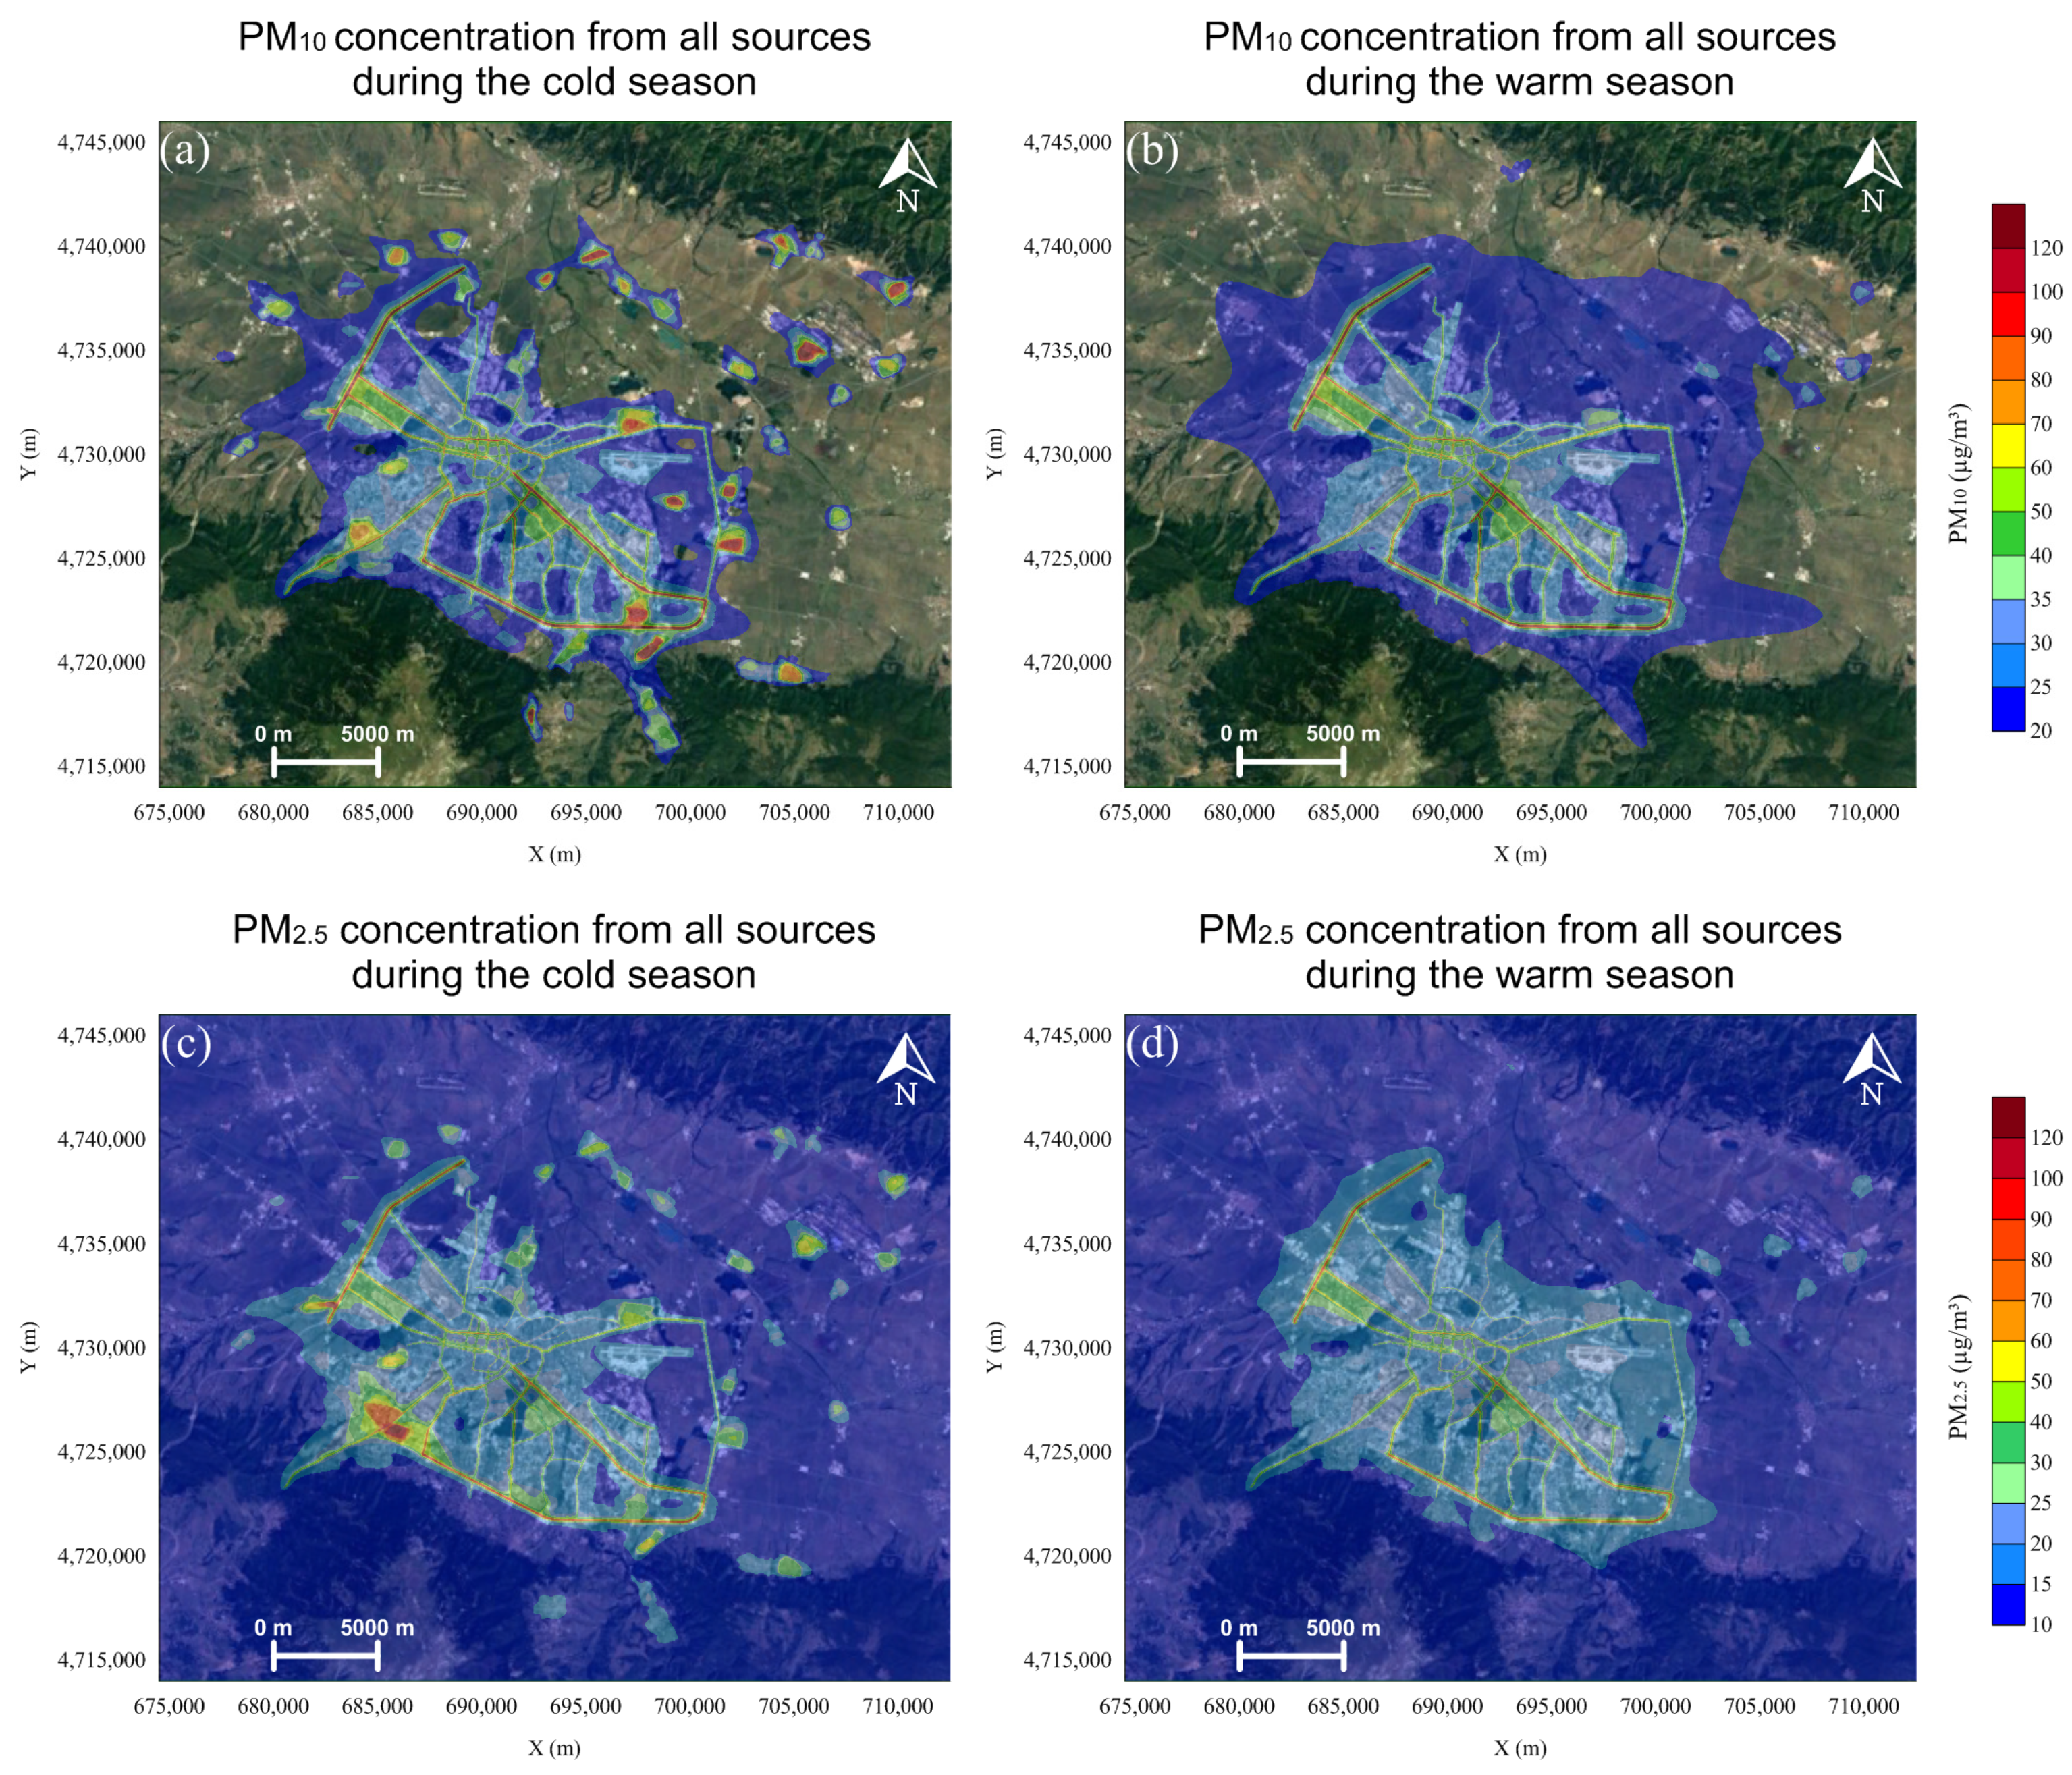
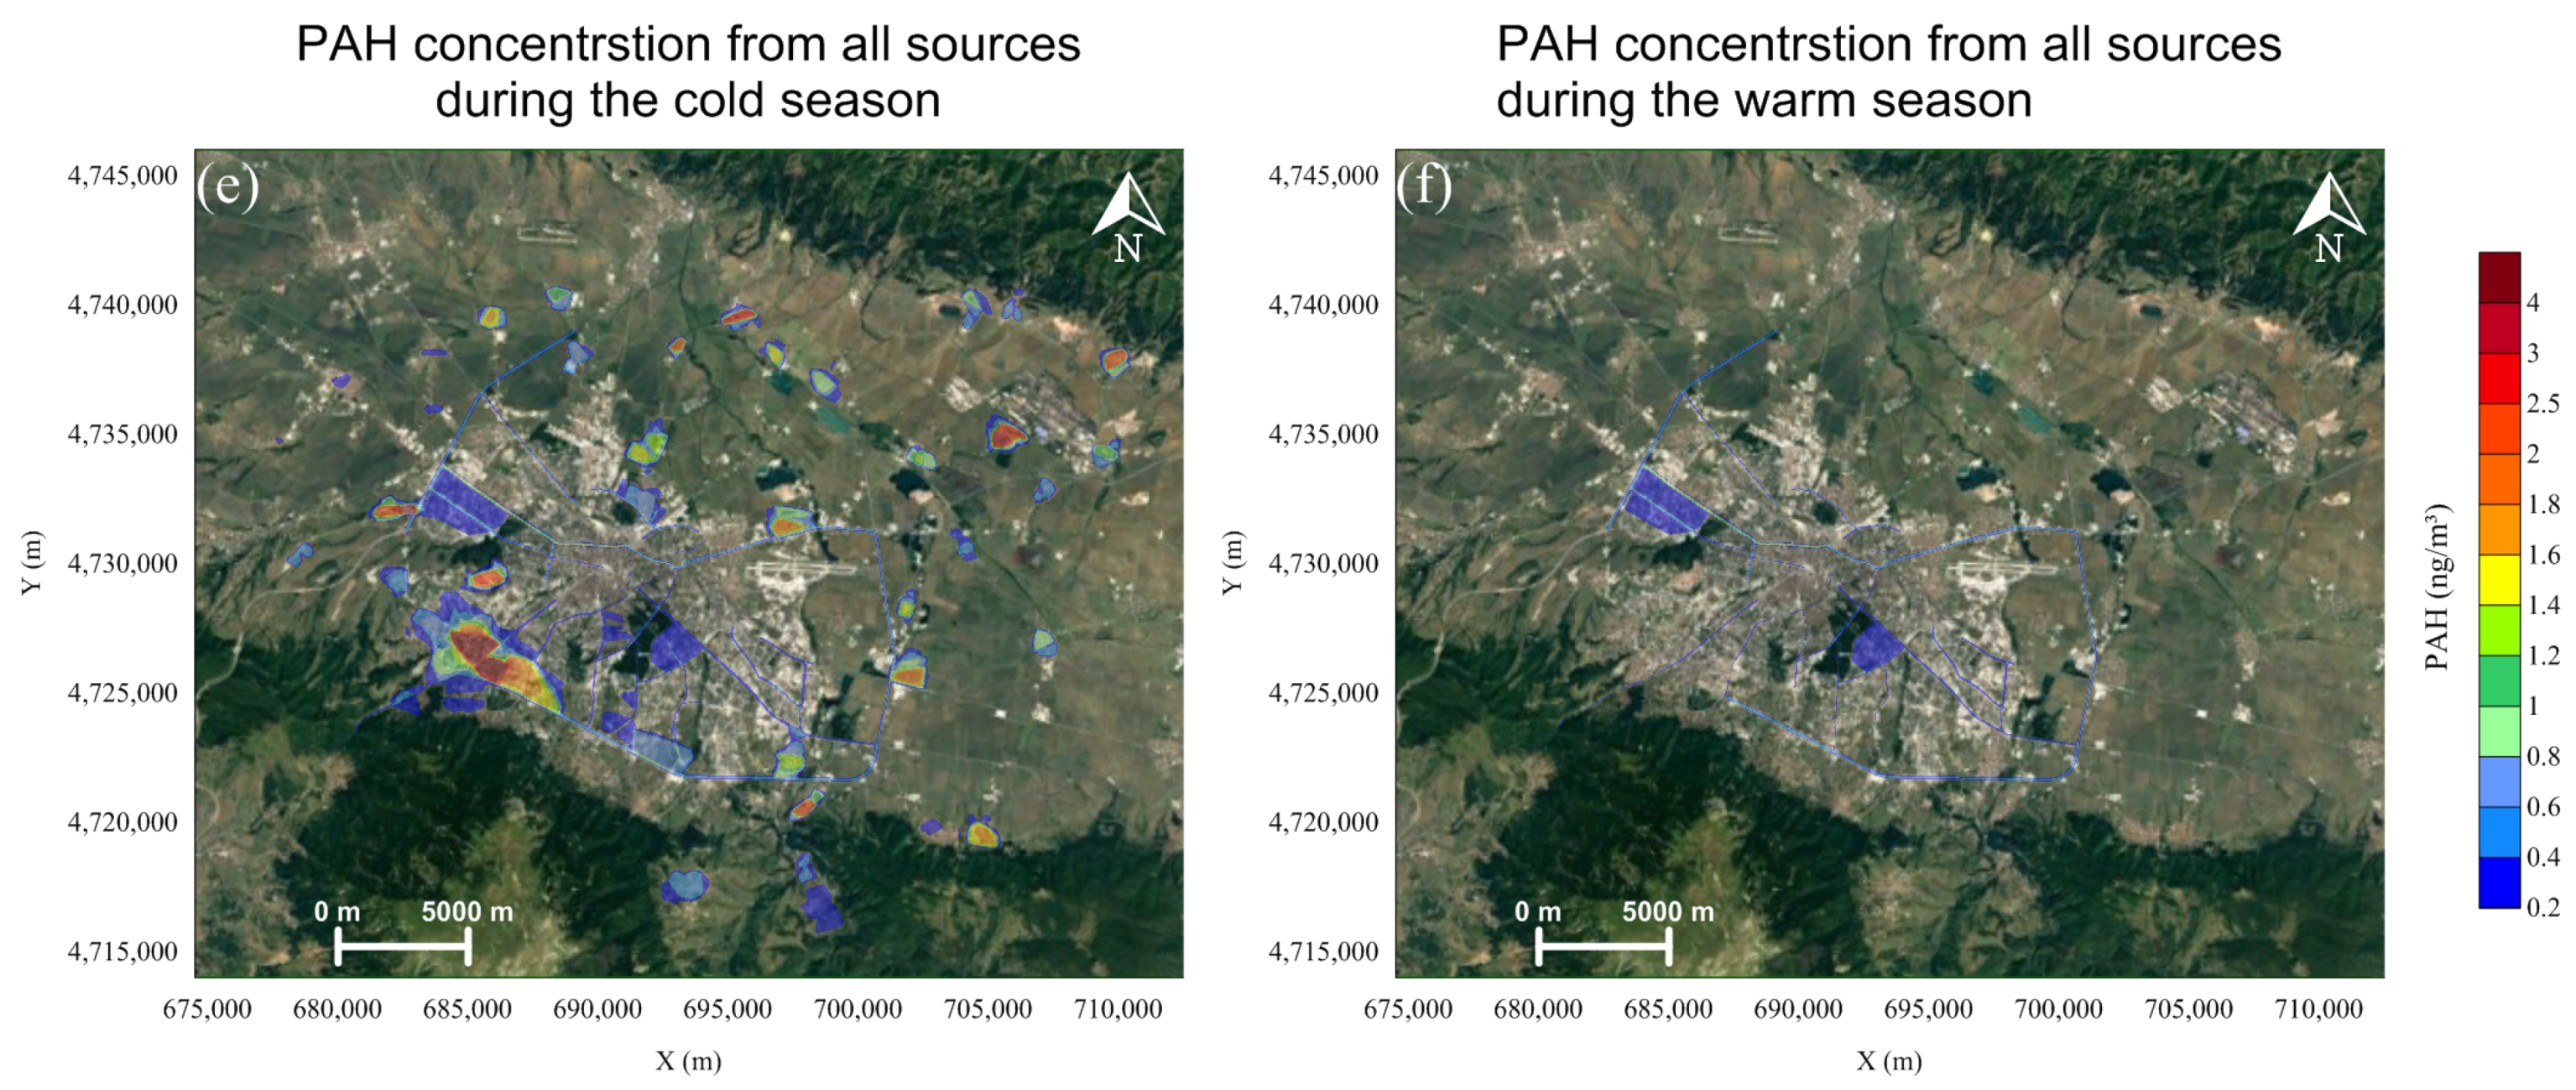
3.2. Ground Concentration Fields of Different Pollutants

The ground concentration fields are shown in Figure 5 for all considered in this study pollutants. The plots show the averaged concentration from all sources with added background concentration. They are presented separately for the cold and warm seasons, as the effect of the domestic heating is affecting only the cold season. Analysis of the plots for PM10 and PM2.5 shows that concentrations are elevated around the main boulevards (the city ring road, Tsarigradsko Shose, Slivnitca, Todor Aleksandrov, Tsar Boris III, Bulgaria, Peyo K. Yavorov, and Simeonovsko Shose) during the entire year. The concentrations exceed 90 µg m−3 which is more than double the annual air quality standard related to the human health 40 µg m−3 for PM10 and more than three times above the target value of 26 µg m−3 (the standard + permitted exceedance in 2014) for PM2.5. Traffic from the small roads (unorganized transport) within big residential areas Lyulin, Iztok, and Dianabat add additional pollution and concentrations there are above the annual air quality standards for PM10 and PM2.5.
Domestic heating using burning of wood and fossil fuels, adds significant stress to the environment during the cold season, forming areas with very high concentration (above 120 µg m−3). Additional “hot spots” appear mostly in some of the settlements located around Sofia city and in many suburbs, such as Gorublyane, German, Kazichene, Busmantsi, and Krivina in the eastern part of the urbanized region; Benkovski, Orlandovtsi, Vrazhdebna, and Trebich in the northern part of the city; Bakston, Ovcha kupel, Manastirski livadi, Krasna Polyana, and Filipovtsi in the southwestern part of Sofia.
The PAH air pollution is mainly due to the domestic heating and simulated concentrations exceed up to four times the annual air quality standard of 1 ng m−3 during the cold season for the same settlements and suburbs, described above, considering PM10 and PM2.5 fields, as PAH is measured as content of PM10. The difference in concentration fields of PM10 and PM2.5/PAH is caused by the additional domestic heating sources, which were added to the updated emission inventory used for PM2.5/PAH, as was described in paragraph 2.3.

3.3. Contribution of Different Sources to Ground Concentration Field

An assessment was made of the contribution (represented as a percentage) of each type of sources to the total concentration field for the cold and warm seasons. Maps of the contribution of transport (roads and unorganized), point sources, and domestic heating for the considered three types of pollutants are shown in this sub-chapter.

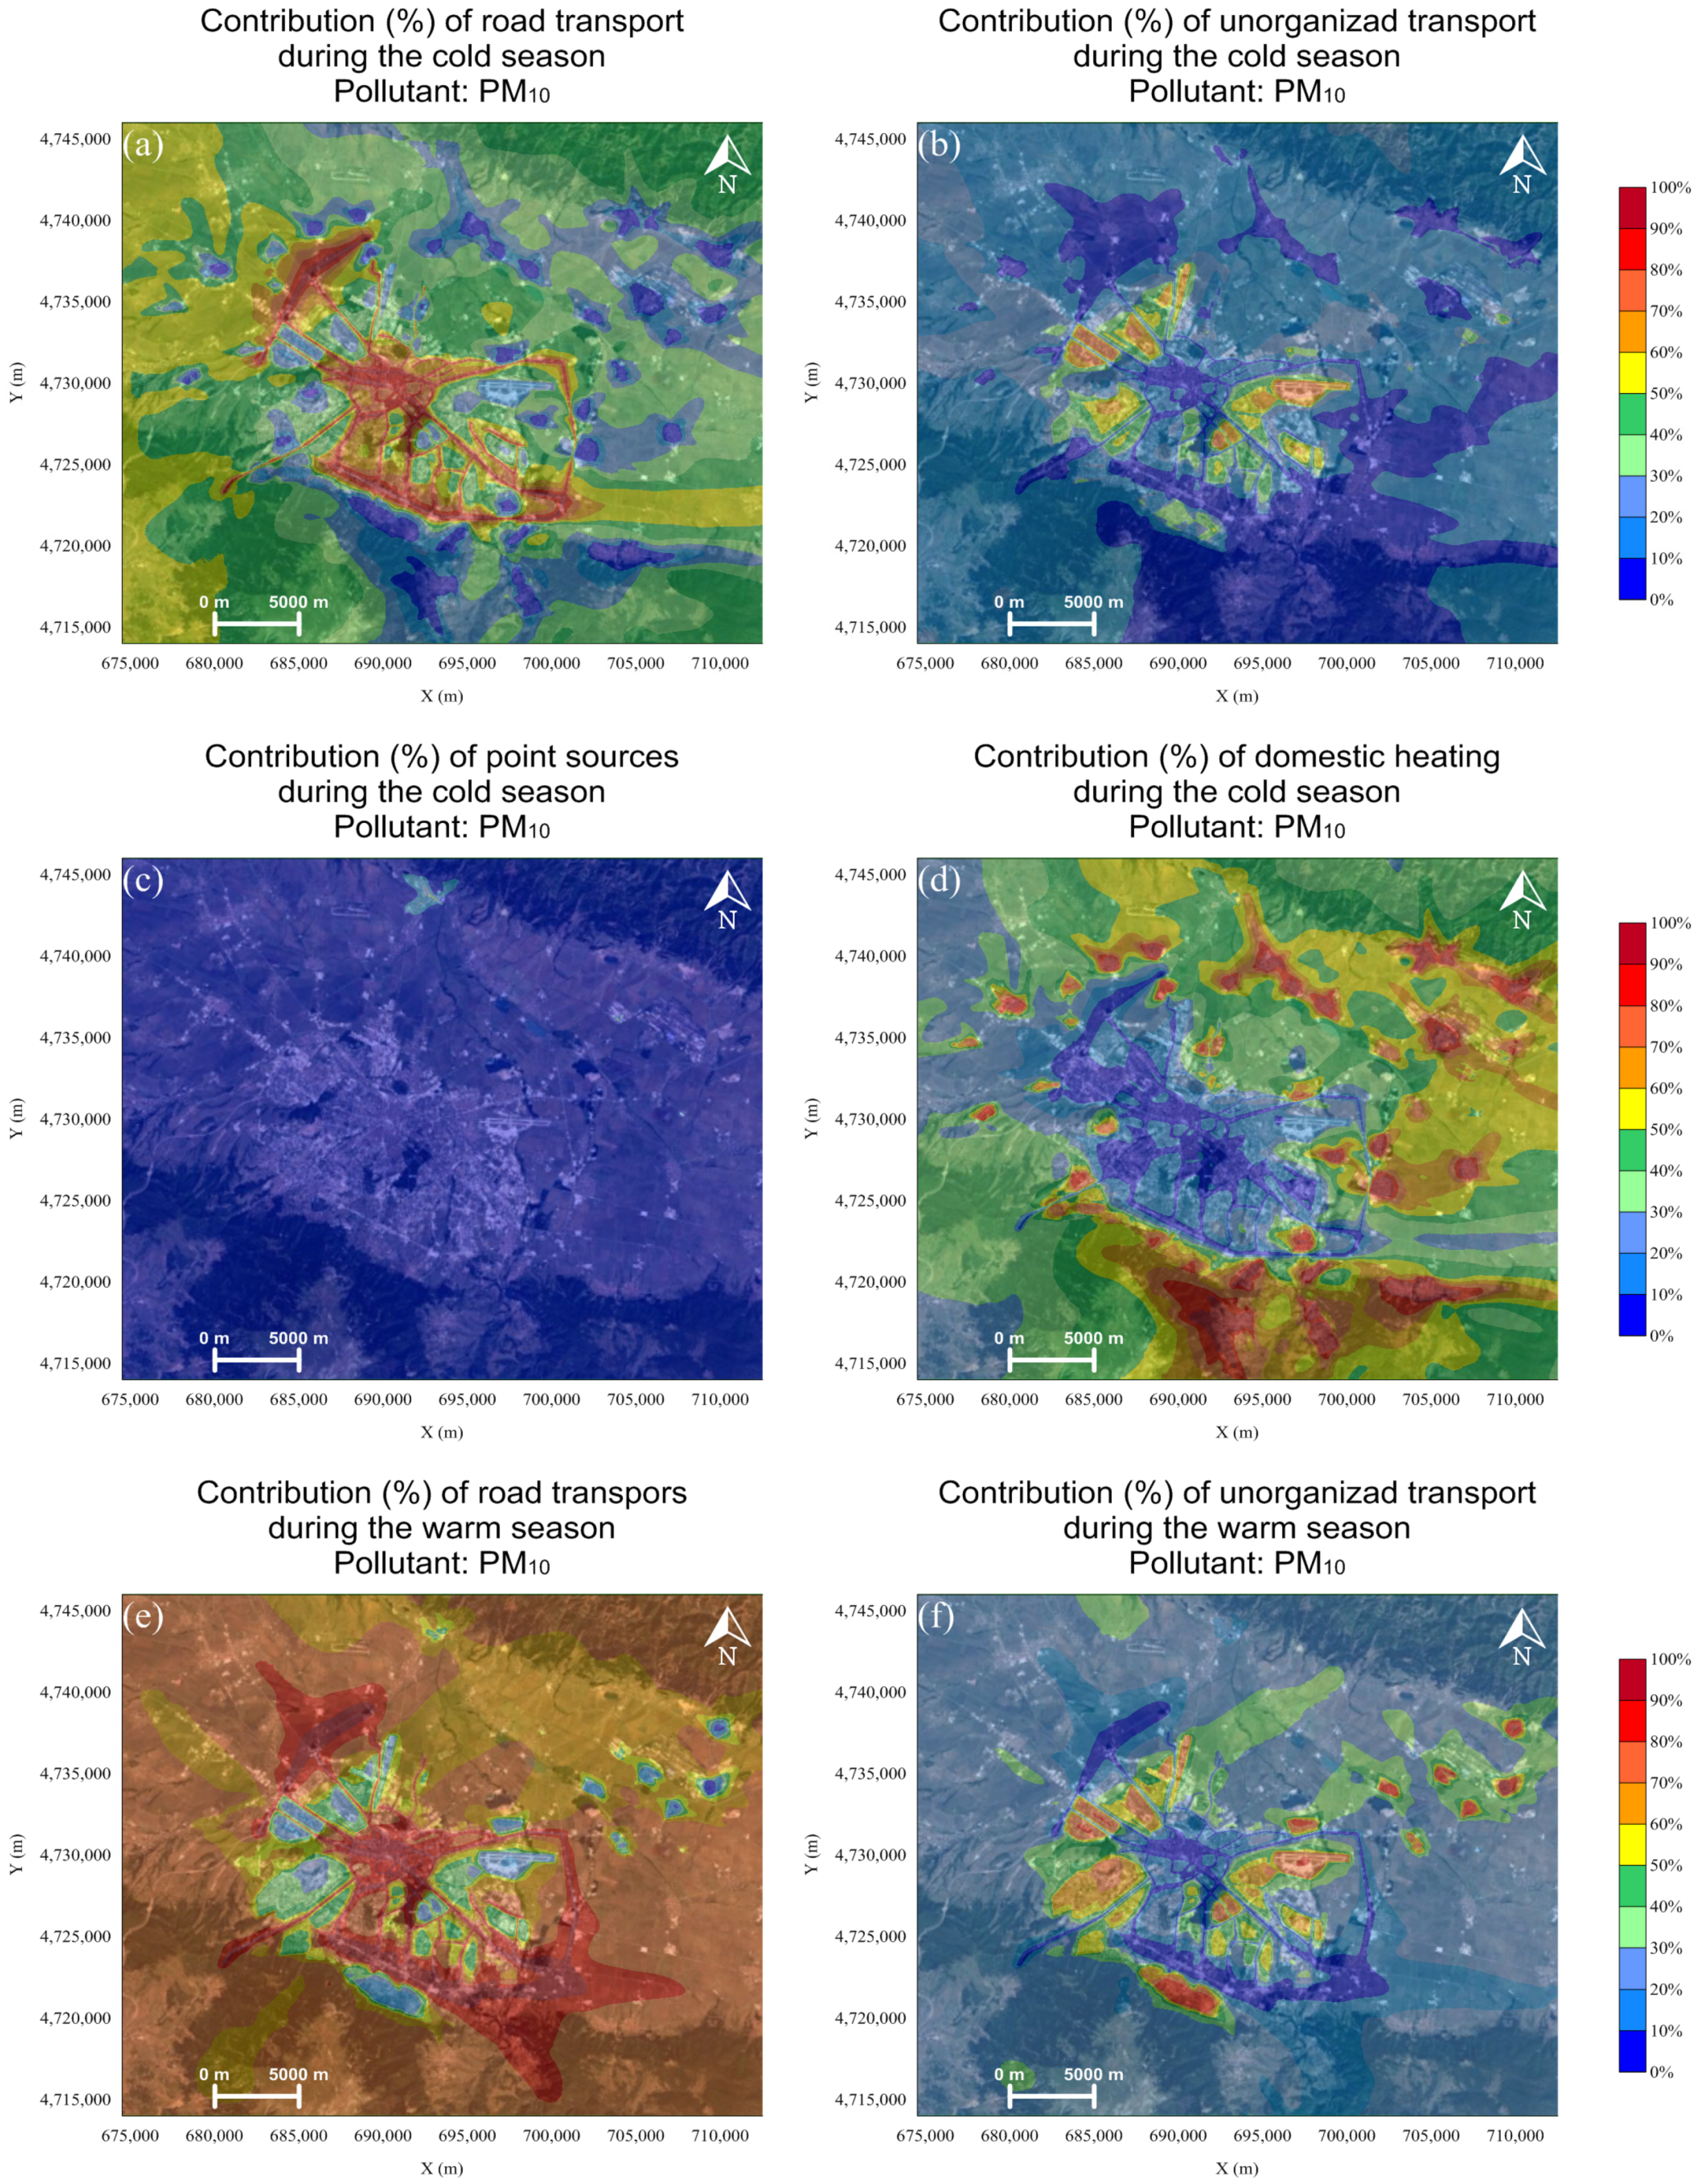
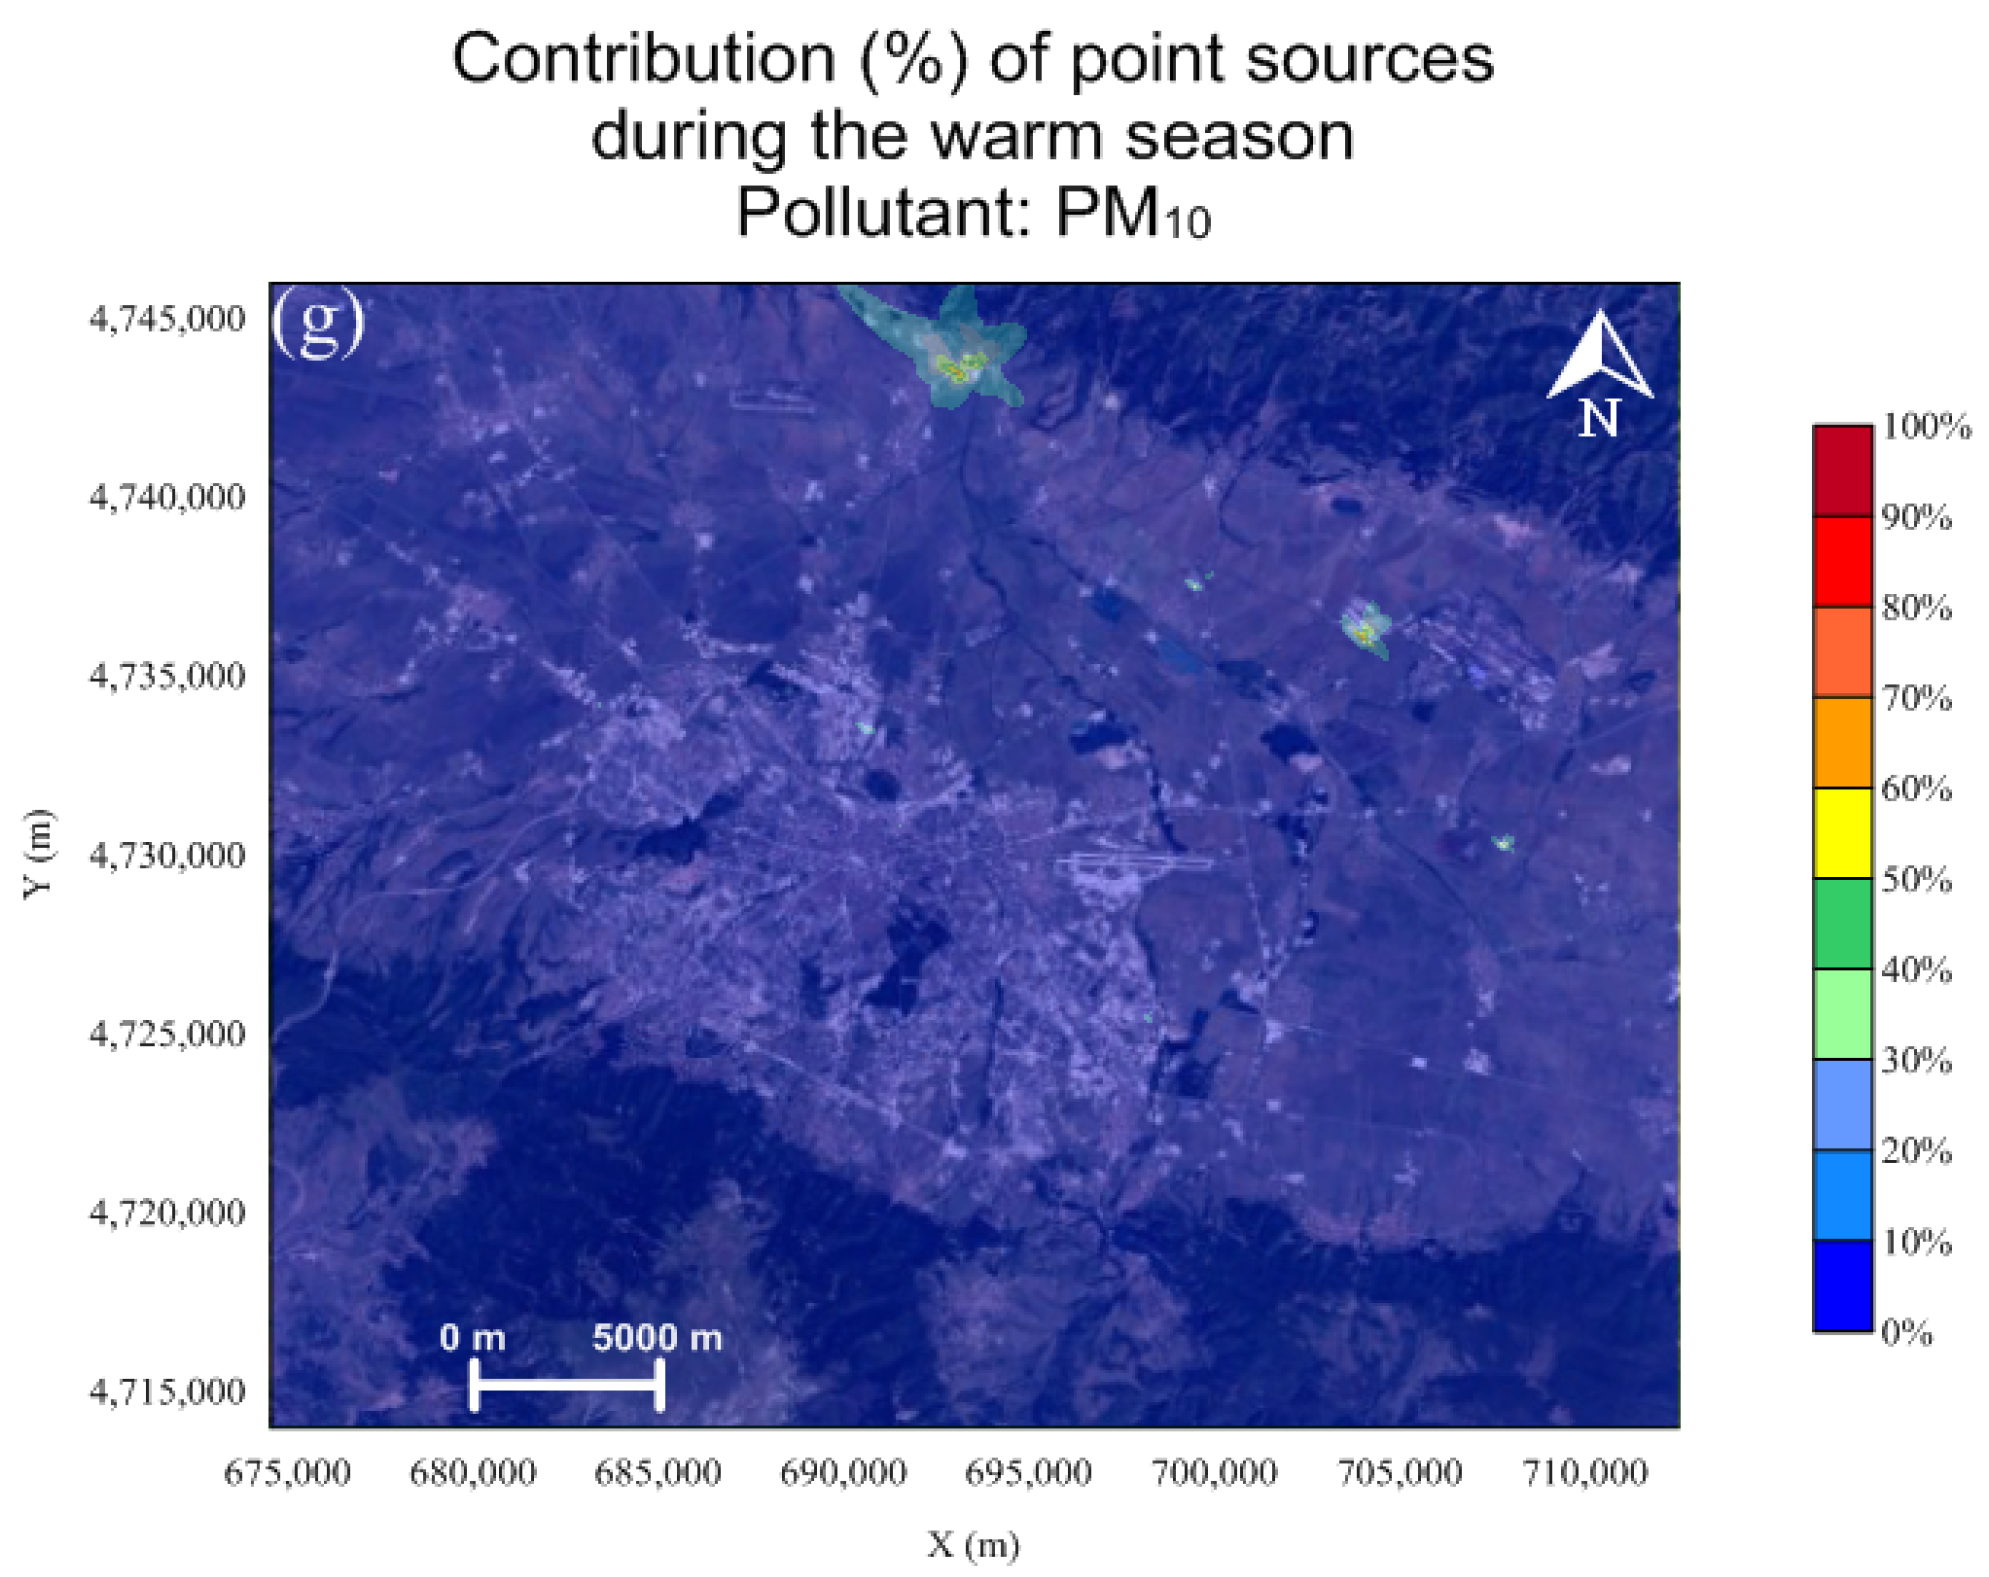
3.3.1. Spatial Distribution Maps of the Contribution of Different Sources of PM10

Transport is absolutely dominant source of PM10 pollution in the central city area and along the roads with heavy traffic during both cold and warm seasons (Figure 6). The contribution of this source is more than 80%. Another source with significant influence in the city area is the unorganized transport from residential areas where the impact is more than 50%. Only specific locations, where powerful industrial sources are located (considered as point sources) are distinguished in the vicinity of the capital, mostly in the town of Novi Iskar, where the companies Zebra AD and Kurilo metal operate. Four thermal power plant (TPP) named TPP Sofia, TPP Sofia-East, TPP Lyulin, and TPP Zemlyane are the most powerful emitters within the city and they are located in the industrial zones of the suburbs Druzhba, Nadezhda, Lyulin, and Krasna polyana.
The domestic heating is a dominant source for satellite villages around Sofia city and some residential areas during the cold season. In the central part of the city most of the households use alternative ways such as central/gas heating or electricity, and the contribution of this source is negligible. The contribution of domestic heating is most significant in the southern and northeastern parts of the domain, and this pattern is strongly related with the close proximity of Vitosha and Lozenska mountains in the south and Stara Planina in the northeast of Sofia city which are acting like barrier for atmospheric flow coming from the predominant directions. The accumulated pollution in front of the obstacles is canalized along the Pancharevo gorge of the Iskar River between the Vitosha and Lozenska mountains, and up to the foothills of Plana Mountain, or dispersed over more open area in the east part of the Sofia field.
The main difference in spatial maps of contribution of different sources between cold and warm seasons is due to the dispersion processes related to meteorological conditions. Because of its location in hollow, Sofia city is characterized by thermal inversions, radiation fogs, and inversion clouds during the cold season, and impeded turbulence leads to very high pollution levels, as the contaminant is accumulated near the sources within the thin boundary layer. In opposite, more dynamic weather during the summer and the transition seasons leads to an extended pollution field over the hollow with lower concentration, which can be found in the presented maps. Most visible is the difference in maps showing the contribution of high point sources, when the turbulence affects significantly the dispersion of pollution over larger area.

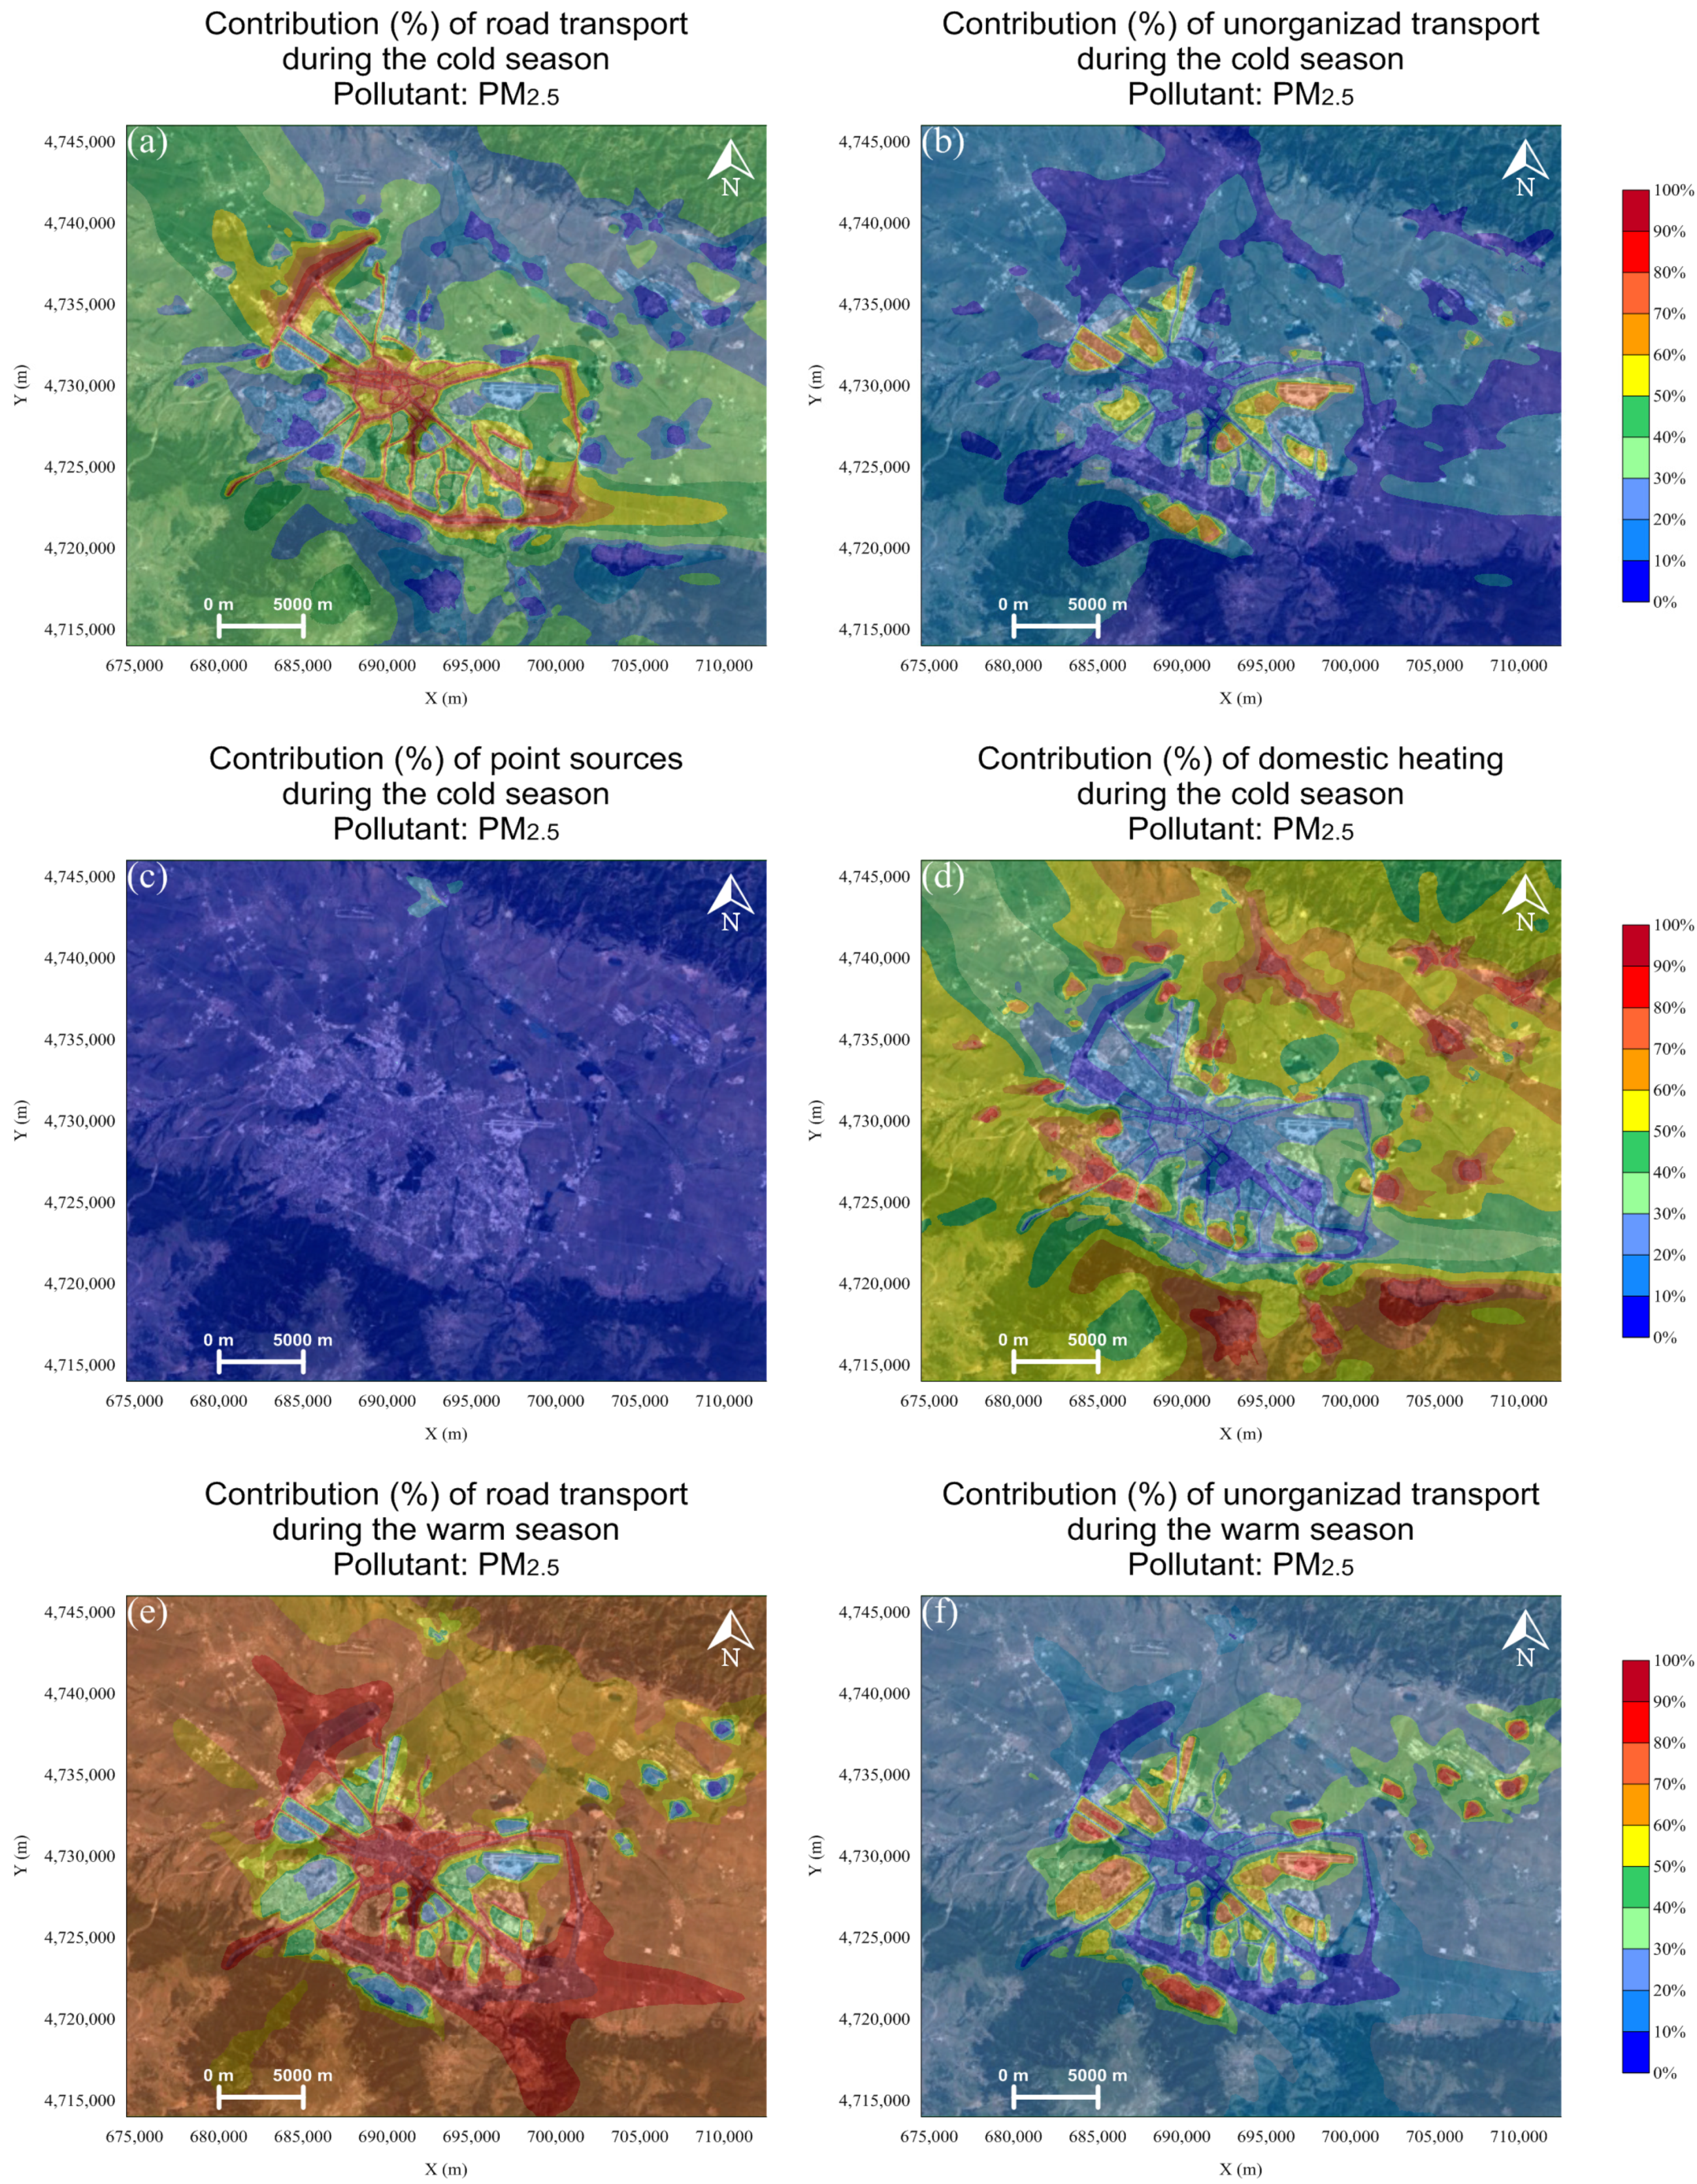
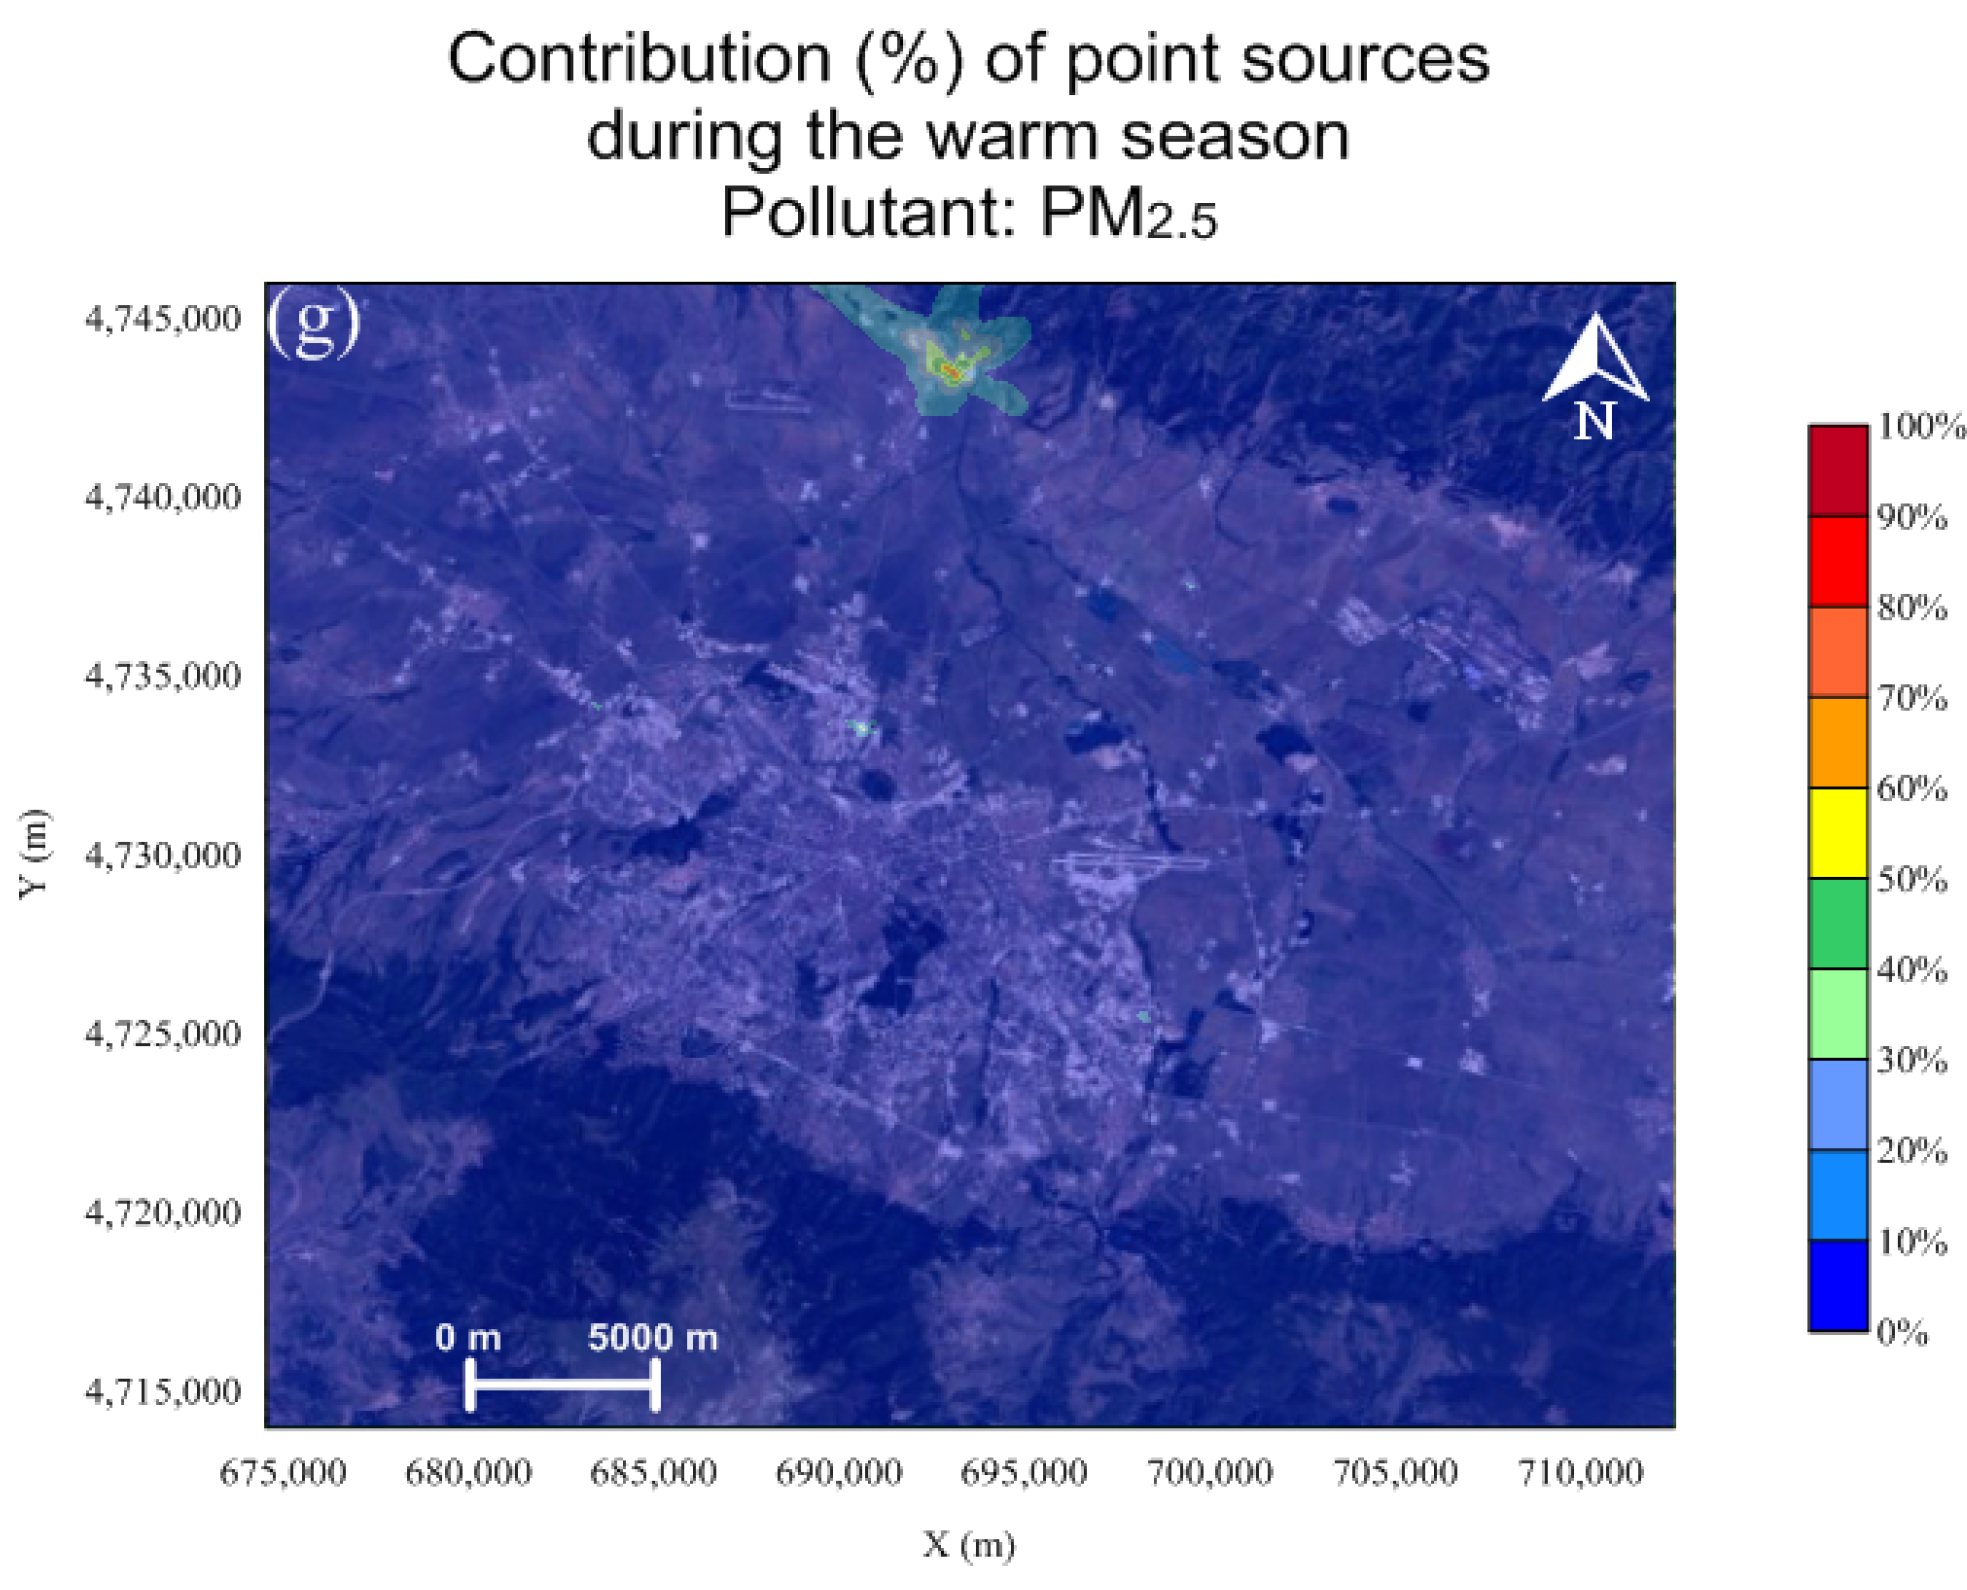
3.3.2. Spatial Distribution Maps of the Contribution of Different Sources of PM2.5

All conclusion that have been made for the spatial distribution maps of PM10 are valid for maps with contribution of different sources of PM2.5 (Figure 7). The main difference is reflected by the lower contribution of the road transport in the western part of the Sofia field, which is due to the increase in contribution of the domestic heating during the cold season. New domestic heating sources (Gorna banya, Malinova dolina, Vitosha, manastirski livadi, Bakston, Ovtcha kupel, Suhodol, Lozenec, and Hladilnika) added with the updated emission inventory represent more realistic spatial distribution of pollution. These changes were provoked by the fast urbanization within the southern part of the Sofia municipality during the last decade and build up area was expanded to the Vitosha foothills. The new sources are located in the south and the southwestern part of the city and strongly contribute to the concentration field in this area. There is no significant difference in spatial distribution maps of contribution of different sources of PM2.5 for the warm season.

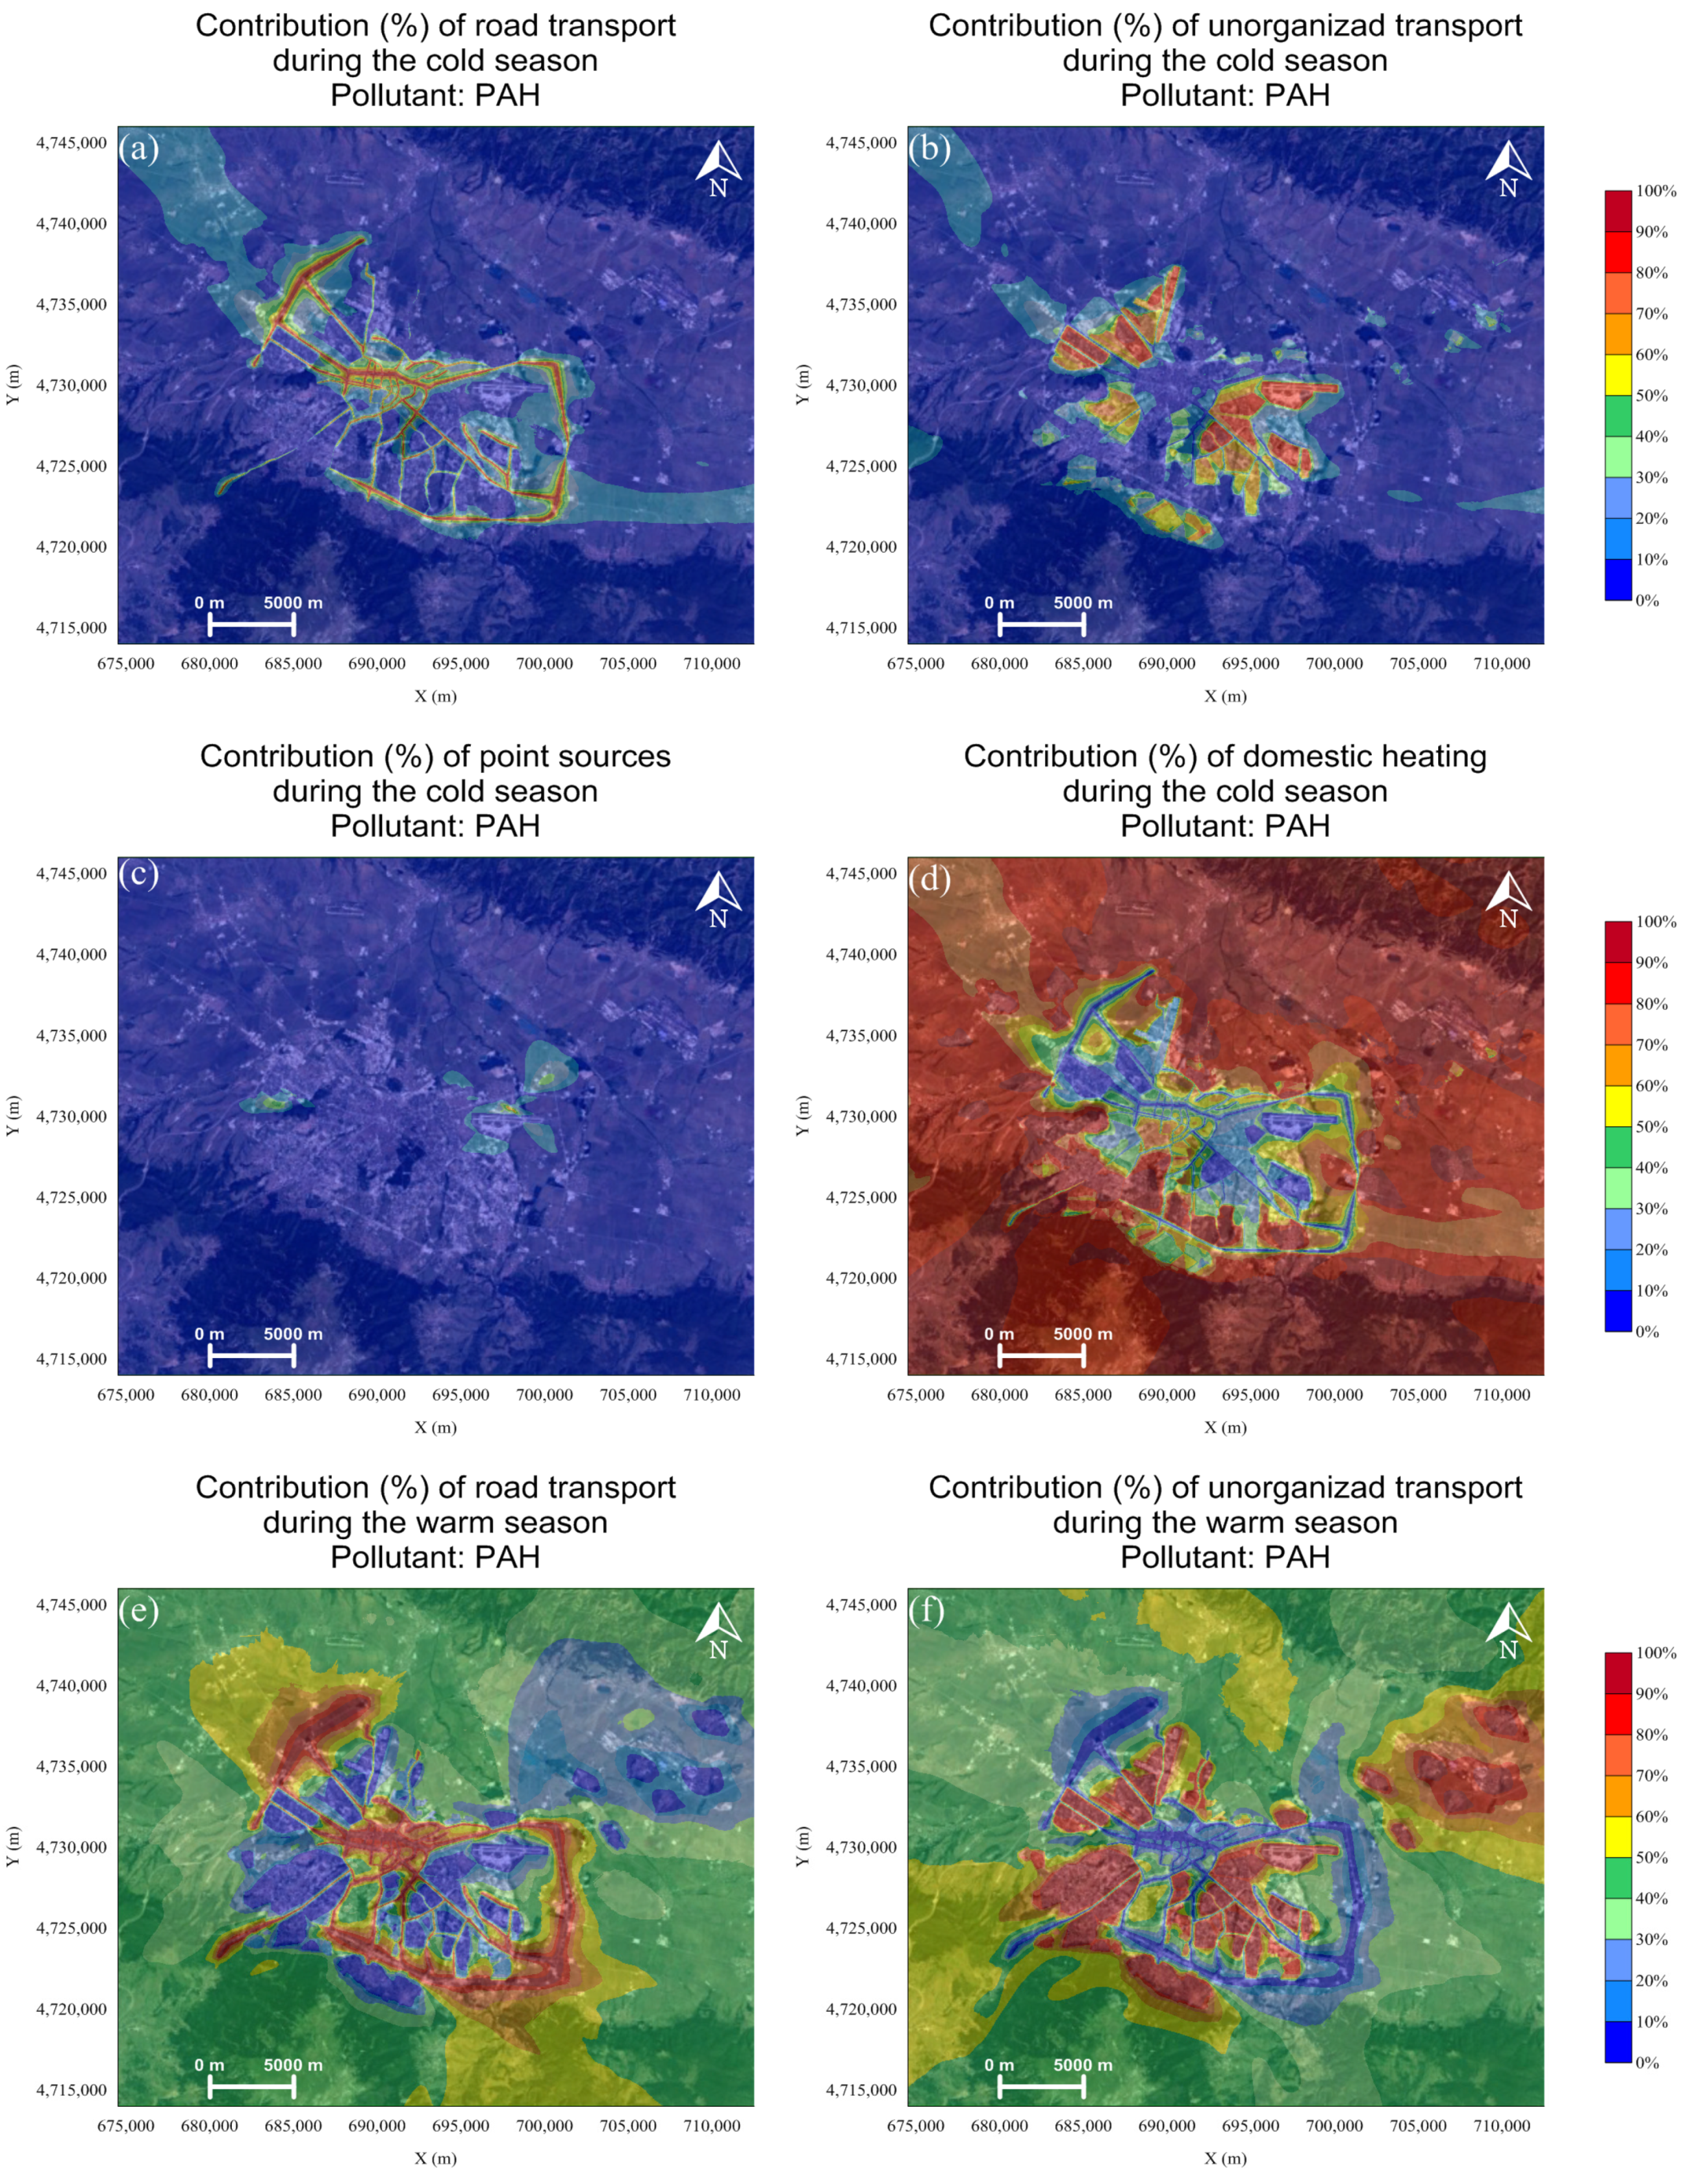
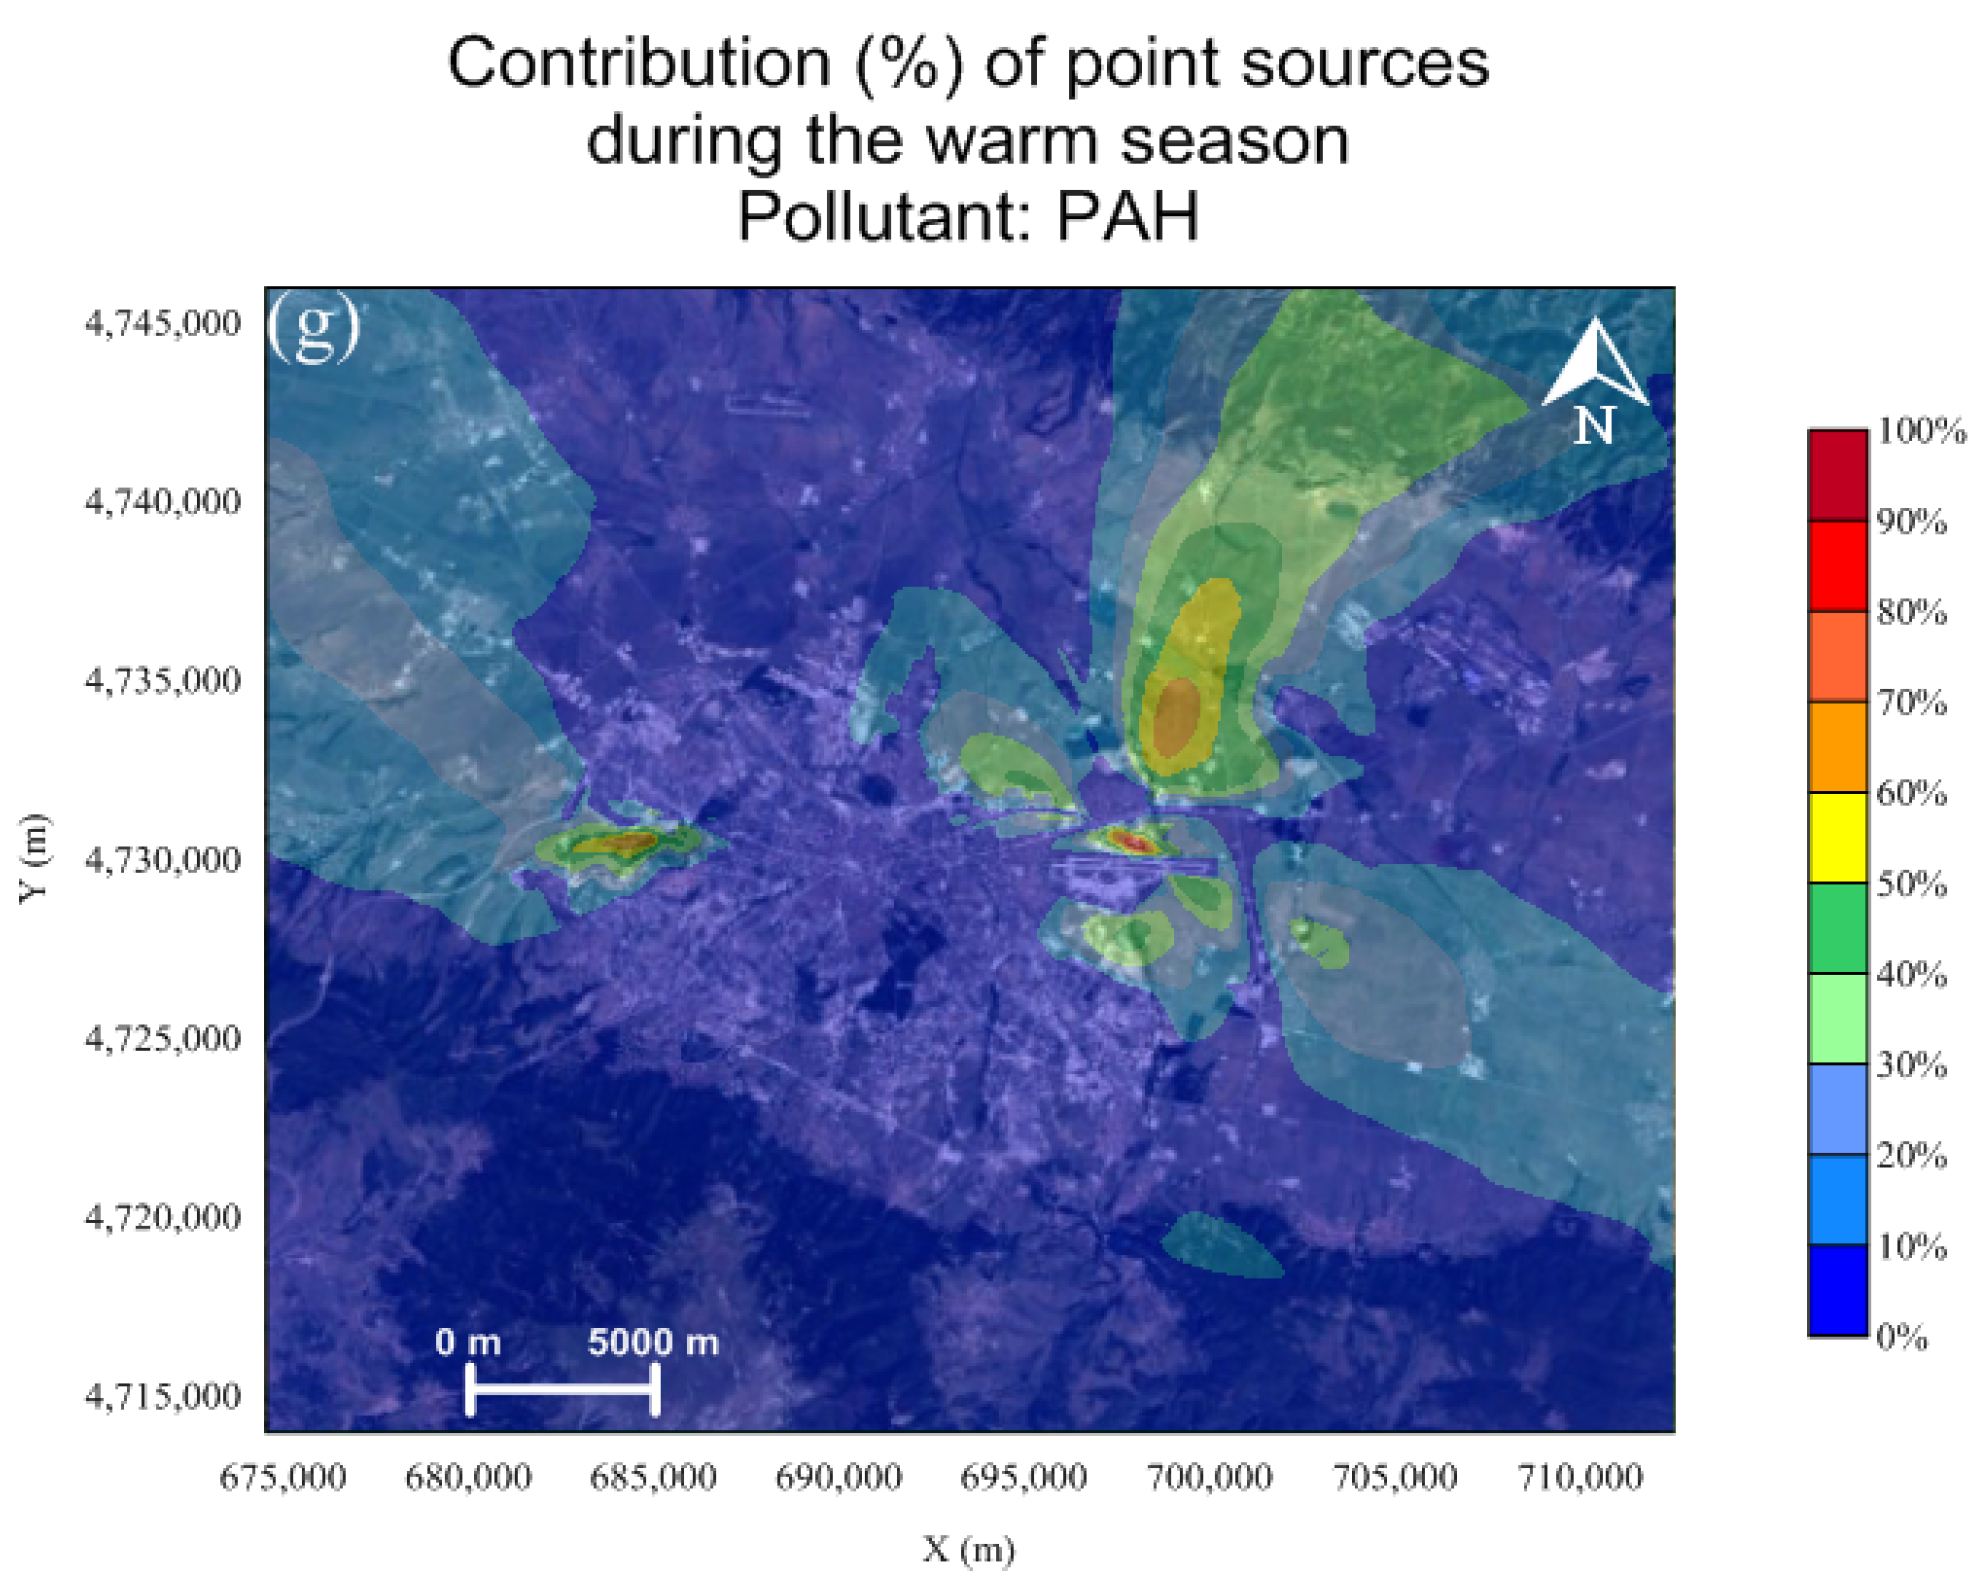
3.3.3. Spatial Distribution Maps of Contribution of Different Sources of PAH

The spatial distribution of contribution of transport of PAH concentration is more inhomogeneous and structured near the sources themselves during the cold season due to insufficient mixing and higher deposition rates for this pollutant (Figure 8). The biggest residential areas and roads with heavy traffic contribute more than 60% in Sofia. In the vicinity of the city and the settlements around it, the contribution is less than 20%, because there, the most significant contribution is from the domestic heating. During the warm season, transport is the main provider for PAH pollution, except for two areas, which emerge in the eastern and the western parts of the city, where large point sources have a significant contribution. The influence of the main point sources, the enterprises RaTek OOD (west) and Roads and Facilities EAD (east), is mainly outside the city. In residential areas and the central part of the city, the contribution of transport is more than 90%.

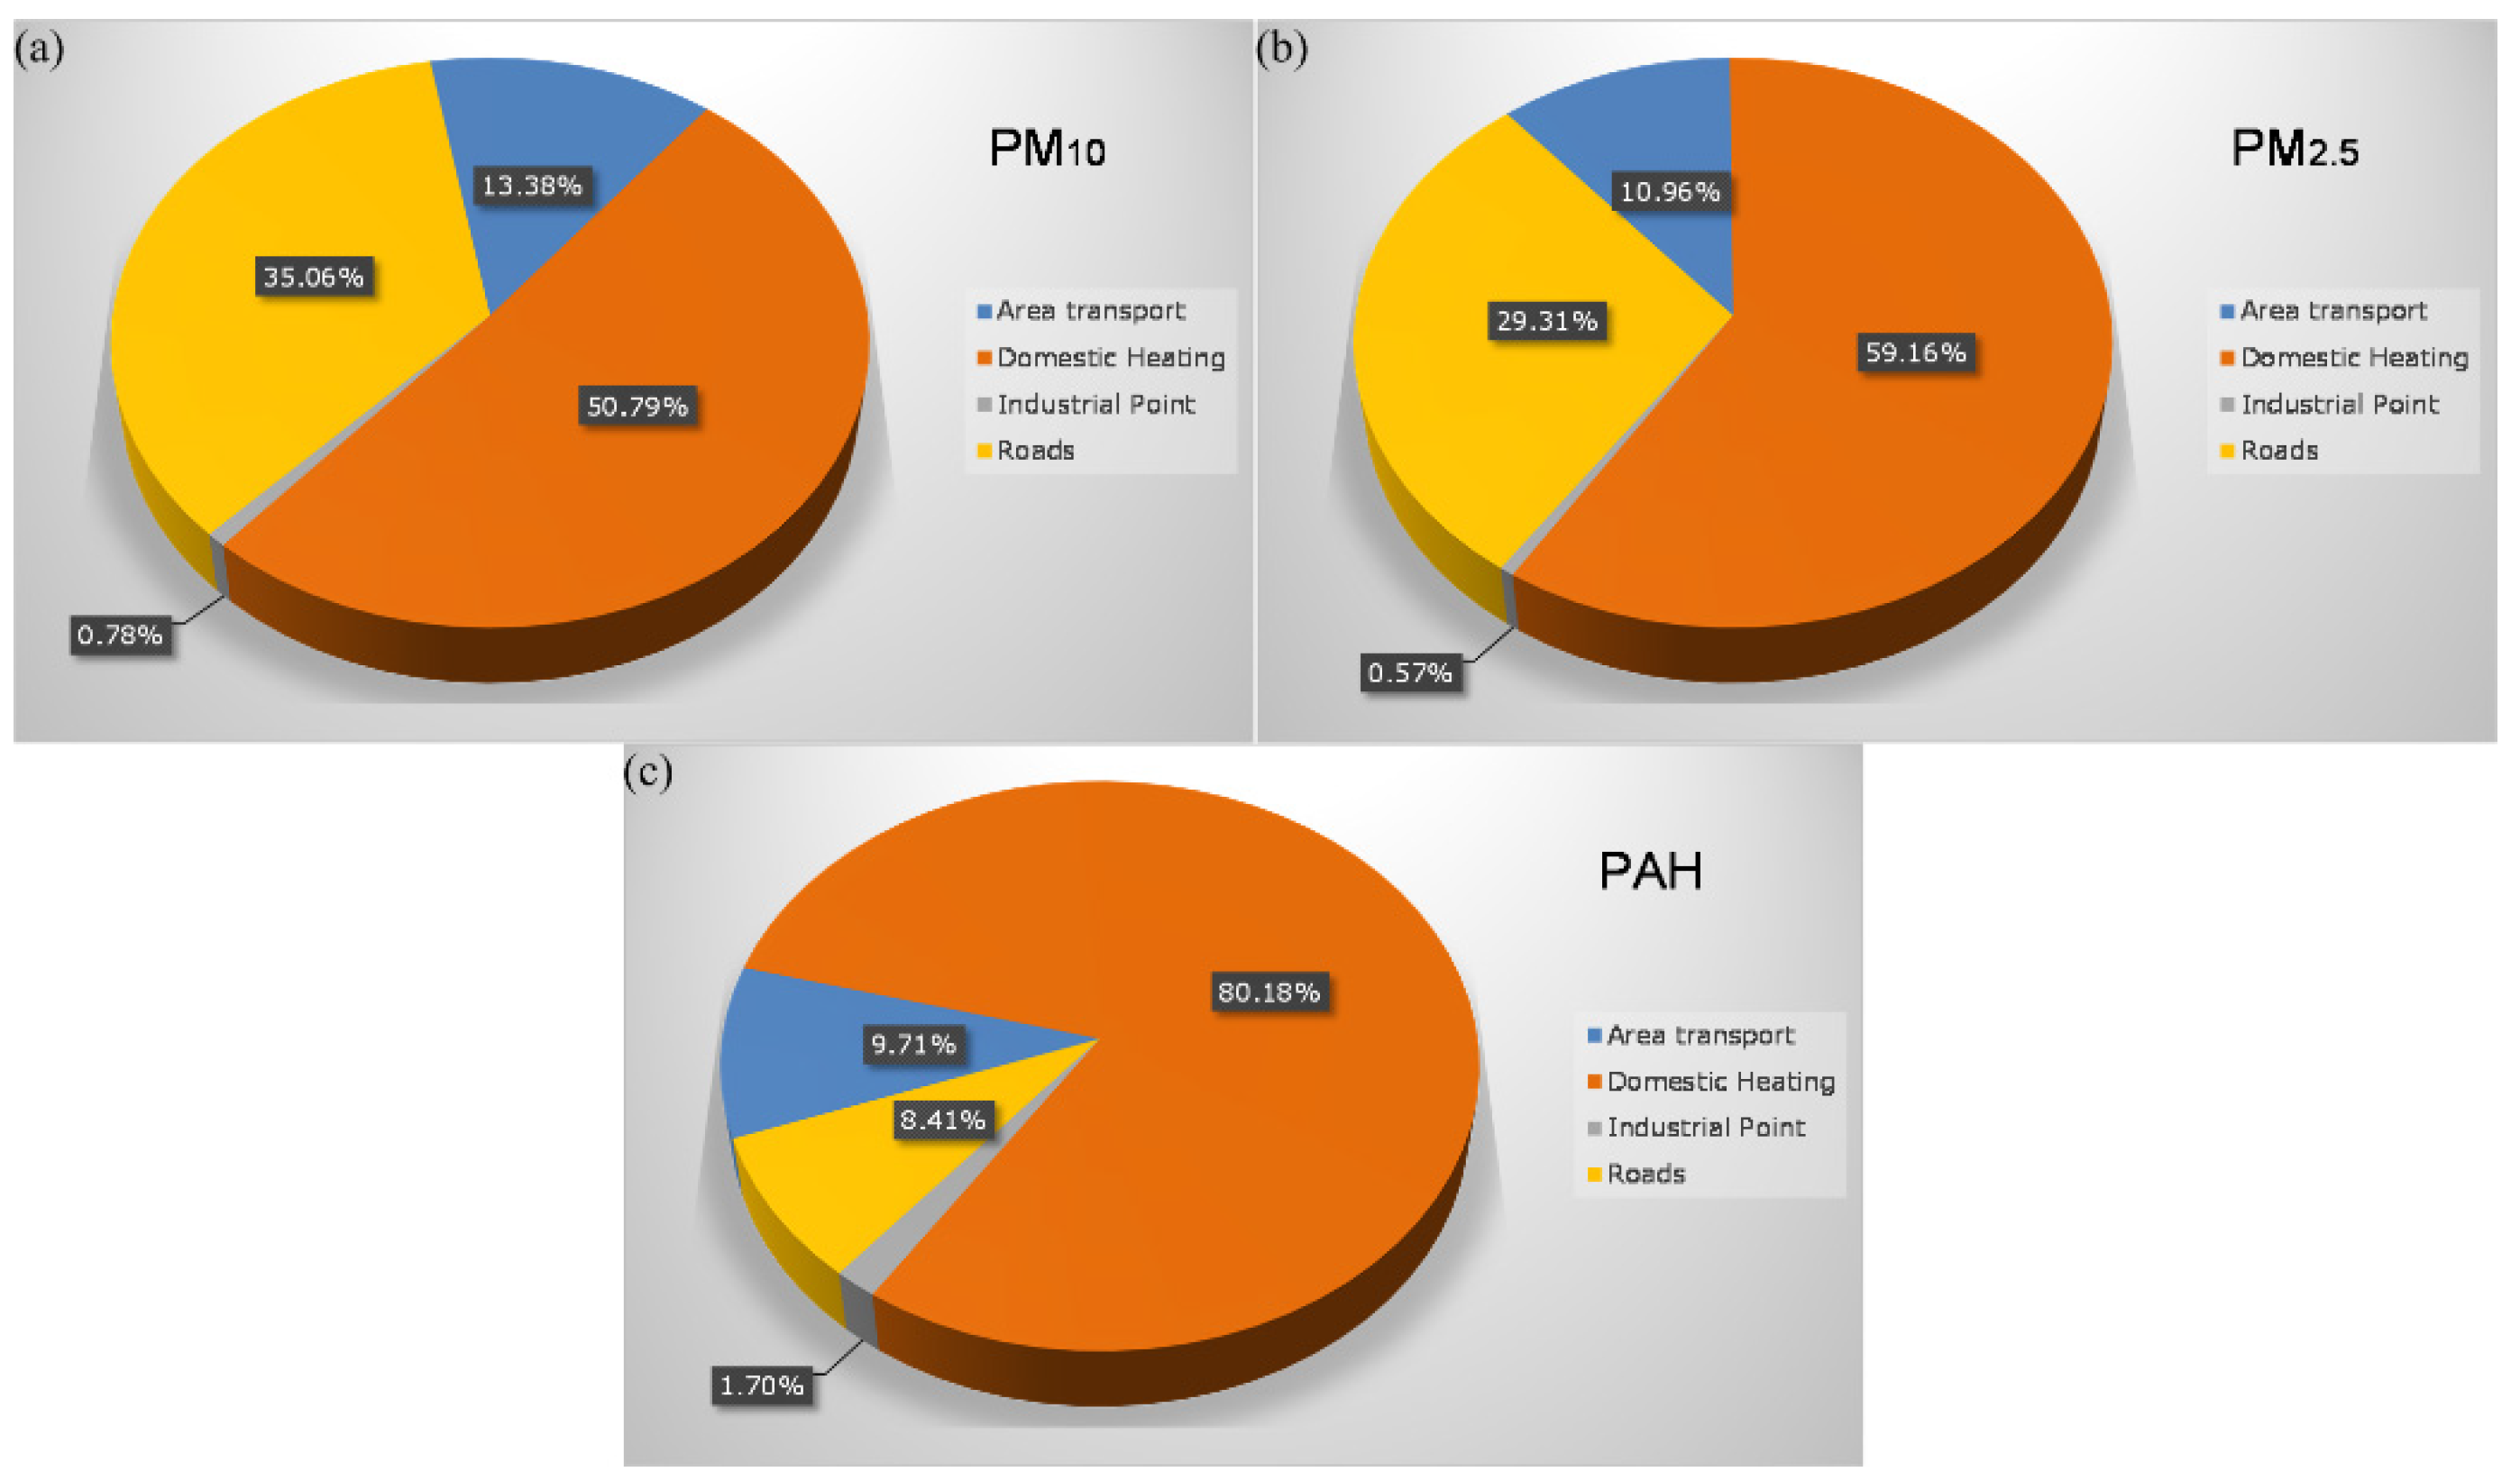
3.3.4. Contribution of Different Sources over the Entire Domain

This sub-chapter presents, more generally, the contribution of different sources to the annual concentration of the investigated pollutants, averaged over the entire area. Although the domestic heating plays a role only during the cold season, this source has the largest contribution for all three pollutants with more than 50% for PM and reaches ~80% for PAH (Figure 9). The contribution of this source to the annual concentration of PM2.5 is almost 10% higher than that for PM10. The roads transport is the second largest provider with approximately 30% for PM and ~10% for PAH. The unorganized transport from the minor roads within the residential areas (it is considered as area source) contributes approximately by 10% to all pollutants. The least notable contribution is from the point sources for all of the considered pollutants (below 2%), because they are high sources and the dispersion of the contaminants is carried out in relatively large volume of air, in comparison with the lower placed sources, and this leads to significant reduction of the surface concentration.

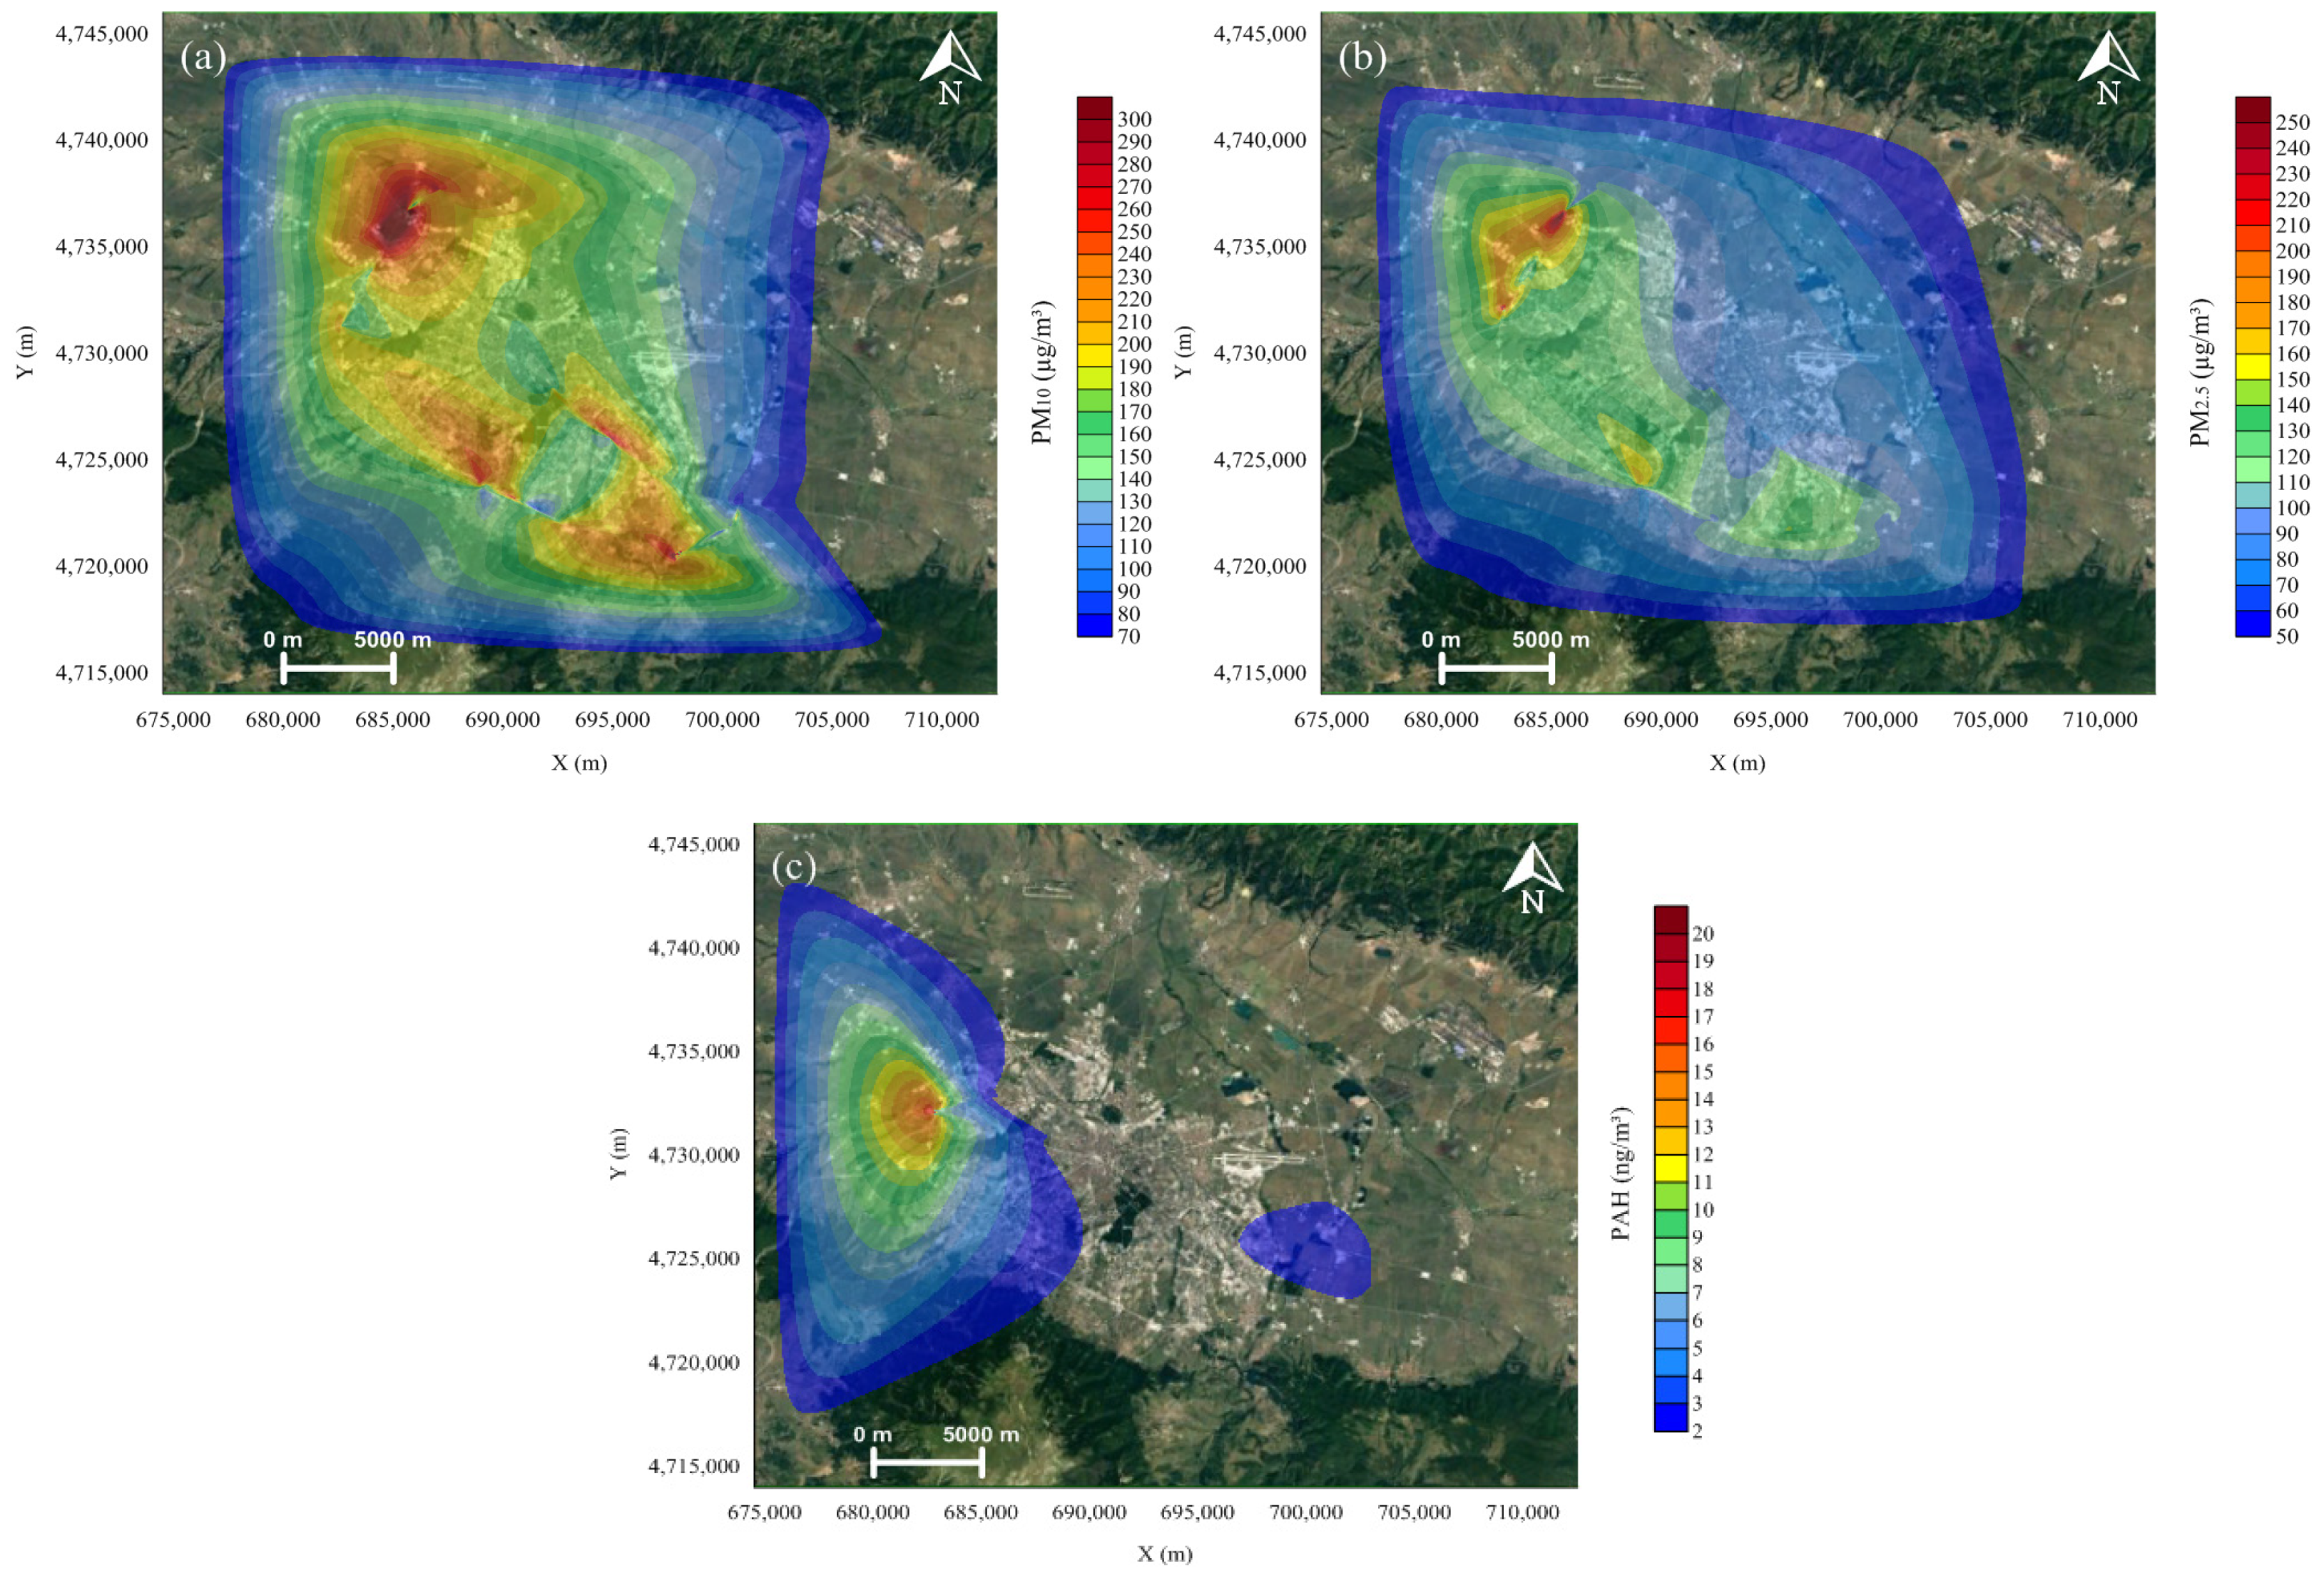
3.4. Ground Maximum Concentration Fields of Different Pollutants

The maximum values of the daily concentrations for the entire year 2014 were derived with their location and plotted together to determine the most polluted areas for the different pollutants. Maps made after interpolation of 365 points are shown in Figure 10.
The simulated maximum concentrations are above 100 µg m−3 for PM10 at Sofia city and the outskirts. Most polluted areas with exceedances above 250 µg m−3, which is 5 times above the daily standard of 50 µg m−3, were at the northwestern and southern part of the city, and the southeastern outskirts in the village of German, and around the southern tangent of the city ring road and Tsarigradsko Shose, where the exceedances appeared more often. The highest concentrations were simulated at Nadezhda residential area near the crossroads of city ring road and Lomsko Shose and the Ilientsi industrial zone. Other clusters were found in Malinova dolina residential area near the crossroads of city ring road and Simeonovsko Shose, as well as the Tsarigradsko Shose and P.K. Yavorov boulevards.
Similar areas at the northwestern and southern part of the city outskirts are most polluted with PM2.5. The highest concentrations above 150 µg m−3 were simulated at Filipovtsi, Nadezhda, and Lyulin residential areas near the city ring road and crossroads with the Lomsko Shose, Simeonovsko Shose, and Tsarigradsko Shose boulevards, where they appeared more often.
The most polluted with PAH was Filipovtsi residential area, located in the western part of the city, where high concentrations above 10 ng m−3 appeared very often. Clusters with lower than 10 ng m−3 concentrations were simulated along the Slivnitza boulevard at Zona B-18, Ilinden, Banishora, and Sveta troitza residential areas. Several days with high concentration of PAH were captured in Lyulin residential area near Pentcho Vladimirov Boulevard.

4. Discussion

Despite of some deficits of the local Gaussian type models for air quality studies, the potential of resolving emissions and physical environment with fine resolution makes them very useful tool. The spatial depiction of regional air quality models due to the restriction of their spatial resolution, underestimate pollution (especially for PM) [38,39], as they are unable to capture the high concentration gradients nearby roads with heavy traffic, and from other sources near the surface. In the complex modeling, accounting for the effect of the line sources (the major road arteries with heavy traffic) requires the usage of small spatial step of tenths of meters, in order to be able to register the large gradients in proximity of the segment. The concentration decreases rapidly with increasing the distance from the road even if the effect of the street canyon is not taken into account for the simulations. It is possible to add further receptor points within the canyon in order to detect more accurately the effect of pollutant retention within the canyon under certain conditions, which is not achievable with the regional models.
Some of the uncertainties in this research must be considered, because of the made assumptions, or due to lack of data required as input for the model. The used emissions for the pollutants were calculated beforehand and can contain some inaccuracies and can deviate from the real emissions for the considered period. The emission inventory for a certain area is the most important factor, but it brings the highest improbability in the air quality researches. The sources of domestic heating by fossil fuel combustion and wood burning, as well as the transport sources, have the most significant impact on air quality. The two processes are stochastic, because they represent a multitude of many behaviors and their continuous variability. The emissions preparation is the weakest link in conducting this type of studies, because of their spatial and temporal variability. Due to lack of data and information, the used emissions do not account for the daily, weekly and monthly dynamics in the traffic flow, and the dynamics of inhabiting and heating the dwellings, consideration of which may lead to corrections in the obtained pollution field.
For the simulations, as meteorological input, were used the hourly measurements from AQS Druzhba, because the data set was the most complete. It can be assumed that the data are presentable for the largest part of the city, but the flow is strongly modified in the footprints of Vitosha and Plana mountains (south of the city), Lulin Mountain (west) and Lozenska (east) mountain. This effect is partially compensated by using the terrain module option, which shifts the trajectory of the flow and the dispersion, in order to account for the disturbances in air flow, caused by the terrain. However, significant differences were found with validation at AQS Pavlovo, which stresses that at the foothills of the steep Vitosha Mountain the meteorological field was not representative and needs more attention in the future work.
For background concentrations were used the monthly-mean values of PM10 and PM2.5 measurements from AQS Kopitoto. However, the background data from this AQS can be presentable only for certain synoptic flow from south-southwest. In the other cases, because of the significant difference in the altitudes of the station and the city, the measurements do not account for the possible pollutant transport form sources, located outside of the Sofia municipality. For the concentration fields of PAH, no background concentration was added since the measured value at AQS Kopitoto was very low—0.0536 ng m−3 [48], and is below 1% of the modeled maximal values for the cold season (4 ng m−3), and many observations were missing.
The effect of dry deposition is taken into account, and it leads to decrease of the concentration with increasing the distance downstream from the source and changes the vertical profile of the pollutant by depleting the substance from the air and depositing it on the ground. However, the wet deposition is not considered due to lack of data for precipitation intensity, required as model input. The simulated concentrations are inflated for the days, when precipitation was recorded.
The chemical transformations, which would lead to formation of secondary pollutants, are not considered. Although, the model has a scheme for the transformation of sulfur dioxide to sulfate particles, which are added to the concentration of PM10, this option was not used in this study, but we plan to apply it in our future work. For that reason the obtained PM10 field is expected to be underestimated.
In spite of the above described uncertainties, the carried out study helped for defining some of the deficiencies, occurring when complex evaluation of the pollution in urban area is conducted, which allows for certain activities to be formulated, in order to improve the future modeling at urban scales in Bulgaria. The main components responsible for modeling the urban air pollution are three—anthropogenic emissions, meteorological conditions, and physical environment. This study has pointed several possible ways for improvement in future modeling.
  • It is necessary to start a campaign for collecting new and analyzing the currently existing information from different agencies and departments in order to create more adequate local emission inventory. From the currently existing emission inventories (including the most recently developed and published in December 2020, which was not used in this study [51]), it is apparent that there is a lack of information in several fields:
    (i)
    The available data of the dynamics and structure of the traffic flow on the major road arteries, shows only the mean number of vehicles passed through them for 24 h. It is necessary to determine the daily and the weekly profiles of traffic flow, as well as to create an averaged profile of the structure of traffic flow on the different segments, located between junctions. The rush hour, especially in the mornings, coincides with the more unfavorable meteorological conditions, i.e., stable stratification and absence of turbulence, which favors longer retention of the pollutant in the atmosphere. The structure of the traffic flow is different in the central city part and for example on city ring road Okolovrasten pat, where the fraction of heavy goods vehicles should be greater. Without data for such profiles, type of the road, movement speed, fuel consumption, stay at traffic lights, etc., it is impossible to use software for detailed vehicle inventory, such as COPERT (the EU standard vehicle emissions calculator [52]), EMIT (Atmospheric Emissions Inventory Toolkit [53]), etc. The usage of this type of software will allow to differentiate the busiest and problematic points in the urban road infrastructure and provide possibilities for development of models for establishing an intelligent transport systems for traffic management. These models would easily show the effect of redirecting the traffic flow or part of it from certain boulevard to another boulevard/street and the respective impact on the pollution field. This would be useful for introducing adequate measures for decreasing the pollution emissions from the transport.
    (ii)
    It is also necessary to collect information and create data base of the annual average mileage of the registered in the city vehicles by district and what is the percentage of kilometers travelled in the city. This will help with defining the quantity of unorganized transport from minor roads in residential areas more accurately, which are not included in the road sources.
  • The complex terrain requires more realistic presentation of the air flow and a lot of additional meteorological variables in order to adequately model the air quality, and one point (for example one AQS) is not presentable for the entire domain. Regardless of the use of the complex terrain module in the last generation of Gaussian models such as ADMS-Urban and AERMOD (steady-state Gaussian air dispersion model that is US Environmental Protection Agency approved [54]), which allow calculation of the disturbances in the 3D field of flow and turbulence, it assumes homogeneity of the meteorological variables and the boundary layer over the entire domain. For a larger domain, those fields are extremely heterogeneous. For more realistic and detailed management of the meteorological input parameters, which are used for dispersion modeling, it would help to use a field simulated by a regional model for weather forecast (for example Weather Research and Forecasting Model with high resolution ~1 km). This would allow an adequate spatial and temporal variability of the meteorological conditions to be entered for the research domain and will be used in the future studies.
  • The physical environment, represented by the urban morphology, described in digital 3D arrays is of utmost importance for the presentation of the fluctuations in the pollution field and for the definition of the maximal pollution areas under different meteorological conditions. The presence of this type of data will allow for more accurate determination of the required characteristics in order for more detailed modules to be used, which describe urban street canyon (the parameters should be defined for both sides of the road; height of the buildings; distance from the central line of the road to the canyons’ wall; length of the buildings near the road; width of the road), this allows for more realistic presentation of the object. This data are also very useful for more accurate definition of the mean building height, when the domestic heating sources are considered.
  • The problem with entering the background concentration is still not resolved. AQS Kopitoto is used as background site, but the data are not presentable for all of the observed meteorological conditions in the region, since the meteorological site is located on high altitude. The pollution in Sofia field is impacted by the predominant flow in direction of the valleys’ axis from northwest and southeast coming from sources in the Sofia municipality outskirts. It is necessary to establish at least two background sites, according to the assigned parameters and requirements of the European and the national legislation. The sites should be located far enough from the Sofia municipality in the northwest and southeast direction from the city.

5. Conclusions

The goal of the current research was to determine the local pollution of PM and PAH in the Sofia municipality, and, by this way, to test the abilities of the ADMS-Urban model. This model has never been used for evaluation of the pollution in Bulgaria before, and although it is a Gaussian dispersion model, it has a lot of improvements, and it is one of the most widely used models for evaluation of the complex pollution in urban areas. Despite the difficulties with collecting the required information and some discrepancies in the modeling process emanating from that, the obtained results show the solution of a complex problem and support the more detailed understanding of the structure of PM and PAH pollution in the Sofia municipality, and also evaluate the contribution of the different source types to the spatial distribution of the concentration fields.
The main conclusions, which can be made by the conducted study are as follows:
  • The contribution of the different types of sources to the modeled annual concentration, which is averaged over the entire domain, shows that the input of the domestic heating sources for all of the pollutants is most significant, followed by the contribution of transport from the main road arteries, which is more essential for PM in comparison with PAH, and area transport sources. The less notable contribution is from the point sources for all of the considered pollutants (below 2%).
  • Despite the importance of the impact of the domestic heating sources, averaged over the domain, we should keep in mind one essential factor, when we determine the required measures to reduce the harmful impact of the considered pollutants (PM10, PM2.5, PAH). The concentration field in Sofia city and the surrounding areas is mostly heterogeneous. Considering the contribution of the different types of sources of PM, shows the substantial impact of transport (described as road—the main road arteries with heavy traffic, as well as the area transport sources from the minor roads in residential areas) on air quality in the central parts of the city, where the pollution is mostly local, in proximity of the source. The contribution of the domestic heating from wood and coal burning is highest in the city’s outskirts and in the small towns in the Sofia municipality. The effect of the domestic heating sources in the central city parts is notably lower, because of the use of alternative heating methods (central heating, electricity, gas), and also this contribution is valid only for the cold season.
  • The locations of the maximal daily simulated concentrations during the year shows the formation of clusters, regardless of the various meteorological conditions. The highest concentrations of PM occurred at the northwestern and southern part of the city, and the southeastern outskirts in the village of German. The most polluted area of PAH is Filipovtsi residential area. The city ring road and main boulevards with heavy traffic contribute substantially to the “hot spots” of the most polluted areas.
  • Despite of some uncertainties in the presented research, which are described above, the estimated contribution of the different source types, gives us a useful information on temporal–spatial distribution of the pollution, which cannot be obtained by using the data from the five AQSs, where the concentration of PM10 is measured, and only one, where the concentrations of PM2.5 and PAH are measured. Moreover, the locations of the obtained maximal concentration clusters are far away from the existing sites.

Author Contributions

R.D. contributed to the conceptualization and methodology, formal analysis, supervision, and writing, M.V.: model simulations, formal analysis, and visualization. All authors have read and agreed to the published version of the manuscript.

Funding

This research and APC was funded in the framework of the National Science Program “Environmental Protection and Reduction of Risks of Adverse Events and Natural Disasters”, approved by the Resolution of the Council of Ministers No. 577/17.08.2018 and supported by the Ministry of Education and Science (MES) of Bulgaria (Agreement No. Д01-322/18.12.2019.

Institutional Review Board Statement

Not applicable.

Informed Consent Statement

Not applicable.

Data Availability Statement

Data used to support the findings of this study are available from the corresponding author upon request.

Acknowledgments

We acknowledge the provided access to the e-infrastructure of the NCDSC—part of the Bulgarian National Roadmap on RIs, with the financial support by the Grant No D01-221/03.12.2018. This paper reflects the views of the authors and not necessarily those of the funding agency and author’s affiliated institutions.

Conflicts of Interest

The authors declare no conflict of interest.

Appendix A

Figure A1. Monthly mean concentration (µg m−3) of PM10 at AQSs Nadezhda (a), Druzhba (b), Pavlovo (c), Orlov Most (d), Hipodruma (e), and PM2.5 at Hipodruma only (f): simulated values without (blue) and with added (red) background concentration, and calculated from observations (green). Background concentration is missing from observations for August and September.
Atmosphere 12 00423 g0a1aAtmosphere 12 00423 g0a1b

References

  1. European Environment Agency. Air Quality in Europe—2017 Report, EEA Report No 13/2017. Available online: https://www.eea.europa.eu/publications/air-quality-in-europe-2017 (accessed on 9 January 2021).
  2. Oke, T.R.; Mills, G.; Christen, A.; Voogt, J.A. Urban Climates, 1st ed.; Cambridge University Press: Cambridge, UK, 2017; pp. 294–295. [Google Scholar]
  3. Commission of the European Communities. Brussels, 21.9.2005. COM (2005) Final. Available online: https://eur-lex.europa.eu/LexUriServ/LexUriServ.do?uri=COM:2005:0446:FIN:EN:PDF (accessed on 9 January 2021).
  4. National Emission Ceilings Directive, 2001/81/EC. Available online: https://www.eea.europa.eu/themes/air/air-pollution-sources-1/national-emission-ceilings (accessed on 9 January 2021).
  5. EU Directive 2008/50/EC, Air Quality. Available online: https://www.eea.europa.eu/policy-documents/directive-2008–50-ec-of (accessed on 9 January 2021).
  6. European Environment Agency. Air Quality in Europe—2020 Report, No 09/2020. Available online: https://www.eea.europa.eu/publications/air-quality-in-europe-2020-report (accessed on 9 January 2021).
  7. European Commission. Special Eurobarometer. Attitudes of Europeans Towards Air Quality. Available online: https://data.europa.eu/euodp/en/data/dataset/S2239_92_1_497_ENG (accessed on 9 January 2021).
  8. United Nations. DESA/Population Division World Urbanization Prospects: The 2018 Revision. Available online: https://www.un.org/development/desa/publications/2018-revision-of-world-urbanization-prospects.html (accessed on 9 January 2021).
  9. Executive Environment Agency. National Report on the State of Environment in Bulgaria–2017. Available online: http://eea.government.bg/bg/soer/2018/air/kachestvo-na-atmosferniya-vazduh (accessed on 9 January 2021). (In Bulgarian)
  10. Romero-Lankao, P.; Dodman, D. Cities in transition: Transforming urban centers from hotbeds of GHG emissions and vulnerability to seedbeds of sustainability and resilience: Introduction and editorial overview. Curr. Opin. Environ. Sustain. 2011, 3, 113–120. [Google Scholar] [CrossRef]
  11. Bulgarian National Statistical Institute. Population and Demographic Processes 2017. Available online: http://www.nsi.bg/sites/default/files/files/publications/DMGR2019.pdf (accessed on 9 January 2021).
  12. Ganev, K. Some results of the numerical modelling of mesometeorological processes in the Sofia field. Bulg. Geoph. J. 1981, VII, 3–15. (In Bulgarian) [Google Scholar]
  13. Ganev, K.; Yordanov, K. Some examples of admixture transport in the Sofia field. Bulg. Geoph. J. 1981, VII, 16–28. (In Bulgarian) [Google Scholar]
  14. Ganev, K.; Yordanov, D. On the formulation of the influence function problem in air pollution models with parameterized diffusion in the surface layer. Bulg. Geoph. J. 1983, IX, 25–35. (In Russian) [Google Scholar]
  15. Dimitrova, R. Three-layer model of mesoscale pollution in the atmosphere. Bulg.Geoph. J. 1997, XXIII, 29–40. [Google Scholar]
  16. Atanassov, D. Local scale PC-oriented Eulerian pollutant transport model PolTran-1–2. Int. J. Environ. Pollut. 2000, 14, 217–224. Available online: https://www.researchgate.net/publication/264814627 (accessed on 9 January 2021). [CrossRef]
  17. Gromkova, N.; Ganev, K.; Yordanov, D.; Georgieva, E.; Dimitrova, R.; Miloshev, N. Dispersion regulatory model for designing new industrial stacks–Software. In Proceedings of the 8th International Conference on Harmonization within Atmospheric Dispersion Modelling for Regulatory purposes, Sofia, Bulgaria, 14–17 October 2002; pp. 180–184. [Google Scholar]
  18. Dimitrova, R.; Ganev, K. Simple pollution transport model with parameterized vertical structure, NATO ARW on “Air Pollution Processes in Regional Scale”, Halkidiki, Greece, 13–16 June 2002. In NATO Science (Series IV: Earth and Environmental Sciences); Springer: Dordrecht, The Netherlands, 2003; Volume 30. [Google Scholar] [CrossRef]
  19. Dimitrova, R.; Ganev, K.; Zerefos, C.; Vasaras, A. Exchange of sulfur and nitrogen compounds between Bulgaria and Greece, estimated with a simple tree-layer pollution transport model. Bulg. Geoph. J. 2000, XXVI, 114–123. [Google Scholar]
  20. Ganev, K.; Syrakov, D.; Zerefos, C.; Prodanova, M.; Dimitrova, R.; Vasaras, A. On some cases of extreme sulfur pollution in Bulgaria or Northern Greece. Bulg. Geoph. J. 2002, XXVIII, 15–92. [Google Scholar]
  21. Ganev, K.; Dimitrova, R.; Syrakov, D.; Zerefos, C. Accounting for the meso-scale effects on the air pollution in some cases of large sulfur pollution in Bulgaria or Northern Greece. Environ. Fluid Mech. 2003, 3, 41–53. [Google Scholar] [CrossRef]
  22. Zerefos, C.; Syrakov, D.; Ganev, K.; Vasaras, A.; Kourtidis, K.; Tzortziou, M.; Prodanova, M.; Dimitrova, R.; Georgieva, E.; Yordanov, D.; et al. Study of the pollution exchange between Bulgaria and Northern Greece. Int. J. Environ. Pollut. 2004, 22, 163–185. [Google Scholar] [CrossRef]
  23. Syrakov, D.; Spiridonov, V.; Prodanova, M.; Bogatchev, A.; Miloshev, N.; Ganev, K.; Katragkou, E.; Melas, D.; Poupkou, A.; Markakis, K.; et al. A system for assessment of climatic air pollution levels in Bulgaria: Description and first steps towards validation. Int. J. Environ. Pollut. 2011, 46, 8–42. [Google Scholar] [CrossRef]
  24. Syrakov, D.; Ganev, K.; Prodanova, M.; Miloshev, N.; Slavov, K. Fine resolution modeling of climate change impact on future air quality over Bulgaria. In Proceedings of the 32nd NATO/SPS International Technical Meeting on Air Pollution Modelling and its Application, Utrecht, The Netherlands, 7–11 May 2012. [Google Scholar]
  25. Gadzhev, G.; Ganev, K.; Miloshev, N.; Syrakov, D.; Prodanova, M. Some basic facts about the atmospheric composition in Bulgaria—Grid Computing Simulations. In Large-Scale Scientific Computing. LSSC 2013. Lecture Notes in Computer Science, 8353; Lirkov, I., Margenov, S., Waśniewski, J., Eds.; Springer: Berlin/Heidelberg, Germany, 2014; pp. 484–490. [Google Scholar]
  26. Gadzhev, G.; Ganev, K.; Miloshev, N.; Syrakov, D.; Prodanova, M. Analysis of the processes which form the air pollution pattern over Bulgaria. In International Conference on Large-Scale Scientific Computing; 8353 LNCS; Springer: Berlin/Heidelberg, Germany, 2014; pp. 390–396. [Google Scholar]
  27. Georgieva, I.; Gadzhev, G.; Ganev, K.; Prodanova, M.; Syrakov, D.; Miloshev, N. Numerical study of the air quality in the city of Sofia–Some preliminary results. Int. J. Environ. Pollut. 2015, 57, 162–174. [Google Scholar] [CrossRef]
  28. Georgieva, I.; Gadzhev, G.; Ganev, K.; Melas, D.; Wang, T. High Performance Computing Simulations of the Atmospheric Composition in Bulgaria and the City of Sofia. Cybern. Inf. Technol. 2017, 17. [Google Scholar] [CrossRef]
  29. Dimitrova, R. Air flows and pollution transport in the Sofia valley under highly stable background conditions. Bulg. Geoph. J. 2001, XXVII, 124–136. [Google Scholar]
  30. Ganev, K.; Dimitrova, R.; Miloshev, N. Air flows and pollution transport in the Sofia valley under some typical background conditions. In Air Pollution Modeling and Its Application XVI; Borrego, C., Incecik, S., Eds.; Springer: Boston, MA, USA, 2003; pp. 593–594. [Google Scholar]
  31. Syrakov, D.; Etropolska, I.; Prodanova, M.; Slavov, K.; Ganev, K.; Miloshev, N.; Ljubenov, T. Downscaling of Bulgarian Chemical Weather Forecast from Bulgaria region to Sofia city. Proc. Am. Inst. Phys. 2013, 1561, 120–132. [Google Scholar] [CrossRef]
  32. Todorova, A.; Syrakov, D.; Gadzhev, G.; Georgiev, G.; Ganev, K.; Prodanova, M.; Miloshev, N.; Spiridonov, V.; Bogatchev, A.; Slavov, K. Grid computing for atmospheric composition studies in Bulgaria. Earth Sci. Inform. 2010, 3, 259–282. [Google Scholar] [CrossRef]
  33. Etropolska, I.; Syrakov, D.; Ganev, K.; Prodanova, M.; Miloshev, N.; Slavov, K.; Jordanov, G. A system for information and forecasting of air quality over Bulgaria. In Proceedings of the 13th International Conference on Harmonisation within Atmospheric Dispersion Modelling for Regulatory Purposes, Paris, France, 1–4 June 2010; pp. 530–534, ISBN 2-8681-5062-4. [Google Scholar]
  34. Syrakov, D.; Prodanova, M.; Etropolska, I.; Ganev, K.; Miloshev, N.; Slavov, K.; Jordanov, G. Automated system for chemical weather forecast in Bulgaria. Bulg. J. Meteorol. Hydrol. 2011, 16, 30–40. [Google Scholar]
  35. Syrakov, D.; Prodanova, M.; Etropolska, I.; Slavov, K.; Ganev, K.; Miloshev, N.; Ljubenov, T. A Multy-Domain Operational Chemical Weather Forecast System. In Large-Scale Scientific Computing. LSSC 2013. Lecture Notes in Computer Science 8353; Lirkov, I., Margenov, S., Waśniewski, J., Eds.; Springer: Berlin/Heidelberg, Germany, 2014; pp. 413–420. [Google Scholar] [CrossRef]
  36. Syrakov, D.; Prodanova, M.; Georgieva, E. Performance of the Bulgarian WRF-CMAQ modelling system for three subdomains in Europe. Física de la Tierra 2015, 27, 137–153. [Google Scholar]
  37. Syrakov, D.; Prodanova, M.; Georgieva, E.; Etropolska, I.; Slavov, K. Simulation of European air quality by WRF–CMAQ models using AQMEII-2 infrastructure. J. Comput. Appl. Math. 2015, 293, 232–245. [Google Scholar] [CrossRef]
  38. Georgieva, E.; Syrakov, D.; Prodanova, M.; Etropolska, I.; Slavov, K. Evaluating the performance of WRF-CMAQ models in Bulgaria by means of the delta tool. In Proceedings of the 16th International Conference on Harmonisation within Atmospheric Dispersion Modelling for Regulatory Purposes, Varna, Bulgaria, 8–11 September 2014; pp. 304–308. [Google Scholar]
  39. Georgieva, E.; Syrakov, D.; Prodanova, M.; Etropolska, I.; Slavov, K. Evaluating the performance of WRF-CMAQ air quality modelling system in Bulgaria by means of the DELTA tool. Int. J. Environ. Pollut. 2015, 57. [Google Scholar] [CrossRef]
  40. Gadzhev, G.; Ganev, K.; Syrakov, D.; Miloshev, N.; Prodanova, M. Contribution of Biogenic Emissions to the Atmospheric Composition of the Balkan Region and Bulgaria. Int. J. Environ. Pollut. 2012, 50, 130–139. [Google Scholar] [CrossRef]
  41. Skamarock, W.C.; Klemp, J.B.; Dudhia, J.; Gill, D.O.; Barker, D.M.; Duda, M.G.; Huang, X.-Y.; Wang, W.; Powers, J.G. A Description of the Advanced Research WRF Version 3; NCAR Tech. Note NCAR/TN-475+STR.; University Corporation for Atmospheric Research: Boulder, CO, USA, 2008. [Google Scholar] [CrossRef]
  42. Byun, D.W.; Schere, K.L. Review of the governing equations, computational algorithms, and other components of the models-3 community multiscale air quality (CMAQ) modeling system. Appl. Mech. Rev. 2006, 59, 51–77. [Google Scholar] [CrossRef]
  43. Petrov, A. Analysis of modelled distribution of air pollutants around buildings at different meteorological conditions. Bulg. J. Meteorol. Hydrol. 2019, 23, 58–68. (In Bulgarian) [Google Scholar]
  44. CERC_ADMS-Urban5.0_User_Guide.pdf. Available online: https://www.cerc.co.uk/environmental-software/assets/data/doc_userguides/CERC_ADMS-Urban5.0_User_Guide.pdf (accessed on 29 January 2021).
  45. Stocker, J.; Hood, C.; Carruthers, D.; McHugh, C. ADMS-Urban: Developments in modelling dispersion from the city scale to the local scale. Int. J. Environ. Pollut. 2012, 50, 308–316. [Google Scholar] [CrossRef]
  46. Hood, C.; MacKenzie, I.; Stocker, J.; Johnson, K.; Carruthers, D.; Vieno, M.; Doherty, R. Air quality simulations for London using a coupled regional-to-local modelling system. Atmos. Chem. Phys. 2018, 18, 11221–11245. [Google Scholar] [CrossRef] [Green Version]
  47. Biggart, M.; Stocke, J.; Doherty, R.M.; Wild, O.; Hollaway, M.; Carruthers, D.; Li, J.; Zhang, Q.; Wu, R.; Kotthauset, S.; et al. Street-scale air quality modelling for Beijing during a winter 2016 measurement campaign. Atmos. Chem. Phys. 2020, 20, 2755–2780. [Google Scholar] [CrossRef] [Green Version]
  48. Sofia Municipality. Atmospheric Air Quality Management Program of Capital Municipality for the Period 2015–2020–Reduction of Emissions and Reach of the Established Norms for Fine Particles PM10. Available online: https://www.sofia.bg/documents/20182/298121/Project_Program_KAV_Sofia_2015–2020.pdf/23a572ba-77ac-45a4-b627-c77ea0e225c7 (accessed on 29 January 2021). (In Bulgarian)
  49. Sofia Municipality. Program for Supplementation of the Program Atmospheric Air Quality Management Program of Capital Municipality for the Period 2015–2020-Reduction of Emissions and Achievement of the Established Norms for Fine Particles PM10, by Indicators Fine Particles with Size up to 2.5 Microns and Polycyclic Aromatic Hydrocarbons. Available online: https://air.sofia.bg/media/Documents/R.523-Pr1.pdf (accessed on 29 January 2021). (In Bulgarian)
  50. Willmott, C.J. On the validation of models. Phys. Geogr. 1981, 2, 184–194. [Google Scholar] [CrossRef]
  51. Sofia Municipality. Program for Improving the Air Quality on the Territory of Sofia Municipality for the Period 2021–2026. Available online: https://sofia.bg/web/guest/programa-kav/-/asset_publisher/4gAwAlBEGMRL/content/proekt-predvaritelen-variant-na-kompleksna-programa-za-podobravane-kacestvoto-na-atmosfernia-v-zduh-na-teritoriata-na-stolicna-obsina-za-perioda-2021-?redirect=%2Fweb%2Fguest%2Fprograma-kav&inheritRedirect=true (accessed on 29 January 2021). (In Bulgarian)
  52. COPERT. Available online: https://www.emisia.com/utilities/copert-street-level/ (accessed on 29 January 2021).
  53. Atmospheric Emissions Inventory Toolkit, User Guide v. 3.4 CERC, June 2015, Cambridge, UK. Available online: https://www.cerc.co.uk/environmental-software/EMIT-tool.html (accessed on 29 January 2021).
  54. AERMOD. Available online: https://www.epa.gov/scram/air-quality-dispersion-modeling-preferred-and-recommended-models#aermod (accessed on 29 January 2021).
Figure 1. Area of the simulations with all types of emission sources described—(a) point (industrial stacks), (b) roads, (c) domestic heating, and (d) unorganized transport.
Atmosphere 12 00423 g001
Figure 2. Map of the topography and the measurement sites locations used for model validation (all sites without Kopitoto), background concentration (Kopitoto), and meteorological conditions (Druzhba).
Atmosphere 12 00423 g002
Figure 3. Monthly wind roses constructed by hourly data at Druzhba site used for simulations: January (a), February (b), March (c), April (d), May (e), June (f), July (g), August (h), September (i), October (j), November (k) and December (l).
Atmosphere 12 00423 g003
Figure 4. Annual mean concentration (µg m−3) of PM10 (at all sites) and PM2.5 (at Hipodruma only): simulated values without (blue) and with added (orange) background concentration, and calculated from observations (grey).
Atmosphere 12 00423 g004
Figure 5. Averaged concentrations (µg m−3) based on daily mean values of particulate matter with a diameter of 10 μm or less (PM10) (a,b), with a diameter of 2.5 μm or less (PM2.5) (c,d), and polycyclic aromatic hydrocarbon (PAH) (e,f) for cold (left column) and warm (right column) seasons.
Atmosphere 12 00423 g005aAtmosphere 12 00423 g005b
Figure 6. Contribution of different sources (in %) to the averaged concentration of PM10 for road transport during cold (a) and warm (e) seasons; unorganized transport during cold (b) and warm (f) seasons; point sources during cold (c) and warm (g) seasons; and domestic heating during cold season (d).
Atmosphere 12 00423 g006aAtmosphere 12 00423 g006b
Figure 7. Contribution of different sources (in %) to the averaged concentration of PM2.5 for road transport during cold (a) and warm (e) seasons; unorganized transport during cold (b) and warm (f) seasons; point sources during cold (c) and warm (g) seasons; and domestic heating during cold season (d).
Atmosphere 12 00423 g007aAtmosphere 12 00423 g007b
Figure 8. Contribution of different sources (in %) to the averaged concentration of PAH for road transport during cold (a) and warm (e) seasons; unorganized transport during cold (b) and warm (f) seasons; point sources during cold (c) and warm (g) seasons; and domestic heating during cold season (d).
Atmosphere 12 00423 g008aAtmosphere 12 00423 g008b
Figure 9. Contribution of different sources to the annual mean concentration over the entire domain for PM10 (a), PM2.5 (b), and PAH (c).
Atmosphere 12 00423 g009
Figure 10. Maps based on daily maximum simulated concentrations for PM10 (a), PM2.5 (b), and PAH (c).
Atmosphere 12 00423 g010
Table 1. Summary of statistics for different observational sites calculates for the year, cold and warm seasons.
Statistical MeasuresMBMERMSEIA
YEAR 2014
Druzhba—PM10−15.2920.5133.600.39
Nadezhda—PM10−14.5818.6833.140.37
Orlov most—PM10−4.7926.9142.960.43
Pavlovo—PM1018.9834.1543.840.61
Hipodruma—PM10−11.2724.4844.880.29
Hipodruma—PM2.5−8.4919.6538.510.24
COLD SEASON
Druzhba—PM10−29.5032.6346.350.18
Nadezhda—PM10−27.7530.8046.170.20
Orlov most—PM10−22.3438.5758.190.36
Pavlovo—PM104.5234.7349.650.70
Hipodruma—PM10−30.2638.0162.370.13
Hipodruma—PM2.5−26.0029.8353.590.08
WARM SEASON
Druzhba—PM10−1.178.4710.790.89
Nadezhda—PM10−1.606.728.870.90
Orlov most—PM1012.1915.6318.860.71
Pavlovo—PM1033.3533.5737.180.18
Hipodruma—PM107.3411.2213.230.86
Hipodruma—PM2.58.789.6110.630.86
Table 2. Summary of mean values and SD for different observational sites calculates for the year, cold and warm seasons.
Statistical MeasuresMeanSD
Observational SiteObservationModelObservationModel
YEAR 2014
Druzhba—PM1045.2529.9730.703.92
Nadezhda—PM1041.5626.9730.054.30
Orlov most—PM1054.0949.3147.3312.59
Pavlovo—PM1049.4968.4747.4220.68
Hipodruma—PM1046.7435.4745.745.67
Hipodruma—PM2.531.3022.8038.664.00
COLD SEASON
Druzhba—PM1059.6630.1636.884.59
Nadezhda—PM1054.1126.3737.815.14
Orlov most—PM1074.4152.6058.8614.79
Pavlovo—PM1070.9375.4458.9521.58
Hipodruma—PM1066.8836.6248.256.71
Hipodruma—PM2.549.1723.1748.254.48
WARM SEASON
Druzhba—PM1030.9429.7710.983.11
Nadezhda—PM1029.1627.578.853.17
Orlov most—PM1033.6345.8213.219.19
Pavlovo—PM1028.1961.5411.3817.19
Hipodruma—PM1027.0034.3411.324.14
Hipodruma—PM2.57.1222.447.123.44
Publisher’s Note: MDPI stays neutral with regard to jurisdictional claims in published maps and institutional affiliations.

