Abstract
The Caribbean, along with other small island developing states (SIDS), have advocated for restricting global warming to 1.5 °C above pre-industrial levels by the end of the current century. Solar radiation management (SRM) may be one way to achieve this goal. This paper examines the mean Caribbean climate under various scenarios of an SRM-altered versus an SRM-unaltered world for three global warming targets, namely, 1.5, 2.0 and 2.5 °C above pre-industrial levels. Data from the Geoengineering Model Intercomparison Project Phase 1 (GeoMIP1) were examined for two SRM scenarios: the G3 experiment where there is a gradual injection of sulfur dioxide (SO2) into the tropical lower stratosphere starting in 2020 and terminating after 50 years, and the G4 experiment where a fixed 5 Teragram (Tg) of SO2 per year is injected into the atmosphere starting in 2020 and ending after 50 years. The results show that SRM has the potential to delay attainment of the 1.5, 2.0 and 2.5 °C global warming targets. The extent of the delay varies depending on the SRM methodology but may be beyond mid-century for the 1.5 °C goal. In comparison, however, the higher temperature thresholds are both still attained before the end of century once SRM is ceased, raising questions about the value of the initial delay. The application of SRM also significantly alters mean Caribbean climate during the global warming target years (determined for a representative concentration pathway 4.5 (RCP4.5) world without SRM). The Caribbean is generally cooler but drier during the 1.5 °C years and similarly cool but less dry for years corresponding to the higher temperature targets. Finally, the mean Caribbean climate at 1.5 °C differs if the global warming target is achieved under SRM versus RCP4.5. The same is true for the higher warming targets. The implications of all the results are discussed as a background for determining whether SRM represents a viable consideration for Caribbean SIDS to achieve their “1.5 to stay alive” goal.
1. Introduction
Small island developing states (SIDS), such as those in the Caribbean, are among the most vulnerable to climate change and its impacts. These regions are extremely sensitive to climate due to their small size, complex topologies, reliance on climate sensitive economic activities (e.g., agriculture and tourism) and overwhelming dependence on rainfall for water, amongst other things [1,2,3,4,5].
SIDS, including the islands of the Caribbean, have been advocating for global mean temperatures to be held to a maximum of 1.5 °C above preindustrial levels by the end of the current century [6]. For SIDS, the long-term temperature goal (LTTG) of 1.5 °C is seen as a point above which adaptation capabilities and capacities will be exceeded [5]. For instance, at 1.5 °C the Caribbean is projected to experience (i) moderate to extreme drought approximately 16% of the time, (ii) a marked increase in the temperature humidity index (THI) and severe heat stress for livestock; and (iii) a 40% reduction in hydropower potential in Afobaka, Suriname, ref. [1,6,7,8]. Notwithstanding the Paris Climate Agreement [9], there is much pessimism as to whether the 1.5 °C or even an upper 2.0 °C LTTG on which the agreement is premised is truly attainable [10]. Studies have indicated that emissions under current Nationally Determined Contributions (NDCs) will result in warming closer to 3 °C at the end of the century [1,11]. Some studies have, however, suggested that an LTTG of 1.5 °C may still be possible, (e.g., [12]) but would demand immediate global attention and significant lifestyle changes [13].
Geoengineering, specifically solar radiation management (SRM), is proposed as one probable solution to temporarily reduce and/or drastically slow the increase in temperature under global warming. Geoengineering is the intentional manipulation of the Earth’s environment, on a macro scale, to reduce global temperatures. Geoengineering can be classified into two major types—solar radiation management (SRM) and carbon dioxide (CO2) removal. CO2 Removal entails removing CO2 from the atmosphere and having it sequestered, while SRM speaks to efforts to reflect solar radiation into space; see, for instance, ref. [14,15]. While geoengineering may represent a possible pathway to the 1.5 °C target, there has been little or no analysis of its potential effects on regions such as the Caribbean, where lifestyle and livelihoods are strongly linked to climate; see, for instance, ref. [13]. Given that Caribbean islands were among the proponents of a 1.5 °C world, the question arises of whether or not the Caribbean should embrace this methodology.
This paper aims to assist the Caribbean in formulating its stance on the use of geoengineering as a means of achieving the future global warming target they advocated for. Specifically, the study uses output from the Geoengineering Model Intercomparison Project (GeoMIP) to explore the possible effects and value of implementing SRM geoengineering solutions for the Caribbean. The study explores: (i) How much time SRM geoengineering could buy the Caribbean before the attainment of global warming targets of 1.5, 2.0 and 2.5 degrees above per-industrial levels. (ii) How the climate of the Caribbean would differ for years when an unaltered world (“unaltered” is being used to indicate a world where no geoengineering solution is applied) attains 1.5, 2.0 and 2.5 degrees versus the same years with SRM geoengineering applied. (iii) How the climate of the Caribbean would differ for an SRM-unaltered world at 1.5, 2.0 and 2.5 degrees versus an SRM geoengineered world at the same temperature targets.
The paper is laid out as follows. Section 2 details the domain, data and methodology utilized in the study. Section 3 explores LTTG temperature attainment dates with and without SRM and presents the mean Caribbean climate at these targets under various SRM scenarios. Section 4 presents a discussion of the main findings.
2. Data and Methodology
2.1. Domain
Figure 1 shows the Intra-America Seas, including the Caribbean, Central America and northern South America. Subsequent analyses are restricted to the Caribbean, which for the study is defined as the geographical region bounded by latitudes 5° N to 25° N and longitudes 60° W to 90° W. This definition is similar to that utilized in past studies of the region—for example, ref. [1,16,17].
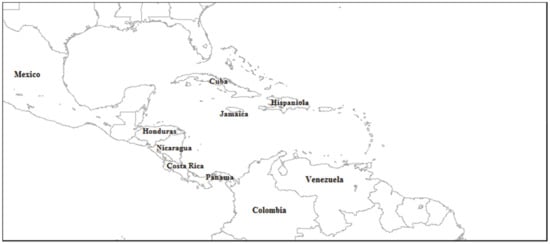
Figure 1.
The Intra-America Seas including the Caribbean, Central America and northern South America.
2.2. Data
Model data were from HadGEM2-ES [18] runs under: (i) The Coupled Model Intercomparison Project Phase 5—CMIP5 [19], and (ii) The Geoengineering Model Intercomparison Project Phase 1—GeoMIP1 [20]. HadGEM2-ES is a coupled atmosphere/ocean general circulation model (AOGCM) with atmospheric resolution of 1.875° × 1.25° with 38 levels and ocean resolution of approximately 1° with 40 levels. HadGEM2-ES is described in detail in [18].
With respect to GeoMIP1, data were from HadGEM2-ES runs configured utilizing conditions based on the G3 and G4 experiments. Both the G3 and G4 experiments are premised on representative concentration pathway 4.5 (RCP4.5). RCP4.5 is one of four projected pathways related to possible greenhouse gas (GHG) trajectories and is characterized by emissions peaking at around 2040 and radiative forcing which stabilizes at approximately 4.5 W m−2 after 2100 [21]. In this study, RCP4.5 is referred to as the “unaltered” world; the SRM-unaltered world is assumed to be on a RCP4.5 pathway through to 2100, leading to warming of around 2.5 °C above pre-industrial levels; see, for instance, ref. [1,22]. Under the G3 experiment, there is a gradual injection of sulfur dioxide (SO2) into the tropical lower stratosphere starting in 2020 and terminating after 50 years. This is to balance long wave radiative forcing, keeping it relatively constant over the period. For the G4 experiment, a fixed 5 Tera gram (Tg) of SO2 per year is injected into the lower stratosphere starting in 2020 and ending after 50 years. This immediately produces a negative radiative forcing which thereafter increases at a rate approximately equal to that of RCP4.5. Figure 2 extracted from [20] summarizes the G3 and G4 experiments in comparison to the SRM-unaltered RCP4.5 world. For more details on the G3 and G4 experiments see [20].
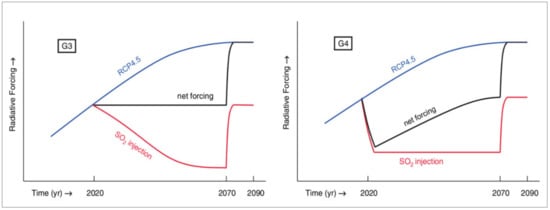
Figure 2.
Geoengineering Model Intercomparison Project (GeoMIP) scenarios. The G3 experiment is configured to approximately balance positive radiative forcing from representative concentration pathway 4.5 (RCP4.5) by injecting SO2 into the tropical lower stratosphere. The G4 experiment produces immediate negative radiative forcing by injecting SO2 into the tropical lower stratosphere at a rate of 5 Tg per year. Adapted from [20].
The HadGEM2-ES model was chosen as, at the time of this study and to the best of our knowledge, it is the only model available with runs from both the G3 and G4 experiments. It has also been shown to simulate reasonably well the precipitation climatology of the Caribbean region (see, for example, the earlier studies of [1,23]. All experiments had data available for each of three realizations (r1i1p1, r2i1p1 and r3i1p1), all of which are utilized in the study. Each realization differs only by initial conditions—i.e., the model physics in each run remain unchanged. Monthly precipitation and surface air temperature are extracted from all realizations for the period 1860 to 2100.
For comparison with the model data in the present-day period, precipitation data from the Global Precipitation Climatology Project (GPCP) [24] and ERA5 reanalysis [25] were used. For air temperature, the comparison was done using ERA5 for consistency with the rainfall analysis and the NCEP Reanalysis 2 [26] dataset. Gridded reference products (as opposed to station data) were used for several reasons, including (i) the coarse resolution of the HadGEM2-ES model relative to the small islands of the Caribbean region; (ii) limitations with availability, consistency and quality of station data across, especially the Caribbean islands [27]; and (iii) the focus of this study on a domain-wide analysis, as opposed to an examination of the future climates of specific territories. As seen in Figure 1, most of the domain is open ocean, which precluded the use of gridded land-only products. Jury (2009) [28] showed that the GPCP blend of gauges and satellite data captures key rainfall features and ocean-island patterns in the Caribbean, while Centella-Artola (2020) [27] showed that amongst six reanalysis products examined for Caribbean rainfall, ERA5 performed well if not best. NCEP Reanalysis 2 have been previously used in a limited number of temperature focused studies done for the Caribbean (see, for example, ref. [2,29,30]).
2.3. Methodology
Five tasks were undertaken: Task 1—temporal analysis of LTTGs of 1.5 °C, 2.0 °C, and 2.5 °C with and without SRM Geoengineering. Task 2—simple model validation. Task 3—characterizing the mean future climate of the Caribbean at the three LTTGs for the SRM-unaltered world (i.e., for RCP4.5). Task 4—analyzing changes to the future mean Caribbean climate during the SRM-unaltered LTTG years if instead SRM is applied. Task 5—analyzing changes to the future mean Caribbean climates at the three LTTGs achieved without and with SRM application. A description of each task follows.
2.3.1. Task 1—Attainment of Global LTTGs of 1.5, 2.0 and 2.5 °C with and without SRM Geoengineering
Caribbean advocacy is premised on 1.5 °C being attained at the end of the current century thereby allowing the region time to adapt to the challenges that the warming threshold will bring. Recent studies, however, show that the 1.5 °C LTTG may be attained as early as 10 years from now (2030 to 2052) depending on RCP pathway [13]. Task 1 starts by assuming a world on an RCP4.5 pathway and seeks to answer the question: “How much more time could geoengineering buy the world before the attainment of 1.5, 2.0 and 2.5 degrees?”
Anomaly time series of mean global surface air temperature were created for the RCP4.5 HadGEM2-ES individual runs (hereafter HadGEM_unaltered) for 1860 to 2100. Anomalies are with respect to the pre-industrial period, which is taken as 1860 to 1900 [13]. The individual time series were also averaged to create an ensemble mean. Similar global anomaly time series and ensemble means were created for HadGEM2-ES run under the G3 and G4 experiments (hereafter G3 and G4) for the period 2020 to 2090. All times series were smoothed using an 11-year running mean, and the smoothed time series were used to determine the first year that the mean global temperature attains each global warming target of 1.5, 2.0 and 2.5 °C, with all subsequent years being higher. The use of 11 years is consistent with Taylor (2018) [1] and enables a comparison with those results. The smoothed ensemble mean time series were also used to calculate linear trends if SRM was to continue for more than the 50 years assumed in the G3 and G4 experiments, and for the period of rapid rise in temperature when SRM is turned off in the year 2070.
2.3.2. Task 2—Model Validation
The HadGEM model has been previously validated for use in the Caribbean region; see, for instance, ref. [1,23]. Notwithstanding, a simple validation of HadGEM2-ES was done by comparing it to model derived climatological plots with similar plots from gridded reference datasets for the period 1985 to 2005. The aim was to substantiate that key large-scale features of the annual cycle of the domain (for example, the bimodal precipitation cycle) are indeed being captured by the model. (See for example, ref. [23], for a more rigorous evaluation). The base period is common to both the model and reference datasets. For the time series diagrams, area averages of rainfall and temperature were determined for the Caribbean domain previously defined, and the mean monthly values plotted. Especially for the eastern Caribbean, it is again noted that the averaging is largely over the ocean, as the small islands would not be captured by the coarse resolutions of the model and datasets. For the spatial plots, composites were are created for the mean annual climate and four pre-defined two or three-months rainfall “seasons.” These are December–January–February (DJF) representing the main Caribbean dry season; May–June–July (MJJ) and August–September–October–November (ASON) representing, respectively, the early and late rainfall seasons; and July–August (JA) representing the Caribbean’s mid-summer drought period, ref. [17,31]. It was the model ensemble mean of the air temperature and precipitation data that were used for this and all subsequent analyses.
2.3.3. Task 3—Caribbean Climate at 1.5, 2.0 and 2.5 °C (No SRM)
The mean climate of the Caribbean was determined at the 1.5, 2.0 and 2.5 °C LTTGs for HadGEM_unaltered. Climatologies averaged over the Caribbean, and seasonal and annual plots of precipitation and air temperature were created for the 11-year period centered on the years determined in Task 1 when HadGEM_unaltered ensemble mean first attains global average temperatures of 1.5, 2.0 and 2.5 °C above preindustrial levels. The annual and seasonal plots are presented as differences with respect to similar plots created for the pre-industrial period (1860–1900). By presenting as differences, the assumption is that model biases seen in the validation process are consistent in the future (i.e., stationarity) and that the changes noted are therefore due to the changes in radiative forcing. The time sampling approach utilized has previously been used to determine the mean climate of the Caribbean [1] and other parts of the world (see for example [32,33] at time periods corresponding to the warming targets. This is as opposed to determining the climate for pre-defined future time slices. Some of the pros and cons of time sampling are discussed by [34].
2.3.4. Task 4—The Effect of Applying SRM to Future Caribbean Climates at 1.5, 2.0 and 2.5 °C
Task 4 sought to answer the question: “How would the mean climate of the Caribbean at 1.5, 2.0 and 2.5 °C in the SRM-unaltered world change if SRM geoengineering was instead applied?” The climatologies and plots of Task 3 are compared with similarly derived results from the G3 and G4 experiments centered on the same 1.5, 2.0 and 2.5 °C LTTG years determined from HadGEM_unaltered. The comparison is between identical future time slices but for an SRM-unaltered versus an SRM-altered world. Note that for these time slices, the G3 and G4 experiments did not attain global average temperatures of 1.5, 2.0 and 2.5 °C above preindustrial levels. The comparison was done by differencing the unaltered and SRM-altered derived climatologies and maps.
2.3.5. Task 5—Comparison of Caribbean Climates at Temperature LTTGs Achieved with and without SRM
Finally, Task 5 sought to answer the question: “How (if at all) would the mean climate of the Caribbean at 1.5, 2.0 and 2.5 °C differ if SRM is used to achieve the temperature LTTGs?” The climatologies and plots of Task 3 are compared with similarly derived results from the G3 and G4 experiments centered on the 1.5, 2.0 and 2.5 °C LTTG years determined from their respective runs. The comparison, therefore, was between 11-year time periods which were sampled to coincide with the temperatures target years, but which were not necessarily the same for the various experiments.
3. Results
3.1. Task 1—Temporal Analysis of Temperature LTTGs with and without SRM Geoengineering
Figure 3 presents temperature anomaly plots for the ensemble means of HadGEM_unaltered (solid black line), G3 (solid blue line) and G4 (solid red line). As noted previously, anomalies are with respect to preindustrial levels (1860 to 1900). The impact of SRM in lowering global temperatures in the years following application is noticeable, as is the rapid rise in temperature during the years immediately following SRM cessation in 2070. Dotted lines in panel A depict trend lines for both the G3 and G4 experiments if SRM were to continue beyond 2070, while thin colored lines depict trend lines for the years of rapid rise in temperatures after SRM is discontinued. The rate of increase in temperature is given for all the trend lines.
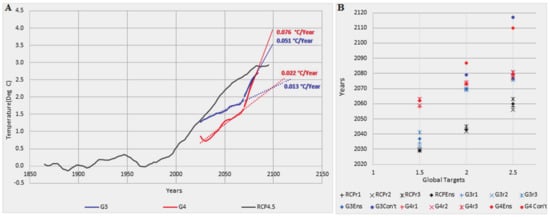
Figure 3.
(A): World temperature anomaly (with respect to 1860 to 1900) for ensemble mean of HadGEM2-ES_unaltered runs under RCP4.5 (solid black line) and HadGEM2-ES under G3 (solid blue line) and G4 (solid red line) conditions. Shown as well are the trend lines and the corresponding rates of temperature increase if SRM is continued onward from 2070 (dotted lines) and for the sharp rise in temperature that is projected after SRM is discontinued in 2070 (solid thin lines). (B): Years when global average temperatures are expected to reach 1.5, 2.0 and 2.5 °C for unaltered and SRM-altered HadGEM2-ES. Results are for three realizations and the ensemble mean. Shown also are the years when G3 and G4 HadGEM2-ES (G3_Con’t and G4_Con’t) reach 2.0 and 2.5 °C if SRM is continued after 2017.
Table 1 and Panel B of Figure 3 capture the years when global average temperatures attain 1.5, 2.0 and 2.5 °C for HadGEM_unaltered, G3 and G4. Results are shown for individual realizations and the ensemble means. Shown as well are the years when the G3 and G4 ensemble means would reach 2.0 and 2.5 °C assuming SRM were to be continued after 2070. These are estimated from the linear trend lines and labelled G3_Con’t and G4_Con’t. Columns 2 through 4 of Table 1 summarize the years of attainment for the various scenarios.

Table 1.
List of years when HadGEM2-ES (unaltered and G3 and G4 ensemble means) first attain the 1.5, 2.0 and 2.5 °C global targets. Brackets in columns 2 through 4 indicate the ranges over the individual realizations. Given also are the 11 years blocks used to create the monthly climatology and spatial composite maps.
- In the absence of SRM, HadGEM_unaltered projects that the 1.5, 2.0 and 2.5 °C global warming targets are attained respectively in 2029 (range of 2029 to 2030), 2043 (range of 2042 to 2045) and 2060 (range of 2056 to 2063). For comparison, Taylor (2018) [1] shows average attainment dates of 2028, 2046 and 2070 for 10 CMIP models running RCP4.5.
- Employing G3 SRM slows the rate of temperature increase such that the 1.5, 2.0 and 2.5 °C global targets are delayed by 8, 27 and 17 years respectively compared to HadGEM_unaltered. The latter two years are achieved in the period of rapid temperature rise after SRM is discontinued. If, however, G3 SRM were continued beyond 2070 and assuming a linear rate of temperature rise, the 2.0 and 2.5 °C targets would be further delayed by 9 (total 36) and 40 (total 57) additional years, respectively.
- Employing G4 SRM would immediately reduce the global average temperature by more than 0.5 °C. The 1.5, 2.0 and 2.5 °C global targets would thereafter be delayed by as much as 33, 13 and 19 years respectively, compared to HadGEM_unaltered. Again, the latter two years are achieved in the period of rapid temperature rise after SRM is discontinued. If G4 SRM were continued beyond 2070, the 2.0 and 2.5 °C targets would be further delayed by 21 (total 44) and 31 (total 50) additional years, respectively.
- The delaying benefits of SRM are quickly reversed at cessation such that even the highest of the three warming targets is still attained before the end of the century for both the G3 and G4 experiments. Once discontinued in 2070, there is a rapid increase in air temperature over a short period, with the rate of increase moving from 0.022 °C/year (0.013 °C/year) to 0.076 °C/year (0.051 °C/year) for the G4 (G3) experiments.
3.2. Task 2—Simple Model Validation
Figure 4 presents the monthly climatology of precipitation and air temperature for the Caribbean covering the period 1985 to 2005. The HadGEM2-ES model reasonably captures the precipitation’s bimodal pattern. The model, however, overestimates rainfall in the early rainfall season when compared to both the GPCP and ERA5 datasets, and underestimates it in the late season when compared to ERA5. In the late season, however, the rainfall amounts are comparable to the GPCP data. Except then, for the early rainfall period, the model output follows closely the GPCP (gauge and satellite) dataset which, as noted earlier, reference [28] suggests reasonably captures Caribbean rainfall. The model intercomparison study of [23] similarly shows an overestimation of the first rainfall season by HadGEM2-ES. Notwithstanding, they too classify it as performing well in the region, and note that biases of this nature seem to be related to the ability of the models they evaluated to simulate the North Atlantic Subtropical High (NASH) influence on the region, the corresponding strength of the Caribbean Low-Level Jet (CLLJ) and/or the sea surface temperature in the Caribbean Sea and the Gulf of Mexico. HadGEM2-ES also captures the main features of the annual temperature pattern with highest temperatures in the summer months and lowest temperatures in the winter months. Temperature is, however, underestimated by 0.5 °C or less between December and September as compared to both reanalysis datasets.
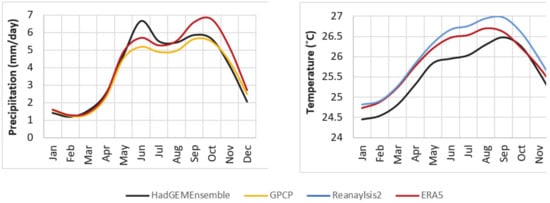
Figure 4.
Monthly climatology plots of precipitation (right) and air temperature (left) for the Caribbean from HadGEM2-ES (black), GPCP (yellow), Reanalysis2 (blue) and ERA 5 (red) datasets. Averaging period is 1985 to 2005.
Figure 5 depicts the mean annual and seasonal maps of air temperature (panel A) and precipitation (panel B) for the Caribbean region covering the period 1985 to 2005. The figure helps explain some of the biases seen in Figure 4.
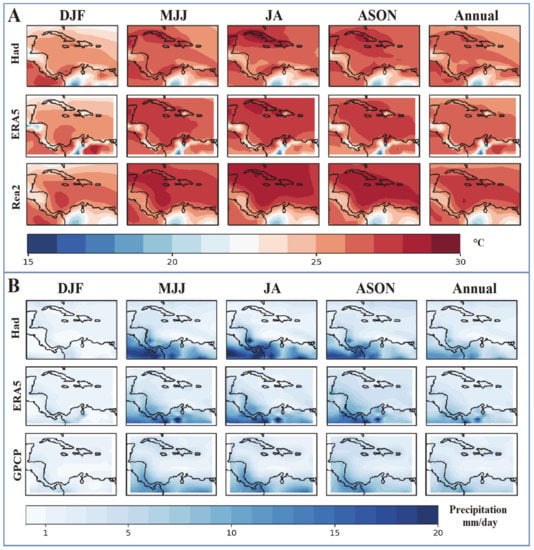
Figure 5.
Annual and seasonal climatology plots of air temperature (panel A) and precipitation (panel B) for the Caribbean for the period 1985 to 2005. Temperature plots are from HadGEM2-ES (row 1), ERA5 (row 2) and Reanalysis 2 (row 3) datasets. Precipitation plots are from HadGEM2-ES (row 1), ERA5 (row 2) and GPCP (row 3) datasets. Units for panels A and B are °C and mm/day, respectively.
The reanalysis datasets show similar large scale annual and seasonal patterns with cooler temperatures in the winter months, warmer temperatures in the summer months and the lowest temperatures over the high altitude regions in northern South America and Central America. Reanalysis 2, however, depicts slightly higher temperatures across all sections of the map and for all the seasons compared to ERA5. The HadGEM2-ES ensemble mean captures well the spatial pattern with the coolest temperatures in the southern part of the domain and in the winter months. Warmest temperatures in the summer months and in the central section of the domain are also captured, along with the low temperatures over the higher altitude areas of northern South America and Central America. The model, however, has a cool bias which is particularly evident in the first half of the year in the Central Caribbean Sea in the vicinity of the CLLJ and over the eastern parts of northern South America which are visible in the domain. It is this which seemingly accounts for the temperature underestimation noted in Figure 4.
Similarly to the air temperature data, there is wide scale agreement across the two reanalysis datasets and HadGEM2-ES for both the seasonal and annual precipitation patterns. Patterns that are reasonably captured include the dry period from December to February, the wet period from May to November and the precipitation maxima in the vicinity of Panama in the southwestern part of the domain [2]. HadGEM2-ES, however, overestimates precipitation amounts in this southwestern region (the Caribbean and tropical Pacific coasts of southern Central America) compared to the other two datasets, and particularly in the region’s early rainfall season. It is this which seemingly accounts for the MJJ overestimation noted in Figure 4. Coupled with the temperature bias, this might suggest that the overestimation is related to the model’s ability to simulate the CLLJ during this period. Though the dynamics related to the model biases bear further investigation, they are beyond the scope and primary focus of this paper, and will be undertaken in a future study.
3.3. Task 3—Mean Caribbean Climates during LTTG Years (No SRM)
Figure 6 presents composite difference maps of air temperature (panel A) and precipitation (panel B) for the 1.5, 2.0 and 2.5 °C LTTGs and the pre-industrial period (1860 to 1900). Data were from HadGEM_unaltered, i.e., for RCP4.5 with no SRM applied.
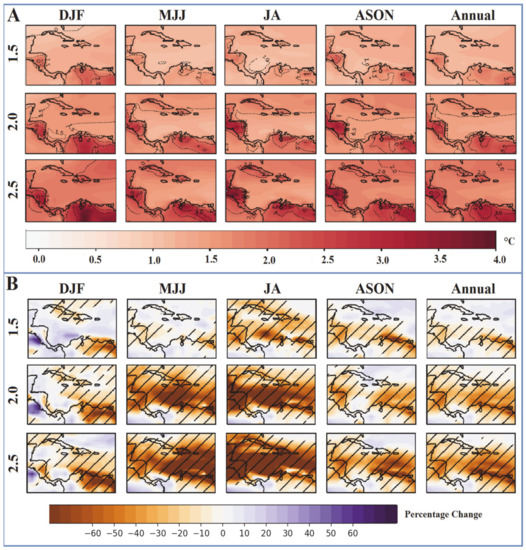
Figure 6.
Difference maps of air temperature (panel (A)) and precipitation (panel (B)) from HadGEM_unaltered. Differences are between the 11-year composites centered on when global average temperature attains the 1.5, 2.0 and 2.5 °C targets (row 1, columns 4–6 of Table 1) and composites of the pre-industrial period (1860 to 1900). For precipitation, differences are expressed as percentage changes with respect to the pre-industrial period. Statistically significant differences are hatched for precipitation.
In general, the central Caribbean is always slightly cooler than the global average by 0.5 °C or more. Reference [1] also notes this tendency and suggests it may in part be due to the small land masses in open water. The larger islands of the Greater Antilles (Cuba, Hispaniola and Jamaica) experience temperature increases in line with the global averages. In contrast, Central America in the vicinity of Honduras and Nicaragua, and northern South America, are slightly warmer than the global average by 0.5 °C or more. The highest temperature increases are experienced in the winter months (DFJ, column 1), with the greatest temperature increases being over the large land masses of Central and South America. The lowest temperature increases are in the spring and summer (MJJ and JA, columns 2 and 3 respectively); the smallest temperature increases are again noted over the waters of the central Caribbean.
Per annum and for all the defined seasons, the main Caribbean basin becomes increasingly drier for successively higher temperature LTTGs. At 1.5 °C drying is already present in the south and south-eastern Caribbean for the annual mean and across all seasons. In contrast, the north Caribbean shows slightly wetter conditions (though not statistically significant) except in the two dry seasons (DJF and JA). The area of significant drying increases northward and westward for 2.0 and 2.5 °C, representing a reversal of conditions in the north Caribbean and an intensification in the southern Caribbean. The smallest decreases in precipitation are observed in the winter months and there is a rainfall maximum over the Pacific side of Central America. The largest decreases in precipitation are observed in JA for 1.5 °C (≈40%) and in MJJ and JA (>60%) for the 2.0 and 2.5 °C years. It is noteworthy that whereas the half a degree transition from 1.5 °C to 2.0 °C is characterized by an intensification and even a reversal of trend from wetter to drier for the Caribbean, the half a degree transition from 2.0 to 2.5 °C does not proportionately alter the coverage and magnitude of the drying, which are similar for the two higher LTTGs. Reference [1] reports similar findings for changes in Caribbean rainfall patterns for the three temperature LTTGs.
3.4. Task 4—Mean Caribbean Climates during LTTG Years if SRM Is Applied
Figure 7 shows various climatological plots and differences for air temperature (left column) and precipitation (right column) during HadGEM_unaltered LTTG years and for the pre-industrial period. As noted (in Section 2.2), the time slices being compared are the same, i.e., irrespective of the experiment; averaging is over the Caribbean for the 11-year periods centered on when HadGEM_unaltered attains the temperature LTTGs (row 1, Table 1).
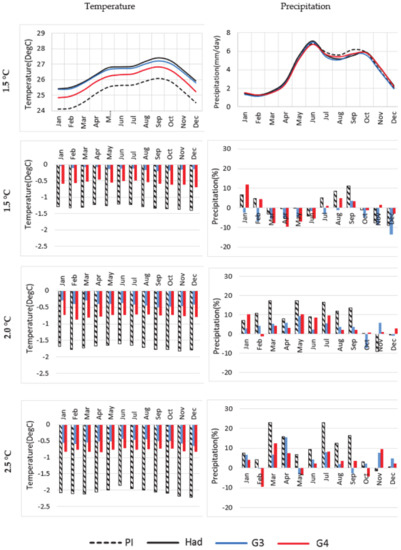
Figure 7.
Row 1: Climatology plots of air temperature (left panel) and precipitation (right panel) for HadGEM_unaltered, G3 and G4 at 1.5 °C, and for the preindustrial (PI) period (1860 to 1900). Rows 2 to 4: Difference plots between G3 (red), G4 (blue) and PI (hatched black) climatologies and the HadGEM_unaltered climatology at 1.5, 2.0 and 2.5 °C. respectively. Row 1 shows actual values while rows 2 to 4 show absolute and percentage differences.
Row 1 shows climatologies for HadGEM_unaltered (solid black line), G3 (blue line), G4 (red line) and the pre-industrial (PI) period (dotted line) for 1.5 °C. Similar plots were made for 2.0 and 2.5 °C but are not shown. Rows 2 through 4 depict changes from the mean Caribbean climate at the LTTG years due to the application of SRM and how much cooler, wetter or drier the pre-industrial period is compared to the mean Caribbean LTTG climate. Note that for the temperature plot being negative indicates a cooler SRM-altered climate than HadGEM_unaltered or a cooler pre-industrial period. Similarly, for the precipitation plots, a negative (positive) indicates a drier (wetter) SRM-altered climate than HadGEM_unaltered or a drier (wetter) pre-industrial period.
The following are noted from Figure 7:
- The plots in row 1 suggest that the Caribbean’s bimodal precipitation and temperature patterns continue to hold in the future under global warming. This is true for all three global temperature targets (patterns for 2.0 and 2.5 °C not shown), irrespective of the application of SRM.
- The pre-industrial minus HadGEM_unaltered temperature plots (column 1, hatched black bars in rows 2–4) suggest that the Caribbean is always a few tenths of a degree cooler than the global average. This was also noted from Figure 6 and by Taylor (2018) [1]. At the LTTGs, the highest temperature increases in the Caribbean are consistently experienced in the winter months, whilst lowest temperature increases are experienced in the spring and summer.
- Applying SRM under G3 (G4) lowers the mean Caribbean air temperatures during the global warming target years. Monthly temperatures for the HadGEM_unaltered are lowered between 0.05 and 0.20 °C (0.46 to 0.69 °C) for 1.5 years; 0.29 and 0.50 °C (0.72 to 0.87 °C) for 2.0 years; and 0.44 to 0.66 °C (0.72 to 0.85 °C) for 2.5 years for G3 (G4). Summer months experience less reduction. G4 consistently produces a greater reduction in future air temperatures than G3 at each temperature LTTG. The difference in cooling effect due to G4 versus G3 is largest at 1.5 °C, likely due to the SRM methodology for G4 which is characterized by sudden injection of SO2.
- The pre-industrial minus HadGEM_unaltered precipitation plot (hatched black bars) shows mixed monthly tendencies in Caribbean precipitation at the 1.5 °C LTTG (row 2, column 2). During the pre-industrial period, January–February and July–September are between 5 and 11% wetter, while the other months are either minimally or up to 9% drier than at 1.5 °C. Otherwise stated, the months January, February, July, August and September become wetter at 1.5 °C, and the other months, including the peak rainy of season months, show small changes or are slightly drier. At 2.0 °C, however, a dominant pattern emerges, with January to September during the pre-industrial period being wetter (or the mean Caribbean during these months being drier at 2.0 °C) by up to 17%. The 2.0 °C pattern is mirrored for 2.5 °C with identical months showing identical tendencies, but with the peak change in March and July exceeding 20%. It is noted that Figure 6 suggests a similar region-wide onset of predominantly dry conditions above the LTTG of 1.5 °C which is maintained or slightly intensified for the higher LTTG. Reference [1] also made a similar observation.
- Compared to HadGEM_unaltered, monthly G3 (G4) changes in precipitation range between −13 and 4% (−9 to 12%) for 1.5 °C. Except in November, G4 shares the same tendency as for the pre-industrial period; i.e., January–February and July–September are wetter than HadGEM_unaltered at 1.5 °C, while the other months are either minimally or up to 12% drier. In comparison, G3 is always drier than HadGEM_unaltered except during September. Note, then, that there is less precipitation during the two rainfall peak months (June and October) due to SRM (G3 and G4) than if it were not applied. In comparison, for the 2.0 °C years, monthly G3 (G4) precipitation differences range between −7 and 9% (−1 to 10%), while for the 2.5 °C years the differences range between −3 and 16% (−9 to 12%). At these higher warming targets, there is a pattern for more rainfall (or less drying) from January through November under SRM (exceptions are G4 in February and G3 in October at 2.0 °C, and G4 in February and October and both G3 and G4 in May at 2.5 °C), though the change is never enough to restore rainfall to the level simulated during the pre-industrial period. Under this pattern, however, unlike at 1.5 °C, there is more rain in June for both the 2.0 and 2.5 °C years compared to the unaltered climate.
Figure 8 and Figure 9 present composites of air temperature and rainfall, respectively, for G3 and G4 minus HadGEM_unaltered at 1.5, 2.0 and 2.5 °C. As before, the LTTG years are determined for an SRM-unaltered world. In Figure 8 the ±0.5 °C contour is plotted for ease of reference.
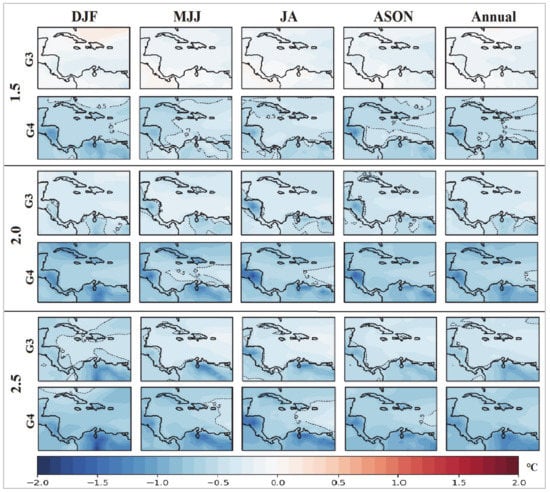
Figure 8.
Difference maps of air temperature for G3 and G4 with respect to HadGEM2_unaltered. Differences are between composites derived for the 11-year periods centered on when HadGEM_unaltered indicates global average temperatures attain the 1.5, 2.0 and 2.5 °C long-term temperature goals (LTTGs). Units are °C. The ±0.5 °C contour is plotted for reference.
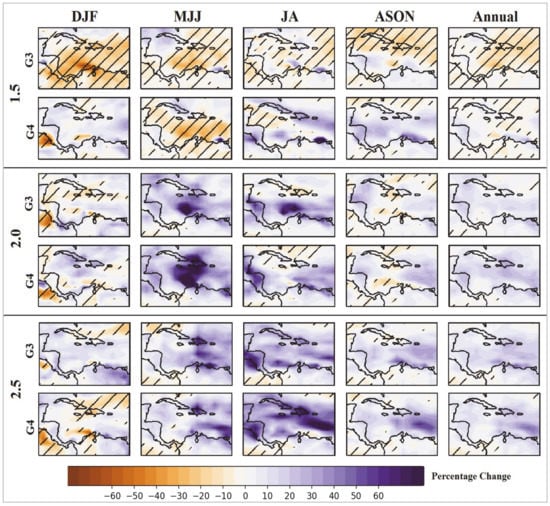
Figure 9.
Same as Figure 8 but for percentage change in precipitation. Units are in percent.
Both G3 and G4 result in lower temperatures across the region than for the unaltered world though not to the same extent (Figure 8). This is across all seasons. For both experiments the amount of cooling increases for successively higher LTTGs though the magnitude of change between contemporaneous conditions going from 2.0 °C to 2.5 °C is less discernible than that between 1.5 °C and 2.0 °C. This is also seen in the temperature plots of Figure 7. Additionally common to both experiments are greater cooling for higher altitude areas, such as the mountainous regions of South and Central America, which especially at the higher temperature LTTGs may be up to 1 °C cooler. Importantly, G4 shows greater temperature reductions than G3. For example, for the annual mean at 1.5 °C, whereas much of the region under G4 shows reduction of more than 0.5 °C and even up to 1.0 °C over the continental regions, G3 shows in comparison very small temperature decreases of less than 0.5 °C. In DJF at 1.5 °C the far north of the domain including over eastern Cuba and Hispaniola even shows slight warming under G3 (again, however, less than 0.5 °C), similarly the Pacific coast of Central America in MJJ and JA. Conditions reverse for all seasons and the annual at 2.0 °C with the entire region being cooler for both G3 and G4 than for HadGEM_unaltered.
The Caribbean is drier under G3 at 1.5 °C (Figure 9) compared to the SRM unaltered world. Except for western Cuba the main Caribbean basin is 10–20% drier in DJF, MJJ and in the annual, with a similar drier tendency in the west and east Caribbean in JA and the north and east Caribbean in ASON. In comparison, under G4, drier regions are much smaller in extent though generally similarly located in the annual and ASON maps; restricted to the south and west Caribbean Sea respectively in MJJ and JA, and almost non-existent in DJF. At 2.0 °C and 2.5 °C, for both G3 and G4, the region exhibits mostly wetter conditions than HadGEM_unaltered (e.g., see the annual maps), with greatest change in the main Caribbean basin during the early rainfall season (MJJ) and the mid-summer drought (JA). Notwithstanding, varying parts of the region are drier than HadGEM_unaltered during DJF and ASON.
3.5. Task 5—Mean Caribbean Climates at LTTG Targets Achieved with SRM Application
Figure 10 is similar to Figure 7 but for 11-year climatologies of air temperature (left column) and precipitation (right column) centred on LTTG attainment years separately determined for HadGEM_unaltered, G3, and G4. Plots for the pre-industrial period are also repeated for comparison. As noted in Section 2.3.5, the time slices being compared differ for the various experiments and are shown in columns 5 through 7 of Table 1. Figure 10 indicates whether there is any change to the mean climate as a result of the methodology used to attain the temperature LTTGs.
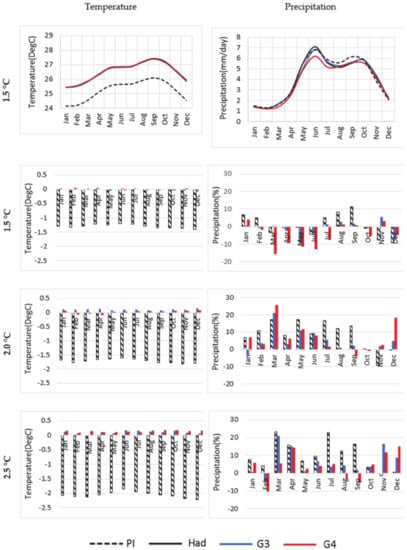
Figure 10.
Row 1: Climatology plots of air temperature (left panel) and precipitation (right panel) for HadGEM_unaltered, G3 and G4 at 1.5 °C, and for the preindustrial (PI) period (1860 to 1900). Rows 2 to 4: Differences between G3 (red), G4 (blue) and PI (hatched black) climatologies and HadGEM_unaltered climatology at 1.5, 2.0 and 2.5 °C. Future climatologies were calculated for the 11-year period centered on when each experiment attained the respective LTTGs. Row 1 shows actual values, while rows 2 to 4 shows absolute and percentage differences.
The following are noted:
- Similar to Figure 7 the plots in row 1 suggest that the Caribbean’s bimodal precipitation and temperature patterns hold in the future under global warming. This is true for all three global temperature targets (patterns for 2.0 °C and 2.5 °C not shown).
- G3 and G4 show negligible or small (less than ~0.1 °C) changes in mean monthly Caribbean temperatures for LTTGs derived with or without SRM (rows 2–4).
- Unlike air temperatures, under G3 and G4 SRM produces varied changes in precipitation amounts relative to HadGEM_unaltered at the same LTTG. G3 (G4) monthly precipitation differences range between −9 to 5% (−15 to 4%), −3 to 21% (−4 to 26%) and −5 to 21% (−10 to 15%) at the 1.5, 2.0 and 2.5 °C targets respectively.
- February through July, October and December are drier at LTTG 1.5 °C under G4 than for HadGEM_unaltered. Largest changes (up to 15%) occur between March and July including the early rainfall season. G3 shows similar signed but generally smaller monthly tendencies for the same months. In contrast, January to July, November and December (February to September, November and December) are wetter at LTTG 2.0 °C for G4 (G3) compared to HadGEM_unaltered. G3 and G4 also, in general, result in wetter conditions at LTTG 2.5 °C than for HadGEM_unaltered.
Finally, Figure 11 and Figure 12 present the corresponding maps of air temperature and precipitation respectively, for G3 and G4 minus HadGEM_unaltered centered on the years when each experiment attains the LTTGs of 1.5, 2.0 and 2.5 °C.
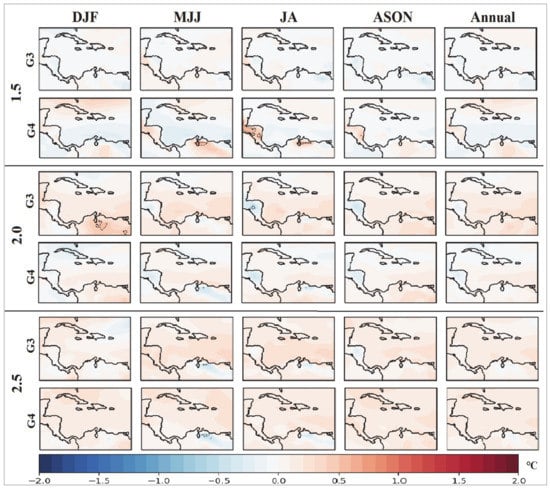
Figure 11.
Composite maps of air temperature for G3 and G4 minus HadGEM_unaltered. Composites are for the 11-year periods centered on when the respective experiments attain the 1.5, 2.0 and 2.5 °C global warming targets. Units in °C.
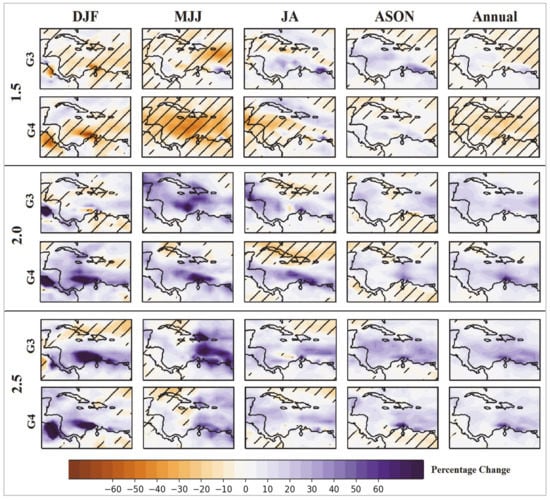
Figure 12.
Same as Figure 11 but for percentage change in precipitation. Units are in percent.
As already noted, with respect to HadGEM_unaltered, changes in temperature across the domain are small (less than ±0.2 °C) at each of the temperature LTTGs. Notwithstanding, parts of the Caribbean exhibit slightly cooler or warmer tendencies compared to HadGEM_unaltered depending on the SRM experiment. For example, at 1.5 °C in the annual mean, whereas both G3 and G4 result in the far north of the domain (Central Caribbean Sea) being slightly warmer (cooler) than HadGEM_unaltered, the two methodologies differ with respect to Central and northern South America with G3 (G4), indicating slightly cooler (warmer) conditions than the SRM unaltered world. Opposite tendencies are particularly noticeable over Honduras and Nicaragua across all seasons and over northern Venezuela in JA and ASON. At 2.0 °C, for the annual mean, G3 and G4 similarly project the Central Caribbean Sea and northern South America (Honduras and Nicaragua) as slightly warmer (cooler) than HadGEM_unaltered; however, for G3 the warm tendency extends further north to include the Greater Antilles except central Cuba. At 2.5 °C, the annual mean indicates the entire domain as slightly warmer than HadGEM_unaltered, except over parts of northern South America, irrespective of the methodology.
There is in general agreement between G3 and G4 rainfall tendencies compared to HadGEM_unaltered at the LTTGs. For example, at 1.5 °C in the annual mean, G3 and G4 suggest that the Caribbean islands will be drier than under HadGEM_unaltered, with the drying, however, across the entire domain for G4. Drying is most pronounced in the early part of the year (DJF and the MJJ) under G3 and G4 and particularly in the southwest Caribbean under G4. The pattern is reversed at higher temperature targets, such that at 2.0 and 2.5 °C rises in the annual mean, G3 and G4 produce a wetter Caribbean domain than for HadGEM_unaltered, except for western Cuba. There is evidence of a spreading wet maximum in the south-eastern Caribbean off the South American coast, which suggests that the strong drying seen in this region in the SRM-unaltered world is not as intense. This is particularly evident in MJJ, but is also true for other seasons. There is, however, a drying tendency for parts of the north Caribbean during the dry seasons (DJF and JA) suggesting an intensification in these regions of drying noted under HadGEM_unaltered and at these higher LTTGs.
4. Discussion and Conclusions
The Caribbean, along with other SIDS, have advocated for future increases in temperature to be limited to 1.5 °C above pre-industrial levels by the end of the current century—1.5 °C is seen as a threshold beyond which Caribbean life may be significantly altered and may not be viable [1,7,8]. Current global commitments under the Nationally Determined Contributions (NDCs) do not put the world on the pathway advocated for by the Caribbean. They instead indicate a strong likelihood of 1.5 °C being achieved in the next 10–15 years [13]. It is anticipated that Caribbean SIDS may be increasingly called upon to consider the use of SRM geo-engineering to achieve the “1.5 to stay alive” goal. This paper anticipates that call and provides insights about the mean Caribbean climate in an SRM-altered versus an SRM-unaltered world. From the results presented, the following three conclusions are drawn:
- SRM has the potential to delay attainment of the 1.5, 2.0 and 2.5 °C global warming targets.
Under the G3 and G4 geo-engineering scenarios, the 1.5 °C global temperature target is delayed by 8 and 33 years respectively from a mean attainment year of 2029 if the world is on a RCP4.5 pathway. There is an initial delaying benefit from SRM which is greater, dependent on the methodology chosen—G4 resulting in the greater 1.5 °C delay. There is, then, the potential to delay attainment of the 1.5 °C threshold at least to the mid-2060s, which would buy the Caribbean region more time to adapt. Neither the G3 or G4 experiments (as conceived and modelled in this study), however, result in an end-of-century attainment date as advocated for. Additionally, though the highest temperature target examined (2.5 °C) is also delayed by 17 and 19 years respectively from 2060 (RCP4.5 world), it too would still be attained before the end of the current century due to the rapid temperature rise which would occur after SRM is stopped. We further extrapolate to show that it is only if SRM geoengineering continues indefinitely that 2.0 °C is delayed to between 2079 and 2087, and 2.5 °C attainment occurs after 2100. The overall implication is that, notwithstanding the greater time to adapt, regions like the Caribbean will have to consider whether the initial benefit of a delay in reaching the 1.5 °C target is sufficient to warrant SRM, given that it is accompanied by the later rapid approach to the higher warming targets when the process is curtailed. Alternatively, Caribbean SIDS must consider whether they are willing to live with continuous SRM to facilitate greater time to adapt, especially to the higher temperature targets.
- SRM has the potential to produce significantly different Caribbean climates during LTTG temperature years.
Under RCP4.5, the Caribbean warms for successively higher temperature LTTGs, though always remaining slightly cooler than the global average. There is also drying (wetter conditions) in the south and south-eastern (northern) Caribbean at 1.5 °C. The area of significant drying increases northward and westward at 2.0 and 2.5 °C which, as previously noted, represents a reversal of conditions in the north Caribbean and an intensification of drying in the south. The Caribbean mean climate in the years corresponding to LTTG attainment under RCP4.5 is significantly altered if SRM geo-engineering is instead applied in a manner consistent with the G3 and G4 scenarios considered. For the 1.5 °C years, both G3 and G4 produce a cooler Caribbean (cooling under G4 being larger than under G3) but also a drier Caribbean than if SRM were not applied. For the 2.0 and 2.5 °C years, the Caribbean further cools while transitioning to being wetter (less dry) than if SRM were not applied. The implication is that even though air temperatures are always cooler under SRM, there is an onset of drier conditions during the “unaltered” 1.5 °C years, which is maintained for the higher temperature target years, though with diminished intensity. This poses a dilemma about the perceived benefits of SRM; i.e., is it better to be cooler even if it is drier, especially since a seemingly more beneficial later state (cooler and not as dry) is only attainable after first contending with a potentially less favorable state (cooler and more dry)? The comparisons here are to the RCP4.5 climate.
- It matters how the 1.5, 2.0 and 2.5 °C targets are achieved, i.e., with or without SRM.
The mean Caribbean climate at the global warming targets is seemingly dependent on the methodology used to attain the temperature LTTGs. In general, various parts of the Caribbean domain warm slightly more or less under SRM than under RCP4.5 for the same LTTG. At the same time, the Caribbean region is largely drier for 1.5 °C achieved under SRM than under RCP4.5, but less dry at 2.0 and 2.5 °C, especially in the south-east. The dilemma again posed is that, though SRM may delay the attainment of 1.5 °C, its corresponding impact on rainfall when this lowest LTTG is achieved may be less than desirable, though it may be more favorable at the higher LTTGs. Furthermore, there is not always agreement between G3 and G4 about warmer or cooler regions and (even though less so) about drier and wetter regions for the various global temperature targets. The implication here is that even within a small region like the Caribbean, there may be disagreement on whether SRM offers a significant benefit, and the type of SRM that should be deployed, given the varied sub-regional responses to its application.
This study examined the impact to the mean Caribbean climate under SRM geoengineering. It did not, however, explore the dynamics of how SRM would lead to the future Caribbean climate. SO2 injection increases the Earth’s albedo similarly to large scale volcanic eruptions, reducing solar insolation and resulting in cooler conditions on the Earth’s surface; see, for instance, ref. [35,36]. In the Caribbean, the climatological patterns (e.g., the bimodal rainfall pattern) generally remain unchanged (see for example row 1, Figure 7), suggesting that in addition to and/or as a result of the cooling effect, changes in rainfall due to SRM may result from an alteration of the strength of the trade winds and in particular the CLLJ, which would in turn affect moisture availability in the region. This, however, needs to be investigated and will be the subject of a future study. This study also did not explore how climate extremes such as droughts, floods or hurricanes will behave under SRM. Climate extremes are an important part of Caribbean life, and the frequency and magnitude of their occurrence are already being significantly altered under climate change [1,37], with even further changes projected at higher warming temperatures [1]. This paper, through its examination of mean climatic changes, “kick starts” discussions on the impacts of SRM on Caribbean SIDS; further discussions along these lines must, out of necessity, also examine the impacts on extremes. There is also a need to examine the impact of the period of rapid temperature rise following cessation of SRM and what that means for temperature-sensitive aspects of Caribbean life, especially its biodiversity, and the ability to quickly adjust and adapt.
Finally, the decision on whether SRM represents a useful approach to achieving global warming thresholds advocated by Caribbean SIDS will not only be driven by the impact of SRM on the climate of the Caribbean. We recognize that social, political and ethical factors must also be considered by the region as it weighs the risks. Notwithstanding, knowledge of how the climate might change provides information and a framework for those considerations, especially if SRM is to be equally considered alongside mitigation and adaptation as a potential strategy for combatting climate change’s impact on SIDS.
Author Contributions
Conceptualization, L.A.C., M.A.T. and A.C.-A.; methodology, L.A.C., M.A.T., A.C.-A. and T.S.S.; software, M.S.M.W., J.D.C., A.B.-M. and L.A.C.; validation, L.A.C., A.B.-M. and M.S.M.W.; formal analysis, L.A.C., M.A.T., A.C.-A. and M.S.M.W.; data curation, M.S.M.W., J.D.C., A.B.-M. and L.A.C.; writing—original draft preparation, L.A.C., M.A.T. and M.S.M.W.; writing—review and editing, L.A.C., M.A.T., A.C.-A., A.B.-M., T.S.S. and J.D.C.; visualization, M.S.M.W., L.A.C., A.C.-A., A.B.-M. and J.D.C. All authors have read and agreed to the published version of the manuscript.
Funding
This research was funded by the Solar Radiation Management Governance Initiative (SRMGI) and the University of the West Indies, Mona Campus.
Acknowledgments
The authors of this paper would like to recognize the World Climate Research Programme, which is responsible for CMIP and GeoMIP projects, and the Earth System Grid Federation for making the data accessible.
Conflicts of Interest
The authors declare no conflict of interest.
References
- Taylor, M.A.; Clarke, L.A.; Centeala, A.; Bezanilla, A.; Stephenson, T.S.; Jones, J.J.; Campbell, J.D.; Vichot, A.; Charlery, J. Future Caribbean Climates in a World of Rising Temperatures: The 1.5 vs. 2.0 Dilemma. J. Clim. 2018, 31, 2907–2926. [Google Scholar] [CrossRef]
- Campbell, J.D.; Taylor, M.A.; Stephenson, T.S.; Watson, R.A.; Whyte, F.S. Future climate of the Caribbean from a regional climate model. Int. J. Climatol. 2011, 31, 1866–1878. [Google Scholar] [CrossRef]
- Nurse, L.A.; McLean, R.F.; Agard, J.; Briguglio, L.; Duvat-Magnan, V.; Pelesikoti, N.; Tompkins, E.; Webb, A. Small Islands; Cambridge University Press: Cambridge, UK, 2014. [Google Scholar]
- Robinson, S.-A. Adapting to climate change at the national level in Caribbean small island developing states. Isl. Stud. J. 2018, 13, 79–100. [Google Scholar] [CrossRef]
- Mycoo, M.A. Beyond 1.5 °C: Vulnerabilities and adaptation strategies for Caribbean Small Island developing states. Reg. Environ. Chang. 2018, 18, 2341–2353. [Google Scholar] [CrossRef]
- Benjamin, L.; Thomas, A. 1.5 °C to stay alive? AOSIS and the long term temperature goal in the Paris Agreement. IUCN Acad. Environ. Law J. 2016, 7, 122–129. [Google Scholar] [CrossRef]
- Donk, P.; Van Uytven, E.; Willems, P.; Taylor, M.A. Assessment of the potential implications of a 1.5 °C versus higher global temperature rise for the Afobaka hydropower scheme in Suriname. Reg. Environ. Chang. 2018, 18, 2283–2295. [Google Scholar] [CrossRef]
- Lallo, C.H.; Cohen, J.; Rankine, D.; Taylor, M.; Cambell, J.; Stephenson, T. Characterizing heat stress on livestock using the temperature humidity index (THI)—Prospects for a warmer Caribbean. Reg. Environ. Chang. 2018, 18, 2329–2340. [Google Scholar]
- UNFCCC. Adoption of the Paris Agreement: Proposal by the President (Draft Decision). In Proceedings of the Conference of the Parties, Geneva, Switzerland, 30 November–11 December 2015. [Google Scholar]
- Raftery, A.E.; Zimmer, A.; Frierson, D.M.W.; Startz, R.; Liu, P. Less than 2 °C warming by 2100 unlikely. Nat. Clim. Chang. 2017, 7, 637. [Google Scholar] [CrossRef]
- MacMartin, D.G.; Ricke, K.L.; Keith, D.W. Solar geoengineering as part of an overall strategy for meeting the 1.5 °C Paris target. Phil. Trans. R. Soc. A 2018, 376, 20160454. [Google Scholar] [CrossRef]
- Van Vuuren, D.P.; Stehfest, E.; Gernaat, D.E.H.J.; van den Berg, M.; Bijl, D.L.; de Boer, H.Z.; Daioglou, V.; Doelman, J.C.; Edelenbosch, O.Y.; Harmsen, M.; et al. Alternative pathways to the 1.5 °C target reduce the need for negative emission technologies. Nat. Clim. Chang. 2018, 8, 391–397. [Google Scholar] [CrossRef]
- Masson-Delmotte, V.; Zhai, P.; Pörtner, H.-O.; Roberts, D.; Skea, J.; Shukla, P.R.; Pirani, A.; Moufouma-Okia, W.; Péan, C.; Pidcock, R.; et al. Global Warming of 1.5 °C: An IPCC Special Report on the Impacts of Global Warming of 1.5 °C Above Pre-industrial Levels and Related Global Greenhouse Gas Emission Pathways, in the Context of Strengthening the Global Response to the Threat of Climate Change, Sustainable Development, and Efforts to Eradicate Poverty; World Meteorological Organization: Geneva, Switzerland, 2018. [Google Scholar]
- Keith, D.W. Geoengineering. Nature 2001, 409, 420. [Google Scholar] [CrossRef]
- Caldeira, K.; Bala, G.; Cao, L. The science of geoengineering. Annu. Rev. Earth Planet. Sci. 2013, 41, 231–256. [Google Scholar] [CrossRef]
- Giannini, A.; Kushnir, Y.; Cane, M.A. Interannual Variability of Caribbean Rainfall, ENSO, and the Atlantic Ocean. J. Clim. 2000, 13, 297–311. [Google Scholar] [CrossRef]
- Taylor, M.A.; Enfield, D.B.; Chen, A.A. Influence of the tropical Atlantic versus the tropical Pacific on Caribbean rainfall. J. Geophys. Res. Oceans 2002, 107, 3127. [Google Scholar] [CrossRef]
- Collins, W.; Bellouin, N.; Doutriaux-Boucher, M.; Gedney, N.; Hinton, T.; Jones, C.D.; Liddicoat, S.; Martin, G.; O’Connor, F.; Rae, J.; et al. Evaluation of the HadGEM2 Model; Met Office Exeter: Devon, UK, 2008. [Google Scholar]
- Taylor, K.E.; Stouffer, R.J.; Meehl, G.A. An overview of CMIP5 and the experiment design. Bull. Am. Meteorol. Soc. 2012, 93, 485–498. [Google Scholar] [CrossRef]
- Kravitz, B.; Robock, A.; Boucher, O.; Schmidt, H.; Taylor, K.E.; Stenchikov, G.; Schulz, M. The geoengineering model intercomparison project (GeoMIP). Atmos. Sci.Lett. 2011, 12, 162–167. [Google Scholar] [CrossRef]
- Van Vuuren, D.P.; Edmonds, J.; Kainuma, M.; Riahi, K.; Thomson, A.; Hibbard, K.; Hurtt, G.C.; Kram, T.; Krey, V.; Lamarque, J.-F.; et al. The representative concentration pathways: An overview. Clim. Chang. 2011, 109, 5–31. [Google Scholar] [CrossRef]
- Hu, T.; Sun, Y.; Zhang, X. Temperature and precipitation projection at 1.5 and 2 °C increase in global mean temperature. Chin. Sci. Bull. 2017, 62, 3098–3111. [Google Scholar]
- Ryu, J.-H.; Hayhoe, K. Understanding the sources of Caribbean precipitation biases in CMIP3 and CMIP5 simulations. Clim. Dyn. 2014, 42, 3233–3252. [Google Scholar] [CrossRef]
- Adler, R.F.; Huffman, G.J.; Chang, A.; Ferraro, R.; Xie, P.-P.; Janowiak, J.; Rudolf, B.; Schneider, U.; Curtis, S.; Boldvin, D.; et al. The Version-2 Global Precipitation Climatology Project (GPCP) Monthly Precipitation Analysis (1979—Present). J. Hydrometeorol. 2003, 4, 1147–1167. [Google Scholar] [CrossRef]
- Hersbach, H. The ERA5 Atmospheric Reanalysis. In Proceedings of the AGU Fall Meetong, San Francisco, CA, USA, 12–16 December 2016; p. NG33D-01. [Google Scholar]
- Kanamitsu, M.; Ebisuzaki, W.; Woollen, J.; Yang, S.-K.; Hnilo, J.J.; Fiorino, M.; Potter, G.L. NCEP-DOE AMIP-II Reanalysis (R-2). Bull. Am. Meteorol. Soc. 2002, 83, 1631–1643. [Google Scholar] [CrossRef]
- Centella-Artola, A.; Bezanilla-Morlot, A.; Taylor, M.A.; Herrera, D.A.; Martinez-Castro, D.; Gouirand, I.; Sierra-Lorenzo, M.; Vichot-Llano, A.; Stephenson, T.; Fonseca, C.; et al. Evaluation of Sixteen Gridded Precipitation Datasets over the Caribbean Region Using Gauge Observations. Atmosphere 2020, 11, 1334. [Google Scholar] [CrossRef]
- Jury, M.R. An Intercomparison of Observational, Reanalysis, Satellite, and Coupled Model Data on Mean Rainfall in the Caribbean. J. Hydrometeorol. 2009, 10, 413–430. [Google Scholar] [CrossRef]
- Stephenson, T.S.; Goodess, C.M.; Haylock, M.R.; Chen, A.A.; Taylor, M.A. Detecting inhomogeneities in Caribbean and adjacent Caribbean temperature data using sea-surface temperatures. J. Geophys. Res. 2008, 113, D21116. [Google Scholar] [CrossRef]
- Jury, M.R.; Winter, A. Warming of an elevated layer over the Caribbean. Clim. Chang. 2010, 99, 247–259. [Google Scholar] [CrossRef]
- Spence, J.M.; Taylor, M.A.; Chen, A.A. The effect of concurrent sea-surface temperature anomalies in the tropical Pacific and Atlantic on Caribbean rainfall. Int. J. Climatol. 2004, 24, 1531–1541. [Google Scholar] [CrossRef]
- Kaplan, J.O.; New, M. Arctic climate change with a 2 °C global warming: Timing, climate patterns and vegetation change. Clim. Chang. 2006, 79, 213–241. [Google Scholar] [CrossRef]
- Anderson, B.T. Intensification of seasonal extremes given a 2 °C global warming target. Clim. Chang. 2012, 112, 325–337. [Google Scholar] [CrossRef]
- James, R.; Washington, R.; Schleussner, C.-F.; Rogelj, J.; Conway, D. Characterizing half-a-degree difference: A review of methods for identifying regional climate responses to global warming targets. Wiley Interdiscip. Rev. Clim. Chang. 2017, 8, e457. [Google Scholar] [CrossRef]
- Tilmes, S.; Garcia, R.R.; Kinnison, D.E.; Gettelman, A.; Rasch, P.J. Impact of geoengineered aerosols on the troposphere and stratosphere. J. Geophys. Res. Atmos. 2009, 114. [Google Scholar] [CrossRef]
- Robock, A. Volcanic eruptions and climate. Rev. Geophys. 2000, 38, 191–219. [Google Scholar] [CrossRef]
- Stennett-Brown, R.K.; Jones, J.J.P.; Stephenson, T.S.; Taylor, M.A. Future Caribbean temperature and rainfall extremes from statistical downscaling. Int. J. Climatol. 2017, 37, 4828–4845. [Google Scholar] [CrossRef]
Publisher’s Note: MDPI stays neutral with regard to jurisdictional claims in published maps and institutional affiliations. |
© 2021 by the authors. Licensee MDPI, Basel, Switzerland. This article is an open access article distributed under the terms and conditions of the Creative Commons Attribution (CC BY) license (http://creativecommons.org/licenses/by/4.0/).