Abstract
The Antarctic Peninsula belongs to the regions of the Earth that have seen the highest increase in air temperature in the past few decades. The warming is reflected in degradation of the cryospheric system. The impact of climate variability and interactions between the atmosphere and the cryosphere can be studied using numerical atmospheric models. In this study, the standard version of the Weather Research and Forecasting (WRF) model was validated on James Ross Island in the northern part of the Antarctic Peninsula. The aim of this study was to verify the WRF model output at 700 m horizontal resolution using air temperature, wind speed and wind direction observations from automatic weather stations on the Ulu Peninsula, the northernmost part of James Ross Island. Validation was carried out for two contrasting periods (summer and winter) in 2019/2020 to assess possible seasonal effects on model accuracy. Simulated air temperatures were in very good agreement with measurements (mean bias −1.7 °C to 1.4 °C). The exception was a strong air temperature inversion during two of the winter days when a significant positive bias occurred at the coastal and lower-altitude locations on the Ulu Peninsula. Further analysis of the WRF estimates showed a good skill in simulating near-surface wind speed with higher correlation coefficients in winter (0.81–0.93) than in summer (0.41–0.59). However, bias and RMSE for wind speed tended to be better in summer. The performance of three WRF boundary layer schemes (MYJ, MYNN, QNSE) was further evaluated. The QNSE scheme was generally more accurate than MYNN and MYJ, but the differences were quite small and varied with time and place. The MYNN and QNSE schemes tended to achieve better wind speed simulation quality than the MYJ scheme. The model successfully captured wind direction, showing only slight differences to the observed values. It was shown that at lower altitudes the performance of the model can vary greatly with time. The model results were more accurate during high wind speed southwestern flow, while the accuracy decreased under weak synoptic-scale forcing, accompanied by an occurrence of mesoscale atmospheric processes.
1. Introduction
The Antarctic Peninsula (AP) is known for its climate variability and the recent changes observed in the components of the cryosphere [1,2,3], as well as in terrestrial, marine, and other aquatic ecosystems along the western and eastern coasts [4,5]. At the end of the 20th century, the warming was very intense [6], but a cooling trend was identified at the beginning of the 21st century [7].
The local cryospheric systems are considered to be very sensitive to temperature fluctuations [8,9]. Air temperatures close to or above the melting point appear frequently in the coastal zone of the AP [10] and, therefore, additional warming could trigger increased melting [11]. Thus, further research of regional cryosphere-atmosphere interactions is crucial, as the surface melting of ice sheets and glaciers could lead to an increased meltwater runoff and a rise in sea level [12]. Special attention should be given to the AP due to its relatively mild climate in comparison with the Antarctic inland. In addition, the topography of the AP is rather complex, and its mountain ranges are capable of generating strong foehn flows with subsequent intense melt events [13,14]. The regional climate is also affected by the sea ice extent and dynamics [7,15].
In addition to observations, which may be complicated by difficult access and harsh conditions, numerical models are useful in Antarctic atmospheric research [13,14,15]. The Weather Research and Forecasting model (WRF) [16] is one of the most frequently used numerical models suitable both for atmospheric research and operational weather predictions. The model provides multiple options for parameterization of selected physical processes, e.g., cloud microphysics, radiation or boundary layer turbulence [17]. There are many of boundary layer (BL) schemes available in WRF and a few have already been applied in polar regions, for instance, Mellor-Yamada-Yanjić—MYJ (used by [18,19,20]), Mellor-Yamada-Nakanishi-Niino—MYNN (used by [19,21,22] and Quasi-Normal Scale Elimination—QNSE (used by [21,23]). In these papers, authors show that WRF with any of these schemes is capable of a reasonable simulation of air temperature and wind speed in cold environments.
With respect to Antarctica, the polar version of the WRF model (Polar WRF; developed by the Byrd Polar and Climate Research Center) has already been validated in the South Shetland Islands Archipelago [20], the Weddell Sea [24], West Antarctica [19] and over the Antarctic continent [22]. Tastula et al. [25] tested both the standard and the polar versions of the WRF model over Antarctica. However, these authors ran the model only in limited horizontal resolution (grid cell size ≥ 3 km) and their results are not fully transferable to the rugged terrain and diversity of land-cover types of the AP. A WRF simulation in a higher resolution (1.5 km) was presented by Turton et al. [15]; however, they focused primarily on the foehn simulation over the Larsen C Ice Shelf on the eastern coast of the AP with less emphasis given to the effects of topography or land-cover on model accuracy.
The Polar WRF is also routinely used within the Antarctic Mesoscale Prediction System (AMPS) aiming to produce operative Antarctic weather forecasts. The system consists of multiple WRF domains with variable resolution. The most detailed one (currently with a 0.89 km grid) covers the McMurdo Station and the surrounding region [26]. The principal region where AMPS was validated is the Ross Ice Shelf [27,28,29]. In the AP region, the AMPS has only a 2.67 km resolution domain, which may not be enough to accurately render atmospheric processes related to rather complex topography. In addition to the WRF model, other numerical atmospheric models were used in Antarctica. King et al. [30] compared AMPS output with the Met Office Unified Model (MetUM) and the RACMO2 model over the Antarctic Peninsula. They found that all three models (in 4–5 km resolution) have considerable skill in simulating near-surface air temperature, wind speed and water vapor mixing ratio. The RACMO2.3 model was also used in a simulation of the climate of the Antarctic Peninsula [31]. The MetUM model played a crucial role in a recent study of melt dynamics over the Larsen Ice Shelf [32].
Despite many successful applications of either standard or Polar versions of the WRF model, there are still some challenges when using this model in polar environments, e.g., correct simulation of cloud properties [18], local-scale flow modifications [25] and representation of a very rugged topography [23]. Under some circumstances, the model may overestimate mixing in the stable winter boundary layer leading to a positive temperature bias [22].
It is necessary to point out that realistic capturing of air temperature and wind field on glaciers is essential to study glacier-climate interactions in polar regions, e.g., snow melt and accumulation processes [33,34]. Inaccuracy of air temperature estimates can consequently influence the calculation of positive degree days used in glacier melt analyses [35,36]. Wind speed accuracy is crucial for adequate boundary layer mixing [22] or estimates of wind-blown snow mass [37,38].
To extend our knowledge of the capabilities of the WRF model in Antarctica, we ran multiple simulations at 700 m horizontal resolution covering the north-eastern coast of the AP and James Ross Island. The validation of WRF output is made against near-surface weather observations available in the northern part of James Ross Island. In this study area, several automatic weather stations (AWS) have been installed as part of the Czech Antarctic Research Programme within the last 10 years. The AWS are located in the complex terrain of northern James Ross Island, which is characterized by low-lying coastal areas with vegetation on only a small proportion of the surfaces, hills and mesas several hundred meters high and small glaciers [39,40].
Therefore, we chose AWS placed in various topographic settings (coastal and high‑altitude sites), and two distinguished types of land cover (bare ground and glacier), which enabled a broader validation of the WRF model outputs at a very high resolution. In order to assess the WRF model performance in various seasons, we ran two groups of simulations in the following periods: (1) austral winter (May–June), and (2) austral summer (January). Furthermore, the three most common BL schemes were tested to evaluate the impact of the atmospheric BL scheme choice on the model accuracy.
The outline of the paper is as follows. Section 2 describes the study area and methods; Section 3 presents the most important results. Possible effects of local topography, land cover and strength of large-scale air mass advection on the model performance are discussed in Section 4 together with the main concluding remarks.
2. Experimental Setup
2.1. Study Area
The study area covers the northernmost part of James Ross Island, the Ulu Peninsula (Figure 1). James Ross Island is separated from the eastern coast of the AP by the 15 km wide Prince Gustav Channel. The Ulu Peninsula is predominantly unglaciated specifically its northern part has mostly ice-free surfaces (312 km2) with only 10% of the land covered by small valley, cirque or dome glaciers [2,41]. The local landscape is dominated by volcanic mesas with steep slopes reaching up to 641 m a.s.l. [40,42] and the tower‑like Lookalike Peaks (767 m a.s.l.) above the southern part of the Whisky Glacier (Figure 1c). Another distinguishing feature of the terrain is formed by the Abernethy Flats, a vast lowland area located between Johnson Mesa, Whisky Glacier and Davies Dome.

Figure 1.
Study area location within the Antarctic Peninsula and position of the Weather Research and Forecasting model domains d1 and d2 (a); James Ross Island located in the neighborhood of the northeastern Antarctic Peninsula with the position of domain d3 and the northern part of the Ulu Peninsula (dashed) (b); northern part of the Ulu Peninsula with automatic weather stations mentioned in the text and selected elevation points (c). The map of the Ulu Peninsula is based on the topographic data of the Czech Geological Survey [49] and the Reference Elevation Model of Antarctica (REMA) [50].
Due to its location in the northeastern AP region, James Ross Island has a relatively cold climate [43]. Snow covers the surroundings of the Mendel Station (Figure 1c) from approximately March to November or early December [44]. The 10-year mean annual air temperature reached −7.0 °C at the coastal Mendel Station, −7.3 °C at inland Abernethy Flats (41 m a.s.l.) and −8.0 °C on the nearby Bibby Hill at an altitude of 375 m a.s.l. [45,46]. A typical feature of the local climate is air temperature inversion, occurring more commonly in winter than during the summer months. These inversions contribute to relatively low mean annual near-ground lapse rates of 0.40–0.43 °C·100 m−1 [47]. The dominant southwestern wind direction on the Ulu Peninsula is the result of the regular barrier winds blowing along the eastern AP coast [48].
2.2. Surface Weather Observations
The surface weather observations were carried out in the northern part of the Ulu Peninsula using AWS installed at different topographic and land-cover settings (Figure 1c). In the study, air temperature data from five AWS and wind speed and direction observations from two AWS were used for the model validation. Air temperature was observed at a height of 1.8 m (Davies Dome) and 2 m (other AWS) using the EMS33 temperature sensor (EMS Brno, Brno, the Czech Republic) with an accuracy ±0.15 °C. Wind speed and direction was measured at a height of 10 m (Mendel Station) and 2 m (Davies Dome) by a Young 05305 anemometer (Young, Traverse City, MI, USA) with a ±0.2 m·s−1 accuracy. Temperature data and wind direction were recorded at one-hour intervals, while wind speed was sampled continuously and saved as 30 min mean values. The wind speed data from Davies Dome on 1 June 2019 between 02 UTC and 16 UTC were affected by rime icing and replaced by linear regression based on Johnson Mesa AWS wind speed. The topographic and ground surface characteristics of individual AWS are presented in Table 1.

Table 1.
Topographic characteristics of automatic weather stations (AWS) in the northern Ulu Peninsula, James Ross Island. The “X” symbol indicates available data.
2.3. Numerical Model
The WRF numerical atmospheric model, version 3.9.1.1, was run using three domains with one way nesting (without feedback) (see Figure 1a,b for domain positions). The ERA5 reanalysis released by ECMWF [51] at 31 km spatial resolution was used for the WRF model initialization and input of the boundary conditions at one-hour intervals. To achieve a high level of accuracy for the model topography, the Reference Elevation Model of Antarctica (REMA; [50]) was selected as the terrain data input. Sea ice concentration in daily time steps was derived from gridded data provided by the University in Bremen with a horizontal resolution of 3.125 km [52]. Three land-cover categories (sea, glacier ice/snow and bare ground) were distinguished based on the SCAR Antarctic Digital Database [53] and the Czech Geological Survey topographic map [49]. A high vertical resolution (65 levels in total, of which approximately 19 were below 1000 m a.g.l.) was defined in the model setup in order to obtain a good representation of boundary layer structure and processes. A similar approach can be found in Tastula et al. [24]. We did not run the Polar WRF version, but we used numerous options in the standard WRF model, which were originally presented in Polar WRF. These options included fractional sea ice, sea ice thickness (set to 1.2 m following the results of Kern, Ozsoy-Çiçek and Worby [54]), snow depth on sea ice and sea ice albedo (Table 2).
Table 2.
The Weather Research and Forecasting (WRF) model configuration. For model physics, also the name-list entries are given.
The WRF model was validated in two contrasting periods to identify possible seasonal variation in the model performance. The first period, called “winter,” started on 25 May 2019 at 01 UTC and finished on 05 June 2019 at 00 UTC. The second period, “summer,” lasted from 01 UTC on 05 January 2020 to 00 UTC on 20 January 2020. However, the model integrations actually started 9–10 days beforehand to allow local processes to develop in the model atmosphere [55]. The terms “winter” and “summer” were selected to emphasize contrasts in seasonal factors between the two periods (e.g., solar forcing). We are aware that the results may not be fully representative of the entire season (which would be computationally extremely expensive to simulate) but may be beneficial in identifying principal seasonal variability in model performance.
Three different BL schemes were tested for both periods, which required six model runs to be completed in total. The first option involved the BL scheme Mellor Yamada Janjic (MYJ) [56] and the Monin–Obukhov (Janjic Eta) surface layer scheme. The second option combined the BL scheme Mellor Yamada Nakanishi Niino (MYNN) [57] and Mellor Yamada Nakanishi Niino surface layer scheme. The last option included the BL scheme Quasi-Normal Scale Elimination (QNSE) [58] and the corresponding surface layer scheme. The QNSE scheme was run with the activated day-time eddy diffusivity mass flux option. The use of mass flux was shown to have multiple positive effects on the quality of simulation (e.g., on the accuracy of the BL layer depth or moisture profile) [59]. For all BL schemes, the surface layer parameterizations were selected following the WRF ARW V3: User’s Guide [17]. The complete model configuration is presented in Table 2.
At the beginning of each model run, the glaciers located either southward of 64° S or above 320 m a.s.l. were covered with a snow layer of 1000 mm w.e. This correction ensured that a low-albedo glacier ice would not be exposed in the accumulation area of Ulu Peninsula glaciers during simulations (the 320 m threshold was obtained considering the equilibrium line altitude estimates of Engel et al. [2] and the model topography). The density of this initial snow cover was set to 350 kg·m−3 following observations from King George Island, South Shetland Islands [60] and from sea ice in the Weddell Sea [61]. Based on snow height observations on the ice-free part of the Ulu Peninsula, 1 cm cover of snow was placed on all bare ground grid points at the beginning of winter simulations. Furthermore, the default fresh snow density scheme in WRF’s land surface model was changed to the more complex option designed by van Kampenhout et al. for polar regions [62]. In contrast to original, only temperature-dependent scheme, the option by van Kampenhout et al. considers both air temperature and wind speed for fresh snow density estimates.
2.4. Evaluation of Model Performance
Before the model validation, the discrepancy between anemometer height at Davies Dome AWS (2 m) and wind speed height in model output (10 m) was corrected. The standard logarithmic wind profile [66] was applied:
where U2 is the model wind speed at a height of 2 m and U10 is the simulated wind speed at a height of 10 m. The roughness length was set to the value from WRF land surface scheme (0.002 m). There was no need for correction of temperature outputs as they were already produced at the sensor height. Using the corrected model wind speed and simulated temperature values, three validation statistics were computed to assess the model performance. Firstly, the Pearson correlation coefficient (rxy) was obtained. The second validation statistic was bias, defined as the mean difference between the model and the observations. A positive bias means that the model overestimated the given parameter, and a negative bias means that the model underestimated the parameter. The last statistical parameter was the root mean squared error (RMSE) given by the formula:
where Mi and Oi are modelled and observed values, respectively.
For wind direction validation, directional accuracy of circular distance (DACD) was computed following Láska et al. [23]. DACD is a percentage of time when the observed and modelled wind direction differ by less than 30 angular degrees.
Modelled wind speed series for comparison were constructed as follows. The model output in 1–4 s temporal resolution was averaged over 30-min periods to comply with the anemometer sampling setup. Only the 30-min periods ending on the hour were considered for analysis. Since for most of the AWS there was a difference between the real elevation and the elevation of their nearest model grid point (used for validation) within 50 m (except for Johnson Mesa site where the difference was 79 m), no further correction of the model data was necessary.
3. Results
3.1. Seasonal and Diurnal Differences in the WRF Model Accuracy
A comparison of observed and modelled air temperature during winter and summer periods is presented in Figure 2. When appropriate, the description of WRF accuracy is supplemented by an outline of synoptic-scale circulation based on the ERA5 reanalysis. The WRF model generally captured air temperature well, but the accuracy varied significantly with time and space. In winter (25 May to 5 June 2019), the model outputs were in good agreement with the observations during the first four days of comparison period (25–28 May), with only a small negative bias (−1.6 to −0.4 °C for all schemes). A systematic positive bias of ~3 °C magnitude occurred at all AWS on 30 May. The first two days of June were characterized by an air temperature inversion between low-elevation sites (Mendel, Abernethy Flats) and high-altitude locations (Johnson Mesa, Whisky Glacier, Davies Dome). An investigation of the ERA5 reanalysis revealed that a Drake Passage-Southern Atlantic high air pressure center was a dominant synoptic feature affecting James Ross Island during this inversion. The warm air advection around this pressure center, more pronounced at higher altitudes of James Ross Island, is the probable reason for formation of the air temperature inversion. During this temperature inversion, the WRF model simulated air temperature much better at higher altitudes (bias of −2.6 to −0.6 °C), whilst at lower altitudes it produced a large positive bias (4.7 to 7.0 °C). When the inversion weakened on 3–4 June, the local difference in model performance gradually diminished leading to a smaller bias at the end of the validation period (−3.1 °C to 1.8 °C). In most cases, the three BL schemes produced values of the studied variables that were close to each other—MYJ-based simulation was often colder by several tenths of a degree than model runs using the two other schemes. On the other hand, using the QNSE scheme led to relatively high 2-m temperatures in the model. Generally, the model achieved accuracy better than 2 °C for 47–53% of the time at Mendel Station and Abernethy Flats, and 61–72% of the time at Whisky Glacier and Davies Dome (exact values are scheme-dependent).
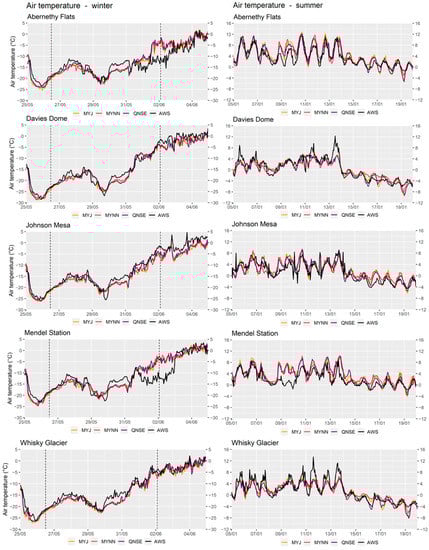
Figure 2.
Time series of hourly observed air temperatures at selected automatic weather stations on Ulu Peninsula in winter period (left) and summer period (right) compared with the corresponding WRF model outputs for three boundary layer schemes (MYJ, MYNN, QNSE). The dashed vertical lines represent time steps described in detail in Section 3.5.
In contrast to winter, the summer validation period (5–20 January 2020) on James Ross Island was characterized by a pronounced diurnal temperature cycle (right-hand side of Figure 2). During this period, larger daily temperature amplitudes (>10 °C in some cases) appeared from 5 January to 13 January when a relatively warm oceanic air was advected to James Ross Island. The WRF model showed accuracy in capturing these fluctuations, notably in the inland Abernethy Flats site. Despite this fact, several model imperfections were identified at glacier AWS and at Mendel Station. On glaciated sites (Davies Dome, Whisky Glacier), very high maximum temperatures on 11 and 13 January (9–14 °C) were significantly underestimated by around 4–8 °C in the model. The model had difficulty simulating air temperatures on 9 January, when model warming at Mendel Station was not reflected in the observations. Since 14 January, the Weddell Sea low pressure center has become more important for James Ross Island weather resulting in a decrease in the mean air temperature as well as daily amplitudes at all AWS. This colder episode was simulated very well with only small differences between the WRF output and in situ observations (bias of −0.4 °C to 1.3 °C). Again, all three BL schemes gave similar results. There were no prevailing patterns of scheme differences up to 13 January, but later, during the colder period, the MYNN scheme tended to produce smaller diurnal temperature cycles than the other schemes. The fraction of the summer simulation period with a temperature bias magnitude of less than 2 °C reached 66–69% at Mendel Station and 68–79% at the other AWS.
The comparison of wind speed observations at Mendel Station and Davies Dome and the corresponding WRF outputs are shown in Figure 3. In winter, two strong wind events (up to 30 m·s−1) were observed on 26–27 May and 29–30 May at both sites. Timing of these events was correctly simulated by the WRF model; however, the estimated peak values were mostly higher than the observations. From 31 May to 2 June 2019, lighter winds (<5 m·s−1) prevailed in the study area. Figure 3 shows that the model captured wind weakening well, although there was a general tendency to overestimate the wind speed by about 5 m·s−1 at Mendel Station. At Davies Dome, wind speed was simulated more accurately on 31 May (bias < 1 m·s−1) but accuracy decreased on the first two days of June. During the winter period, the MYNN scheme predicted generally lower wind speeds in winter than MYJ and QNSE, especially during high wind speed events.

Figure 3.
Time series of hourly observed wind speed at selected automatic weather stations on Ulu Peninsula in winter period (left) and summer period (right) compared with the corresponding WRF model outputs for three boundary layer schemes (MYJ, MYNN, QNSE). The dashed vertical lines represent time steps described in detail in Section 3.5.
In the summer validation period, wind speed tended to range between 0.1 m·s−1 and 10 m·s−1. Generally, the WRF outputs corresponded better with the observed wind speed at Davies Dome (especially on 5–13 January) than at the coastal Mendel Station. Timing of observed high wind speed events (~10 m·s−1) was captured well in the model data. However, the peak values were overestimated by the WRF model at Mendel Station with the magnitude of the bias at 0–5 m·s−1. This bias was the highest when the QNSE scheme was selected.
3.2. Validation Statistics
In this section, validation statistics for different AWS, seasons and three BL schemes will be presented. Pearson’s correlation coefficients, biases and RMSE for modelled air temperature are given in Figure 4. In the winter validation period, modelled temperature changes closely followed the observations as demonstrated by correlation coefficients close to 0.89 at lower altitudes (Mendel Station, Abernethy Flats) and 0.98 at the elevated sites (Johnson Mesa, Whisky Glacier, Davies Dome). Biases of a lower magnitude (0.1–0.8 °C) were found at Mendel Station and Abernethy Flats, and higher biases (magnitude of 0.7–1.7 °C) were documented at higher altitudes. In contrast, the RMSE was higher at low altitudes suggesting that low biases resulted, at least in part, from error compensation. In summer, correlation coefficients were slightly lower than in winter, varying from 0.75 at Mendel Station to 0.91 at Davies Dome. The lower ability of the WRF model to accurately simulate air temperature at Mendel Station was also confirmed by the bias (1.3–1.4 °C) and RMSE (2.3–2.4 °C). At the other sites, validation statistics suggest better model accuracy with bias magnitudes <1 °C and RMSE ~2 °C.
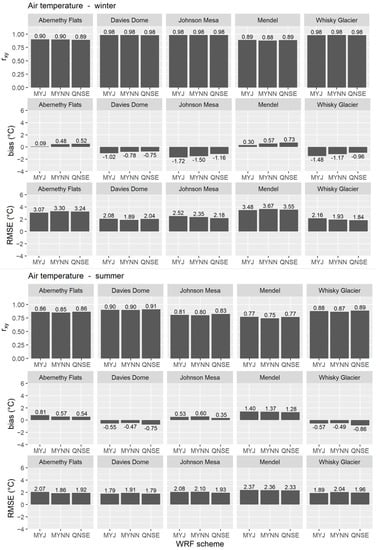
Figure 4.
Validation statistics for modelled air temperature at selected automatic weather stations using three boundary layer schemes (MYJ, MYNN, QNSE) during the winter and summer periods.
Figure 4 also enables a comparison of the performance of BL schemes at different sites and in different seasons. In summer, the MYNN scheme showed slightly lower correlation coefficients for air temperature (by 0.01–0.03) compared to QNSE; values for MYJ were between these two. Based on the bias values, the QNSE output was rather warm in winter (warmer by 0.3–0.6 °C than MYJ run, and by 0.0–0.3 °C than MYNN run) but tended to be relatively cold in summer (colder by 0.1–0.3 °C than MYJ run and by 0.0–0.4 °C than MYNN run). MYJ-based simulation produced the coldest results in winter (colder than both MYNN and QNSE simulations by 0.2–0.6 °C), but in summer it was around as warm as the MYNN run. The comparison of BL schemes indicates that the MYJ scheme was generally most accurate in lower altitudes in winter, while QNSE performed well in high altitudes in winter and at low altitudes in summer. Summer biases on glaciers were the lowest when the MYNN scheme was used. The differences in validation statistics were small and very variable both seasonally and spatially, resulting in no other persistent pattern in the performance of the BL schemes.
Validation statistics for wind speed (Figure 5) show clear seasonal differences. In winter, correlation coefficients were relatively high at both Mendel Station (0.81–0.87) and Davies Dome (0.90–0.93). However, the bias and RMSE indicate that the model had difficulty in simulating winter wind speed magnitude. This inaccuracy was more pronounced at Mendel Station (bias of 2.8–5.1 m·s−1) than on the top of Davies Dome (bias of 1.0–2.2 m·s−1). In summer, correlation coefficients decreased to 0.49–0.56 (Mendel) and 0.41–0.59 (Davies Dome). The wind speed bias and RMSE were also slightly lower in summer than in winter (see Figure 5). The lowest biases and RMSE were obtained using the MYNN scheme at all sites in both summer and winter (except for summer RMSE at Davies Dome). The highest correlation coefficients were given by the QNSE option in all situations (greater by 0.01–0.07 than MYJ and by 0.02–0.18 than MYNN).

Figure 5.
Validation statistics for modelled wind speed at selected automatic weather stations using three boundary layer schemes (MYJ, MYNN, QNSE) during the winter and summer periods.
3.3. Comparison of Observed and Modelled Wind Direction
The observed and modelled wind direction was inspected visually using wind roses (Figure 6) and quantitatively by the DACD parameter. For simplicity, we selected only the QNSE scheme for this comparison. At Davies Dome in summer, the WRF model simulated distribution of wind directions relatively well with the DACD value of 42.2%. In winter, the model successfully captured the prevailing south-southwestern direction (DACD = 64.8%). At Mendel Station in summer, a high frequency of western winds was successfully captured by the model, but the second most commonly observed wind direction (north-eastern) was seen less often in the model results. This was reflected in a relatively low value of DACD of 37.5%. In winter, there was good agreement between observed and simulated wind direction at Mendel Station (DACD = 53.4%).
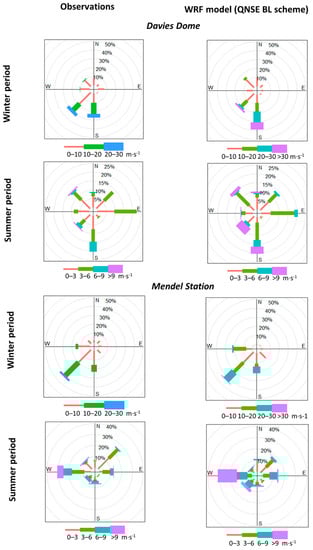
Figure 6.
Wind roses showing observed and modelled wind speed and direction for the summer and winter periods at Davies Dome and Mendel Station.
3.4. Comparison of WRF and ERA5 Data
To quantify improvements achieved by the use of a high-resolution model, we compared validation statistics of the WRF model and the ERA5 reanalysis used for WRF initial and boundary conditions. The Davies Dome site was selected for comparison as we expected it to be relatively least affected by local processes that cannot be captured by the ERA5 reanalysis. Similarly to WRF, we used the nearest grid point of ERA5 for comparison with observations. In winter (Table 3), a significant improvement in air temperature accuracy was found, especially in terms of RMSE. The very high RMSE value in ERA5 could be attributed to a large underestimation of warming from 1 June 2019 when the bias reached up to ~−9 °C (not shown). Wind speed accuracy in WRF was also improved compared to ERA5. For the summer period (Table 4), the WRF output for air temperature reached lower RMSE values than ERA5 provided. In addition, the correlation with observation values was better. For wind speed, the bias was improved by WRF, but RMSE and correlation coefficients remained similar to ERA5. During both periods, wind direction accuracy of the WRF model was similar to the ERA5 accuracy (difference in DACD reached 2–3%).
Table 3.
Validation statistics for air temperature, wind speed and direction from the WRF simulations and the ERA5 reanalysis for the winter period on Davies Dome. For WRF, an interval including all boundary layer (BL) schemes is presented. Wind direction accuracy is shown as the directional accuracy of circular distance (DACD).
Table 4.
Validation statistics for air temperature, wind speed and direction from the WRF simulations and the ERA5 reanalysis for the summer period on Davies Dome. For WRF, an interval including all boundary layer (BL) schemes is presented. Wind direction accuracy is shown as the directional accuracy of circular distance (DACD).
3.5. Example of WRF Model Performance in Selected Atmospheric Conditions
The fluctuations in model performance during the winter validation period (Figure 2) motivated us to investigate these differences in greater detail. Based on the WRF model outputs, near-surface air temperature maps and vertical profiles were created (Figure 7). Two selected time steps were used for this analysis: (i) 26 May 2019 at 12 UTC when the model performed extremely well at all sites, and (ii) 2 June 2019 at 03 UTC when the model strongly overestimated air temperature at the coastal and low altitude Mendel Station (by 8.1–9.5 °C depending on the BL scheme) and Abernethy Flats (by 6.9–8.0 °C), respectively.
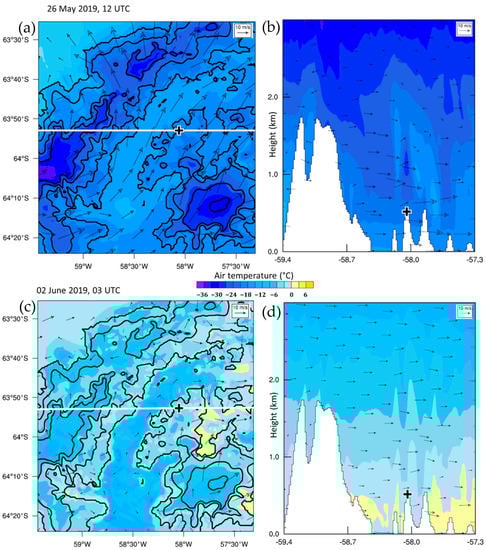
Figure 7.
Surface air temperature and wind fields (a,c) and vertical cross-sections (b,d) through WRF domain d3 on 26 May 2019 at 12 UTC and 2 June 2019 at 03 UTC. Cross-sections are led via Davies Dome (black cross) and shown in maps by white lines. Contour lines at 500 m intervals are given in black. The WRF output with the QNSE BL scheme was selected for the figure preparation as this scheme was designed for stably stratified boundary layer [67].
Figure 7 shows the air temperature and wind field maps covering the area of the inner WRF domain and corresponding vertical profiles up to 3 km in height. On 26 May 2019 at 12 UTC, the Ulu Peninsula was affected by strong southwestern flow caused by a low air pressure system over the Weddell Sea. The same weather feature was apparent in the near-surface observations of wind speed (see Figure 3) and wind direction what reached 210° at Davies Dome and 229° at Mendel Station. Air temperature on James Ross Island generally decreased with altitude as indicated by the agreement between isotherms and terrain contour lines shown in Figure 7a (the difference between the sea level and 1000 m a.s.l. reached ~7 °C). In contrast, on 2 June 2019 at 03 UTC, the near-surface wind was generally weak and directionally variable. In this time step, James Ross Island was located at the northern edge of a low-pressure trough with a weak synoptic-scale flow.
Over the Prince Gustav Channel (between James Ross Island and the AP eastern coast), a cold air pool (mostly −8 °C to −14 °C) was present in the model output (Figure 7c). The WRF output enabled us to identify the vertical extent of the cold air pool, which filled less than 75 m of the lower atmosphere. At an altitude of 125 m, air temperature above Prince Gustav Channel was near 0 °C. At the grid point closest to Davies Dome (model altitude 504 m a.s.l.), modelled air temperature reached −2.0 °C, which is in good agreement with the observations (−1.9 °C). At that time, a region of warmer air occurred at the foot of the James Ross Island northeastern slopes (Figure 7c). Moderate south to southwest flow over high-altitude areas of James Ross Island and its increase in strength over the leeward slopes suggest the possible influence of foehn-like processes in this regional warming. The air temperature contrast between this warm air region and the cold air pool over the Prince Gustav Channel reached ~14 °C.
4. Discussion and Conclusions
The aim of this study was to contribute to the knowledge of the WRF model performance in Antarctica. At present, the Czech climate monitoring program on James Ross Island provides a suitable set of surface weather observations that can be used for sensitivity testing of the numerical model outputs and characterization of the strengths and weaknesses of the WRF simulations. We have focused on the ability of the WRF model at 700 m horizontal resolution to simulate air temperature, wind speed and direction in the complex topography of the northern part of James Ross Island.
Overall, the results suggest that the WRF model is able to reliably simulate air temperature. The mean biases over both winter and summer periods were between −1.7 °C to 1.4 °C while the correlation coefficients reached 0.75 to 0.98, respectively. These results are comparable or slightly better than those seen in other WRF model validation studies in Antarctica (Table 5). A relatively low air temperature bias in our 700 m simulations is in agreement with Turton et al. [15] who presented lower bias for a simulation with 1.5 km resolution compared to a 5 km run. Marginally less accurate results of Tastula et al. [24], Bromwich et al. [22] and Deb et al. [19] may be partly caused by the lower horizontal resolution (5 km or more) used in these studies. As in the study by Tastula et al. [24], we ran the WRF model with a high number of vertical (eta) levels to obtain a good vertical resolution through the lower atmosphere. Whether or not increased vertical resolution had a positive impact on temperature bias is not clear since Claremar et al. [21] reported improvements mainly for wind speed and radiation fluxes. A detailed sea ice dataset from the University of Bremen and the REMA elevation model could also be beneficial for model performance. Note that the impact of other factors on model accuracy, such as local climate specifics (e.g., the frequency and strength of air temperature inversion, presence of a mesoscale circulation), cannot be ruled out. Several options in our standard-WRF setup originating from Polar WRF (e.g., fractional sea ice) could also contribute to the relatively good results. However, rigorous testing of different settings (except for BL schemes) is outside the scope of this work. Compared to the RACMO2 and MetUM results from the Larsen C Ice Shelf (Table 5), the WRF model on James Ross Island performed better in terms of correlation coefficients but produced larger bias in some cases.
Table 5.
Validation statistics for air temperature and wind speed simulations by standard (this study) or Polar WRF in Antarctica. Note: if more values were reported, the minimum and maximum values are shown. Values of bias and RMSE rounded to one decimal point. In addition to the WRF model results, validation statistics of the RACMO2 and MetUM models by King et al. [30] are shown for comparison.
Comparable studies using the Polar WRF (Table 5) for surface wind speed simulations indicate that the WRF model on James Ross Island performed similarly well as in other Antarctic studies except for a very high bias at the coastal Mendel Station in winter (up to 5.1 m·s−1). As the validation statistics for the glacier site (Davies Dome) were significantly better than at Mendel Station, it might be that this high bias was related to unresolved local-scale effects and processes rather than errors in large-scale flow. Based on Table 5, the wind speed overestimation and lower correlation between observed and modelled data compared with air temperature seems to be a common problem of the WRF model (either Polar or standard version) in many Antarctic regions. Interestingly, the RACMO2 and MetUM models produced a slightly negative wind speed bias [30] over the Larsen C Ice Shelf.
The WRF model accuracy varied between observational sites and seasons. Based on Figure 2, the model had difficulties in the simulation of winter air temperature inversion at the coastal Mendel Station and low‑lying sites such as Abernethy Flats. This may be linked to wind speed overestimation and enhanced boundary layer mixing at low altitude sites during that period (Figure 3; cf. Bromwich et al. [22]). Interestingly, a strong inversion was correctly simulated over Prince Gustav Channel (~3 km from the coastline), which confirms the ability of the WRF model to develop a very stably stratified boundary layer. However, the reason that this did not occur at Mendel Station remains unclear. The 700 m horizontal resolution used in this study still may not be high enough to accurately simulate air temperature and wind field over steep coastal areas during a strong near-ground inversion. In contrast, significantly better results were achieved at all sites under southwestern advection with a high wind speed and less stable stratification on 26 May 2019 at 12 UTC. Therefore, we suppose that the synoptic-scale pattern had a strong impact on the model performance in our simulations, most notably in low-altitude or coastal sites, which are prone to the development of a very stable stratification in the lowest tens of meters. Nevertheless, we found that at higher elevations on James Ross Island, sensitivity to synoptic-scale forcing seems to be reduced. Differences in the WRF model performance under various regional‑scale circulation patterns were also described from the eastern Larsen C Ice Shelf by Turton et al. [15]. Interestingly, the authors reported higher accuracy under foehn flow than during a cold, non‑foehn situation. This persistent inaccuracy during low air temperature events is a feature that was not observed over James Ross Island (Figure 2) and may be attributed either to local specifics of the Larsen C Ice Shelf, different synoptic‑scale settings within the study period or changes in model setup.
The WRF model tends to slightly overestimate summer air temperatures at the icefree volcanic mesa (Johnson Mesa) whilst an underestimation occurred on glaciated sites (Whisky Glacier, Davies Dome). This may suggest certain effects of land cover type, but a relatively large difference between the model and the real Johnson Mesa altitude (−79 m) could also contribute to an overestimation of modelled air temperature at this site. It must be stressed that other factors, especially local topography, could also mask possible impacts of land-cover type. Furthermore, limited glacier coverage in the study area may not allow substantial land-cover-driven contrasts in model performance to develop.
With respect to wind speed simulation, the WRF model output showed a positive bias during high wind speed events (Figure 3). A similar problem was reported from Svalbard and explained by an interference of regional flow and local topography at 1-km resolution [23]. The role of surrounding terrain on the positive wind speed bias during high wind speed events on James Ross Island cannot be excluded. However, results from other Antarctic sites (Table 5) suggest this bias may be a more general feature of WRF applications in Antarctica. It is likely that the positive bias did not arise from the ERA5 reanalysis used for WRF initialization and forcing, since it produced fairly negative biases during the validation periods (Table 3 and Table 4).
The comparison of near-surface observations with the WRF simulation showed that model outputs were only moderately sensitive to the choice of the boundary layer scheme (MYJ, MYNN, QNSE). We found that the QNSE scheme gave the best results for air temperature at higher altitudes in winter and at lower altitudes in summer. The MYJ scheme was the most accurate at low altitudes in winter, and the MYNN scheme only at glaciated sites in summer. Small differences between schemes in this study are in contrast with Bromwich et al. [22] reporting MYNN up to 2 °C less accurate than MYJ. Deb et al. [19] also described contrasts of up to 0.9 °C between MYNN and MYJ schemes. The behavior of different schemes around Antarctica confirms the need for local testing and validation of multiple available BL schemes. With regard to wind speed, good simulation accuracy was found for the MYNN scheme both at coastal and higher altitude sites or glaciers, reflected by the generally low bias. However, this scheme also produced the lowest correlation coefficients at Davies Dome.
The main conclusions of the study can be summarized as follows:
- The WRF model, with a very high spatial resolution and daily satellite sea ice input data, successfully captured air temperature over the Ulu Peninsula (bias of −1.7 °C to 1.4 °C, rxy = 0.75 to 0.98) with no significant seasonal variation in bias and higher rxy in winter than in summer. The model was within 2 °C of observation values in 47–72% of the winter period and 66–79% of the summer period. Wind speed was also successfully captured with a reasonable bias (−0.2 to 2.2 m·s−1), and only at Mendel Station in winter, a bias of 2.8–5.1 m·s−1 was observed. The correlation coefficients for wind speed were lower than for air temperature (0.41–0.93). Wind direction was not investigated in great detail, but the presented results indicate good correspondence between observed and modelled wind direction.
- The largest differences in air temperature simulation were caused by failure of the model to correctly reproduce air temperature inversion occurring at coastal and low‑altitude sites. Furthermore, the model had difficulty simulating very high summer temperature peaks at glacier sites. Regarding synoptic-scale forcing, the WRF model performed very well under strong synoptic-scale flow forced by a low pressure center over the Weddell Sea and slightly stable stratification. We found a problem in the computation of air temperature and wind speed at coastal or lower‑altitude sites under weak synoptic forcing (the northern edge of the air pressure trough) accompanied by the occurrence of mesoscale atmospheric processes (cold air formation over the Prince Gustav Channel, leeside warming at the foot of James Ross Island northeastern slopes).
- Despite overall good performance by the model, our results stress the need for further improvements to the WRF model, e.g., higher resolution of input datasets (and computational domains) or more sophisticated parameterizations of subgrid-scale processes.
Author Contributions
Conceptualization, M.M. and K.L.; Data curation, M.M., K.L. and K.J.; Formal analysis, M.M.; Funding acquisition, K.L.; Investigation, M.M., K.L., K.J. and J.H.; Methodology, M.M. and K.L.; Project administration, K.L.; Resources, M.M., K.L. and K.J.; Software, M.M.; Supervision, M.M. and K.L.; Validation, M.M., K.L. and J.H.; Visualization, M.M. and K.L.; Writing—original draft, M.M.; Writing—review & editing, K.L., K.J. and J.H. All authors have read and agreed to the published version of the manuscript.
Funding
This work was supported by the Czech Science Foundation project “GA20-20240S”, the project “ECOPOLARIS (CZ.02.1.01/0.0/0.0/16_013/0001708)” funded by the Ministry of Education, Youth and Sports of the Czech Republic and the project of Masaryk University “MUNI/A/1570/2020”.
Institutional Review Board Statement
Not applicable.
Informed Consent Statement
Not applicable.
Data Availability Statement
The study did not report any data.
Acknowledgments
The authors appreciate the field work done by the members of Czech expeditions to James Ross Island. Anne C. Fouilloux and Daniel F. Steinhoff are thanked for their help with the implementation of the University Bremen sea ice data into the WRF model. Access to the CERIT‑SC computing and storage facilities provided by the CERIT-SC Center, under the program “Projects of Large Research, Development, and Innovations Infrastructures” (CERIT Scientific Cloud LM2015085), is greatly appreciated.
Conflicts of Interest
The authors declare no conflict of interest. The funders had no role in the design of the study; in the collection, analyses, or interpretation of data; in the writing of the manuscript, or in the decision to publish the results.
References
- Scambos, T.; Hulbe, C.; Fahnestock, M. Climate-Induced Ice Shelf Disintegration in the Antarctic Peninsula. In Antarctic Peninsula Climate Variability: Historical & Paleoenvironmental Perspectives; Domack, E., Ed.; American Geophysical Union: Washington, DC, USA, 2003; pp. 79–92. [Google Scholar]
- Engel, Z.; Laska, K.; Nývlt, D.; Stachoň, Z. Surface mass balance of small glaciers on James Ross Island, north-eastern Antarctic Peninsula, during 2009–2015. J. Glaciol. 2018, 64, 349–361. [Google Scholar] [CrossRef]
- Oliva, M.; Navarro, F.; Hrbáček, F.; Hernández, A.; Nývlt, D.; Pereira, P.; Ruiz-Fernández, J.; Trigo, R. Recent regional climate cooling on the Antarctic Peninsula and associated impacts on the cryosphere. Sci. Total Environ. 2017, 580, 210–223. [Google Scholar] [CrossRef] [PubMed]
- Convey, P. Terrestrial biodiversity in Antarctica—Recent advances and future challenges. Polar Sci. 2010, 4, 135–147. [Google Scholar] [CrossRef]
- Kavan, J.; Nedbalová, L.; Nývlt, D.; Čejka, T.; Lirio, J.M. Status and short-term environmental changes of lakes in the area of Devil’s Bay, Vega Island, Antarctic Peninsula. Antarct. Sci. 2020, 1–15. [Google Scholar] [CrossRef]
- King, J.C.; Turner, J.; Marshall, G.J.; Connolley, W.M.; Lachlan-Cope, T.A. Antarctic Peninsula Climate Variability and It’s Causes as Revealed by Analysis of Instrumental Records. In Antarctic Research Series; American Geophysical Union: Washington, DC, USA, 2013; pp. 17–30. [Google Scholar]
- Turner, J.; Lu, H.; White, I.; King, J.C.; Phillips, T.; Hosking, J.S.; Bracegirdle, T.J.; Marshall, G.J.; Mulvaney, R.; Deb, P. Absence of 21st century warming on Antarctic Peninsula consistent with natural variability. Nat. Cell Biol. 2016, 535, 411–415. [Google Scholar] [CrossRef] [PubMed]
- Braun, M.; Hock, R. Spatially distributed surface energy balance and ablation modelling on the ice cap of King George Island (Antarctica). Glob. Planet. Chang. 2004, 42, 45–58. [Google Scholar] [CrossRef]
- Jonsell, U.Y.; Navarro, F.J.; Bañón, M.; Lapazaran, J.J.; Otero, J. Sensitivity of a distributed temperature-radiation index melt model based on AWS observations and surface energy balance fluxes, Hurd Peninsula glaciers, Livingston Island, Antarctica. Cryosphere 2012, 6, 539–552. [Google Scholar] [CrossRef]
- Barrand, N.E.; Vaughan, D.G.; Steiner, N.; Tedesco, M.; Munneke, P.K.; Broeke, M.R.V.D.; Hosking, J.S. Trends in Antarctic Peninsula surface melting conditions from observations and regional climate modeling. J. Geophys. Res. Earth Surf. 2013, 118, 315–330. [Google Scholar] [CrossRef]
- Vaughan, D.G. Institute of Arctic and Alpine Research (INSTAAR) University of Colorado Recent Trends in Melting Conditions on the Antarctic Peninsula and Their Implications for Ice-sheet Mass Balance and Sea Level. Arctic Antarct. Alp. Res. 2006, 38, 147–152. [Google Scholar] [CrossRef]
- Stocker, T.F.; Qin, D.; Plattner, G.-K.; Alexander, L.V.; Allen, S.K.; Bindoff, N.L.; Breon, F.-M.; Church, J.A.; Cubash, U.; Emori, S.; et al. Technical Summary. In Climate Change 2013: The Physical Science Basis. Contribution of Working Group I to the Fifth Assessment Report of the Intergovernmental Panel on Climate Change; Stocker, T.F., Qin, D., Plattner, G.-K., Tignor, M., Allen, S.K., Boschung, J., Nauels, A., Xia, Y., Bex, V., Midgley, P.M., Eds.; Cambridge University Press: New York, NY, USA, 2013; pp. 33–116. [Google Scholar]
- Cape, M.R.; Vernet, M.; Skvarca, P.; Marinsek, S.; Scambos, T.; Domack, E. Foehn winds link climate-driven warming to ice shelf evolution in Antarctica. J. Geophys. Res. Atmos. 2015, 120, 11. [Google Scholar] [CrossRef]
- Munneke, P.K.; Luckman, A.J.; Bevan, S.L.; Smeets, C.J.P.P.; Gilbert, E.; Broeke, M.R.V.D.; Wang, W.; Zender, C.; Hubbard, B.; Ashmore, D.; et al. Intense Winter Surface Melt on an Antarctic Ice Shelf. Geophys. Res. Lett. 2018, 45, 7615–7623. [Google Scholar] [CrossRef]
- Turton, J.V.; Kirchgaessner, A.; Ross, A.N.; King, J.C. Does high-resolution modelling improve the spatial analysis of föhn flow over the Larsen C Ice Shelf? Weather 2017, 72, 192–196. [Google Scholar] [CrossRef]
- Skamarock, W.C.; Klemp, B.J.; Dudhia, J.; Gill, D.O.; Barker, D.M.; Duda, M.G.; Huang, X.-Y.; Wang, W.; Powers, J.G. A Description of the Advanced Research WRF Version 3; National Center for Atmospheric Research: Boulder, CO, USA, 2008. [Google Scholar] [CrossRef]
- Wang, W.; Bruyere, C.; Duda, M.; Dudhia, J.; Gill, D.; Kavulich, M.; Keene, K.; Chen, M.; Lin, H.-C.; Michalakes, J.; et al. WRF-ARW V3: User’s Guide. 2008. Available online: http://www2.mmm.ucar.edu/wrf/users/docs/user_guide_V3.9/ARWUsersGuideV3.9.pdf (accessed on 20 October 2020).
- Aas, K.S.; Berntsen, T.K.; Boike, J.; Etzelmüller, B.; Kristjánsson, J.E.; Maturilli, M.; Schuler, T.V.; Stordal, F.; Westermann, S. A Comparison between Simulated and Observed Surface Energy Balance at the Svalbard Archipelago. J. Appl. Meteorol. Clim. 2015, 54, 1102–1119. [Google Scholar] [CrossRef][Green Version]
- Deb, P.; Orr, A.; Hosking, J.S.; Phillips, T.; Turner, J.; Bannister, D.; Pope, J.O.; Colwell, S. An assessment of the Polar Weather Research and Forecasting (WRF) model representation of near-surface meteorological variables over West Antarctica. J. Geophys. Res. Atmos. 2016, 121, 1532–1548. [Google Scholar] [CrossRef]
- Kwon, H.; Park, S.; Lee, S.; Kim, B.; Choi, T.; Kim, S. A numerical simulation of a strong wind event in January 2013 at King Sejong station, Antarctica. Q. J. R. Meteorol. Soc. 2019, 145, 1267–1280. [Google Scholar] [CrossRef]
- Claremar, B.; Obleitner, F.; Reijmer, C.; Pohjola, V.; Waxegård, A.; Karner, F.; Rutgersson, A. Applying a Mesoscale Atmospheric Model to Svalbard Glaciers. Adv. Meteorol. 2012, 2012, 1–22. [Google Scholar] [CrossRef]
- Bromwich, D.H.; Otieno, F.O.; Hines, K.M.; Manning, K.W.; Shilo, E. Comprehensive evaluation of polar weather research and forecasting model performance in the Antarctic. J. Geophys. Res. Atmos. 2013, 118, 274–292. [Google Scholar] [CrossRef]
- Láska, K.; Chládová, Z.; Hošek, J. High-resolution numerical simulation of summer wind field comparing WRF boundary-layer parametrizations over complex Arctic topography: Case study from central Spitsbergen. Meteorol. Z. 2017, 26, 391–408. [Google Scholar] [CrossRef]
- Tastula, E.-M.; Vihma, T.; Andreas, E.L. Evaluation of Polar WRF from Modeling the Atmospheric Boundary Layer over Antarctic Sea Ice in Autumn and Winter. Mon. Weather Rev. 2012, 140, 3919–3935. [Google Scholar] [CrossRef]
- Tastula, E.-M.; Vihma, T. WRF Model Experiments on the Antarctic Atmosphere in Winter. Mon. Weather Rev. 2011, 139, 1279–1291. [Google Scholar] [CrossRef]
- UCAR: AMPS Grids. 2018. Available online: https://www2.mmm.ucar.edu/rt/amps/information/configuration/maps_2017101012/maps.html (accessed on 8 January 2021).
- Liu, Y.; Wang, Y.; Ding, M.; Sun, W.; Zhang, T.; Xu, Y. Evaluation of the Antarctic Mesoscale Prediction System based on snow accumulation observations over the Ross Ice Shelf. Adv. Atmos. Sci. 2017, 34, 587–598. [Google Scholar] [CrossRef]
- Wille, J.D.; Bromwich, D.H.; Cassano, J.J.; Nigro, M.A.; Mateling, M.E.; Lazzara, M.A. Evaluation of the AMPS Boundary Layer Simulations on the Ross Ice Shelf, Antarctica, with Unmanned Aircraft Observations. J. Appl. Meteorol. Clim. 2017, 56, 2239–2258. [Google Scholar] [CrossRef]
- Wille, J.D.; Bromwich, D.H.; Nigro, M.A.; Cassano, J.J.; Mateling, M.; Lazzara, M.A.; Wang, S.-H. Evaluation of the AMPS Boundary Layer Simulations on the Ross Ice Shelf with Tower Observations. J. Appl. Meteorol. Clim. 2016, 55, 2349–2367. [Google Scholar] [CrossRef]
- King, J.C.; Gadian, A.; Kirchgaessner, A.; Munneke, P.K.; Lachlan-Cope, T.A.; Orr, A.; Reijmer, C.; Broeke, M.R.V.D.; Van Wessem, J.M.; Weeks, M. Validation of the summertime surface energy budget of Larsen C Ice Shelf (Antarctica) as represented in three high-resolution atmospheric models. J. Geophys. Res. Atmos. 2015, 120, 1335–1347. [Google Scholar] [CrossRef]
- Van Wessem, J.M.; Reijmer, C.H.; Van De Berg, W.J.; Broeke, M.R.V.D.; Cook, A.J.; Van Ulft, L.H.; Van Meijgaard, E. Temperature and Wind Climate of the Antarctic Peninsula as Simulated by a High-Resolution Regional Atmospheric Climate Model. J. Clim. 2015, 28, 7306–7326. [Google Scholar] [CrossRef]
- Elvidge, A.D.; Munneke, P.K.; King, J.C.; Renfrew, I.A.; Gilbert, E. Atmospheric Drivers of Melt on Larsen C Ice Shelf: Surface Energy Budget Regimes and the Impact of Foehn. J. Geophys. Res. Atmos. 2020, 125. [Google Scholar] [CrossRef]
- Van Wessem, J.M.; Ligtenberg, S.R.M.; Reijmer, C.H.; Van De Berg, W.J.; Broeke, M.R.V.D.; Barrand, N.E.; Thomas, E.R.; Turner, J.; Wuite, J.; Scambos, T.A.; et al. The modelled surface mass balance of the Antarctic Peninsula at 5.5 km horizontal resolution. Cryosphere 2016, 10, 271–285. [Google Scholar] [CrossRef]
- Aas, K.S.; Dunse, T.; Collier, E.; Schuler, T.V.; Berntsen, T.K.; Kohler, J.; Luks, B. The climatic mass balance of Svalbard glaciers: A 10-year simulation with a coupled atmosphere-glacier mass balance model. Cryosphere 2016, 10, 1089–1104. [Google Scholar] [CrossRef]
- Hock, R. Temperature index melt modelling in mountain areas. J. Hydrol. 2003, 282, 104–115. [Google Scholar] [CrossRef]
- Leeson, A.A.; Van Wessem, J.M.; Ligtenberg, S.R.M.; Shepherd, A.; Broeke, M.R.V.D.; Killick, R.; Skvarca, P.; Marinsek, S.; Colwell, S. Regional climate of the Larsen B embayment 1980–2014. J. Glaciol. 2017, 63, 683–690. [Google Scholar] [CrossRef]
- Sauter, T.; Möller, M.; Finkelnburg, R.; Grabiec, M.; Scherer, D.; Schneider, C. Snowdrift modelling for the Vestfonna ice cap, north-eastern Svalbard. Cryosphere 2013, 7, 1287–1301. [Google Scholar] [CrossRef]
- Leonard, K.C.; Maksym, T. The importance of wind-blown snow redistribution to snow accumulation on Bellingshausen Sea ice. Ann. Glaciol. 2011, 52, 271–278. [Google Scholar] [CrossRef]
- Davies, B.J.; Glasser, N.F.; Carrivick, J.L.; Hambrey, M.J.; Smellie, J.L.; Nývlt, D. Landscape evolution and ice-sheet behaviour in a semi-arid polar environment: James Ross Island, NE Antarctic Peninsula. Geol. Soc. Lond. Spéc. Publ. 2013, 381, 353–395. [Google Scholar] [CrossRef]
- Engel, Z.; Kropáček, J.; Smolíková, J. Surface elevation changes on Lachman Crags ice caps (north-eastern Antarctic Peninsula) since 1979 indicated by DEMs and ICESat data. J. Glaciol. 2019, 65, 1–12. [Google Scholar] [CrossRef]
- Kavan, J.; Ondruch, J.; Nývlt, D.; Hrbáček, F.; Carrivick, J.L.; Láska, K. Seasonal hydrological and suspended sediment transport dynamics in proglacial streams, James Ross Island, Antarctica. Geogr. Ann. Ser. A Phys. Geogr. 2016, 99, 38–55. [Google Scholar] [CrossRef]
- Mlčoch, B.; Nývlt, D.; Mixa, P. Geological Map of James Ross Island—Northern Part 1: 25,000; Czech Geological Survey: Prague, Czech Republic, 2018. [Google Scholar]
- Morris, E.M.; Vaughan, D.G. Spatial and temporal variability of surface temperature on the Antarctic Peninsula and the limit of viability of ice shelves. In Antarctic Peninsula Climate Variability: Historical & Paleoenvironmental Perspectives; Domack, E., Ed.; American Geophysical Union: Washington, DC, USA, 2003; pp. 61–68. [Google Scholar]
- Hrbáček, F.; Láska, K.; Engel, Z. Effect of Snow Cover on the Active-Layer Thermal Regime—A Case Study from James Ross Island, Antarctic Peninsula. Permafr. Periglac. Process. 2015, 27, 307–315. [Google Scholar] [CrossRef]
- Ambrožová, K.; Láska, K. Změny teploty na ostrově Jamese Rosse v kontextu Antarktického poloostrova. In Sborník Příspěvků Výroční Konference České Geografické Společnosti; Jihočeská univerzita v Českých Budějovicích: České Budějovice, Czech Republic, 2016; pp. 20–25. [Google Scholar]
- Hrbáček, F.; Uxa, T. The evolution of a near-surface ground thermal regime and modeled active-layer thickness on James Ross Island, Eastern Antarctic Peninsula, in 2006–2016. Permafr. Periglac. Process. 2020, 31, 141–155. [Google Scholar] [CrossRef]
- Ambrozova, K.; Laska, K.; Hrbacek, F.; Kavan, J.; Ondruch, J. Air temperature and lapse rate variation in the ice-free and glaciated areas of northern James Ross Island, Antarctic Peninsula, during 2013–2016. Int. J. Clim. 2018, 39, 643–657. [Google Scholar] [CrossRef]
- Ambrožová, K.; Láska, K.; Kavan, J. Multi-year assessment of atmospheric circulation and impacts on air temperature variation on James Ross Island, Antarctic Peninsula. Int. J. Clim. 2020, 40, 1526–1541. [Google Scholar] [CrossRef]
- Stachon, Z. Czech Geological Survey: James Ross Island—Northern part. In Topographic Map 1: 25 000, 1st ed.; Czech Geological Survey: Prague, Czech Republic, 2009; ISBN 978-80-7075-734-5. [Google Scholar]
- Howat, I.M.; Porter, C.; Smith, B.E.; Noh, M.-J.; Morin, P. The Reference Elevation Model of Antarctica. Cryosphere 2019, 13, 665–674. [Google Scholar] [CrossRef]
- Hersbach, H.; Bell, B.; Berrisford, P.; Hirahara, S.; Horányi, A.; Muñoz-Sabater, J.; Nicolas, J.; Peubey, C.; Radu, R.; Schepers, D.; et al. The ERA5 global reanalysis. Q. J. R. Meteorol. Soc. 2020, 146, 1999–2049. [Google Scholar] [CrossRef]
- Spreen, G.; Kaleschke, L.; Heygster, G. Sea ice remote sensing using AMSR-E 89-GHz channels. J. Geophys. Res. Space Phys. 2008, 113. [Google Scholar] [CrossRef]
- British Antarctic Survey: SCAR Antarctic Digital Database. 2019. Available online: https://add.data.bas.ac.uk/repository/entry/show?entryid=f477219b-9121-44d6-afa6-d8552762dc45 (accessed on 14 October 2018).
- Kern, S.; Ozsoy-Çiçek, B.; Worby, A.P. Antarctic Sea-Ice Thickness Retrieval from ICESat: Inter-Comparison of Different Approaches. Remote Sens. 2016, 8, 538. [Google Scholar] [CrossRef]
- Warner, T.T. Numerical Weather and Climate Prediction; Amsterdam University Press: Amsterdam, The Netherlands, 2009; p. 21. [Google Scholar]
- Janjić, Z.I. The Step-Mountain Eta Coordinate Model: Further Developments of the Convection, Viscous Sublayer, and Turbulence Closure Schemes. Mon. Weather Rev. 1994, 122, 927–945. [Google Scholar] [CrossRef]
- Nakanishi, M.; Niino, H. Development of an Improved Turbulence Closure Model for the Atmospheric Boundary Layer. J. Meteorol. Soc. Jpn. 2009, 87, 895–912. [Google Scholar] [CrossRef]
- Sukoriansky, S.; Galperin, B.; Perov, V. Application of a new Spectral Theory of Stably Stratified Turbulence to the Atmospheric Boundary Layer over Sea Ice. Boundary-Layer Meteorol. 2005, 117, 231–257. [Google Scholar] [CrossRef]
- Tastula, E.-M.; LeMone, M.A.; Dudhia, J.; Galperin, B. The impact of the QNSE-EDMF scheme and its modifications on boundary layer parameterization in WRF: Modelling of CASES-97. Q. J. R. Meteorol. Soc. 2016, 142, 1182–1195. [Google Scholar] [CrossRef]
- Falk, U.; López, D.A.; Silva-Busso, A. Multi-year analysis of distributed glacier mass balance modelling and equilibrium line altitude on King George Island, Antarctic Peninsula. Cryosphere 2018, 12, 1211–1232. [Google Scholar] [CrossRef]
- Arndt, S.; Paul, S. Variability of Winter Snow Properties on Different Spatial Scales in the Weddell Sea. J. Geophys. Res. Oceans 2018, 123, 8862–8876. [Google Scholar] [CrossRef]
- Van Kampenhout, L.; Lenaerts, J.T.M.; Lipscomb, W.H.; Sacks, W.J.; Lawrence, D.M.; Slater, A.G.; Broeke, M.R.V.D. Improving the Representation of Polar Snow and Firn in the Community Earth System Model. J. Adv. Model. Earth Syst. 2017, 9, 2583–2600. [Google Scholar] [CrossRef]
- Thompson, G.; Field, P.R.; Rasmussen, R.M.; Hall, W.D. Explicit Forecasts of Winter Precipitation Using an Improved Bulk Microphysics Scheme. Part II: Implementation of a New Snow Parameterization. Mon. Weather Rev. 2008, 136, 5095–5115. [Google Scholar] [CrossRef]
- Iacono, M.J.; Delamere, J.S.; Mlawer, E.J.; Shephard, M.W.; Clough, S.A.; Collins, W.D. Radiative forcing by long-lived greenhouse gases: Calculations with the AER radiative transfer models. J. Geophys. Res. Space Phys. 2008, 113. [Google Scholar] [CrossRef]
- Niu, G.-Y.; Yang, Z.-L.; Mitchell, K.E.; Chen, F.; Ek, M.B.; Barlage, M.; Kumar, A.; Manning, K.; Niyogi, D.; Rosero, E.; et al. The community Noah land surface model with multiparameterization options (Noah-MP): 1. Model description and evaluation with local-scale measurements. J. Geophys. Res. Space Phys. 2011, 116. [Google Scholar] [CrossRef]
- Johnson, H.K. Simple expressions for correcting wind speed data for elevation. Coast. Eng. 1999, 36, 263–269. [Google Scholar] [CrossRef]
- Sukoriansky, S. Implementation of the Quasi-Normal Scale Elimination (QNSE) Model of Stably Stratified Turbulence in WRF; Ben-Gurion University of the Negev: Beer Sheva, Israel, 2008; p. 1. [Google Scholar]
Publisher’s Note: MDPI stays neutral with regard to jurisdictional claims in published maps and institutional affiliations. |
© 2021 by the authors. Licensee MDPI, Basel, Switzerland. This article is an open access article distributed under the terms and conditions of the Creative Commons Attribution (CC BY) license (http://creativecommons.org/licenses/by/4.0/).