Article

Seasonal Variations of Volcanic Ash and Aerosol Emissions around Sakurajima Detected by Two Lidars

1
National Institute for Environmental Studies, Tsukuba 305-8506, Japan
2
Sakurajima Volcano Research Center, Disaster Prevention Research Institute, Kyoto University, Kagoshima 891-1419, Japan
*
Author to whom correspondence should be addressed.
Atmosphere 2021, 12(3), 326; https://doi.org/10.3390/atmos12030326
Submission received: 29 January 2021 / Revised: 22 February 2021 / Accepted: 26 February 2021 / Published: 3 March 2021

Abstract

:
Two polarization-sensitive lidars were operated continuously to monitor the three-dimensional distribution of small volcanic ash particles around Sakurajima volcano, Kagoshima, Japan. Here, we estimated monthly averaged extinction coefficients of particles between the lidar equipment and the vent and compared our results with monthly records of volcanic activity reported by the Japan Meteorological Agency, namely the numbers of eruptions and explosions, the density of ash fall, and the number of days on which ash fall was observed at the Kagoshima observatory. Elevated extinction coefficients were observed when the surface wind direction was toward the lidar. Peaks in extinction coefficient did not always coincide with peaks in ash fall density, and these differences likely indicate differences in particle size.

1. Introduction

Volcanic eruptions are a natural source of atmospheric aerosols [1]. In the troposphere and stratosphere, gaseous SO 2 is converted to sulfate or sulfuric acid within several days, which can remain in the atmosphere for more than a week. Furthermore, volcanic ash directly impacts atmospheric turbulence and harms airplane engines if the pilots are unaware that such particles are present on their flight path. For example, the 2010 eruption of Eyjafjallajökull, Iceland, infamously hindered aviation in Europe [2,3,4]. For populations near volcanoes, the impacts of volcanic ash are more severe than those of atmospheric sulfate because the conversion of SO 2 to sulfate occurs more remotely due to its atmospheric processing time (0.1–1.5%/h) [5]. In addition, fine ash is detrimental to human health because it is effectively captured by the lungs. Thus, monitoring equipment around volcanoes target volcanic ash, not sulfate, an indispensable task for mitigating the impacts of eruptions. The optical properties of volcanic ash also affect solar radiation at the surface. For solar power stations, aerosol optical depth (AOD) is important to estimate the effectiveness of solar power generation. Although AOD can be retrieved over broad areas from satellite-borne passive sensors such as the Advance Himawari Imager onboard Himawari-8 [6], optical properties observed by active lidar sensing are more accurate because horizontal variations are non-negligible in individual pixels of satellite data. Volcanic ash can be detected remotely at various electromagnetic wavelengths. Although particles larger than ∼1 mm are readily detected at very high spatiotemporal resolution in the atmosphere by longer wavelength radar (>1 cm) [7], those systems are not sensitive to smaller advected particles. In contrast, lidar is very sensitive to smaller particles such as fine ash because it utilizes visible to infrared light [8,9,10,11]. Here, we describe volcanic ash observations using two lidars near Sakurajima volcano, Japan. We compare the monthly averaged ash distributions obtained using the two lidars. Finally, we discuss the relationships among extinction coefficient, volcanic activity at Sakurajima, and horizontal wind direction.

2. Lidar Observation and Supplemental Information

Lidar instruments are installed at the Observatory of Sakurajima Volcano Research Center, Disaster Prevention Research Institute (DPRI), Kyoto University (SVO, 31.590 N, 130.601 E), and the Kurokami observation facility (KUR, 31.584 N, 130.702 E). Although both lidars have horizontal and vertical scanning capabilities, this study targeted ash distributions along the lines of sight from the observation points to the Minamidake vent and excluded scanning data. We note that the SVO lidar line of sight was fixed on Minamidake during 2017–2019. Although eruptions in 2017 occurred at the Showa vent, ∼0.5 km east of Minamidake, they were thus captured within the line of sight of that lidar. The locations of the SVO and KUR lidars and their observation directions are shown in Figure 1.
Lidar specifications are similar to those of the instrument used in the Asian dust and aerosol lidar observation network, AD-Net [12]. The lidar emits the fundamental (1064 nm) and second-order harmonics (532 nm) of a Nd:YAG laser at a 20 Hz pulse rate. Backscattered light from the atmosphere is detected through a 20-cm-diameter telescope by photo-multiplier tubes (532 nm) or an avalanche photodiode (1064 nm). The polarization of the 532-nm light is also recorded. A single profile is obtained by averaging signals for 2 s (40 pulses), and then the system waits 8 s before obtaining another profile. Thus, the time resolution of the system is 10 s and the range resolution is set to 6 m; a typical observation sequence obtained using the SVO lidar during an eruption at Sakurajima is shown in Figure 2. Backscatter intensity is a fundamental quantity that is proportional to the total surface area of particles in the observed volume. In the example of Figure 2, a strong signal at 532 nm appeared at 07:20 JST near the vent (5 km range) and approached the lidar at a velocity of 2 km/7 min (17 km/h). Note that this apparent (radial) velocity does not directly indicate the advection velocity of the ash because it is not necessarily parallel to the instrument’s line of sight. Within 2.5 km of the lidar, the thickness of the strong signal increased to more than 0.5 km when it merged with a pre-existing moderate signal. The depolarization ratio of this strong signal was greater than 0.3, indicating the dominance of non-spherical particles, and the coinciding strong signal at 1064 nm implies that the particles were large enough (>1 μ m) to be detected at infrared wavelengths.
The good correspondence between the strong backscattering and high depolarization ratio of the signal (Figure 2) indicates that the particles detected near the vent were non-spherical and solid—i.e., volcanic ash. Therefore, we hereafter use the total backscatter at 532 nm to indicate volcanic aerosols. The backscatter intensity at range R, I(R), is the product of the backscatter coefficient of the particles and the two-way attenuation over the optical depth between the lidar and the target.
I ( R ) = C β ( R ) exp ( 2 0 R σ ( r ) d r )
where C is a constant and β and σ are the backscatter coefficient and extinction coefficient of particles, respectively. Thus, the lidar signal is strongly attenuated by dense ash volumes. In Figure 2, the signal before 07:30 was very strongly attenuated beyond the peak intensity, indicating that lidar cannot provide any information on areas beyond the near edge of the ash cloud. To compensate for this attenuation, we used Fernald’s [13] method to calculate the extinction coefficient of the aerosol at 532 nm, assuming that backscatter and extinction are proportional ( σ = 50 sr × β ). Because the lidars were directed just above the vent, the backscatter from the atmosphere beyond the vent was treated as the reference area in Fernald’s inversion. Profiles in which the maximum attenuated backscatter coefficient exceeded approximately 4 × 10 5 /sr/km were excluded because they most likely indicate typical clouds of water droplet.
Sakurajima typically produces vulcanian eruptions [14], and four major eruptions occurred during the study period: an eruption at Showa vent on 2 May 2017 and three eruptions at the Minamidake vent on 16 June 2018, 16 July 2018, and 8 November 2019. Monthly information on volcanic activity at Sakurajima is published by the Kagoshima observatory (31.554 N, 130.549 E) of the Japan Meteorological Agency (JMA) [15], including the numbers of eruptions and explosions, the density of ash fall on the ground (g/m 2 ) and the number of days on which ash fall was observed at the Kagoshima observatory (hereafter, “ash fall days”). In addition, the monthly mass of volcanic ash erupted from Sakurajima volcano is estimated by DPRI using ash fall deposits at 62 sampling points within 50 km from the volcano [16]. In the following section, we compare these parameters to the results of our lidar observations. We also analyzed the hourly dominant wind direction at the Kagoshima observatory to better understand the lidar results.

3. Results and Discussion

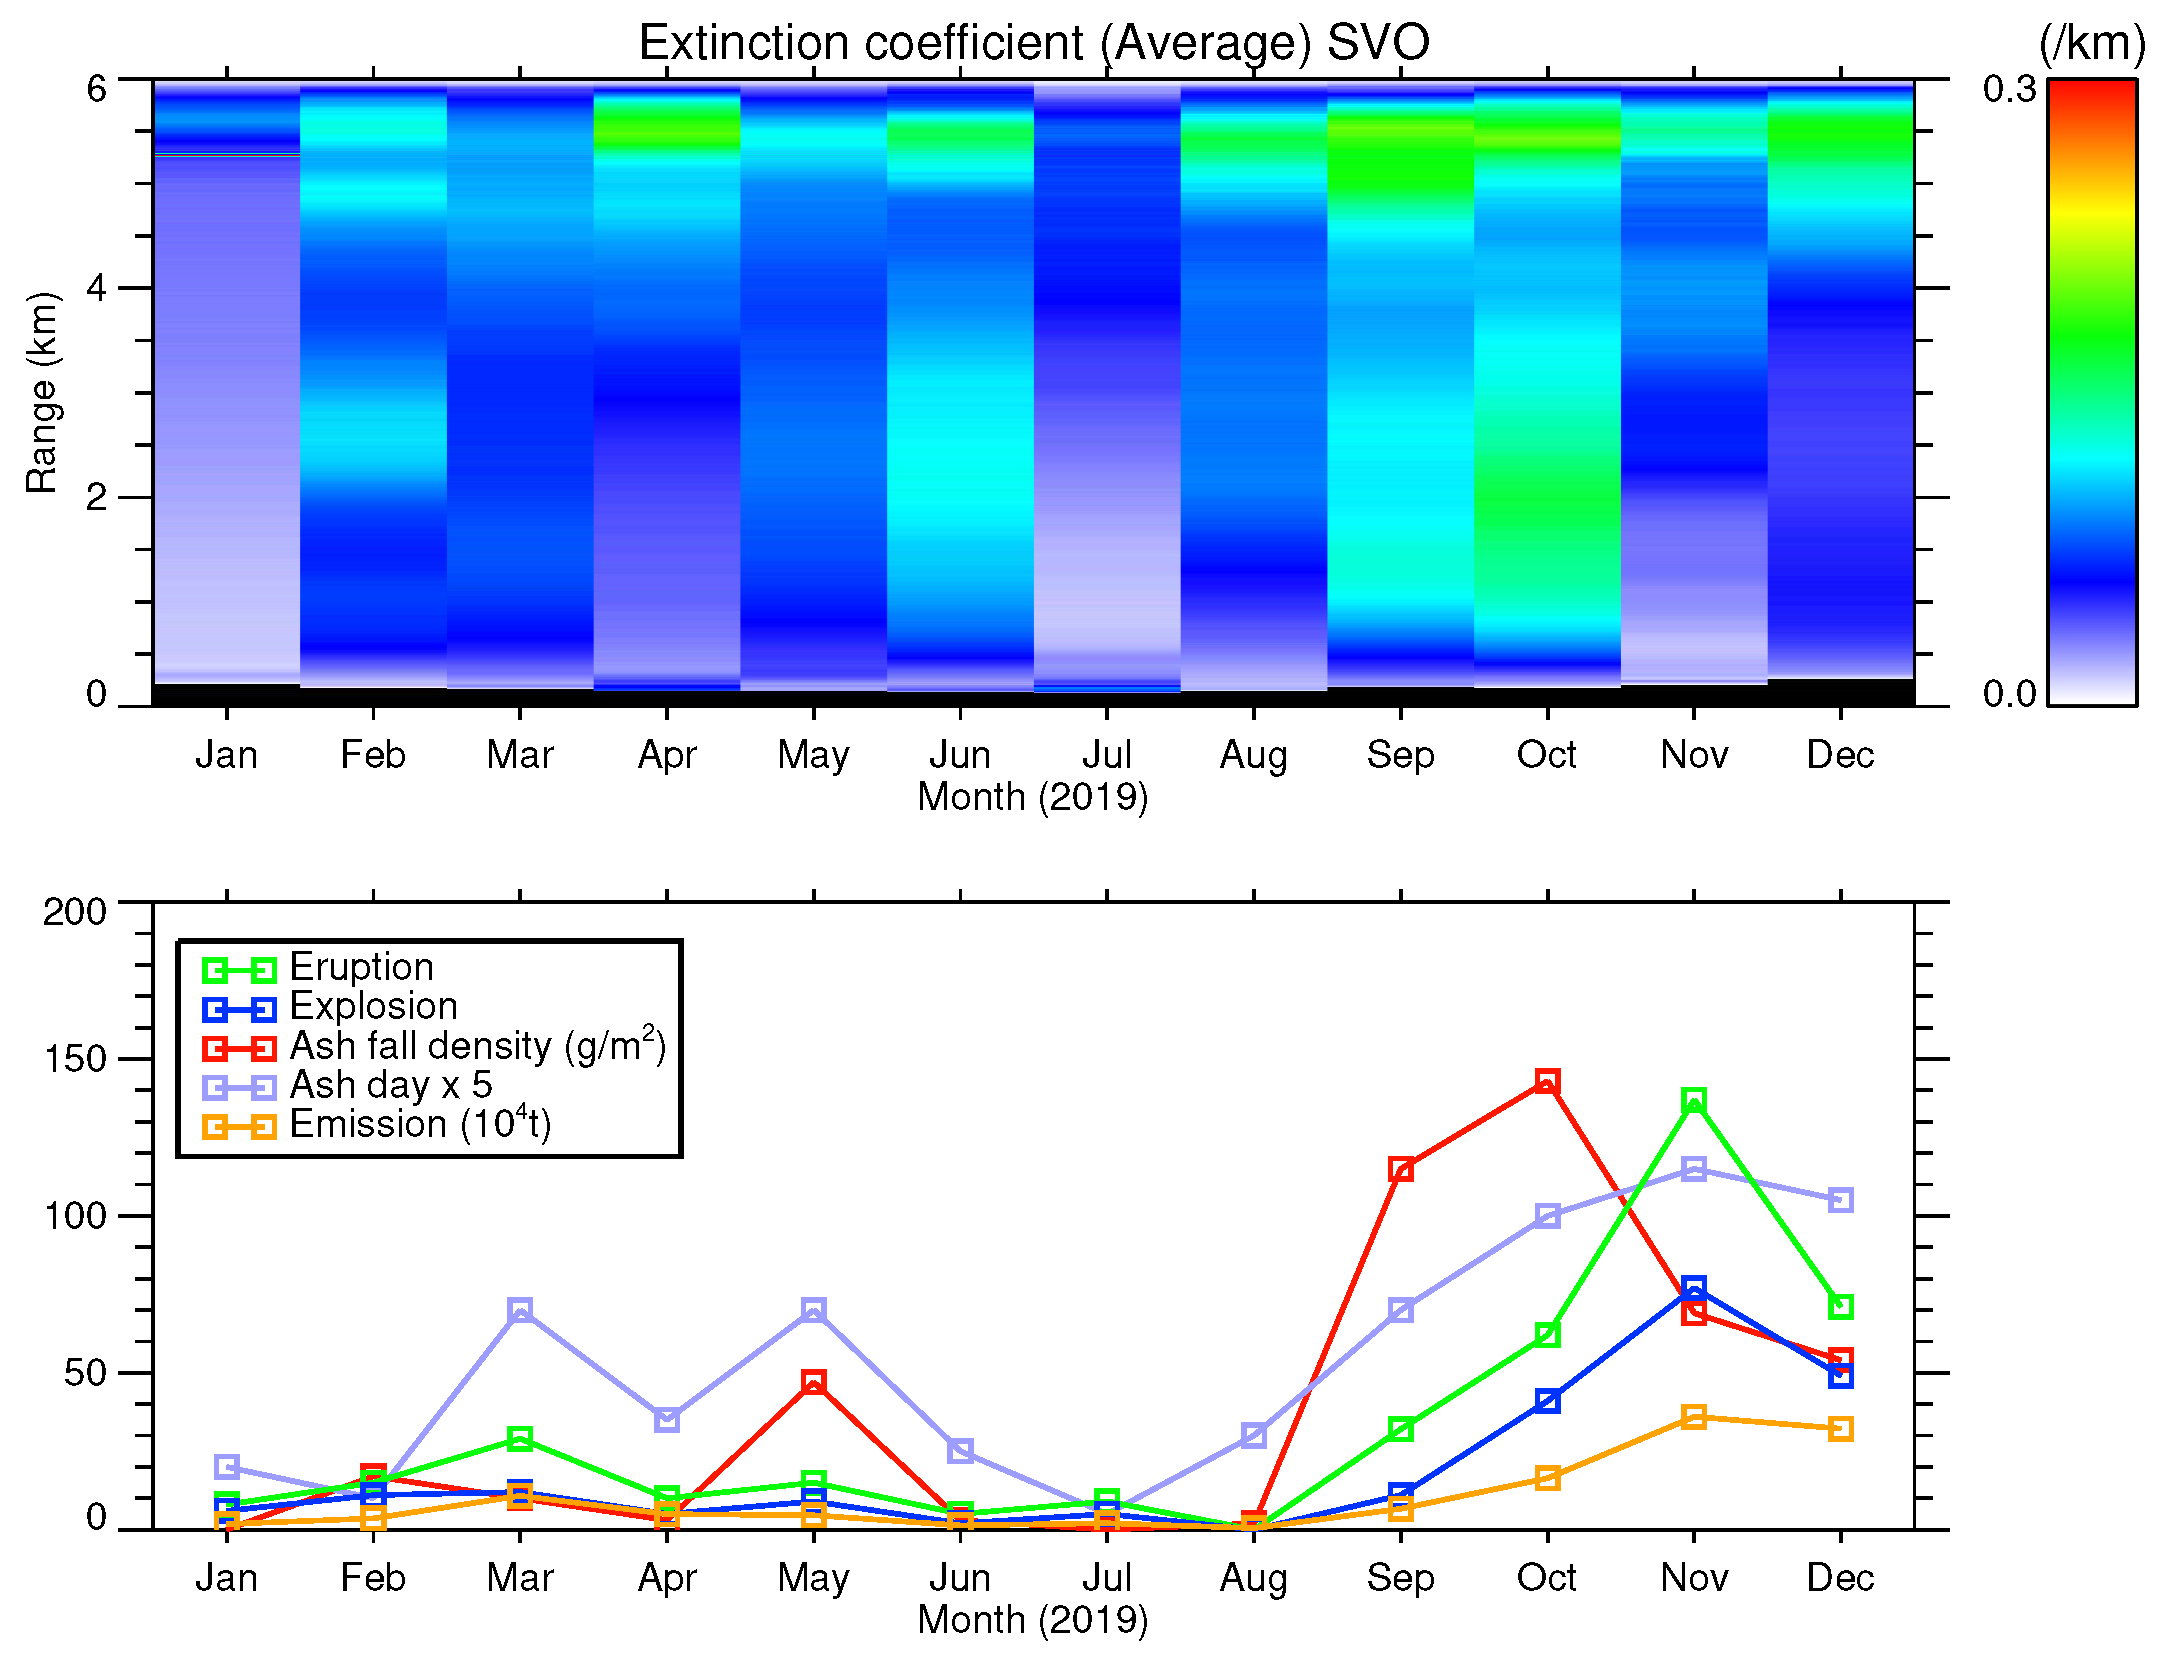
3.1. Seasonal and Annual Variations of Aerosols Detected by SVO Lidar

Range profiles of the extinction coefficient along the line of sight of the SVO lidar were averaged each month to describe temporal variations of aerosols around Sakurajima at seasonal to annual timescales. In 2017, aerosol extinction coefficients were elevated at ranges of 5.5 km, i.e., near Minamidake vent, during May, June, and October–December (Figure 3). Extinction coefficients were also slightly elevated at closer ranges in May and October, although they were markedly lower than those during the following two years (discussed below). The five indices of volcanic activity at Sakurajima reported by JMA and DPRI during 2017 are broadly consistent with our lidar results, although, during the later part of the year, all indices except ash fall days peaked in September. Whereas the most eruptions and explosions occurred in September, extinction coefficients around the vent were not greatly elevated that month.
The monthly mean aerosol extinction coefficient profiles at SVO in 2018 (Figure 4) were more closely related to volcanic activities than those in 2017, especially in terms of ash-related indices (density of ash fall and ash fall days). Notably, the extinction coefficient between the vent and the lidar was continuously large, especially in July and August, indicating the effective transport of ash toward SVO. The lidar profiles also correspond well with the number of ash fall days at Kagoshima observatory. However, the density of ash fall shows a distinct peak in June, whereas the lidar did not detect an increase in extinction coefficient at close range during that time. This may indicate that the ash particles transported westward were larger than during other periods: in this case, the density of ash fall at Kagoshima observatory should be large and the extinction coefficient near the lidar should be small because ash volume and surface area are related to the cube and square of particle size, respectively. We note that, during the large eruption on 16 June 2018 (Figure 2), the wind was blowing from the northeast, which may have resulted in the differential transport of ash to SVO (west-northwest of the bent) and JMA’s Kagoshima observatory (west-southwest). In other months, more statistical relationship between extinction and ash deposition are expected.
In 2019, the extinction coefficient around the vent was not obviously related to volcanic activity, which peaked mainly around November (Figure 5). The extinction coefficient near the vent noes not simply depend on the total amount of ash emitted from the vent, but also on the meteorological conditions such as the horizontal wind speed or the effectiveness of sedimentation processes around the vent. Nonetheless, extinction coefficients were elevated at 0.5–3 km from the lidar in September and October, in agreement with the density of ash fall.
Seasonal peaks in the density of ash fall and the extinction coefficient near the lidar roughly corresponded in 2019, whereas the extinction coefficient near the lidar was not elevated in September and November 2017 despite a moderate peak in ash fall density. This difference implies that the size distribution of ash/aerosols in 2017 differed from that in 2019. Because larger particles contribute more to ash volume than extinction density, the peak in ash fall density in 2017 may reflect the eruption of larger particles in 2017 than in 2019. Actual measurements of airborne particle size distributions are difficult, especially by remote sensing techniques, but combined lidar and cloud-drop radar (mm scale wavelength) measurements [17] might be useful to estimate the size distributions of particles in the air.
Figure 6 summarizes the relationships between extinction coefficient and surface and near-vent indices of volcanic activity. Whereas extinction coefficients near the surface vary widely at very low (2–3 g/m 2 ) or relatively high ash fall densities (60–200 g/m 2 ), extinction coefficients near the vent are less varied when compared to the mass of ash emitted. To better interpret these scattered relations in the lower atmosphere, lidar observations combined with radar reflectivity analysis [7] or particle size information from disdrometers [18] should prove useful.

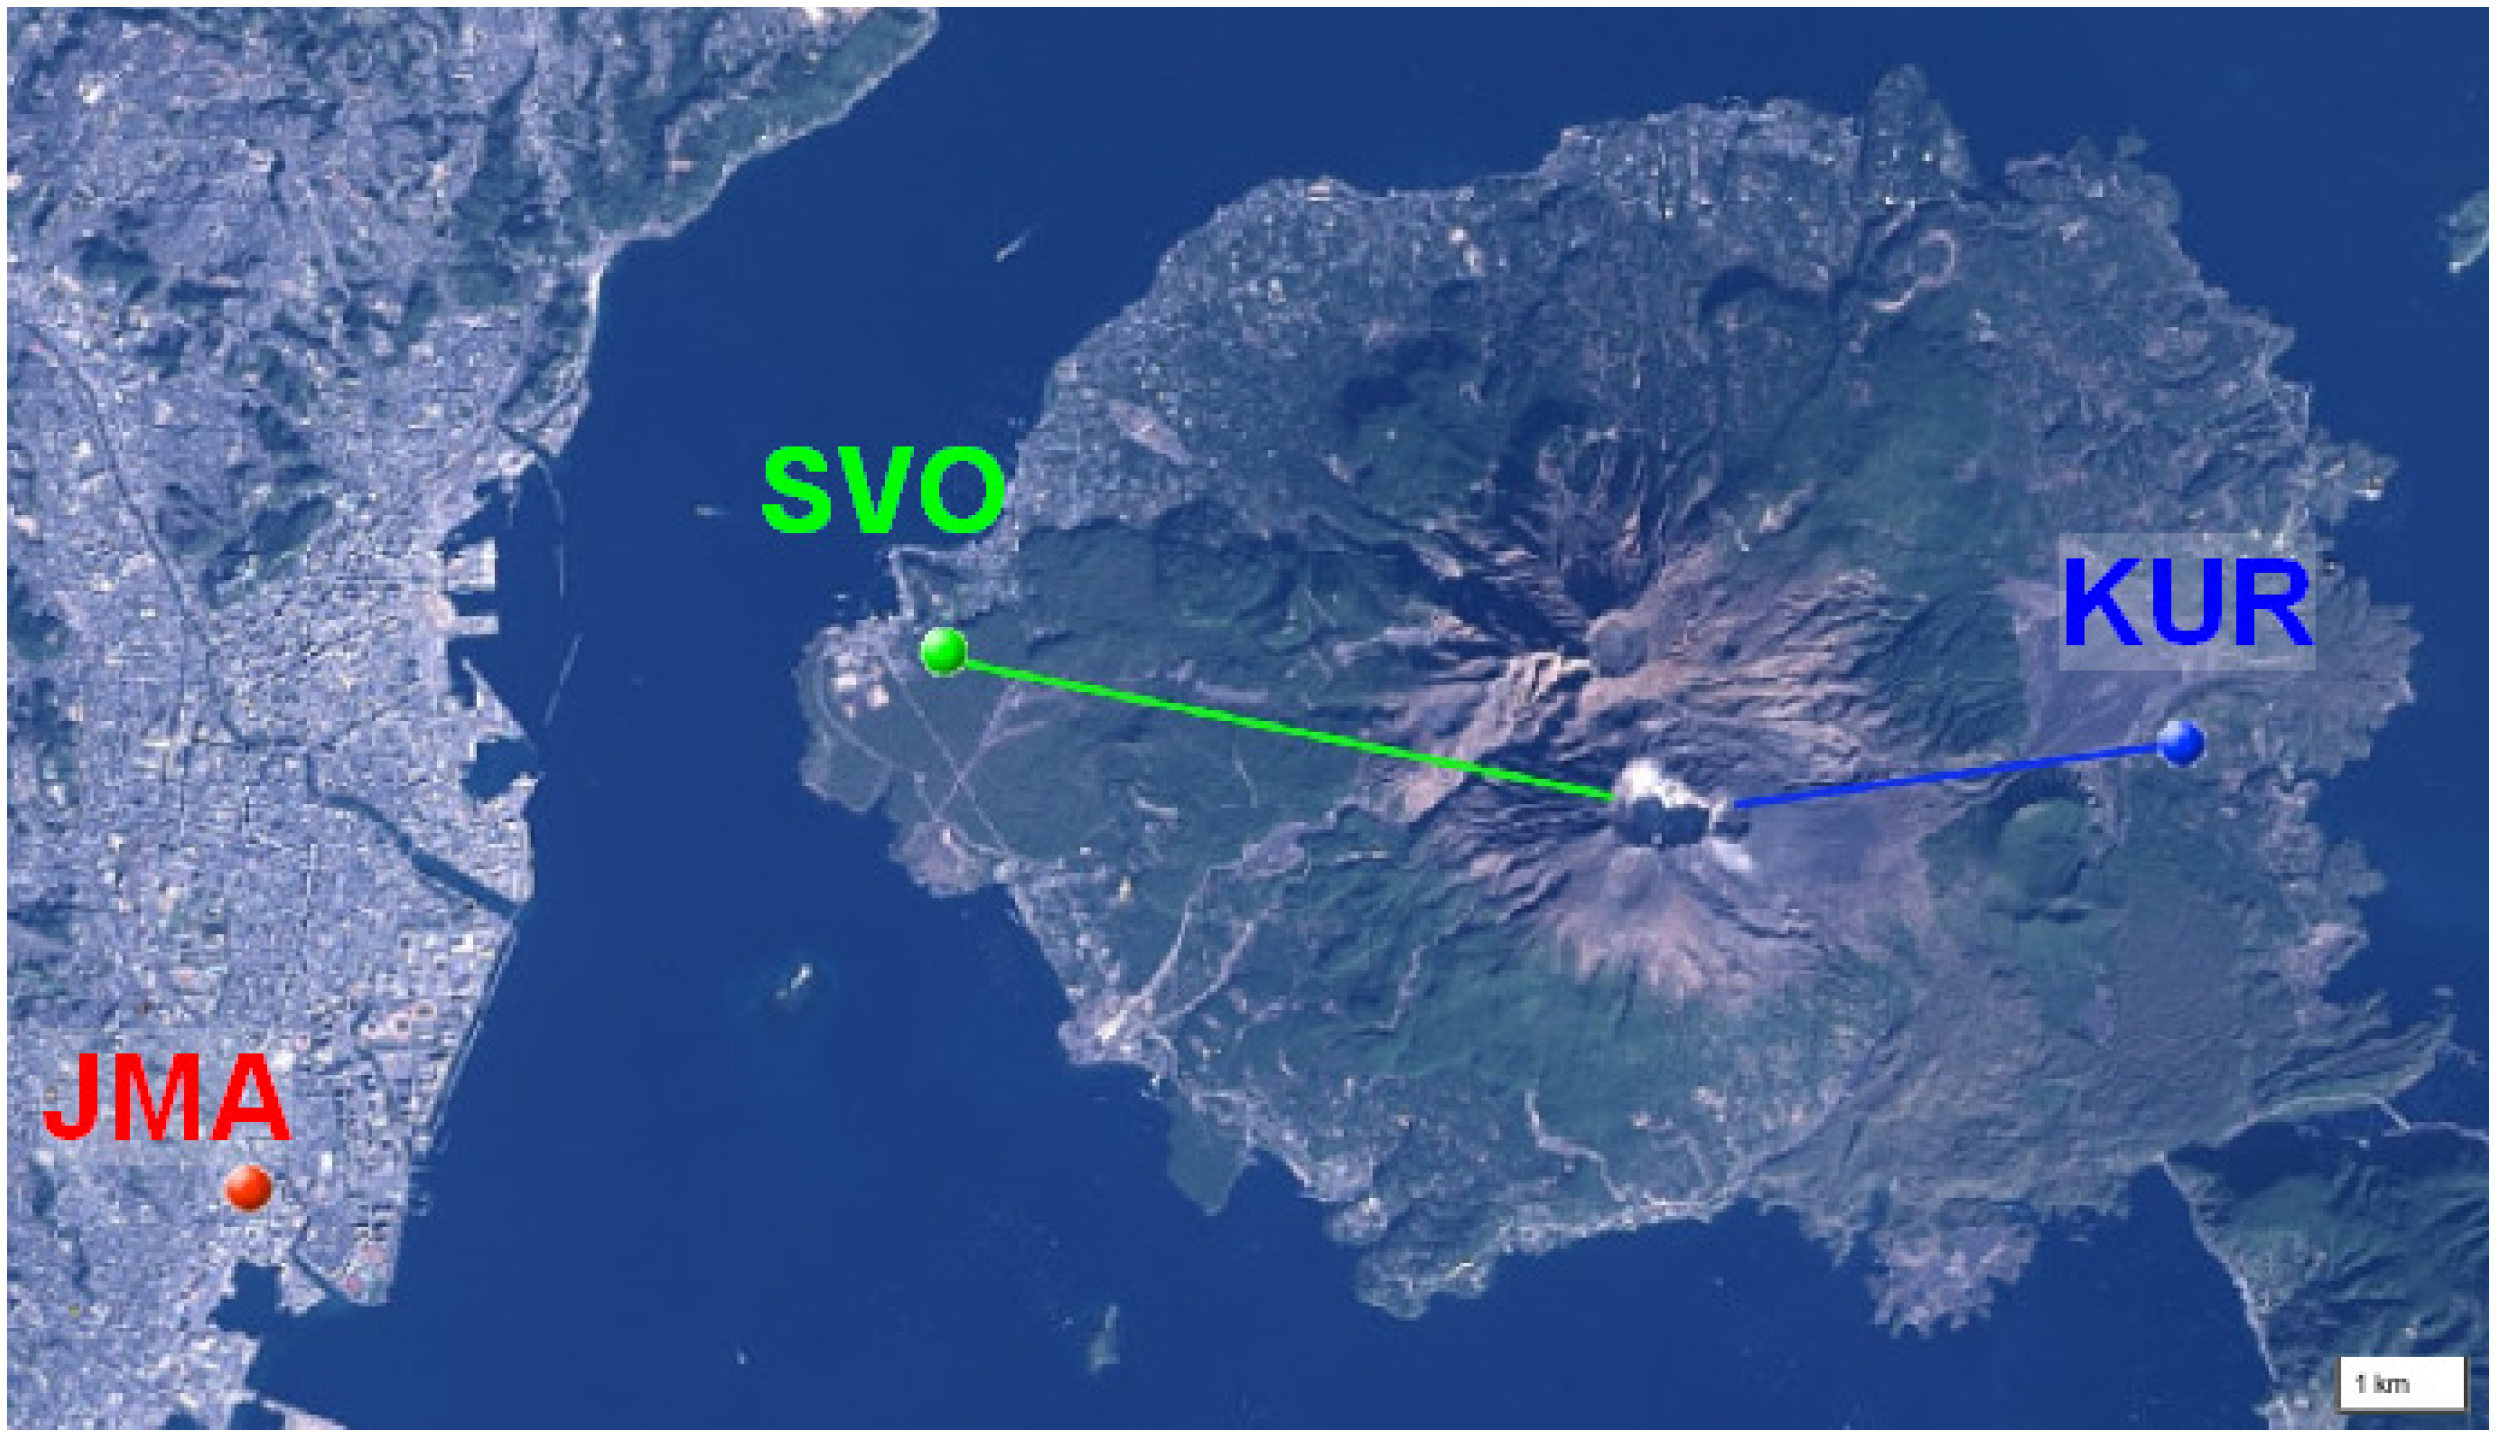
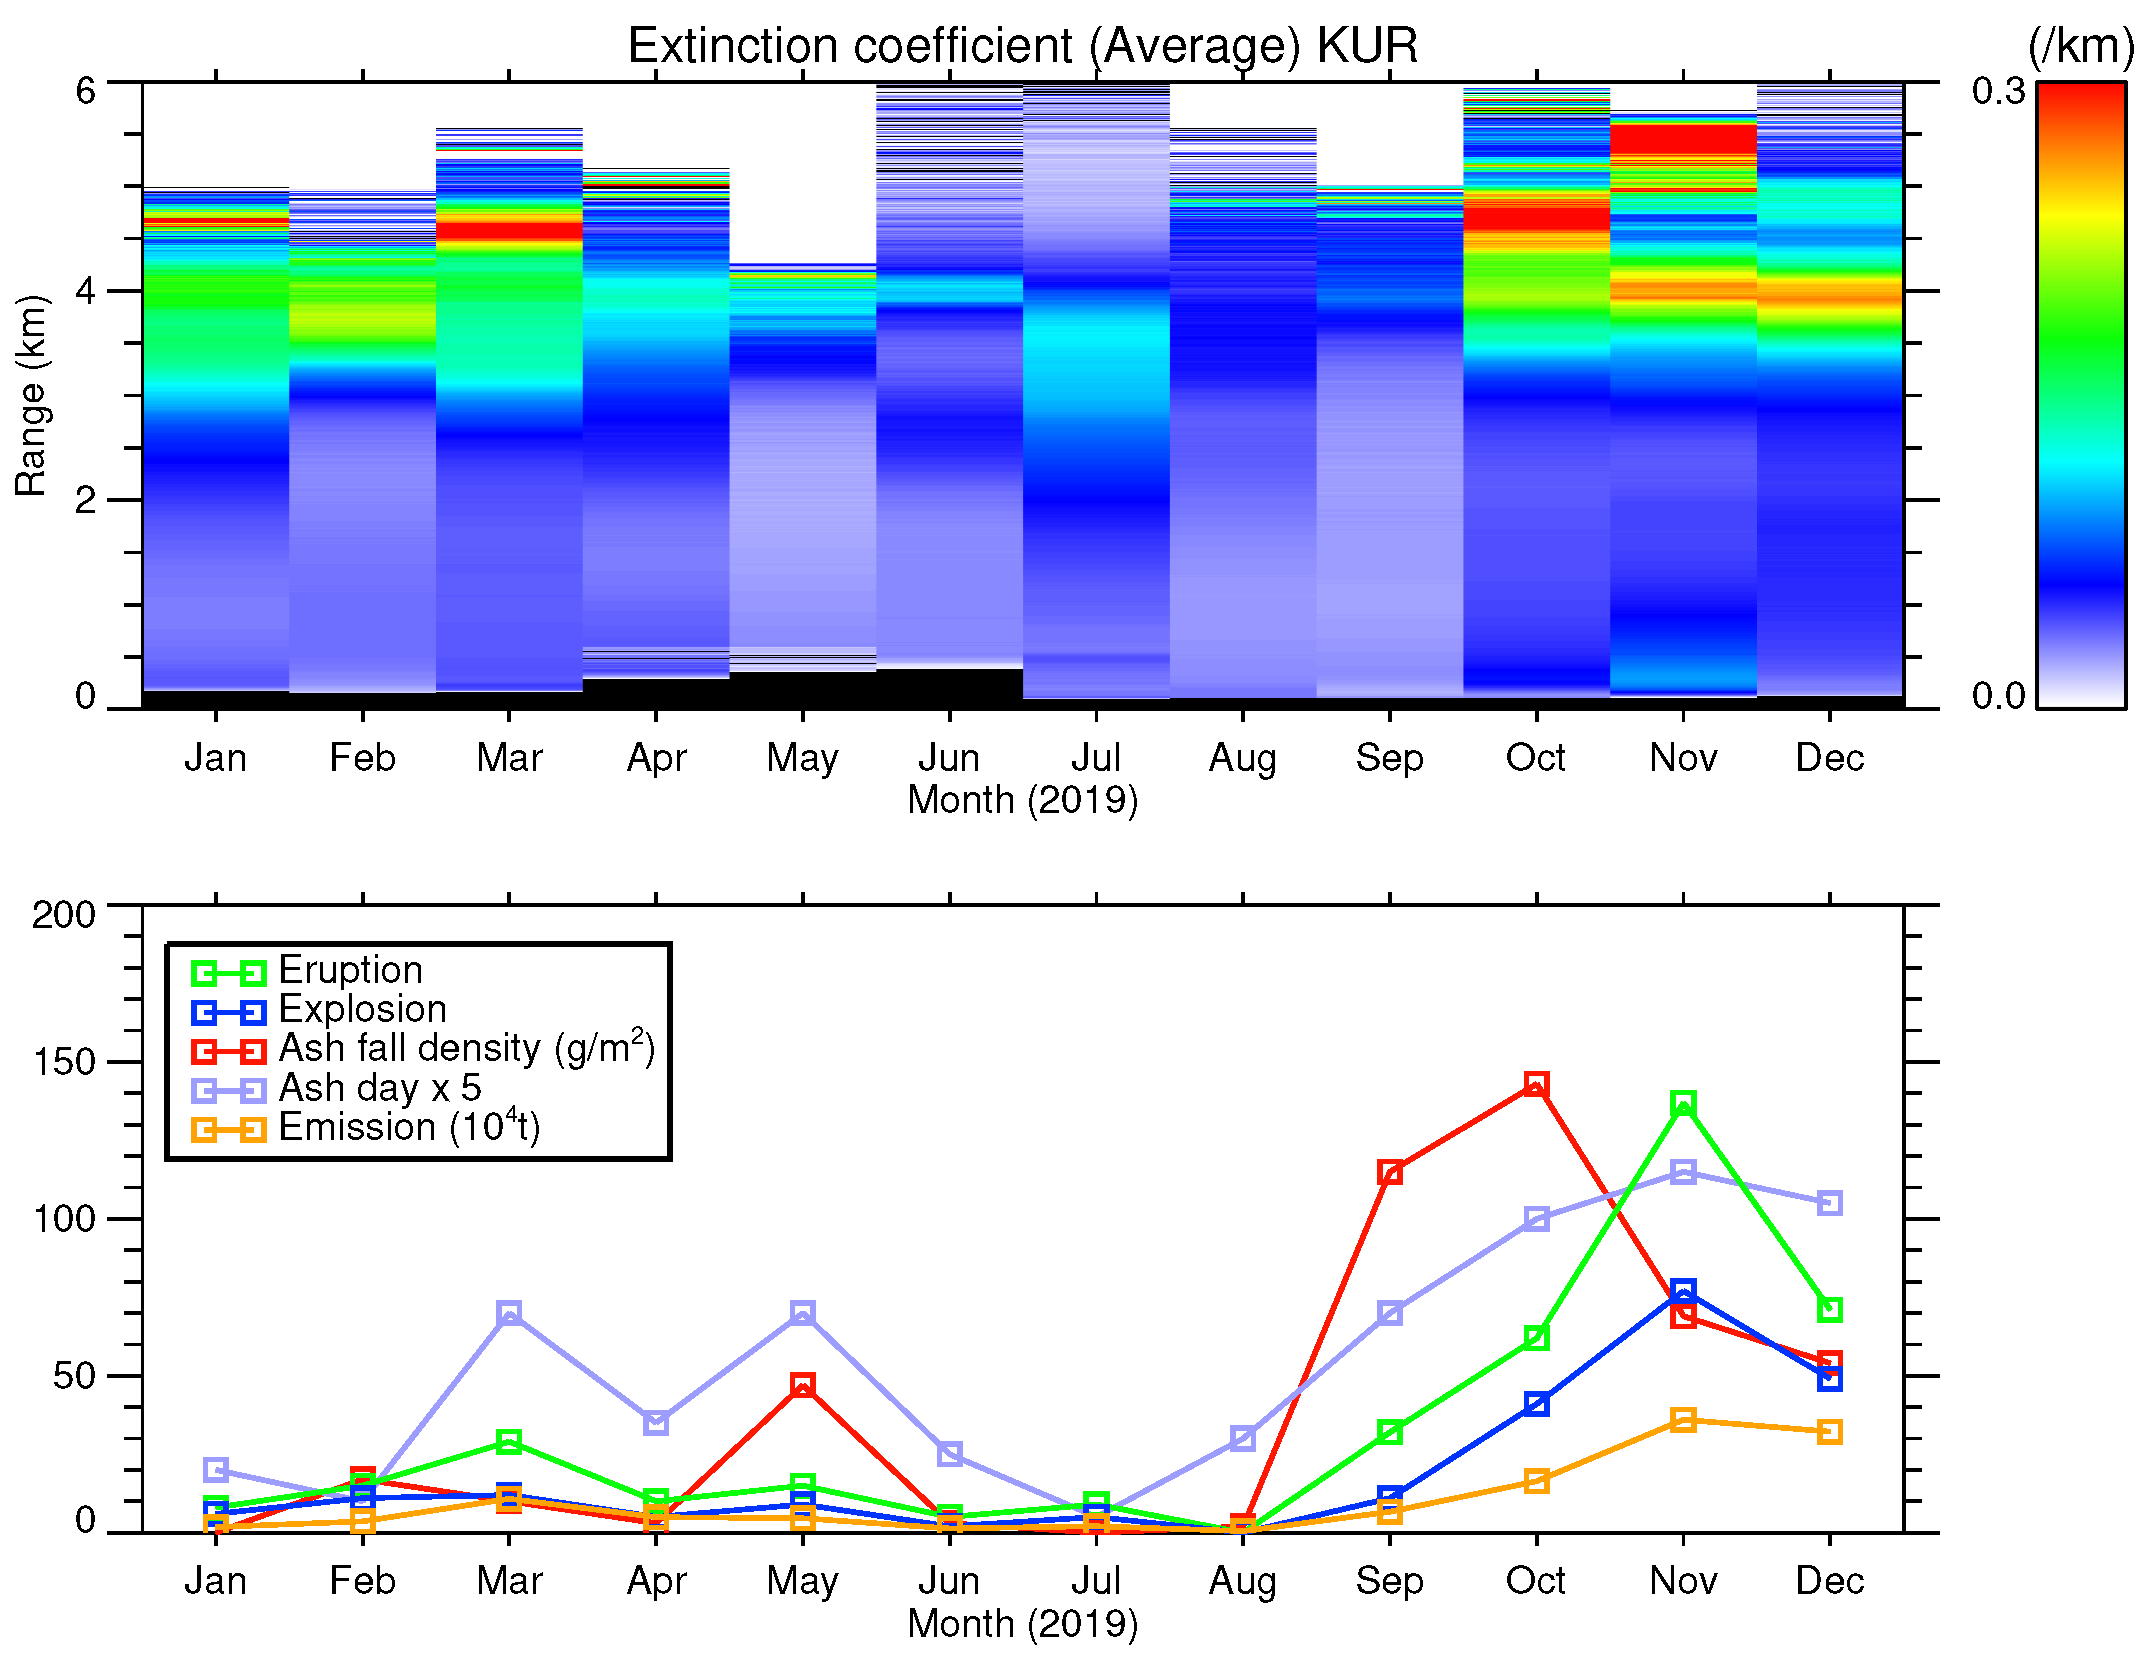
3.2. Comparison of SVO and KUR Lidars, Relation with Surface wind Direction

Because the KUR lidar was deployed on the opposite side of Sakurajima from the SVO lidar (Figure 1), it is useful for comparing the transport path of small particles in other directions. However, the operational hours of the KUR lidar were limited in 2017 and 2018, so only results from 2019 (Figure 7) can be compared to those from the SVO lidar. In contrast to the seasonal variation observed using the SVO lidar (Figure 5), higher extinction coefficients were detected near the vent (4.5 km range) during January–March and October–December. Extinction coefficients closer to the KUR lidar (0–3 km) were small throughout the year.
To interpret the different seasonal variations of the extinction coefficient detected by the two lidars, we analyzed the direction of surface winds at the Kagoshima observatory in 2019 (Figure 8). The dominant wind direction was northwesterly in colder seasons and easterly in the summer. Because the two lidars were deployed at down-wind regions to the west (SVO) and east (KUR) of the vent, the zonal wind direction is important to the transport of volcanic ash aerosols from the vent to the lidars. Easterly winds did not occur during January–April and November–December in 2019, and the extinction coefficients within 4 km of the SVO lidar were small during those periods (Figure 5). In contrast, extinction coefficients near the SVO lidar were notably elevated during May–October, when easterly winds dominated. Thus, the horizontal wind direction is one of the factors controlling aerosol loading below the altitude of the vent around Sakurajima.

4. Concluding Remarks

We analyzed monthly mean extinction coefficient profiles obtained from the SVO and KUR lidars deployed around Sakurajima. Annual variations of the extinction coefficient near the vent partly corresponded to the number of eruptions that occurred during 2017–2019. However, the horizontal wind direction strongly affects the extinction coefficient near the lidar, namely within 4 km. Indeed, seasonal variations observed using the KUR lidar, deployed on the opposite side of the vent from SVO, were very different from those observed at SVO, reflecting seasonal variations in the horizontal wind direction. Differences between the peaks in the extinction coefficient near the SVO lidar and the density of ash fall at Kagoshima observatory imply differences in the size distribution of ash particles erupted during the study period. The results of our analysis of the optical properties of transported particulates around Sakurajima could be combined with estimates of the amount of tephra emitted during each eruption to simulate the advection and sedimentation of aerosols by using the transport model of Poulidis et al. [19]. Extinction coefficients observed by lidar can thus be used to validate such future numerical modeling results.

Author Contributions

Conceptualization, A.S.; Lidar operation, H.N.; Project Administration, M.I.; Data curation, M.I., H.N. and A.S.; and Data analysis and writing, A.S. All authors have read and agreed to the published version of the manuscript.

Funding

This research was funded by the Integrated Program for Next Generation Volcano Research and Human Resource Management, funded by the Japan Ministry of Education, Culture, Sports, Science and Technology (MEXT).

Institutional Review Board Statement

Not applicable.

Informed Consent Statement

Not applicable.

Data Availability Statement

The data presented in this study are available upon request from the corresponding author.

Conflicts of Interest

The authors declare no conflict of interest.

References

  1. Hayashida-Amano, S.; Sasano, Y.; Iikura, Y. Volcanic disturbances in the stratospheric aerosol layer over Tsukuba, Japan, observed by the National Institute for Environmental Studies lidar from 1982 through 1986. J. Geophys. Res. Atmos. 1991, 96, 15469–15478. [Google Scholar] [CrossRef]
  2. Ansmann, A.; Tesche, M.; Groß, S.; Freudenthaler, V.; Seifert, P.; Hiebsch, A.; Schmidt, J.; Wandinger, U.; Mattis, I.; Müller, D.; et al. The 16 April 2010 major volcanic ash plume over central Europe: EARLINET lidar and AERONET photometer observations at Leipzig and Munich, Germany. Geophys. Res. Lett. 2010, 37. [Google Scholar] [CrossRef] [Green Version]
  3. Marenco, F.; Johnson, B.; Turnbull, K.; Newman, S.; Haywood, J.; Webster, H.; Ricketts, H. Airborne lidar observations of the 2010 Eyjafjallajökull volcanic ash plume. J. Geophys. Res. Atmos. 2011, 116. [Google Scholar] [CrossRef]
  4. Newman, S.M.; Clarisse, L.; Hurtmans, D.; Marenco, F.; Johnson, B.; Turnbull, K.; Havemann, S.; Baran, A.J.; O’Sullivan, D.; Haywood, J. A case study of observations of volcanic ash from the Eyjafjallajökull eruption: 2. Airborne and satellite radiative measurements. J. Geophys. Res. Atmos. 2012, 117. [Google Scholar] [CrossRef] [Green Version]
  5. Kagawa, M.; Ishizaka, Y. Conversion of SO2 to Particulate Sulfate during Transport from China to Japan—Assessment by Selenium in Aerosols. Aerosol Air Qual. Res. 2014, 14, 269–279. [Google Scholar] [CrossRef] [Green Version]
  6. Bessho, K.; Date, K.; Hayashi, M.; Ikeda, A.; Imai, T.; Inoue, H.; Kumagai, Y.; Miyakawa, T.; Murata, H.; Ohno, T.; et al. An Introduction to Himawari-8/9–; Japan’s New-Generation Geostationary Meteorological Satellites. J. Meteorol. Soc. Japan. Ser. II 2016, 94, 151–183. [Google Scholar] [CrossRef] [Green Version]
  7. Maki, M.; Iguchi, M.; Maesaka, T.; Miwa, T.; Tanada, T.; Kozono, T.; Momotani, T.; Yamaji, A.; Kakimoto, I. Preliminary Results of Weather Radar Observations of Sakurajima Volcanic Smoke. J. Disaster Res. 2016, 11, 15–30. [Google Scholar] [CrossRef]
  8. Kamei, A.; Sugimoto, N.; Matsui, I.; Shimizu, A.; Shibata, T. Volcanic Aerosol Layer Observed by Shipboard Lidar over the Tropical Western Pacific. SOLA 2006, 2, 1–4. [Google Scholar] [CrossRef] [Green Version]
  9. Sawamura, P.; Vernier, J.P.; Barnes, J.E.; Berkoff, T.A.; Welton, E.J.; Alados-Arboledas, L.; Navas-Guzmán, F.; Pappalardo, G.; Mona, L.; Madonna, F.; et al. Stratospheric AOD after the 2011 eruption of Nabro volcano measured by lidars over the Northern Hemisphere. Environ. Res. Lett. 2012, 7, 034013. [Google Scholar] [CrossRef] [Green Version]
  10. Mona, L.; Marenco, F. Chapter 9—Lidar Observations of Volcanic Particles. In Volcanic Ash; Mackie, S., Cashman, K., Ricketts, H., Rust, A., Watson, M., Eds.; Elsevier: Amsterdam, The Netherlands, 2016; pp. 161–173. [Google Scholar] [CrossRef]
  11. Boselli, A.; Scollo, S.; Leto, G.; Sanchez, R.Z.; Sannino, A.; Wang, X.; Coltelli, M.; Spinelli, N. First Volcanic Plume Measurements by an Elastic/Raman Lidar Close to the Etna Summit Craters. Front. Earth Sci. 2018, 6, 125. [Google Scholar] [CrossRef]
  12. Shimizu, A.; Nishizawa, T.; Jin, Y.; Kim, S.W.; Wang, Z.; Batdorj, D.; Sugimoto, N. Evolution of a Lidar Network for Tropospheric Aerosol Detection in East Asia. Opt. Eng. 2016, 56, 03129. [Google Scholar] [CrossRef]
  13. Fernald, F.G. Analysis of Atmospheric Lidar Observations: Some Comments. Appl. Opt. 1984, 23, 652–653. [Google Scholar] [CrossRef] [PubMed]
  14. Miwa, T.; Toramaru, A. Conduit process in vulcanian eruptions at Sakurajima volcano, Japan: Inference from comparison of volcanic ash with pressure wave and seismic data. Bull. Volcanol. 2013, 75, 685. [Google Scholar] [CrossRef]
  15. Japan Meteorological Agency. Available online: http://www.data.jma.go.jp/svd/vois/data/tokyo/STOCK/monthly_v-act_doc/monthly_vact_vol.php?id=506 (accessed on 25 January 2021). (In Japanese)
  16. Kagoshima Prefecture. Available online: http://www.pref.kagoshima.jp/aj01/bosai/sonae/sakurajima/sakurajimakouhairyou2.html (accessed on 28 January 2021). (In Japanese)
  17. Okamoto, H.; Iwasaki, S.; Yasui, M.; Horie, H.; Kuroiwa, H.; Kumagai, H. An algorithm for retrieval of cloud microphysics using 95-GHz cloud radar and lidar. J. Geophys. Res. Atmos. 2003, 108. [Google Scholar] [CrossRef]
  18. Kozono, T.; Iguchi, M.; Miwa, T.; Maki, M.; Maesaka, T.; Miki, D. Characteristics of tephra fall from eruptions at Sakurajima volcano, revealed by optical disdrometer measurements. Bull. Volcanol. 2019, 81, 41. [Google Scholar] [CrossRef]
  19. Poulidis, A.P.; Shimizu, A.; Nakamichi, H.; Iguchi, M. A Computational Methodology for the Calibration of Tephra Transport Nowcasting at Sakurajima Volcano, Japan. Atmosphere 2021, 12, 104. [Google Scholar] [CrossRef]
Figure 1. Lidar instruments installed at SVO (green) and KUR (blue). Lines indicate their lines of sight, and the Kagoshima observatory is shown for reference (red). The satellite image was obtained from the Geospatial Information Authority of Japan (https://maps.gsi.go.jp/vector/, accessed on 25 January 2021).
Atmosphere 12 00326 g001
Figure 2. Time-range plots of backscatter intensity (arbitrary units, A.U.) observed by the SVO lidar during 07:00–08:00 JST on 16 June 2018 at: 532 nm (top); depolarization ratio at 532 nm (middle); and backscatter intensity at 1064 nm (bottom). The vertical axes correspond to the distance along the line of sight from the lidar equipment to the vent.
Atmosphere 12 00326 g002
Figure 3. Time-range plot of monthly averaged aerosol extinction coefficients at 532 nm detected by the SVO lidar in 2017 (top); and the monthly numbers of eruptions and explosions at Sakurajima, the density of ash fall on the ground, the number of confirmed ash fall days at the Kagoshima observatory, and the estimated mass of ash erupted (bottom). The number of confirmed ash fall days is rescaled by a factor of 5 to facilitate comparison.
Atmosphere 12 00326 g003
Figure 4. Time-range plot of aerosol extinction coefficients (top, SVO lidar, 532 nm) and eruptive activity at Sakurajima in 2018 (bottom, see Figure 3 for details). Ash fall density and the number of ash fall days are rescaled by factors of 0.2 and 5, respectively.
Atmosphere 12 00326 g004
Figure 5. Time-range plot of aerosol extinction coefficients (top, SVO lidar, 532 nm) and eruptive activity at Sakurajima in 2019 (bottom, see Figure 3 for details). The number of ash fall days is rescaled by a factor of 5.
Atmosphere 12 00326 g005
Figure 6. Scatter diagrams between the monthly means of: (left) the integrated extinction coefficient within 0.24–2 km of the lidar and ash fall density at JMA’s Kagoshima observatory; and (right) the integrated extinction coefficient within 4.5–6 km of the lidar and estimated mass of ash emitted.
Atmosphere 12 00326 g006
Figure 7. Time-range plot of aerosol extinction coefficients (top, determined by the KUR lidar, 532 nm) and eruptive activity at Sakurajima in 2019 (bottom, see Figure 3 for details). The number of ash fall days is rescaled by a factor of 5.
Atmosphere 12 00326 g007
Figure 8. Monthly distributions of the dominant hourly wind direction at JMA’s Kagoshima observatory in 2019.
Atmosphere 12 00326 g008
Publisher’s Note: MDPI stays neutral with regard to jurisdictional claims in published maps and institutional affiliations.

